1. Introduction
In China, problems concerning agriculture, rural areas, and farmers have restricted the country’s economic and social development for decades [
1,
2]. Rural settlements are places of habitation, production, and livelihood for farmers [
3,
4]; thus, optimizing the spatial layout of rural settlements is of great significance to solve the aforementioned three rural issues and promote rural development. However, due to the long-term urban–rural development strategy that emphasizes cities over rural areas, rural settlements have not been scientifically planned [
5]. Scattered and disorderly layouts with hollowed villages have become common phenomena in rural settlements in China [
6,
7,
8,
9,
10]. This has further hindered the equalization of basic public service infrastructure between urban and rural areas. To solve these problems, the Chinese government has introduced and implemented some strategic measures such as new rural construction, balanced urban and rural development, and new urbanization [
11,
12]. In 2018, China began to enter a new era of comprehensively promoting rural revitalization and integrated urban–rural development. Implementing these strategic measures requires improving the spatial layout of urban and rural settlements and promoting integrated urban–rural planning. These include strengthening the construction of farmers’ life circles that are centered on towns and promoting the interactive development of towns and villages. Therefore, identifying and optimizing the spatial layout of urban and rural settlements along with compiling a scientifically-sound and reasonable plan for urban and rural settlements is an important part of realizing rural revitalization and integrating urban–rural development.
Past research on the identification and optimization of the spatial layout of urban and rural settlements has mainly focused on three aspects, namely, the identification and optimization of the macro-scale spatial structure of settlements [
13,
14,
15,
16], the classification of development modes [
14,
16,
17,
18], and the optimization of the micro-scale land layout [
19,
20,
21,
22]. The present study focuses on the first aspect; that is, it identifies the spatial structure of urban and rural settlements and then constructs an optimized multi-level settlement system. Previous research on this aspect can be divided into two categories. The first category is mainly based on the capacity of the settlements for future development and the geographical spatial distance between settlements. The representative identification methods of this category include the cardinal neighbor gradient method and the local center method [
23,
24,
25]. The optimization method used with this category involves directly selecting central towns and villages based on an evaluation of the capacity for development, and dividing the spheres of influence of central towns and villages using a Voronoi diagram [
16,
26]. The second category is based on the spatial interaction between settlements. The identification method of this category involves constructing a spatial interaction network of settlements using a spatial interaction model or actual survey data, and then identifying the spatial structure of settlements based on the strength of spatial interaction between settlements [
27,
28,
29,
30,
31]. The optimization method involves selecting central towns and villages based on the network analysis method, and then determining their spheres of influence using a spatial interaction model or a Voronoi diagram [
15,
29,
32]. In summary, the former category is used to identify and optimize the spatial structure of settlements from a local perspective. It considers the attributes of settlements and the distance relationships between settlements. The latter category is more inclined to proceed from a global perspective. The research basis of this second category involves constructing a spatial interaction network between all settlements in the study area.
According to Christaller’s central place theory, the level of a central place is determined by the level of goods and services that it can provide. The higher the level of the central place, the larger the range of services. Low-level central places and their service areas are covered by the service areas of high-level central places, while the high-level central places and their service areas are covered by the service areas of even higher-level central places, thus forming a hierarchical and nested spatial network system. Therefore, the ideal spatial structure of urban and rural settlements should be hierarchical. Among the two aforementioned categories, the main identification methods of the first category include the cardinal neighbor gradient and the local center methods. These two methods are oriented to the attributes of the settlements themselves in the identification process, and thus the identified spatial structure of settlements has a significant hierarchy. However, this category does not consider the interaction between settlements from a global perspective, making it difficult to accurately estimate the importance of settlements in the spatial structure. Although the second category considers the spatial interaction between settlements from a global perspective, it ignores the realistic capacity for development of a central town or village that would allow it to radiate and drive other settlements. This makes it difficult to identify the hierarchy of the spatial structure of settlements, which is not conducive to the optimization of the spatial structure of settlements. Therefore, it is necessary to improve the previous methods to make the identification and optimization of the spatial structure of settlements more scientifically-sound, effective, and intuitive.
From a hierarchical network perspective, this study attempts to propose a method framework for identifying and optimizing the spatial structure of settlements that considers both the capacity for development of settlements and the spatial interaction between settlements. The specific aims of this study are: (1) to propose an identification method of the spatial structure of settlements from the hierarchical network perspective; (2) to propose a method framework of optimizing the spatial structure of settlements based on the identification method; and (3) to analyze the differences between the two identification methods, namely the strongest gravitational connection method (SGCM) commonly used in previous studies and the method proposed in this study.
The remainder of this paper is structured as follows.
Section 2 introduces the framework of the proposed method for the identification and optimization of the spatial structure of urban and rural settlements based on a hierarchical network perspective in detail. This includes the identification, analysis, and optimization of the hierarchical network structure of urban and rural settlements.
Section 3 takes Hua County, Henan Province, China, as an example to implement the framework of the proposed method and verify the scientific soundness and feasibility of the method.
Section 4 discusses the differences between the SGCM and the identification method proposed in this study, and proposes some relevant policy suggestions on the optimization of the spatial structure of urban and rural settlements.
Section 5 provides the conclusions drawn from this study.
2. Materials and Methods
2.1. Method Framework
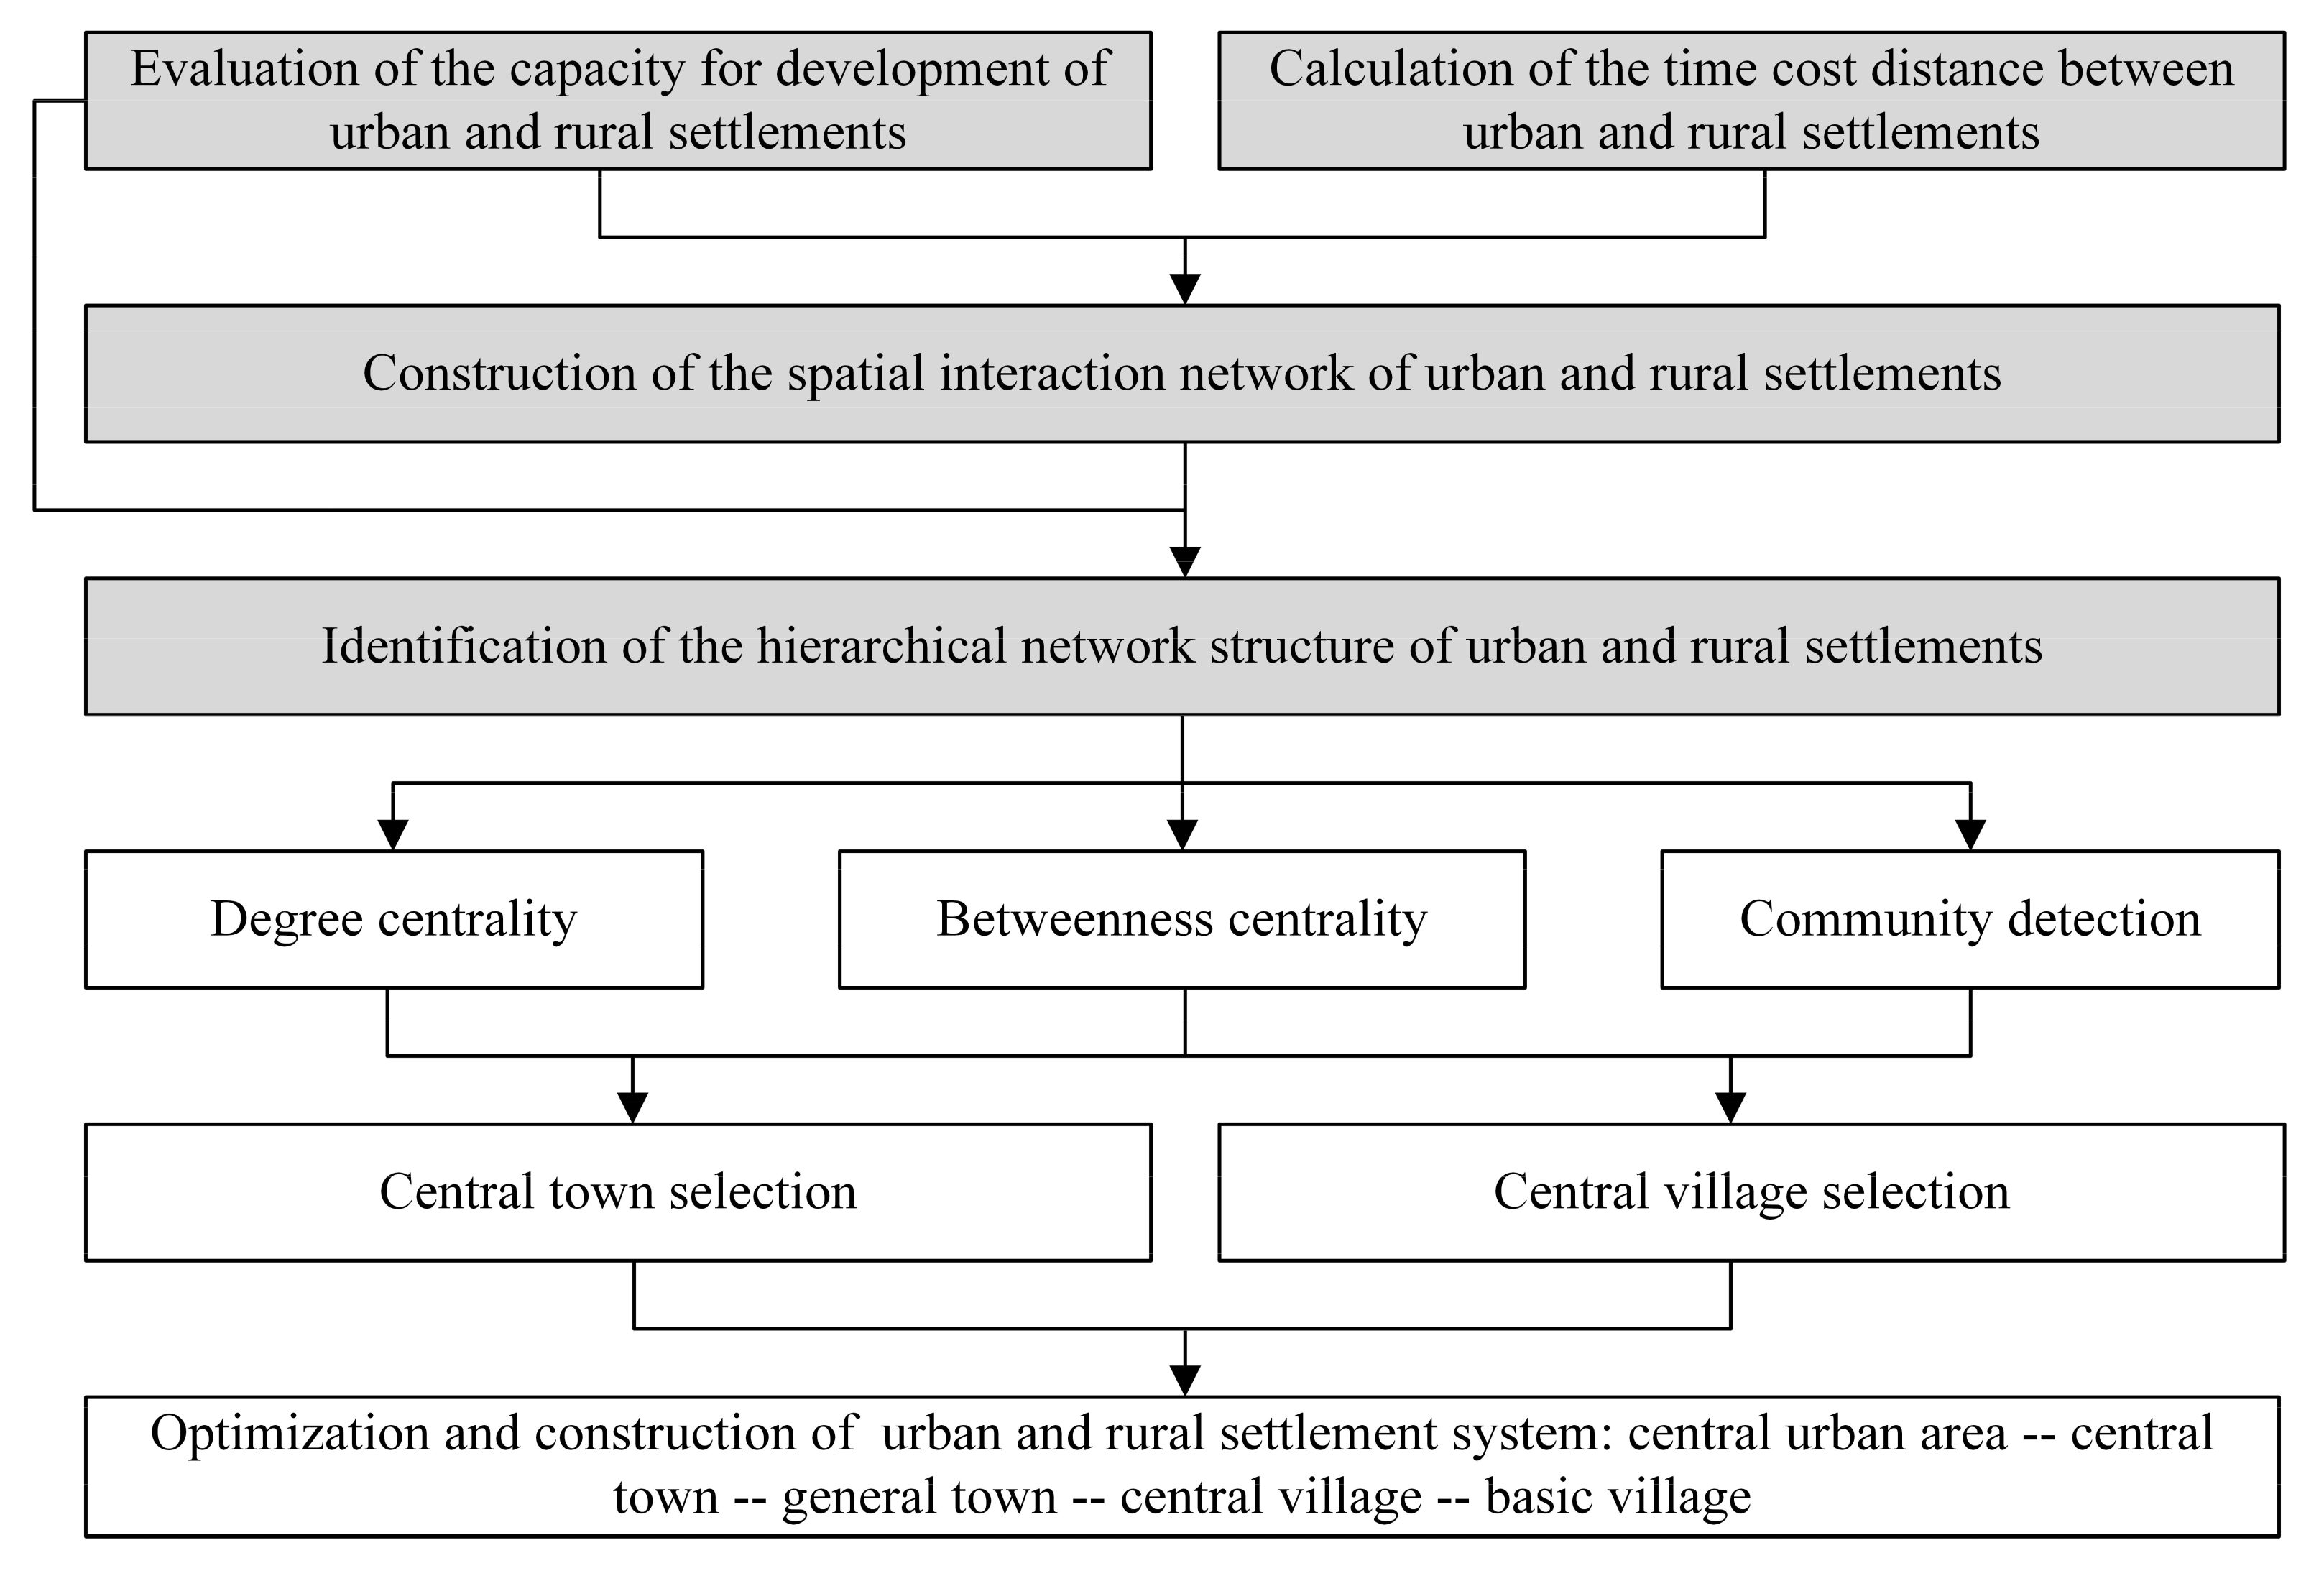
From the hierarchical network perspective, this paper proposes a method framework for the identification and optimization of the spatial structure of urban and rural settlements (
Figure 1). This framework includes three parts—namely, the identification, analysis, and optimization of the hierarchical network structure of these settlements. The first part is the basis of this study, where the spatial interaction network of these settlements is first constructed based on the gravity model; next, the hierarchical network structure of urban and rural settlements is identified by comprehensively considering the capacity for development and spatial interaction network of these settlements. The second part uses network analysis methods such as degree centrality, betweenness centrality, and community detection to analyze the structure of these settlements. The third part involves constructing an optimization system of urban and rural settlements based on the consideration of the hierarchical network, spatial coverage, and spatial equilibrium of settlements. This part focuses on the selection of central towns and villages.
2.2. Identifying the Hierarchical Network Structure of Urban and Rural Settlements
2.2.1. Constructing a Spatial Interaction Network of Urban and Rural Settlements
In this study, the construction of a spatial interaction network of urban and rural settlements based on a gravity model provides the basis for the identification of the spatial hierarchical network structure of these settlements. The realization of the gravity model is based on the capacity for development of settlements and the time cost distance between them. Therefore, the process of constructing the interaction network of settlements mainly includes three parts, namely, the evaluation of the capacity for development of settlements, the calculation of time cost distance, and the calculation of gravity between settlements.
Considering the characteristics of the study area and the availability of data, this study selected eight indicators from internal characteristics and external environment of settlements to construct an evaluation index system of the capacity for development of urban and rural settlements (
Table 1). Referring to previous studies [
26], a comprehensive evaluation method was employed to evaluate the capacity for development of urban and rural settlements. The formulas are given by:
where
is the standardized value of
,
is the value of index
j of settlement
i,
and
are the maximal and minimal values of index
j, respectively,
is the capacity for development of the settlement
i, and
is the weight of index
j.
- 2.
Calculating time cost distance
Time cost was employed to measure the shortest distance between settlements in the study area. Based on relevant standards and previous studies, travel speeds were determined based on the land use type (
Table 2). Then, the travel time costs were calculated based on the cost distance module of ArcGIS 10.5 (ESRI, Redlands, CA, USA), using a grid size of 5 × 5 m.
Gravity in this paper comes from the concept of gravity in physics and has been widely used in the study of spatial interaction [
33,
34,
35,
36,
37]. In this study, gravity is used to express the strength of spatial interaction among urban and rural settlements. Gravity is directly proportional to mass and inversely proportional to distance. This study used the capacity for development of urban and rural settlements to replace the mass of urban and rural settlements; it also used the time cost to represent the shortest distance between settlements. The formula is:
where
is the strength of spatial interaction between settlements
i and
j,
and
are the capacity for development of settlements
i and
j, respectively, and
is the time cost distance between settlements
i and
j.
2.2.2. Principles and Process of Identifying the Hierarchical Network Structure of Urban and Rural Settlements
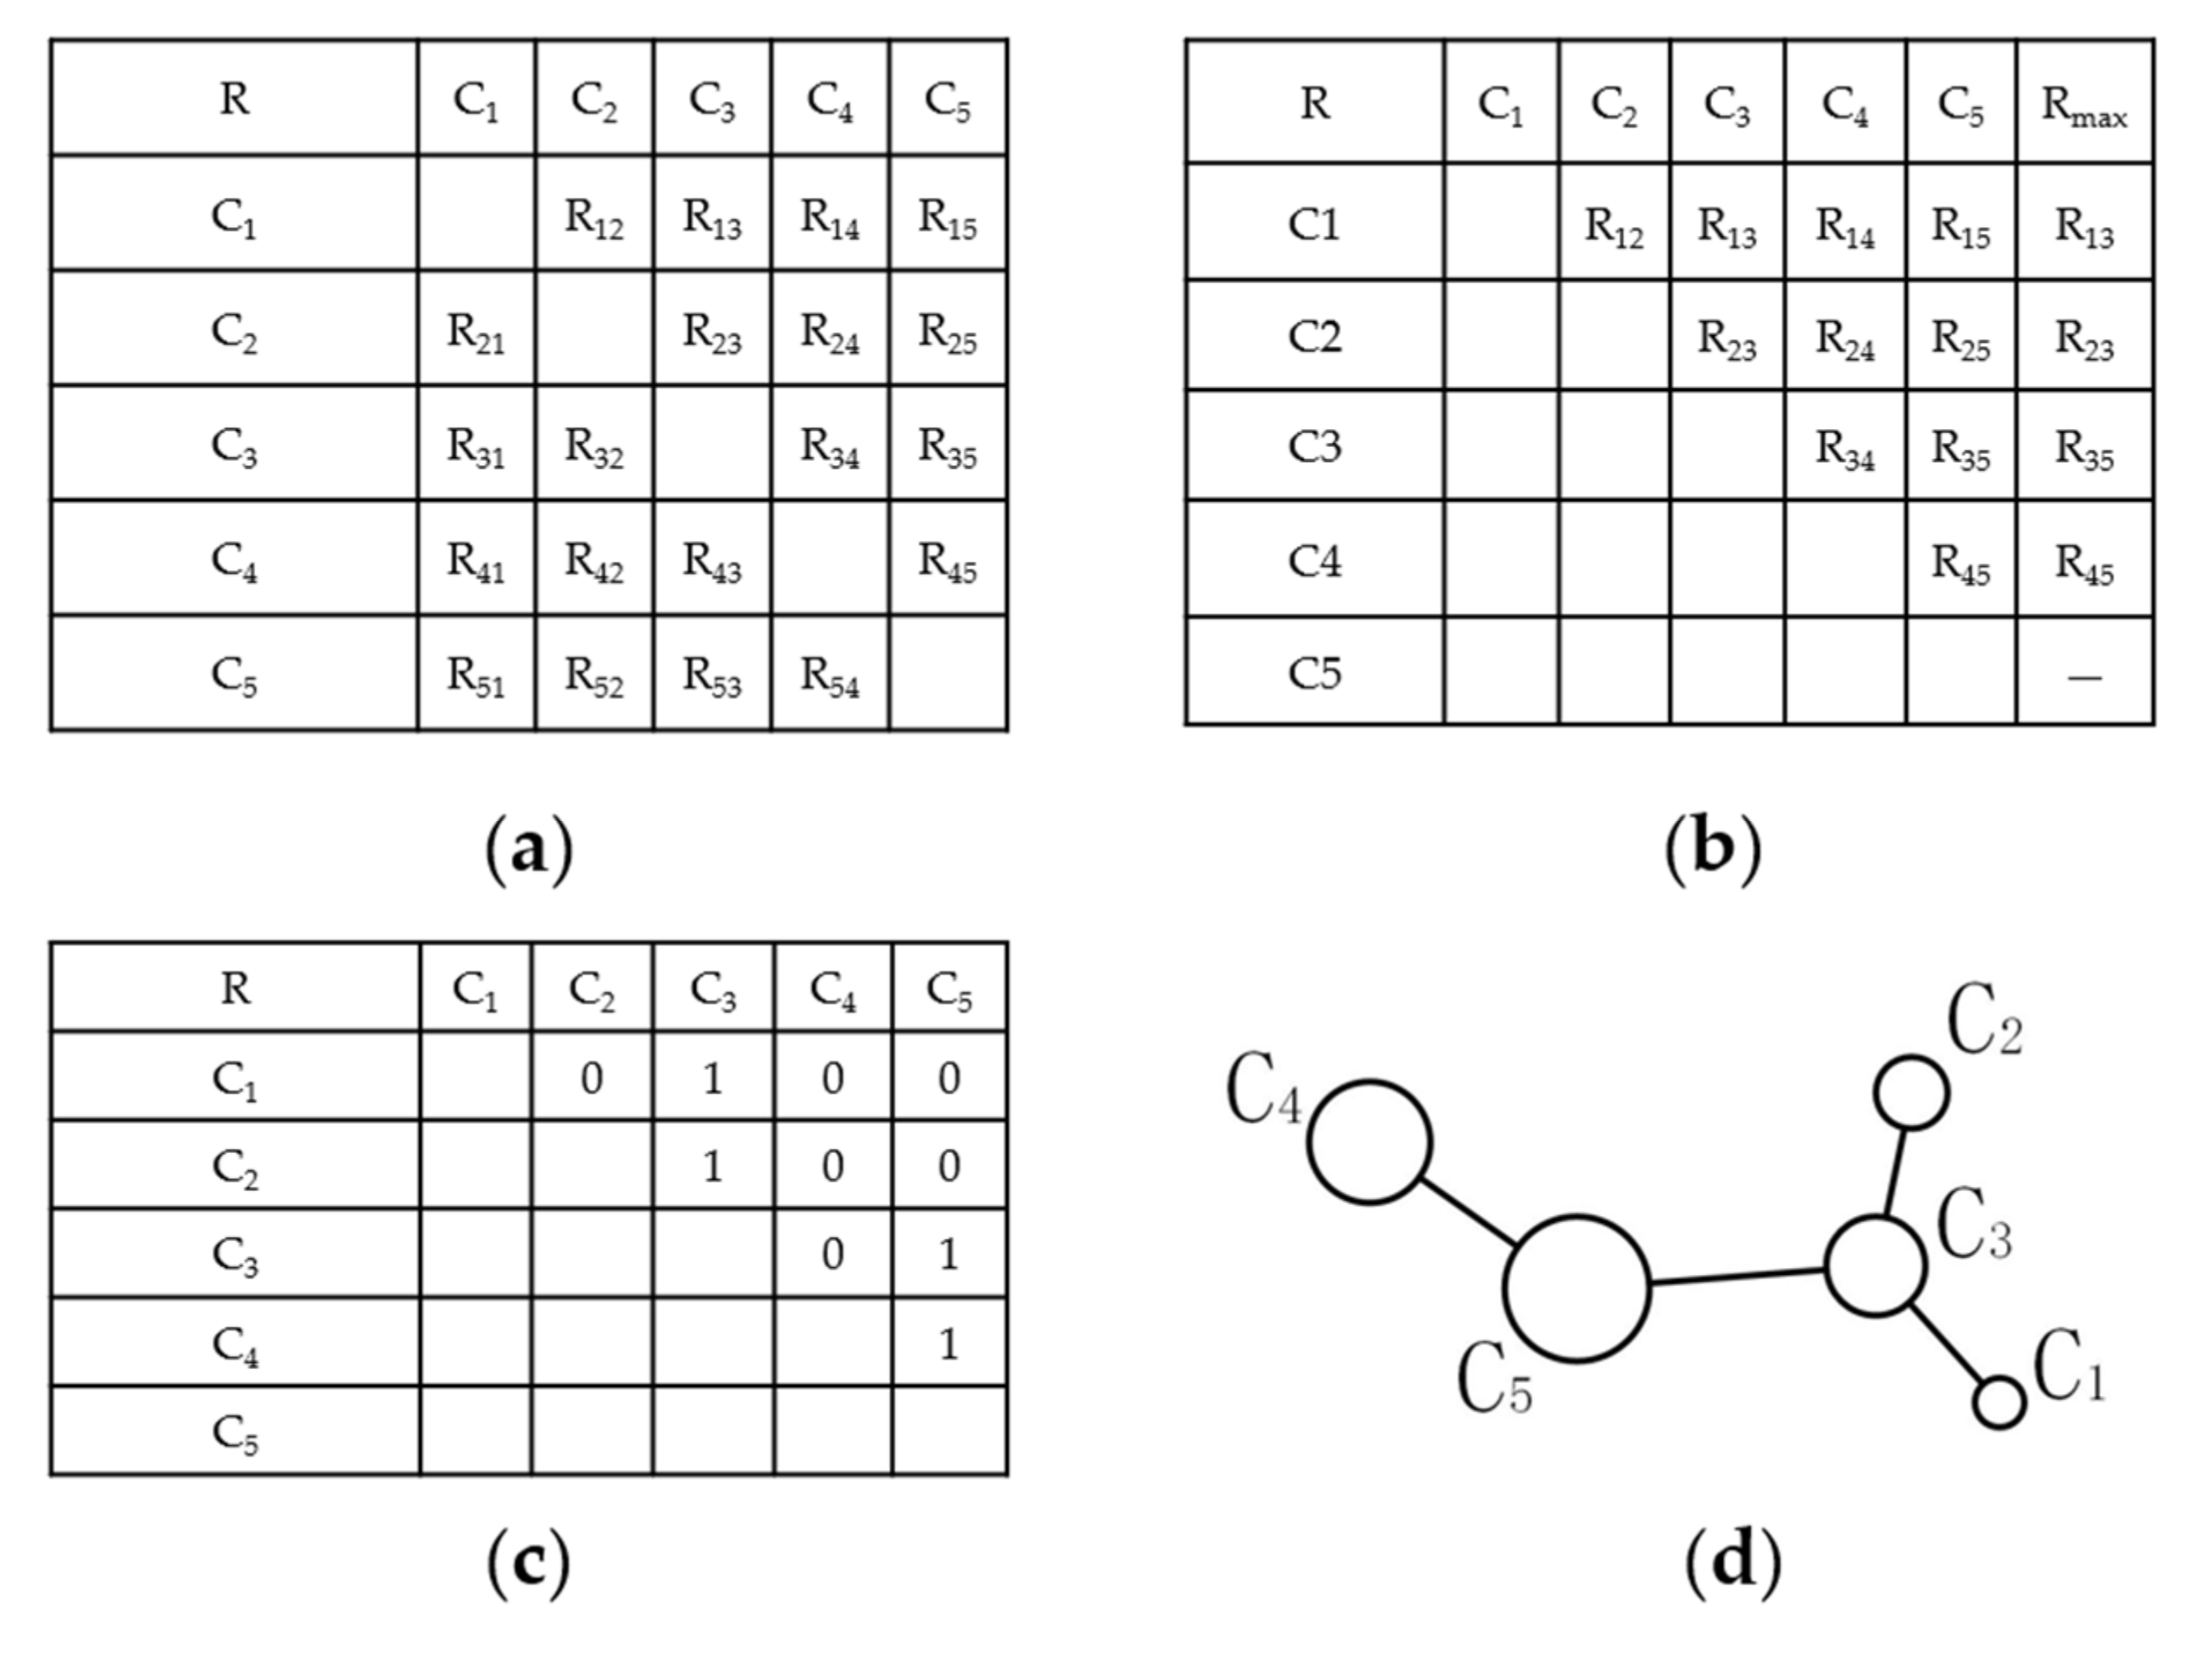
In general, the larger the scale of a settlement and the stronger its capability for development, the stronger the ability of the settlement to provide goods and services. When some goods and services are not available in local settlements, residents will travel to other nearby settlements to find them. The settlements that can provide these goods and services are often larger in scale, stronger in terms of their capacity for development, and have the greatest attraction to the residents. Then, the local settlements are likely to interact with these larger settlements nearby. Based on the above ideas, for each settlement, this study finds and retains its strongest interaction with other settlements which have a stronger capacity for development; then, the hierarchical network structure of settlements can be identified. Unlike previous methods, this method takes into account both the capacity for development of settlements and the spatial interaction between settlements. The specific identification process is as follows.
- (1)
The
n settlements in the study area were ranked from weak to strong according to their capacity for development. The settlements with the weakest and strongest capacities for development were recorded as
C1 and
Cn, respectively. The spatial interaction matrix
R was obtained by measuring the strength of spatial interaction between settlements(
Figure 2a);
- (2)
In the matrix R, the strength of spatial interaction between settlement Ci and settlement Cj with a stronger capacity for development was retained; then the spatial interaction matrix was obtained;
- (3)
The maximum value of each row in the spatial interaction matrix
was identified and retained row by row (
Figure 2b). Then its corresponding matrix unit was set to 1 and the other units were set to 0 to generate the 0–1 matrix (
Figure 2c). Finally, the identified hierarchical network structure of settlements was obtained (
Figure 2d).
2.3. Analyzing the Hierarchical Network Structure of Urban and Rural Settlements
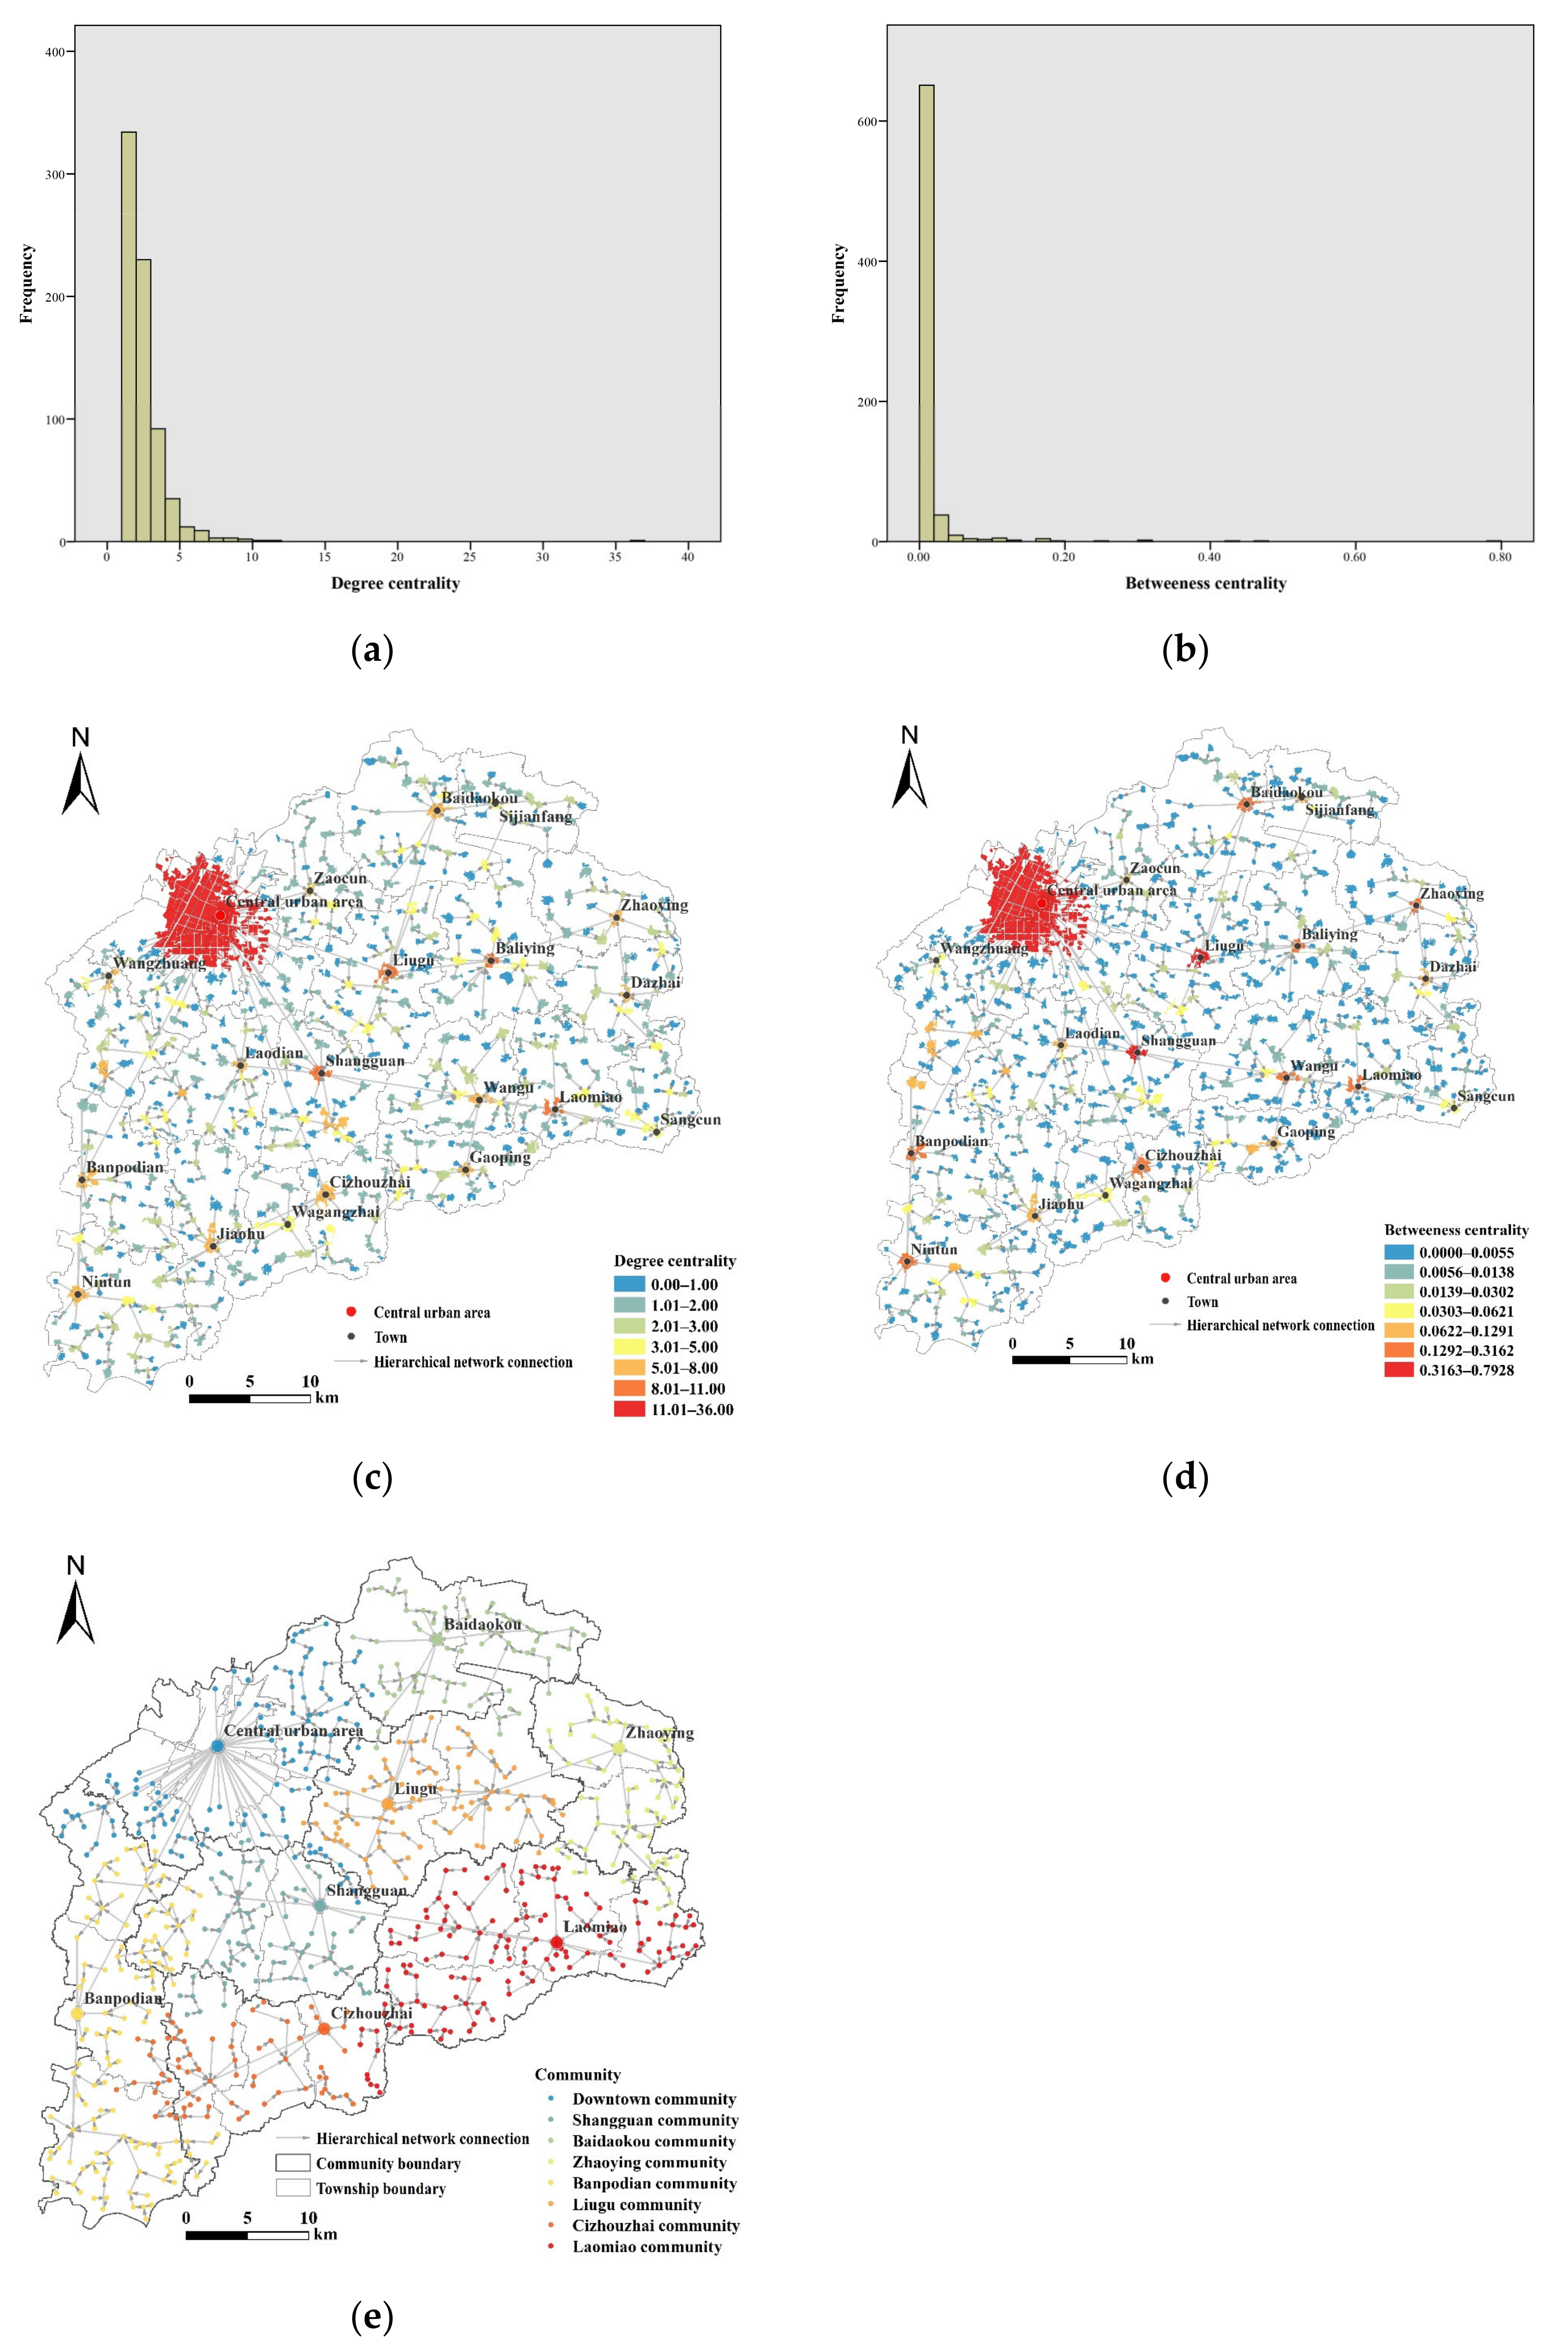
The network analysis indicators and methods—such as degree centrality, betweenness centrality, and community detection—were used to analyze the centrality, hierarchy, and community characteristics of the identified spatial hierarchical network. This provided a basis for the optimization of the spatial structure of urban and rural settlements in the next step.
Degree centrality refers to the number of nodes directly connected to a node and reflects the importance of the node in the network [
38,
39,
40]. This study used degree centrality to measure the importance and centrality of urban and rural settlements in their spatial network structure. In the hierarchical network structure identified in this study, the higher the degree centrality of a settlement, the more important the settlement is, and the more likely it is to become a local center in the network. The formula is
where
is the degree centrality of settlement
i,
represents the connection value of settlements
i and
j, which equals 1 when
i and
j are connected and 0 when they are not, and
n is the number of settlements in the network.
Betweenness centrality refers to the frequency of the shortest paths that pass through a node, reflecting the intermediary and control role of the node in the network [
41,
42,
43]. In this study, the betweenness centrality was used to measure the intermediary importance of settlements in a network. In the hierarchical network identified in this study, a settlement with higher betweenness centrality has stronger control over other settlements and is more likely to become a high-level center. The difference in betweenness centrality among settlements reflects the hierarchical characteristics of the spatial network structure to a certain extent. The formula is
where
is the betweenness centrality of settlement
i,
indicates the total number of shortest paths between settlements
s and
t, and
is the number of those paths which pass through settlement
i.
Community detection refers to the process of dividing a network into closely connected sub-networks (communities) based on the connections between nodes, which is mainly used to reflect the local aggregation characteristics of the network. The nodes within a community are closely connected, and the connections between communities are loose [
44,
45]. Because the spatial network structure identified in this paper has a significant hierarchy, its community structure characteristics are also obvious. Therefore, complex algorithms are not needed because the community structure in the hierarchical network can be detected and identified directly by manual methods.
2.4. Optimizing the Hierarchical Network Structure of Urban and Rural Settlements
The main goal of optimizing the hierarchical network structure of urban and rural settlements is the construction of a five-level system consisting of central urban areas, central towns, general towns, central villages, and basic villages. In this system, the higher the level of a settlement, the more types of goods and services it provides, and the greater the sphere of influence. A central urban area, as the social and economic center of a county, is the highest-level settlement in the system. This type of center provides a high-level of services for all settlements in the county and provides support for the development of central towns. As the second-level settlements, central towns mainly provide sub-high-level services to all settlements within their spheres of influence and play a radiating and driving role for the surrounding general towns. General towns are the third-level settlements, which provide services for the settlements within their administrative scopes and provide support for the development of the surrounding central villages. As fourth-level settlements, central villages provide ordinary services to the surrounding basic villages.
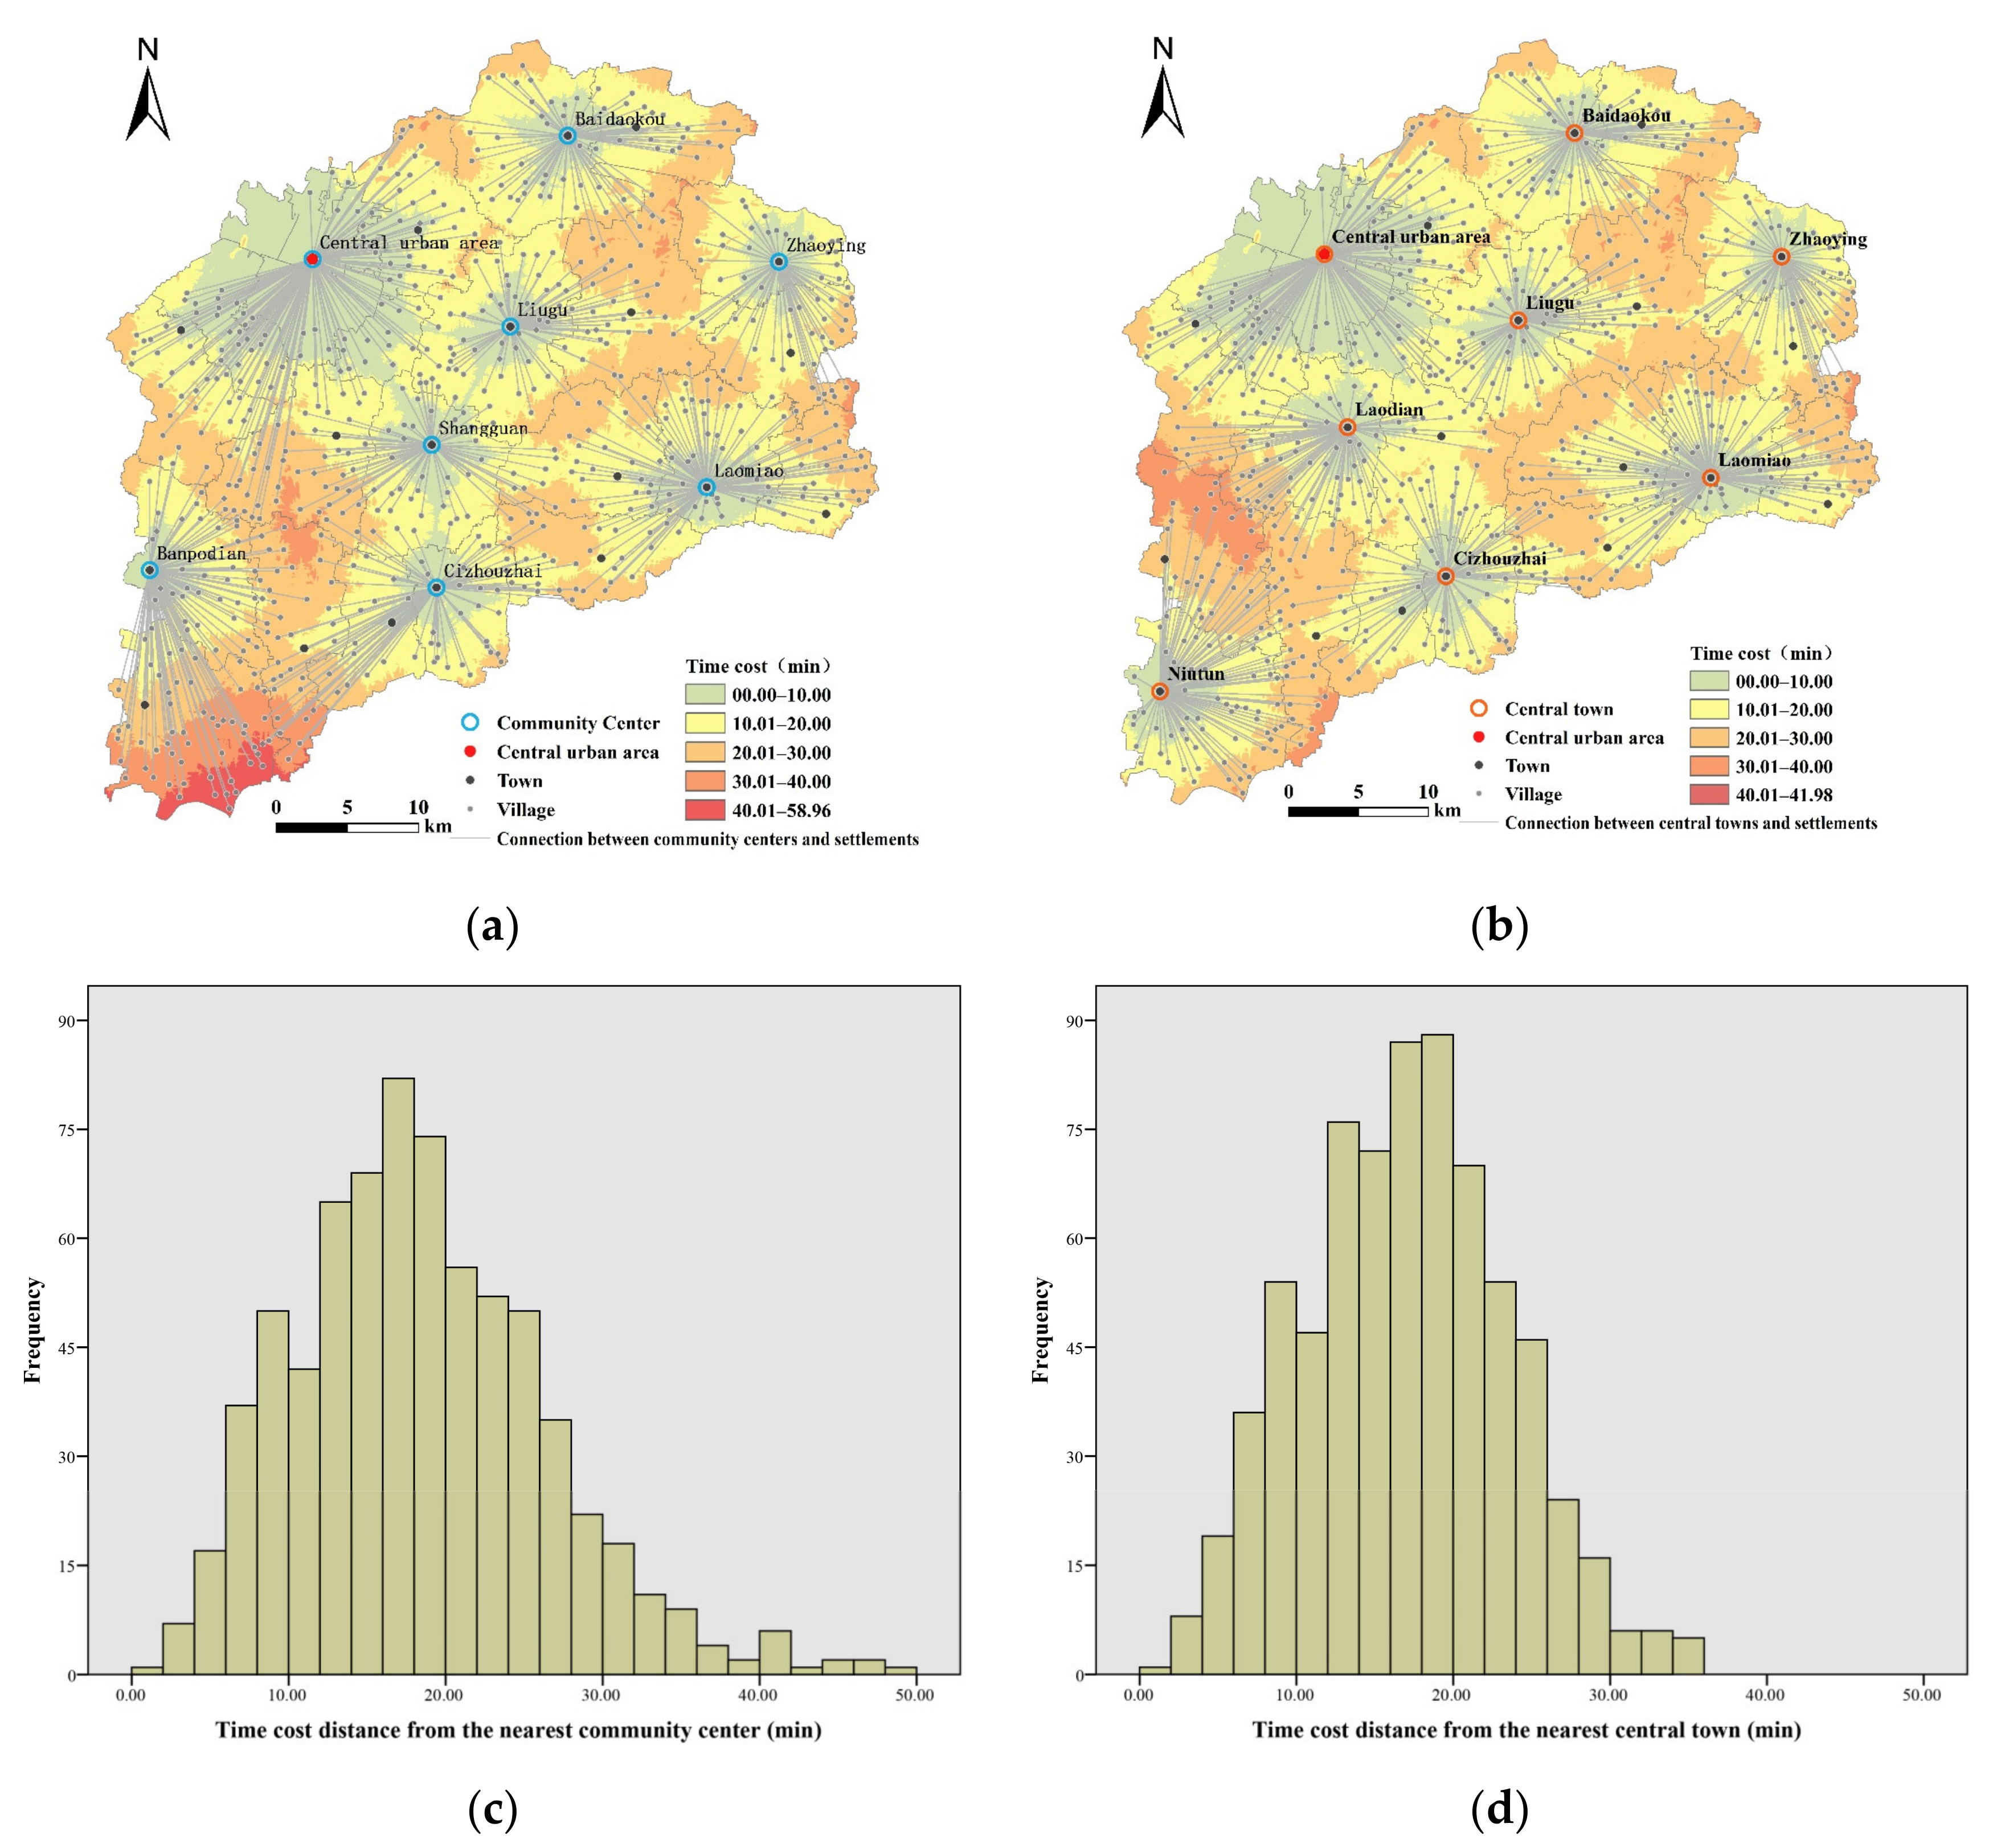
The most important aspect of constructing a five-level system of urban and rural settlements lies in the selection of central towns and central villages. In this study, the selection of central towns was based on the community characteristics of the identified hierarchical network and the spatial coverage of these central towns. First, towns as community centers were selected as potential central towns. These settlements not only have a high level of centrality, but are also closely connected with the settlements within their respective communities. Second, the potential central towns were optimized and adjusted based on the coverage of potential central towns. This study used the proportion of settlements within 30 min from their respective nearest central towns to measure the coverage of central towns. The proportion set in this study was 95%. If more than 95% of the settlements can reach their respective nearest potential central towns within 30 min, all potential central towns can be declassified as central towns. Conversely, if this figure is less than 95%, the potential central towns needed to be adjusted. In communities with poor coverage, towns with high centrality were selected to replace the original potential central towns in their respective communities until the potential central towns in the study area achieved satisfactory coverage.
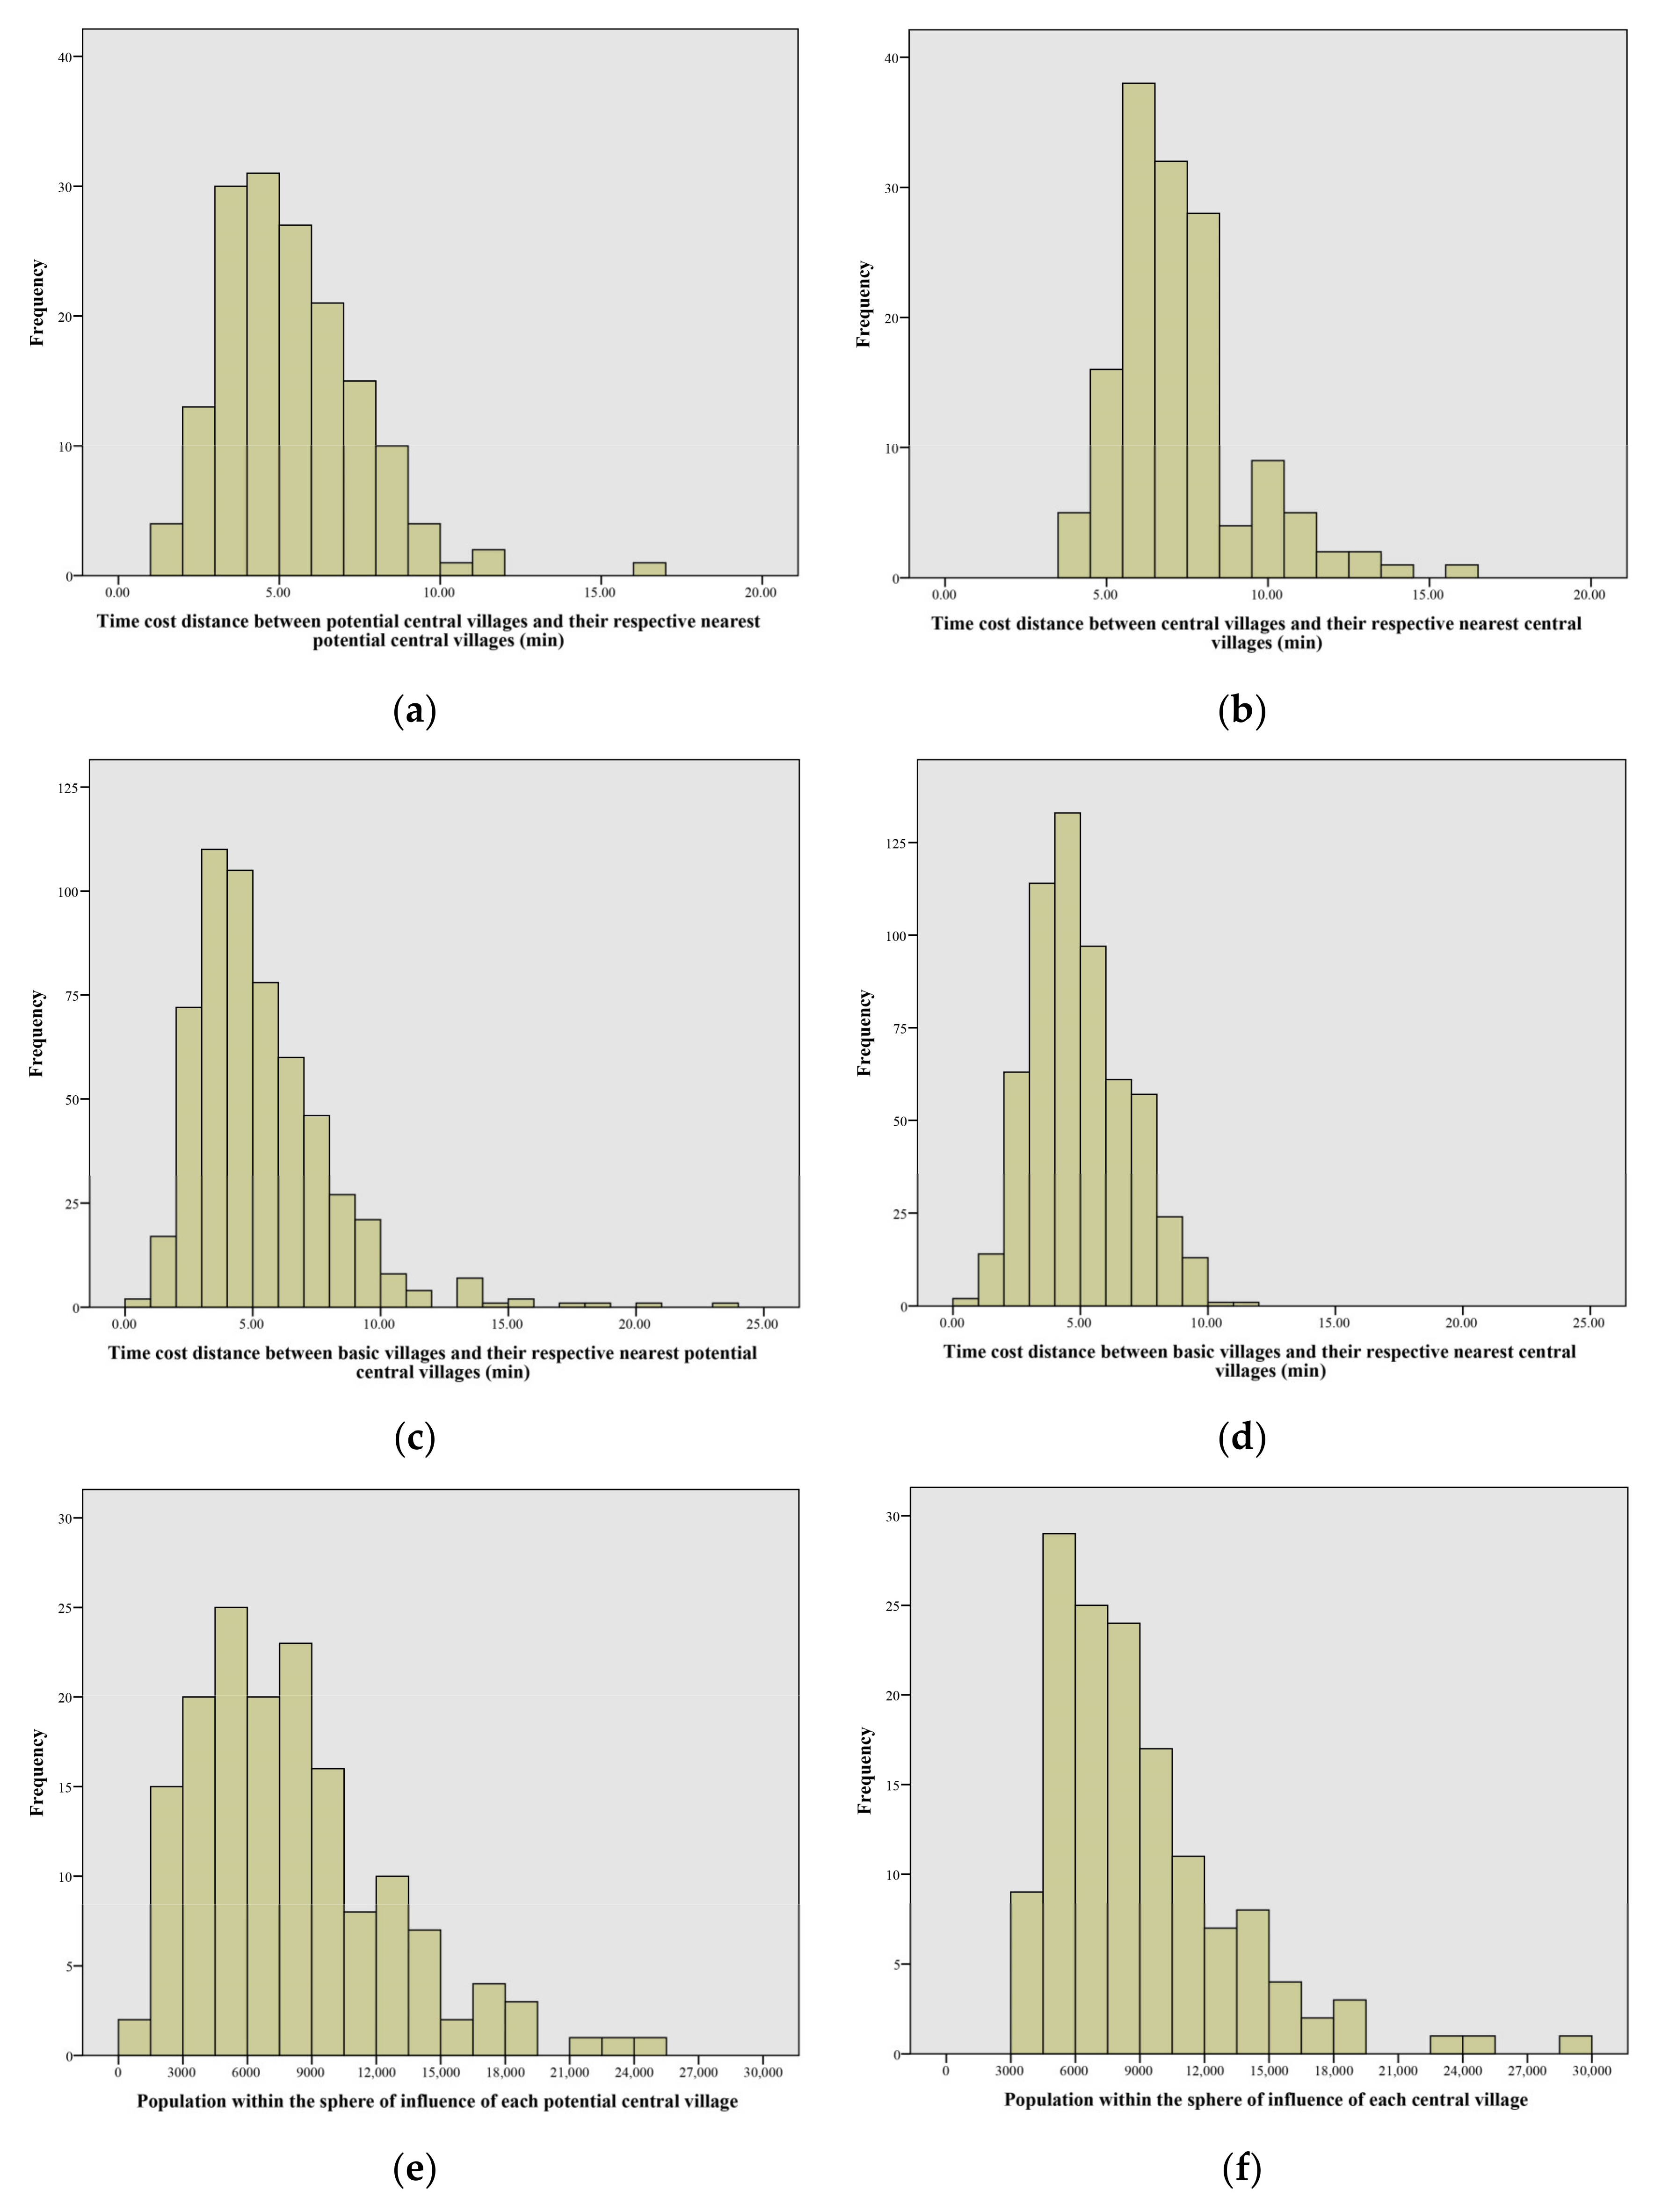
The process of selecting central villages mainly considered the centrality of settlements and the spatial coverage and equilibrium of central villages. First, urban and rural settlements with a high degree of centrality were selected as potential central villages. These settlements can radiate and drive the development of their surrounding settlements and have the potential to become local centers. Second, the potential central villages were optimally adjusted until a satisfactory spatial coverage and equilibrium were achieved for the choice of central villages. The coverage and equilibrium of central villages were mainly measured by three indicators, including the proportion of settlements within 10 min from their respective nearest central villages, the proportion of central villages more than 5 min from their respective nearest central villages, and the proportion of central villages with a population of more than 3000 within their spheres of influence. The three proportions set in this study were all 95%.
2.5. Study Area and Data Source
2.5.1. Study Area
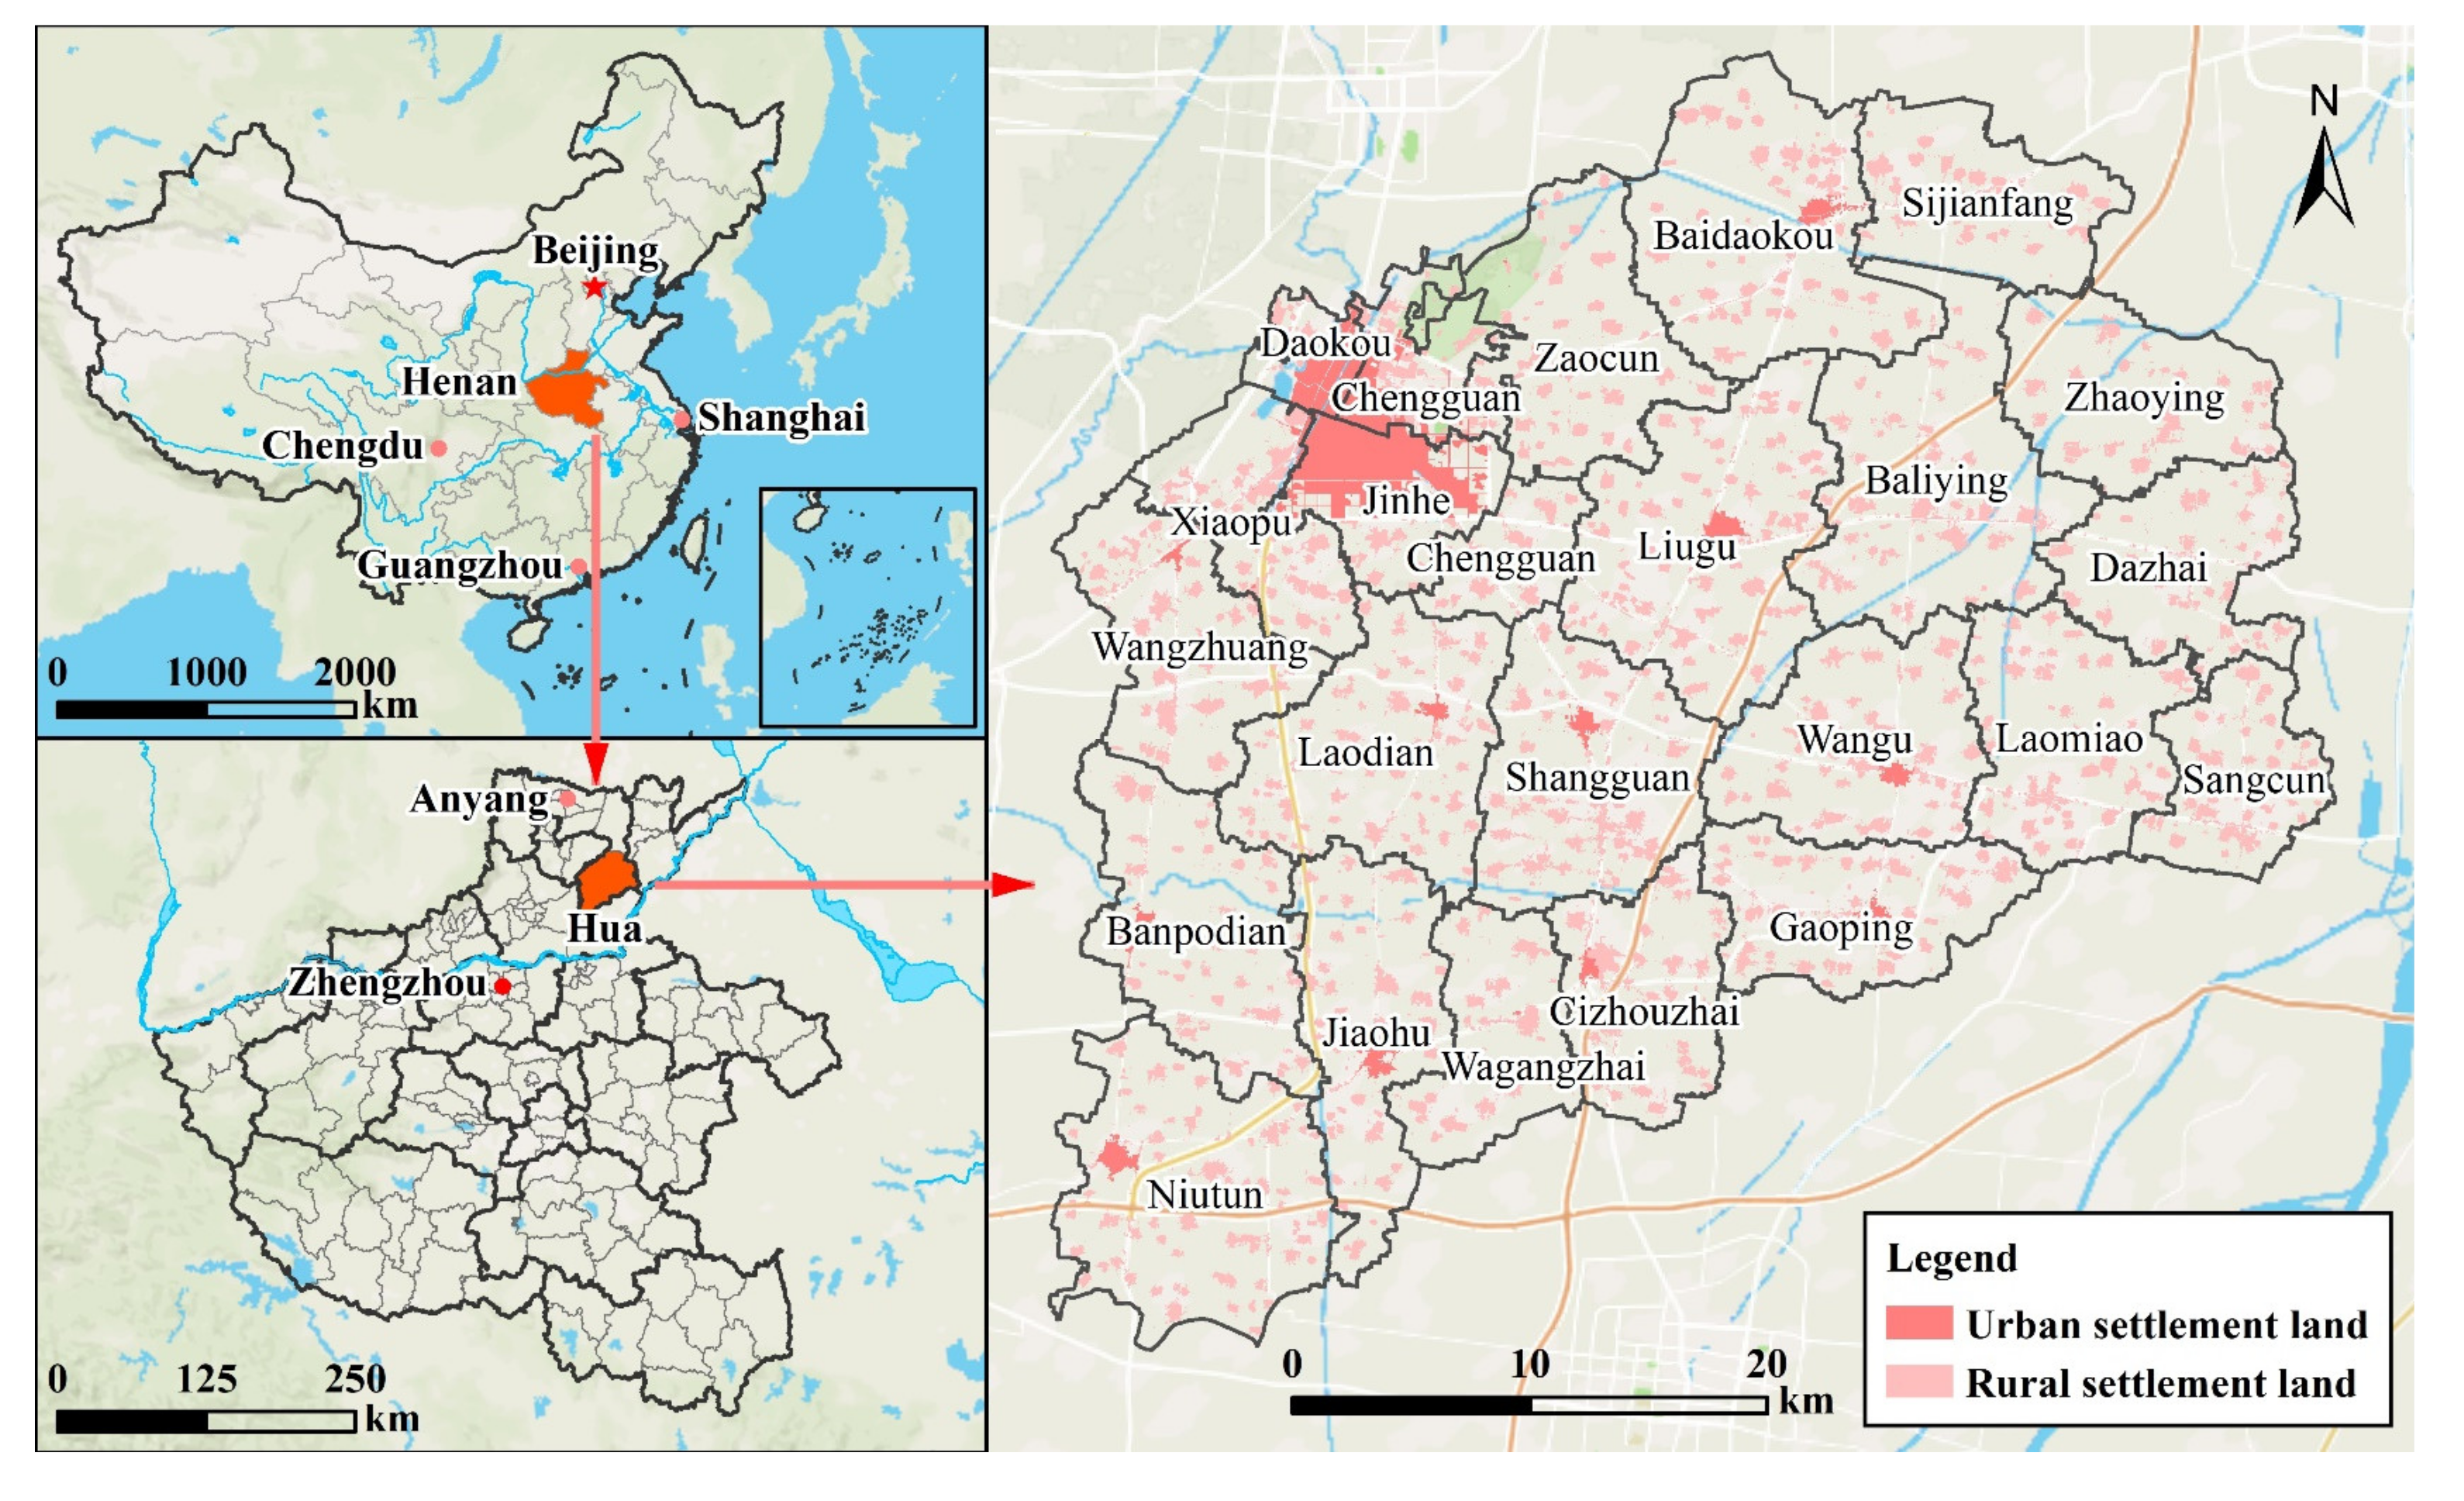
Hua County is located in the northern part of Henan Province, China (
Figure 3). It has 23 townships. Hua County is located in an area of plains and has rich agricultural resources. This county produces the largest amount of wheat of any county in China and the largest amount of grain production in Henan Province. The large population of the county includes a relatively large rural population. In 2018, Hua County had 1.071 million permanent residents, with an urbanization rate of 33.09%. According to land use change survey data acquired in 2018, the urban and rural settlements in Hua County covered an area of about 22,880 hm
2, while the per capita area of urban and rural settlements was 319.20 m
2. This shows that the utilization of urban and rural settlement land is relatively inefficient and the hollowed village problem is serious. Moreover, due to the lack of scientifically-sound planning, rural settlements in Hua County also have problems such as a disorderly layout and uneven distribution of public service facilities. With the integration of urban and rural development along with the implementation of a rural revitalization strategy, the optimization of the spatial layout of these urban and rural settlements in Hua County has strong practical significance.
2.5.2. Data Sources
This study involved two types of measurement, namely, the evaluation of the capacity for development and the calculation of the time cost distance. These two measurements involve land use, population, and public service facility data. Land use data, including land use patches and roads, come from the land use change survey data of Hua County in 2018. The settlement patches in this study also come from land use data. Considering the spatial proximity and administrative division, some settlement patches were merged, and finally, 723 settlement patches were obtained. The population data were obtained from the Public Security Bureau in Hua County, involving the registered population data of 1025 administrative villages in 2018. Since the settlement patches of two or more administrative villages may be merged into one patch due to their spatial adjacency, the population of settlement patches has been merged accordingly. The data related to public service facilities were derived from the points of interest provided by Tencent, including 145 primary schools, 59 middle schools, 456 clinics, 26 health centers, and 11,164 shops.
4. Discussion
The present study is conducted based on the identification of the spatial structure of urban and rural settlements. Spatial interaction analysis is one of the commonly used methods to identify the spatial structure of settlements. The spatial interaction is mainly measured in two ways. One is based on spatial interaction models such as a gravity model or a radiation model [
46,
47,
48], and the other is based on real data such as population flows, innovative connections, and economic connections [
49,
50,
51,
52]. However, in many rural areas, the socio-economic conditions are relatively backward, and it is difficult to obtain real data on the flows of people, material, the economy, and information. Therefore, the research related to the identification of the spatial structure of rural settlements mainly uses the spatial interaction model to simulate a spatial interaction network. Furthermore, in previous studies on the identification of the spatial structure of settlements, especially involving rural settlements, the SGCM is a common method [
15,
29,
53,
54]. It is to use the gravity model to construct a spatial interaction network of settlements, and then retain the strongest gravitational connection of each settlement to binarize the strength of spatial interaction. Finally, the SGCM can identify a relatively clear spatial structure of settlements. By comparison, the hierarchical network method (HNM) proposed in this study has similarities and differences with the SGCM. Similarly, the present study also used the gravity model and retained the strongest gravitational connection of each settlement. However, unlike the SGCM, another aspect was also considered here; that is, for each settlement, its retained strongest gravitational connection can only connect another settlement with a stronger capacity for development.
The abovementioned SGCM was used to identify the spatial structure of urban and rural settlements in Hua County (
Figure 10). It can be seen intuitively that the structure is loose, discontinuous, and with a poor hierarchy. It is embodied in the following two aspects. First, the structure is composed of multiple components. Each component contains several interconnected settlements, and there is no connection between the components. Moreover, the betweenness centrality of the settlements in the spatial structure identified by the HNM is higher overall than that of the settlements identified by the SGCM (
Figure 11b). This shows that the spatial structure identified by the SGCM is relatively loose and discontinuous. Second, in the spatial structure identified by the SGCM, the range of values of the degree centrality is relatively narrow. Only the central urban area has high degree centrality, and the degree centrality of other settlements is basically below 5 (
Figure 11a). However, in the spatial structure identified by the HNM, the range of values of the degree centrality is wider, the gradient is better, and the degree centrality of a considerable number of settlements is between 5 and 10. In addition, the SGCM cannot identify the spatial interaction between each settlement and its more distant settlements. For high-level settlements, such as the central urban area or towns, only connections with surrounding settlements can be identified, but no connections with distant settlements could be identified. This makes it difficult to reflect the radiating and driving role of the central urban area as a county center or towns as township centers. This also further shows that the spatial structure identified by the SGCM is poorly hierarchical and has a limited ability to support the optimization of the spatial structure, especially for the selection of central towns and central villages.
The reasons for the loose, discontinuous, and poorly hierarchical structure of the network identified by the SGCM were analyzed in more detail. In the HNM proposed in the present study, the retained gravitational connection of a settlement can only connect another settlement with a stronger capacity for development. However, in the SGCM, the retained gravitational connection of a certain settlement may connect another settlement with a stronger or weaker capacity for development. As shown in
Figure 10, the orange and blue lines respectively indicate that the retained gravitational connections of settlements connect the settlements with a stronger or weaker capacity for development. This has two effects. First, situations may exist where two settlements have the retained strongest gravitational connections with each other. If no other settlement has the retained gravitational connection with these two settlements, then an isolated island or a component of the network will be formed. This further results in a loose and discontinuous spatial structure. Second, if the retained gravitational connection of a certain settlement is allowed to connect a settlement with a weaker capacity for development, this may overestimate the importance of the settlements with a weaker capacity for development and underestimate the importance of other settlements with a stronger capacity for development in the spatial structure. Furthermore, this will also lead to a lack of bottom-up directionality in the gravitational connections between settlements, resulting in a poor hierarchy of the network. Therefore, the HNM proposed in this study requires that the retained gravitational connection of each settlement can only connect another settlement with a stronger capacity for development. This is the essential difference between the two methods and the fundamental reason why the hierarchical characteristic is manifested.
The HNM proposed in this study can help planners to scientifically identify and optimize the spatial structure of urban and rural settlements. Taking Hua County as an example, this study identified a complete, continuous, and hierarchical network structure of settlements based on the HNM, and then constructed a five-level optimization system for urban and rural settlements. Relying on this optimization system, town life circles centered on central towns and general towns can be established. This can effectively promote the interactions between towns and villages. Moreover, rural life circles centered on central villages can also be constructed, which can further promote the equalization of public services. In addition, the spatial hierarchical structure of settlements identified in this study can provide a reference for the current village classification planning. The spatial hierarchical structure directly reflects the status and role of each settlement, which can support the scientific classification of villages. As mentioned above, the HNM proposed in this study has direct practical guiding significance for the establishment of the village–town system, the construction of farmers’ life circles, and the classification of villages, which are important measures and means for rural revitalization and integrated urban–rural development at present. Therefore, this study has important practical significance for rural revitalization and integrated urban–rural development.
5. Conclusions
This study proposes a method framework for identifying and optimizing the spatial structure of urban and rural settlements from the hierarchical network perspective. The framework includes three parts—namely, the identification, analysis, and optimization of the hierarchical network structure of urban and rural settlements. The identification of the spatial hierarchical network structure of settlements is the foundation and main innovation of this study. To realize the identification, for each settlement, this study finds and retains its strongest interaction with other settlements which have a stronger capacity for development. The analysis of the hierarchical network structure of urban and rural settlements mainly uses network indicators and methods such as degree centrality, betweenness centrality, and community detection. The optimization of the spatial hierarchical network structure involves constructing a five-level urban and rural settlement system based on the aforementioned analysis. Hua County is used as an example to verify the method framework. The results indicate that the spatial structure of the urban and rural settlements in Hua County identified in this study is complete and continuous, with significant hierarchical and community characteristics. Network centrality analysis shows that most settlements have low degree centrality and betweenness centrality, while the central urban area and towns have high degree centrality and betweenness centrality. Community detection analysis shows that the urban and rural settlements of Hua County can be clearly divided into eight communities; the distribution of the settlements within a community shows these have geographic proximity and administrative regionality. Based on the above analysis, considering the spatial coverage and equilibrium, seven central towns and 123 central villages are selected, and finally, a five-level urban and rural settlement optimization system is constructed.
The main contribution of this study is to propose a research framework for identifying and optimizing the spatial structure of urban and rural settlements from a hierarchical network perspective. The basis of this framework is the identification of the spatial hierarchical structure of urban and rural settlements. The identification method proposed in this study considers both the capacity for development of urban and rural settlements and the spatial interaction between these settlements. This method can help land use planners to effectively identify a complete, continuous, and hierarchical network structure of urban and rural settlements. In addition, the position of settlements within the spatial hierarchical network can intuitively reflect the role of each settlement in the spatial structure, helping planners to optimize the spatial structure of urban and rural settlements in a more scientific and reasonable way. Thus, this study expands the method used to study the spatial structure of urban and rural settlements from the network perspective. In addition, this study uses Hua County, an agricultural area of plains, to verify the method and achieves an ideal result of identifying and optimizing the spatial structure of urban and rural settlements. In the future, the method proposed in this study can be used to identify and optimize the spatial structure of the settlements in the study area with different natural conditions and stages of development, so as to further explore the applicability of this method.


