Article

GIS-Based Multi-Criteria Evaluation for Potential Inland Aquaculture Site Selection in the George Town Conurbation, Malaysia

by
Puteri Nur Atiqah Bandira
1,
Mohd Amirul Mahamud
2,
Narimah Samat
2,*,
Mou Leong Tan
2 and
Ngai Weng Chan
2
1
School of Industrial Technology, Universiti Sains Malaysia, Gelugor 11800, Penang, Malaysia
2
GeoInformatics Unit, School of Humanities, Universiti Sains Malaysia, Gelugor 11800, Penang, Malaysia
*
Author to whom correspondence should be addressed.
Land 2021, 10(11), 1174; https://doi.org/10.3390/land10111174
Submission received: 3 September 2021 / Revised: 23 October 2021 / Accepted: 27 October 2021 / Published: 2 November 2021

Abstract

:
Although the aquaculture industry contributes less than 0.2% to the Gross Domestic Product (GDP) of Malaysia, it has slowly become an important economic activity due to the high-value species productions for domestic and international markets. In addition, aquaculture can potentially be used as a sustainable solution for food security in the future. At present, the selection of aquaculture sites has not received much attention. Thus, this study aims to integrate a Geographic Information System and multi-criteria evaluation approach in identifying the potential sites for brackish aquaculture in the George Town Conurbation, Malaysia. ArcGIS 10.4 was used to perform site selection analysis together with the essential spatial data such as current land use, environmentally sensitive data, and soil quality that influence suitable sites selection for aquaculture. The selection was undertaken in ad hoc manners based on available land identified by aquaculture operators. The results indicated that the George Town Conurbation has a minimal potential site (0.37%) for aquaculture sites. This minimal number results from the expansion of built-up areas towards urban fringe areas; hence less land becomes available for aquaculture. A reasonable buffer zone should be designated as a boundary between urban development and aquaculture to avoid land-use conflict between these two activities.

1. Introduction

The global human population is growing exponentially, securing the aquaculture sector’s role in ensuring the world’s food security as over 75% of the world fisheries are considered fully exploited or overexploited [1]. The increased demand has resulted in an inevitable sector expansion, shown by the average production rate growth at 5.3% per year from 2001 to 2018 [2]. The growth is expected to intensify and increase production in the future, creating competition for finite space and resources with agricultural activities [2,3]. The sector’s expansion includes increasing farms number, establishing farms in new geographical areas, increasing farm size, increasing cultivation (stocking density), and increasing farm productivity. Moreover, the intensification is obtained by the increased use of feeds, fertilizer, chemical inputs, land, and water use [4]. The expansion and intensification of the aquaculture sector are putting tremendous environmental pressures such as affluence and pesticides on the ecosystem goods and services as the presence of the farms alters the natural health of an ecosystem and disrupt the productivity of the nearby aquatic environment in a diverse and complex way [5,6].
The presence of aquaculture farms can affect the natural ecosystem in several ways, e.g., water pollution is caused by poor input management [7,8,9,10,11], poor planning, and farm sitting [12,13,14,15]. Aquaculture farm affects its neighboring waterbody through eutrophication; a process caused by the excessive input of nutrients (e.g., phosphorus and nitrogen), and the waste secretion from the cultured animal. Sampantamit et al. [10] have reported that the intensification of aquaculture production is the main contributor to eutrophication in Thailand, predominantly due to the release of untreated wastewater and sewage sludge from the aquaculture farms. The accumulation of certain organic compounds, e.g., nitrogen, may acidify the water that indirectly causing significant damage to aquatic plants and animals [16]. A poor farm siting can degrade the natural environment, as demonstrated by Shahbudin et al. [15], where a part of mangrove forest in Kilim River, Malaysia, was converted to shrimp farms. The establishment of shrimp farms in mangrove forest areas has degraded the natural habitat, biodiversity, and nursery ground for marine animals [17]. Therefore, selecting a suitable location for aquaculture farming is critical for environmental impact mitigation measures and to ensure a successful aquaculture farm with unlimited future development and sustainability. At present, however, the location of the aquaculture farm was undertaken in an ad hoc manner based on the availability of land.
Traditionally, the location of aquaculture activities has been selected based on a combination of local demand and agroecology [16]. However, a poor aquaculture farm siting can lead to numerous environmental problems and fish farmers, such as lack of effective biosecurity, ecosystem service losses, lower production yield, social conflicts, risk financing, and resilience [15,16,17]. These problems can be minimized or prevented with more structured spatial planning. The location and intensity of aquaculture activity must sustainably balance conservation and economic return [17]. The potential site should be identified according to specific criteria and constraints, carefully considering social, economic, and environmental factors [18]. These criteria vary with location, species, system, and technology used, but it forms a basis for the aquaculture site selection tasks [19].
Radiarta et al. [20] listed several constraints in the aquaculture site selection task such as limited suitable sites, environmental impacts, and multi-use conflicts. These constraints are significant in spatial decision making, affecting the farmed product’s quantity, quality, and profitability. Furthermore, it ensures the development of cost-efficient sustainable aquaculture whereby environmental impacts are mitigated, optimizing productivity and day-to-day management [19]. The selection of potential aquaculture sites can be identified using geographic information system (GIS), where GIS is defined as a system that captures, stores, analyses, and manages data associated with attributes spatially referenced to the earth [21]. Table 1 below shows the list of studies related to site selection problems.
Table 1 provides a summary of selected existing studies demonstrating the application of GIS in performing site selection tasks for the location of aquaculture activities. Most of these studies have utilized the GIS-based multi-criteria evaluation (MCE) approach to identify suitable sites for aquaculture farms [20,24,26,27,28,29,30]. The study used GIS and MCDM by Mamat et al. [24] to identify suitable oyster farms is among the related study in Malaysia. In contrast, the other authors have demonstrated another approach, mostly a GIS-based combined approach for site selection tasks [22,28,30]. All previous studies have utilized GIS and remote sensing data in GIS analysis, showing that this technology has a significant role in the development and management of aquaculture in both aspects, geographically and spatially. Moreover, GIS application in this industry is able to reduce field sampling. It increases the spatial and temporal coverage of estimation, making GIS a powerful tool for the efficient and cost-effective management of sustainable aquaculture [18].
In achieving the decision objectives of the site selection task, multiple and conflicting criteria are considered. Hence, the MCE approach is used to enable a choice evaluation between alternatives [31], and the efficiency of the approach in various aquaculture industries has been demonstrated and reported in the existing studies listed in Table 1. For example, Nayak et al. [26] have demonstrated MCE and GIS integration in locating suitable aquaculture farm sites in Central Himalayas. Their work is among the earliest which evaluate aquaculture land suitability in a hilly region. Mamat et al. [24] utilized the MCE concept within a GIS environment in identifying a suitable site for oyster breeding in Terengganu. The research proposes a systematic, less time-consuming, and cheaper site selection method to the Department of Fisheries (DOF), Malaysia. However, the study excludes the social infrastructure criteria, which according to Cardia et al. [32], has a critical decision role in the task, such as minimize conflicts with other land users, preventing adverse impact to an environmentally sensitive area, and avoiding industrial areas which deteriorate the proximity water quality. Another example of the usage of MCE in GIS is the work by Radiarta et al. [20], where it is being used to identify suitable sites for Japanese scallop aquaculture in Funka Bay Hokkaido, Japan. The study shows that this method is not limited to inland aquaculture development but also marine aquaculture.
MCE has been modelled to determine the level of importance for each criterion against each other using a pairwise comparison matrix for solving conflicting criteria. MCE in land use analysis involves five steps: (1) problem identification (e.g., determining sites suitable for aquaculture farm), (2) selection of factors or criteria that reflects the character of the objectives (e.g., proximity to water source has a significant influence on aquaculture site selection, hence scored based on the level of importance), (3) score standardisation (e.g., each criterion have a value ranging from 1 to 3 so they are comparable), (4) attaching weights to each of the criteria selected using the pairwise comparison matrix, (5) weighted linear combination, where each criterion is presented in a raster digital map layer. The cells’ standardised score is multiplied with their respective weights and summed to produce a composite map. The composite map is the suitability map containing cells with a value of 1 to 3. The highest value indicates the most suitable location, and the low value indicates a non-suitable location.
Although Malaysia is among the top five aquaculture producer countries in Southeast Asia, a proper aquaculture spatial planning is lacking in the aquaculture industry in Malaysia, e.g., DOF is still utilizing the conventional method of site selection and in-situ water quality monitoring [24]. Likewise, to date, the existing literature on GIS application for the aquaculture industry in Malaysia is scarce compared to the other countries in Southeast Asia. Hence, we can say that the utilisation of GIS technology in aquaculture management and development in Malaysia is minimal. The practice of conventional methods not only is time-consuming and inefficient, but also it might impede the future development of the aquaculture industry in the country. Therefore, this paper presents a GIS-based multi-criteria evaluation (MCE) that uses remote sensing and land use data to identify the most suitable sites for inland aquaculture farms in Georgetown Conurbation. This study integrated GIS and MCE approach by using ArcGIS 10.4 and the essential spatial data, including current land use, environmentally sensitive data, and soil quality that influence suitable sites for aquaculture. The systematic approach used in this study can provide assistance for maximizing sustainability by exploring only suitable sites rather than wasting land for unsuitable sites.

2. Materials and Methods

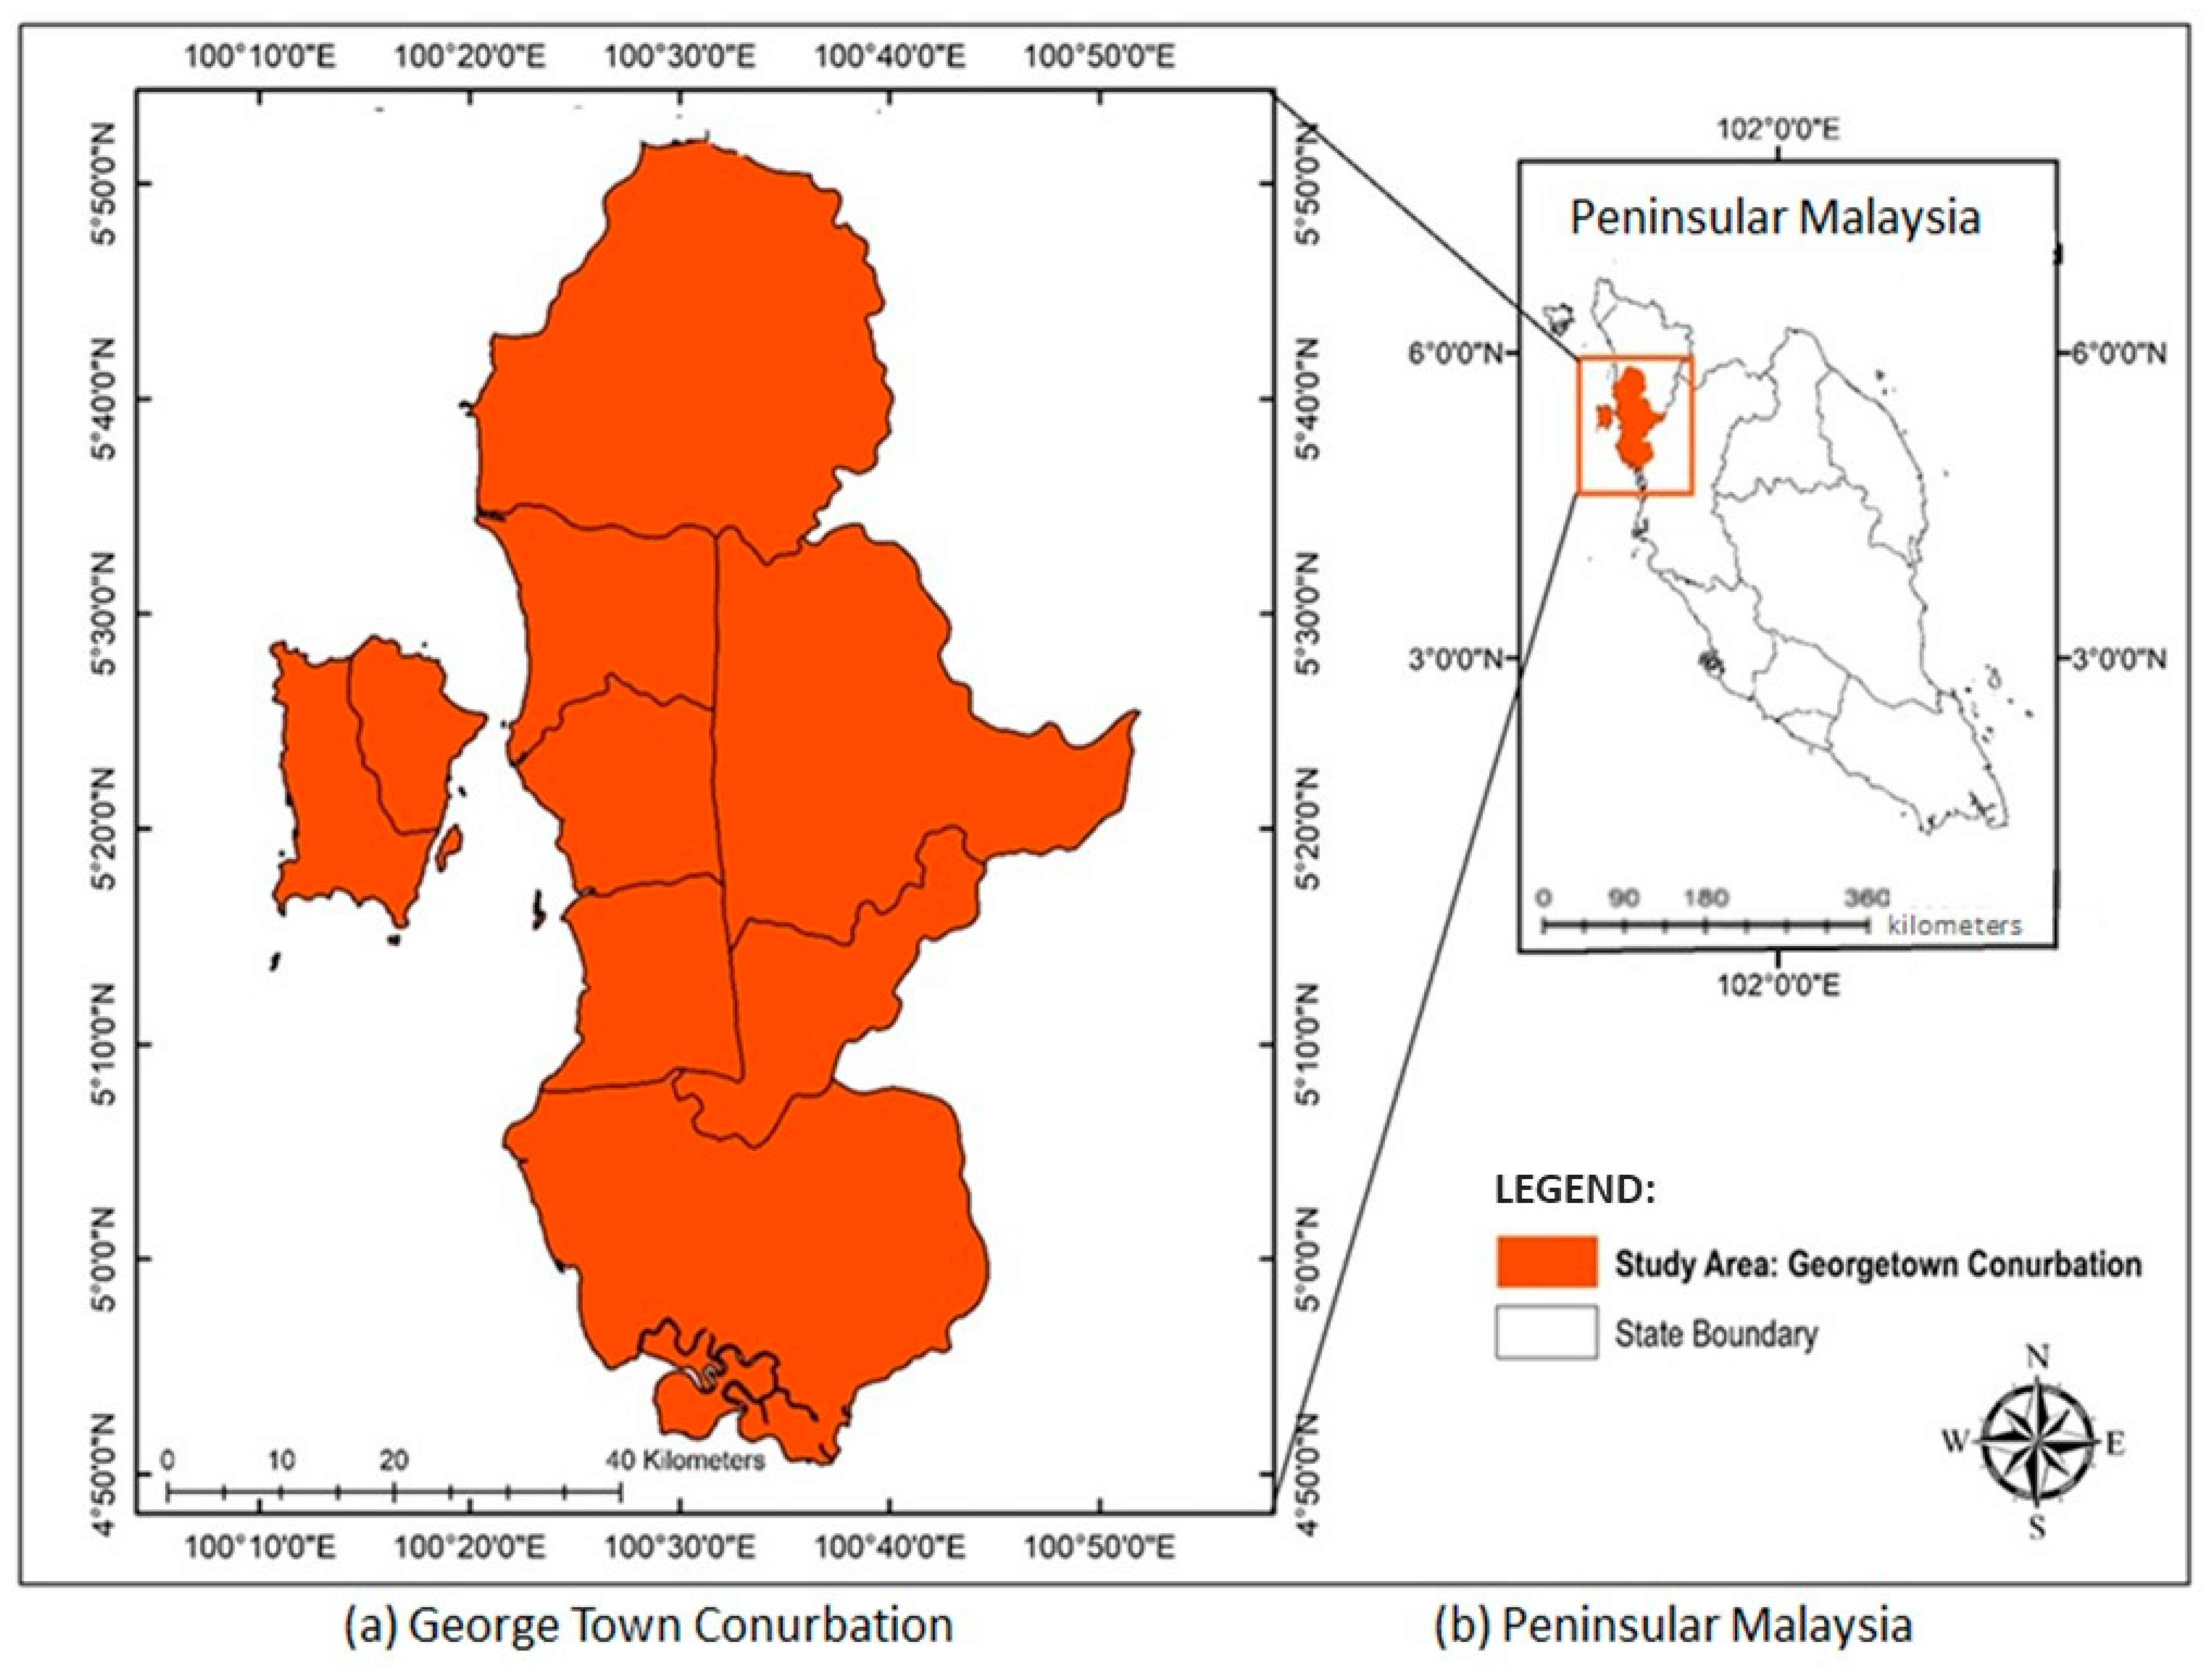
2.1. George Town Conurbation

The George Town Conurbation have an area of approximately 3938 km2 (see Figure 1). The main reason for selecting George Town Conurbation as the study area is that Penang’s aquaculture sectors’ average annual growth rate between 1995 and 2015 is remarkable, 8.2% and 23% in production and values. Penang’s food fish production showed the second-highest wholesale value in Malaysia, with aquaculture contributing over 54% to Malaysia’s food fish production (58,736 metric tonnes, valued at RM1090.6 mil). However, being the second smallest state in Malaysia hinders the expansion of the sector. Hence, it is predicted that the expansion of the industry will be focused on its neighbouring states. The second reason for selecting George Town Conurbation is data availability. Data availability is crucial in spatial modelling, as data input and database creation are costly and time-consuming. The Geoinformatics Unit, Universiti Sains Malaysia have collected digital data sets for George Town Conurbations. These include digital map data sets of roads, rivers, and land use for 2017–2018. The data sets described above form the primary digital data sources used in this study.

2.2. Data

Digital elevation model (DEM) data for the study area were obtained from the United States Geological Survey [33] acquired on 20 June 2019. The spatial resolution of the DEM is 30 m. FAO digital soil map is used in the research to map the soil quality in the George Town Conurbation area. Land use data provided by The Geoinformatics Units, USM is being used in this research. All digital data were processed within the GIS software, ArcMap for windows (version 10.4), developed by Environmental System Research Institute Inc., Redlands, CA, USA. All map layers are transformed into WGS 1984 coordinates projection, following the FAO Soil Map coordinates projection. For the distance scale, the unit meter was used and defined in the software system. The procedure followed in modelling the land suitability for fisheries development is presented in Figure 2.

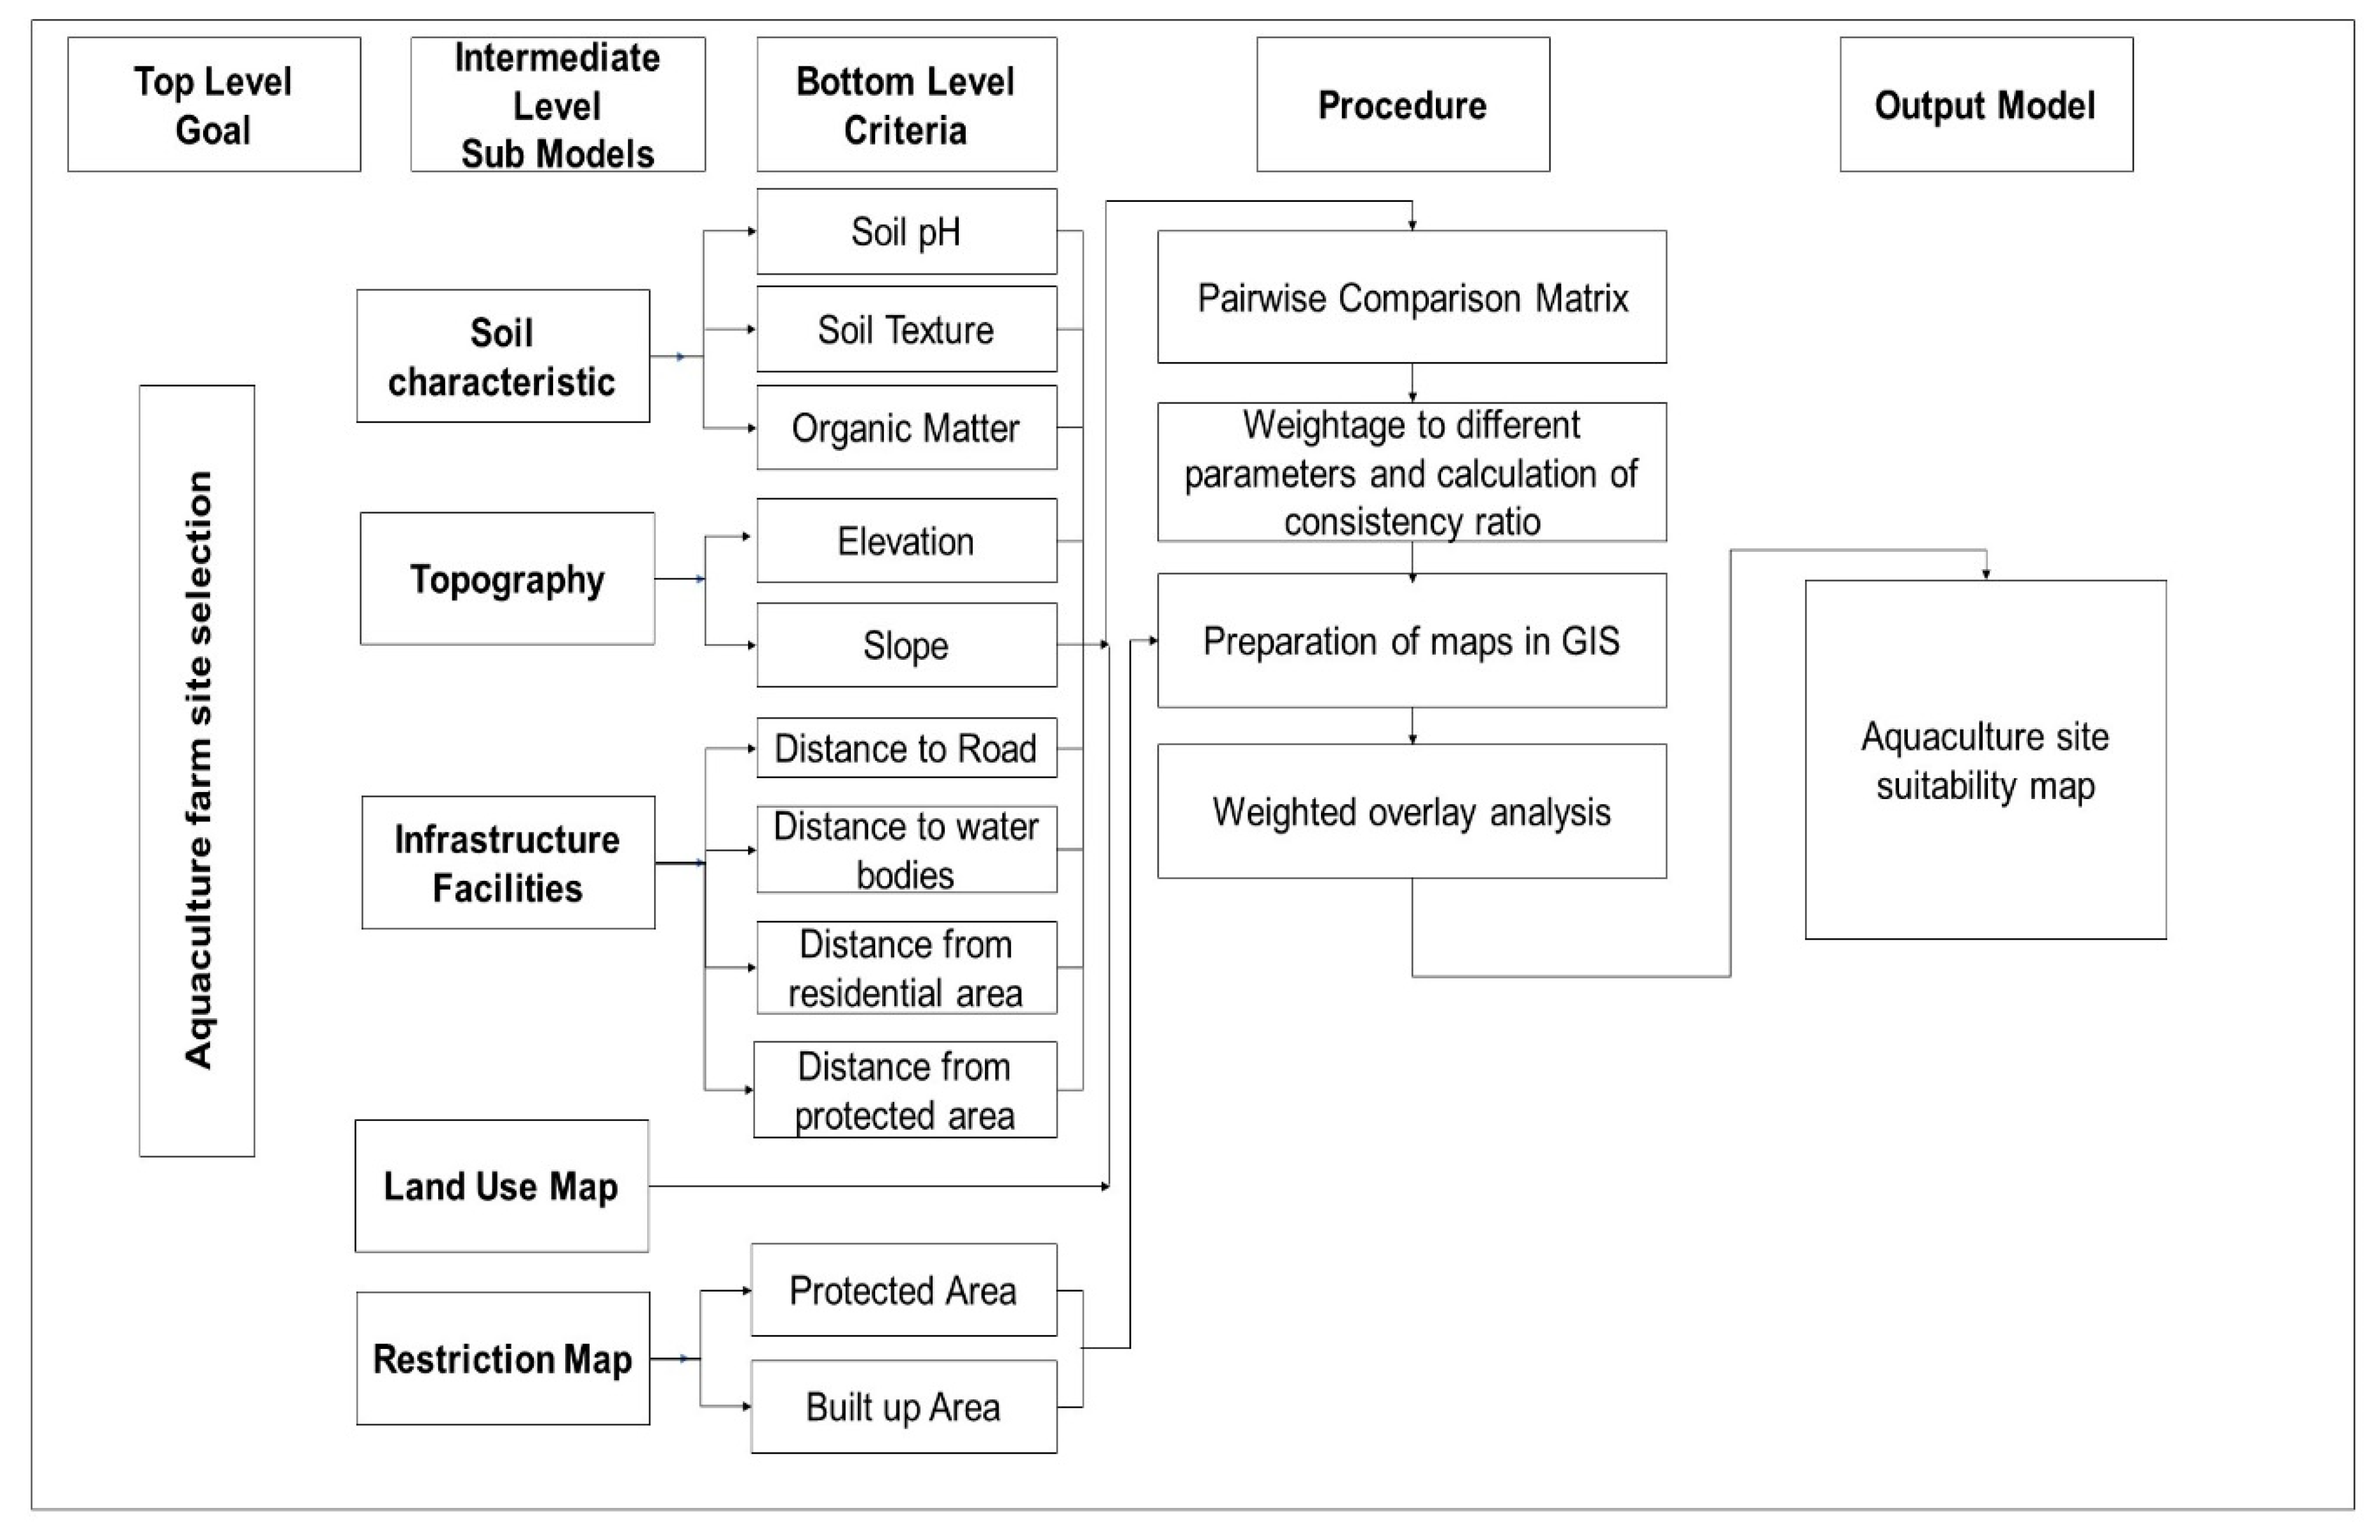
2.3. Spatial Analysis–Modelling Methodology

The approach is comprised of five steps. The first step involves setting the objective, which is to determine suitable sites for aquaculture activity. The second step involves identifying criteria and constraints to use in selecting aquaculture sites. This analysis is important for preparing criteria and constraints conducted within a raster environment, and all the layers are converted in raster with the size of 30 m before analysis. Soil quality parameter such as pH, soil texture and soil organic matter is obtained from the FAO Soil Map of the World [34]. The slope and elevation data are extracted from the DEM SRTM 30 m. Land use data are obtained from the Geoinformatics Unit, USM, to extract the water bodies, road, residential area and protected region information are obtained. Although there are many criteria to be considered in aquaculture site selection, due to data limitation, nine (9) essential criteria listed by [26,30,35] were chosen. The third step involves standardising the suitability score for all criteria. The suitability scores for this study are based on the FAO guideline [32], where value one (1) is assigned for the not suitable cell, and value three (3) is assigned for the most suitable cell. Figure 2 shows the schematic diagram of the modelling procedure for the identification of potential aquaculture sites. The criteria considered in this study with its’ suitability rating are shown in Table 2.
Suitability analysis in this study is conducted using the suitability Equation (1).
S = i = 1 n w i c i
where S is the suitability score, w i is the weight of each criterion, c i is the criterion score, and n is the criteria used in the task (here, n = 9). The suitability equation is used to integrate the trade-offs between various factors and calculate an overall weighted suitability score for each evaluation unit. ArcMap 10.4 model builder tool is used to develop the suitability model for identifying the potential site for aquaculture farms.
Fourth, weight for each criterion was assigned based on the interview conducted with three academicians who have expertise in aquaculture practices. The experts were asked to fill in the form using a pairwise comparison matrix as shown in Table 3, where the scoring range from 1/9 (least important) to 9 (most important). Then, their assessments were evaluated using the median method to determine the pairwise comparison matrix, as shown in Table 4.
A consistency ratio (CR), [CR = Consistency Index (CI)/Random Consistency Index] of less than 1 shows a consistent comparison between the criteria and is considered acceptable [36]. The random consistency index (RI) is different for different n values, where n is the number of criteria. The RI value for different n is presented in Table 5, and CI was calculated as follows:
C I = ( λ max n ) ( n 1 )
where, λ max =   of the products between each element of the priority vector and column totals, and n = number of criteria.
Based on Table 4, the consistency ratio calculated for soil quality, infrastructural facilities and overall are 0.065, −0.220, and 0.087, respectively. All CR were less than 10%, as recommended by Saaty [36], signifying a small probability that the weights were developed by chance. Data are obtained from previous studies undertaken at Universiti Sains Malaysia. Geoprocessing was undertaken to ensure all data were in the same format and scale. ArcGIS was used for data processing and analysis. All the data layers need to be prepared before undergoing the weighted analysis. The Euclidean distance map of water bodies, roads, residential areas and protected areas is generated, enabling proximity analysis for the study. The map produced were restricted from being identified as a potential site for an aquaculture farm. Data standardization is required to enable a comparison between all the map layers. This process will produce a final suitability map for potential aquaculture sites retained within the 1–3 suitability score range. The highest score signifies the most suitable location, and the lowest score signifies the non-suitable location for aquaculture farm development. All layers are multiplied with their respective weight and summed in the weighted overlay process, producing a suitability map. Equation (1) is used to produce the final suitability map; shown below is the usage of Equation (1) in the study for soil and infrastructure suitability map:
S o i l S u i t a b i l i t y   = ( S o i l p H × 0.1 ) + ( S o i l t e x t u r e × 0.1 ) + ( S o i l O M × 0.3 ) + ( S o i l s l o p e × 0.2 ) + ( S o i l e l e v × 0.2 )
I n f r a s u i t a b i l i t y = ( I n f r a w a t e r × 0.4 ) + ( I n f r a r o a d × 0.3 ) + ( I n f r a p r o t e c t e d   a r e a × 0.2 ) + ( I n f r a r e s i d e n t i a l × 0.1 )
Then, based on Equation (1) above, the study used overlay techniques of ArcGIS 10.4 to combine all criteria and constraints (restriction map) to generate the final suitability map. The approach allows potential sites to be identified. The procedure is shown in Equation (5) below.
S i t e   S u i t a b i l i t y = ( ( S o i l s u i t a b i l i t y × 0.3 ) + ( I n f r a s u i t a b i l i t y × 0.1 ) + ( L a n d u s e s u i t a b i l i t y × 0.6 )   ) × R e s t r i c t i o n   M a p
Finally, selecting the best potential sites among the highly suitable sites is conducted based on the size of the suitable area. As suggested by the Penang State of Forestry Department [37], the minimum size for a commercial aquaculture farm is 20 ha, however considering a future expansion and expert opinion, the best potential sites are those with more than 35 ha [38].

2.4. Model Validation
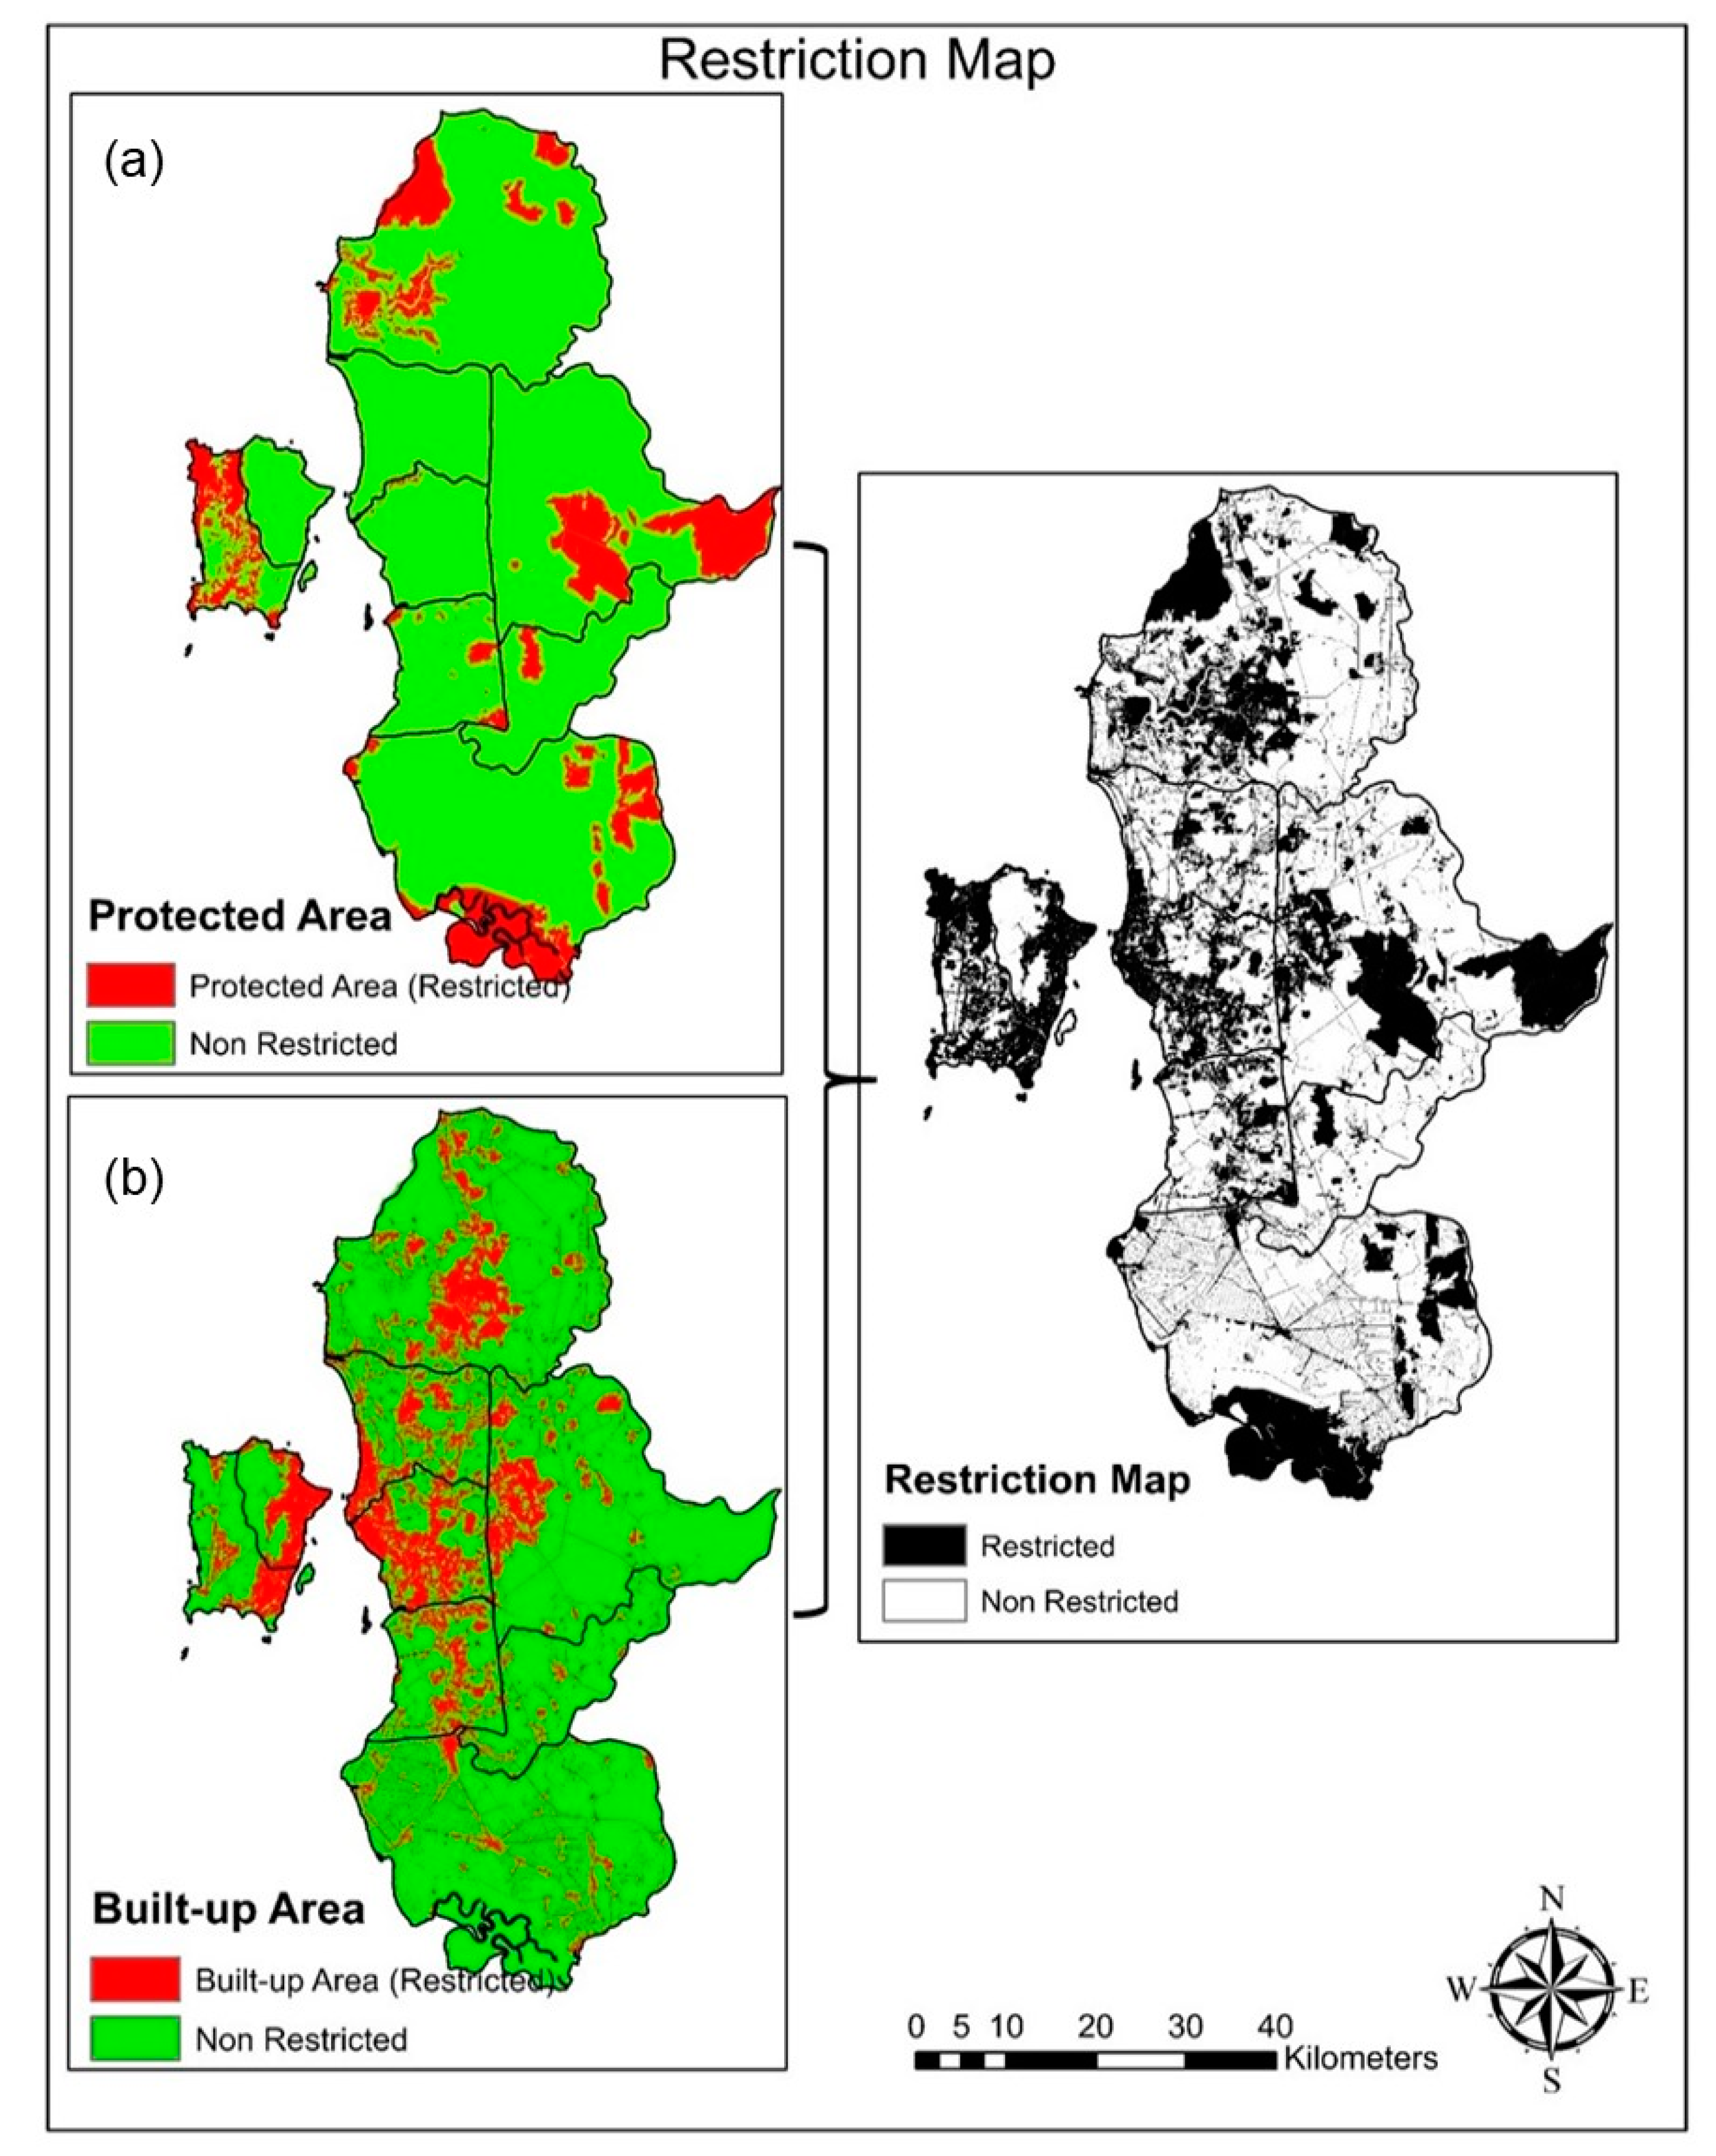
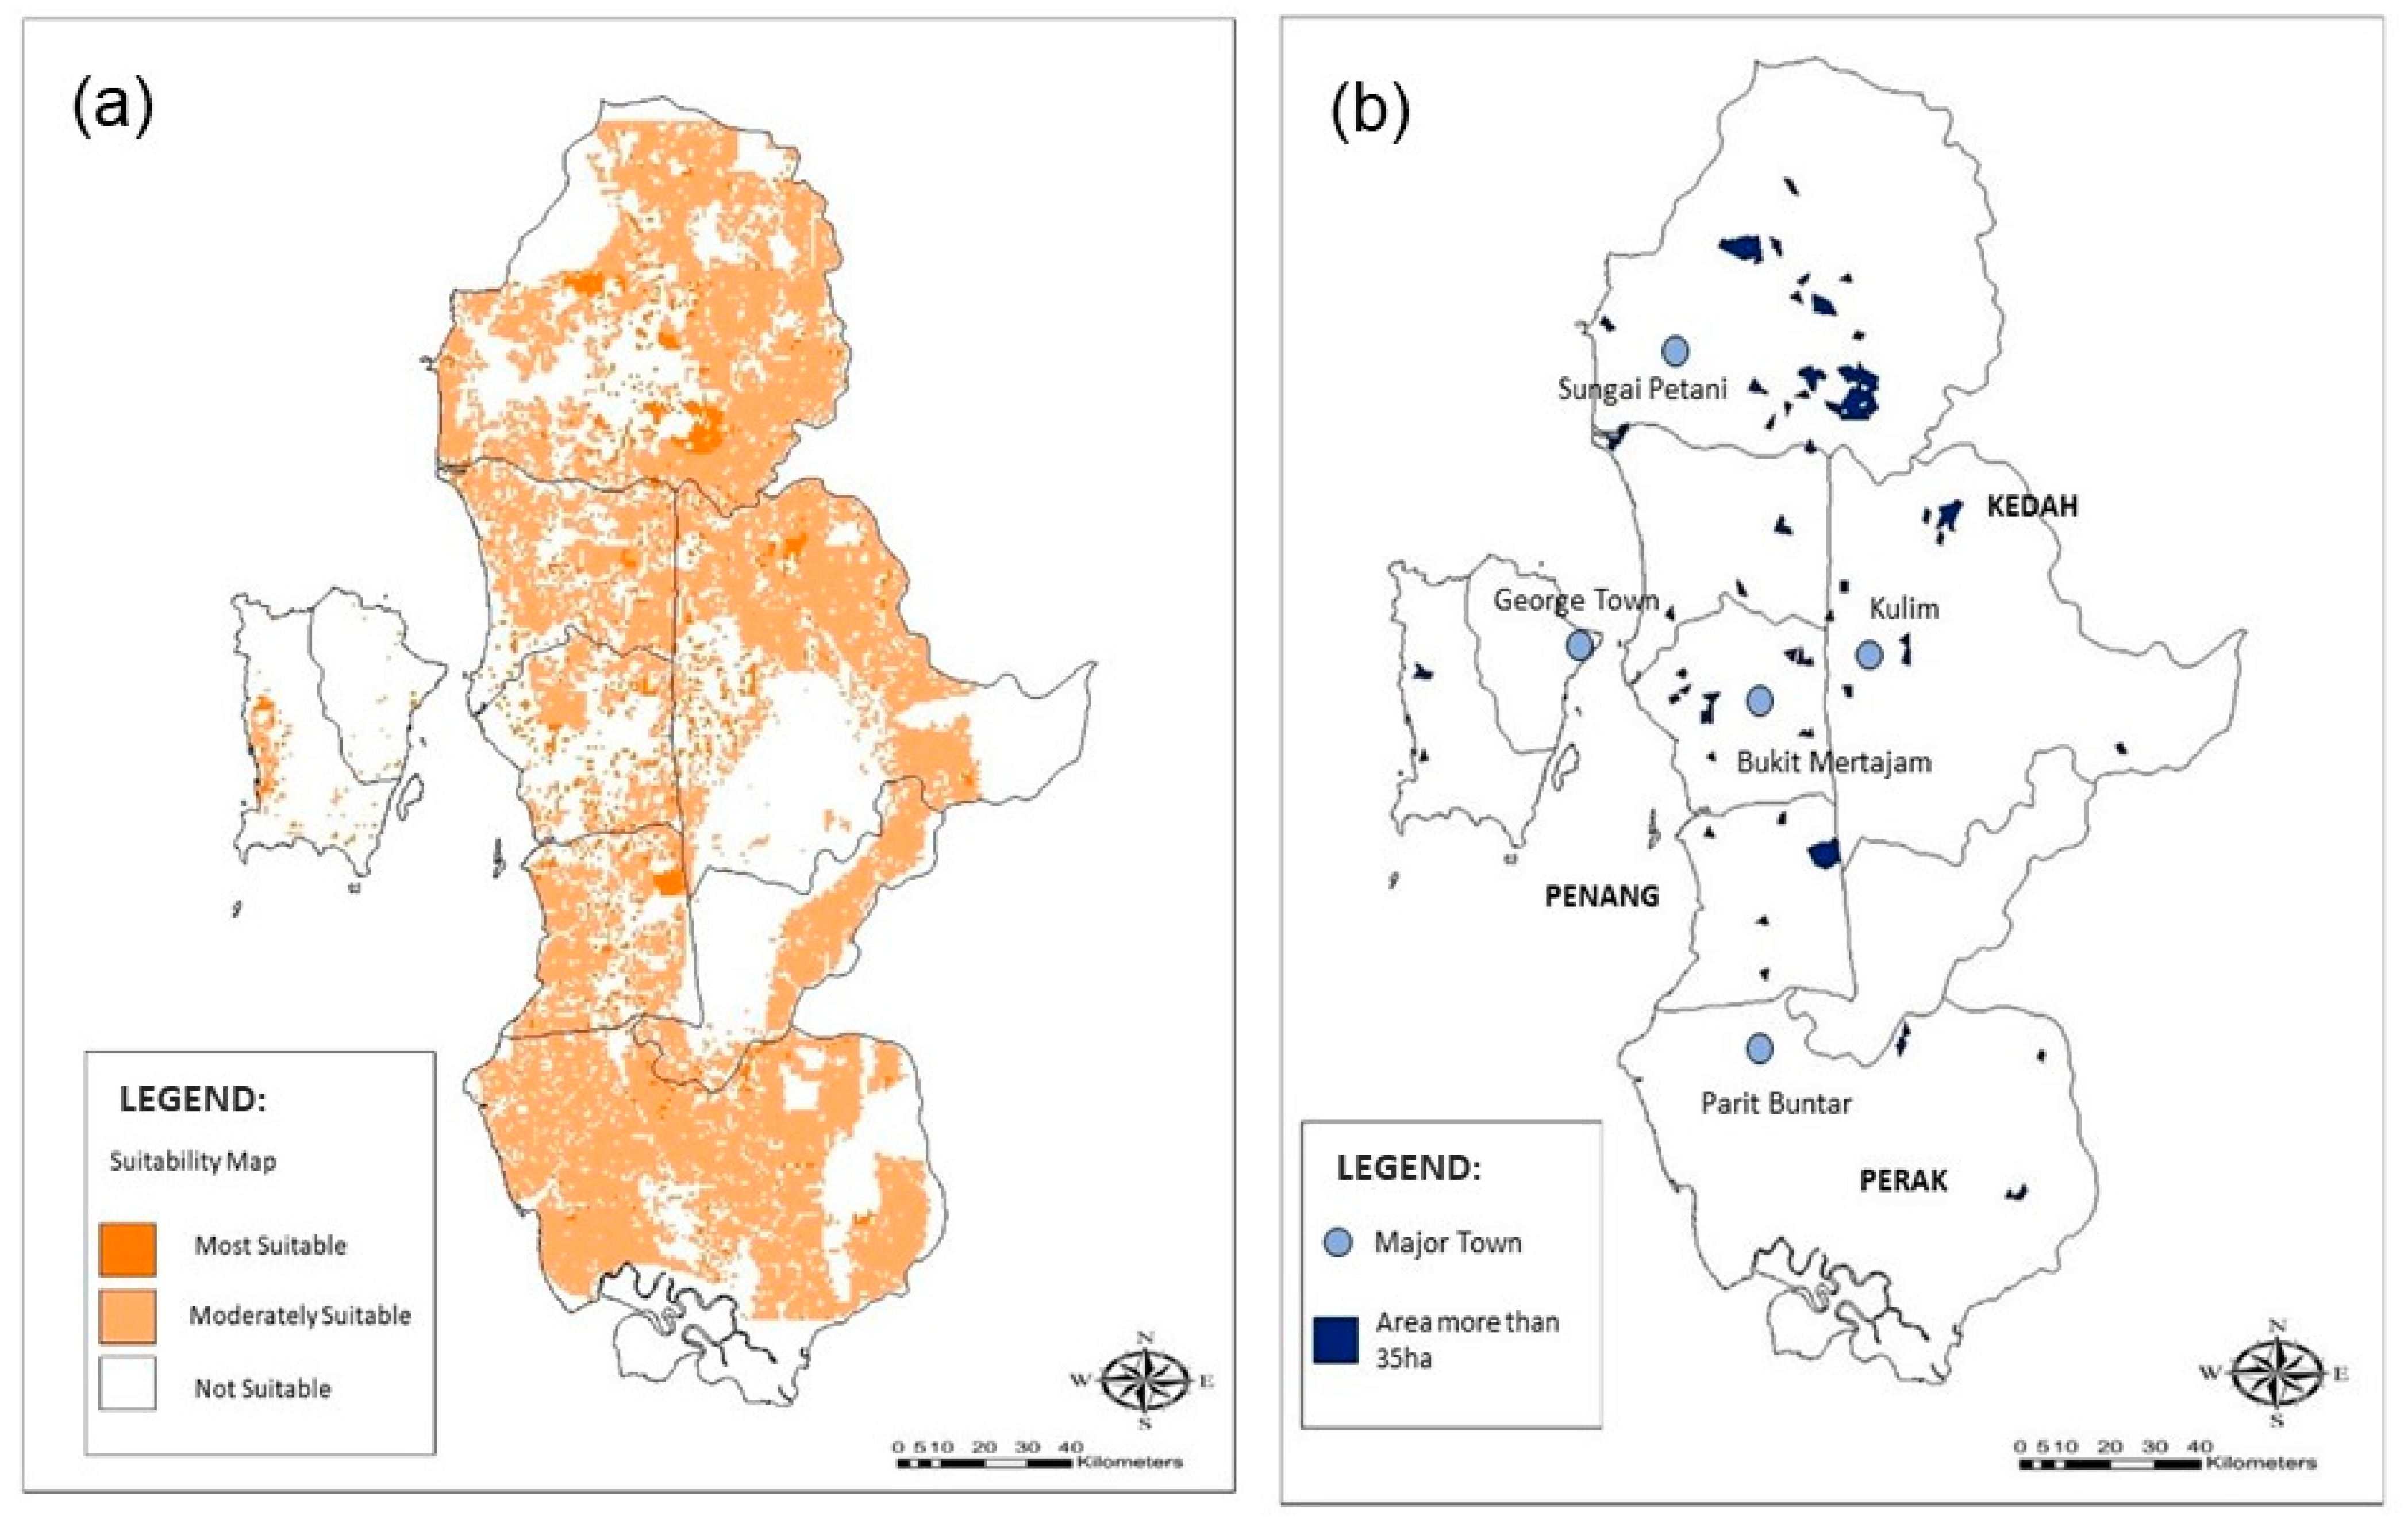
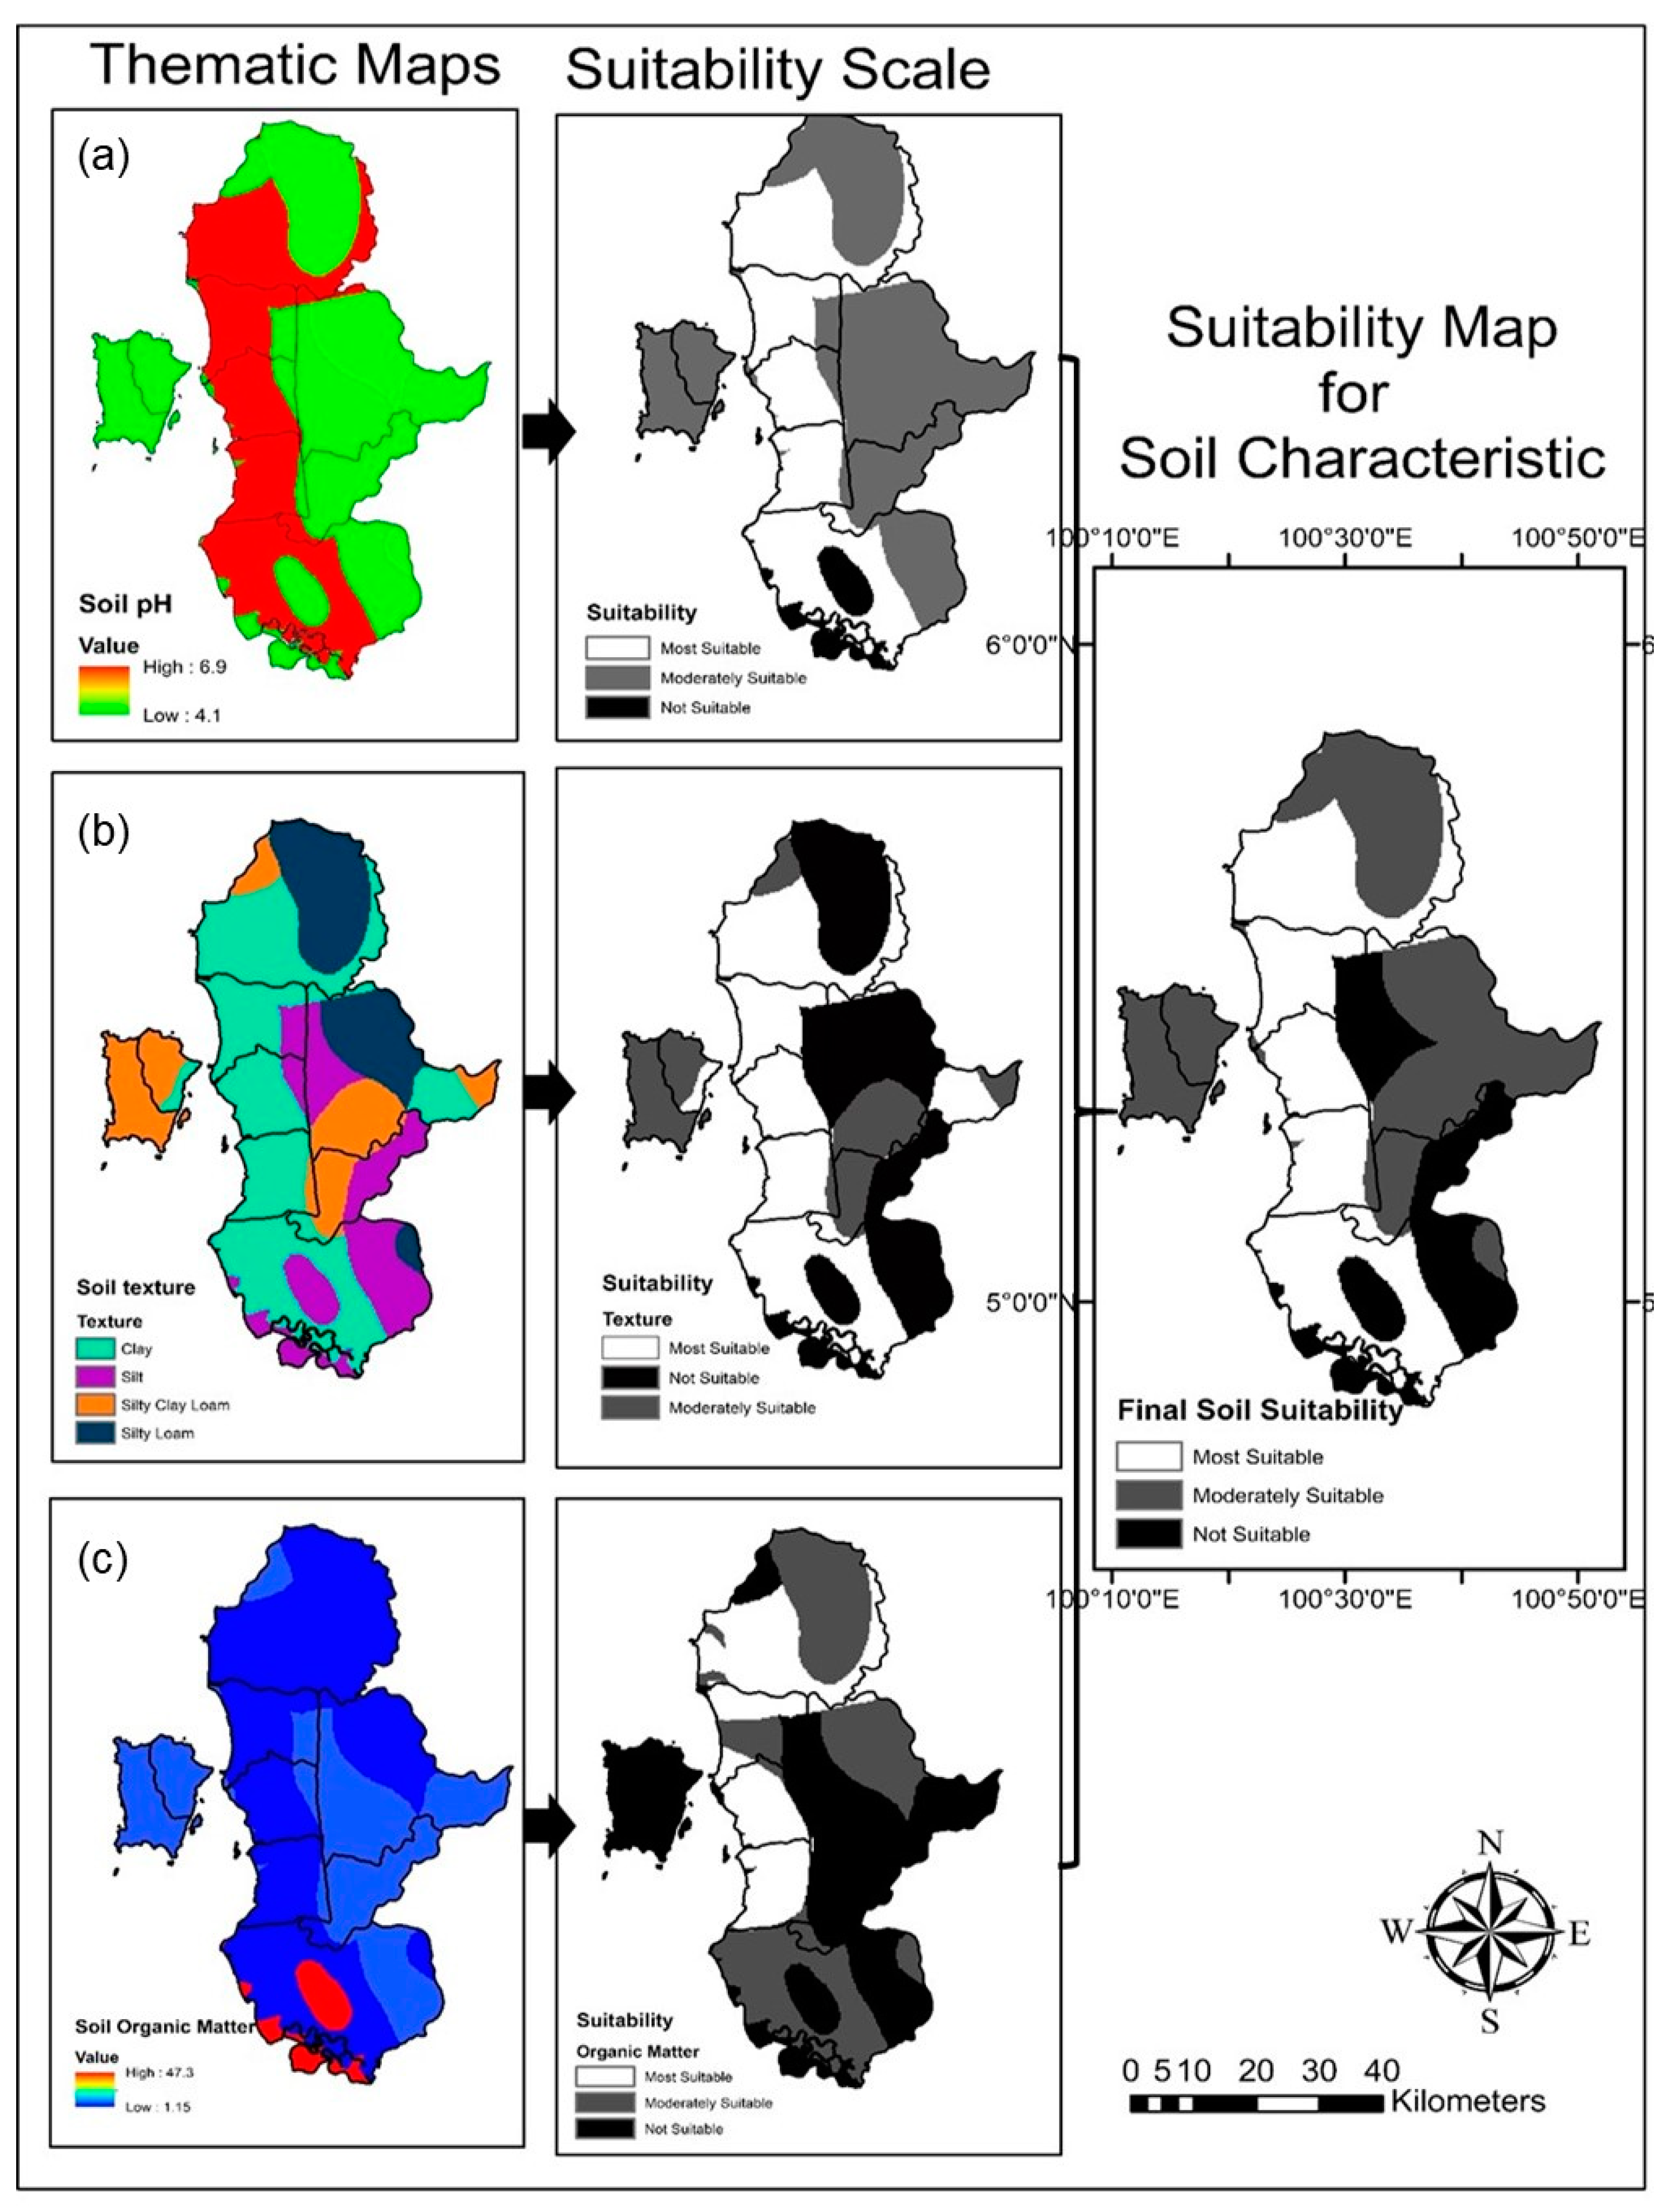
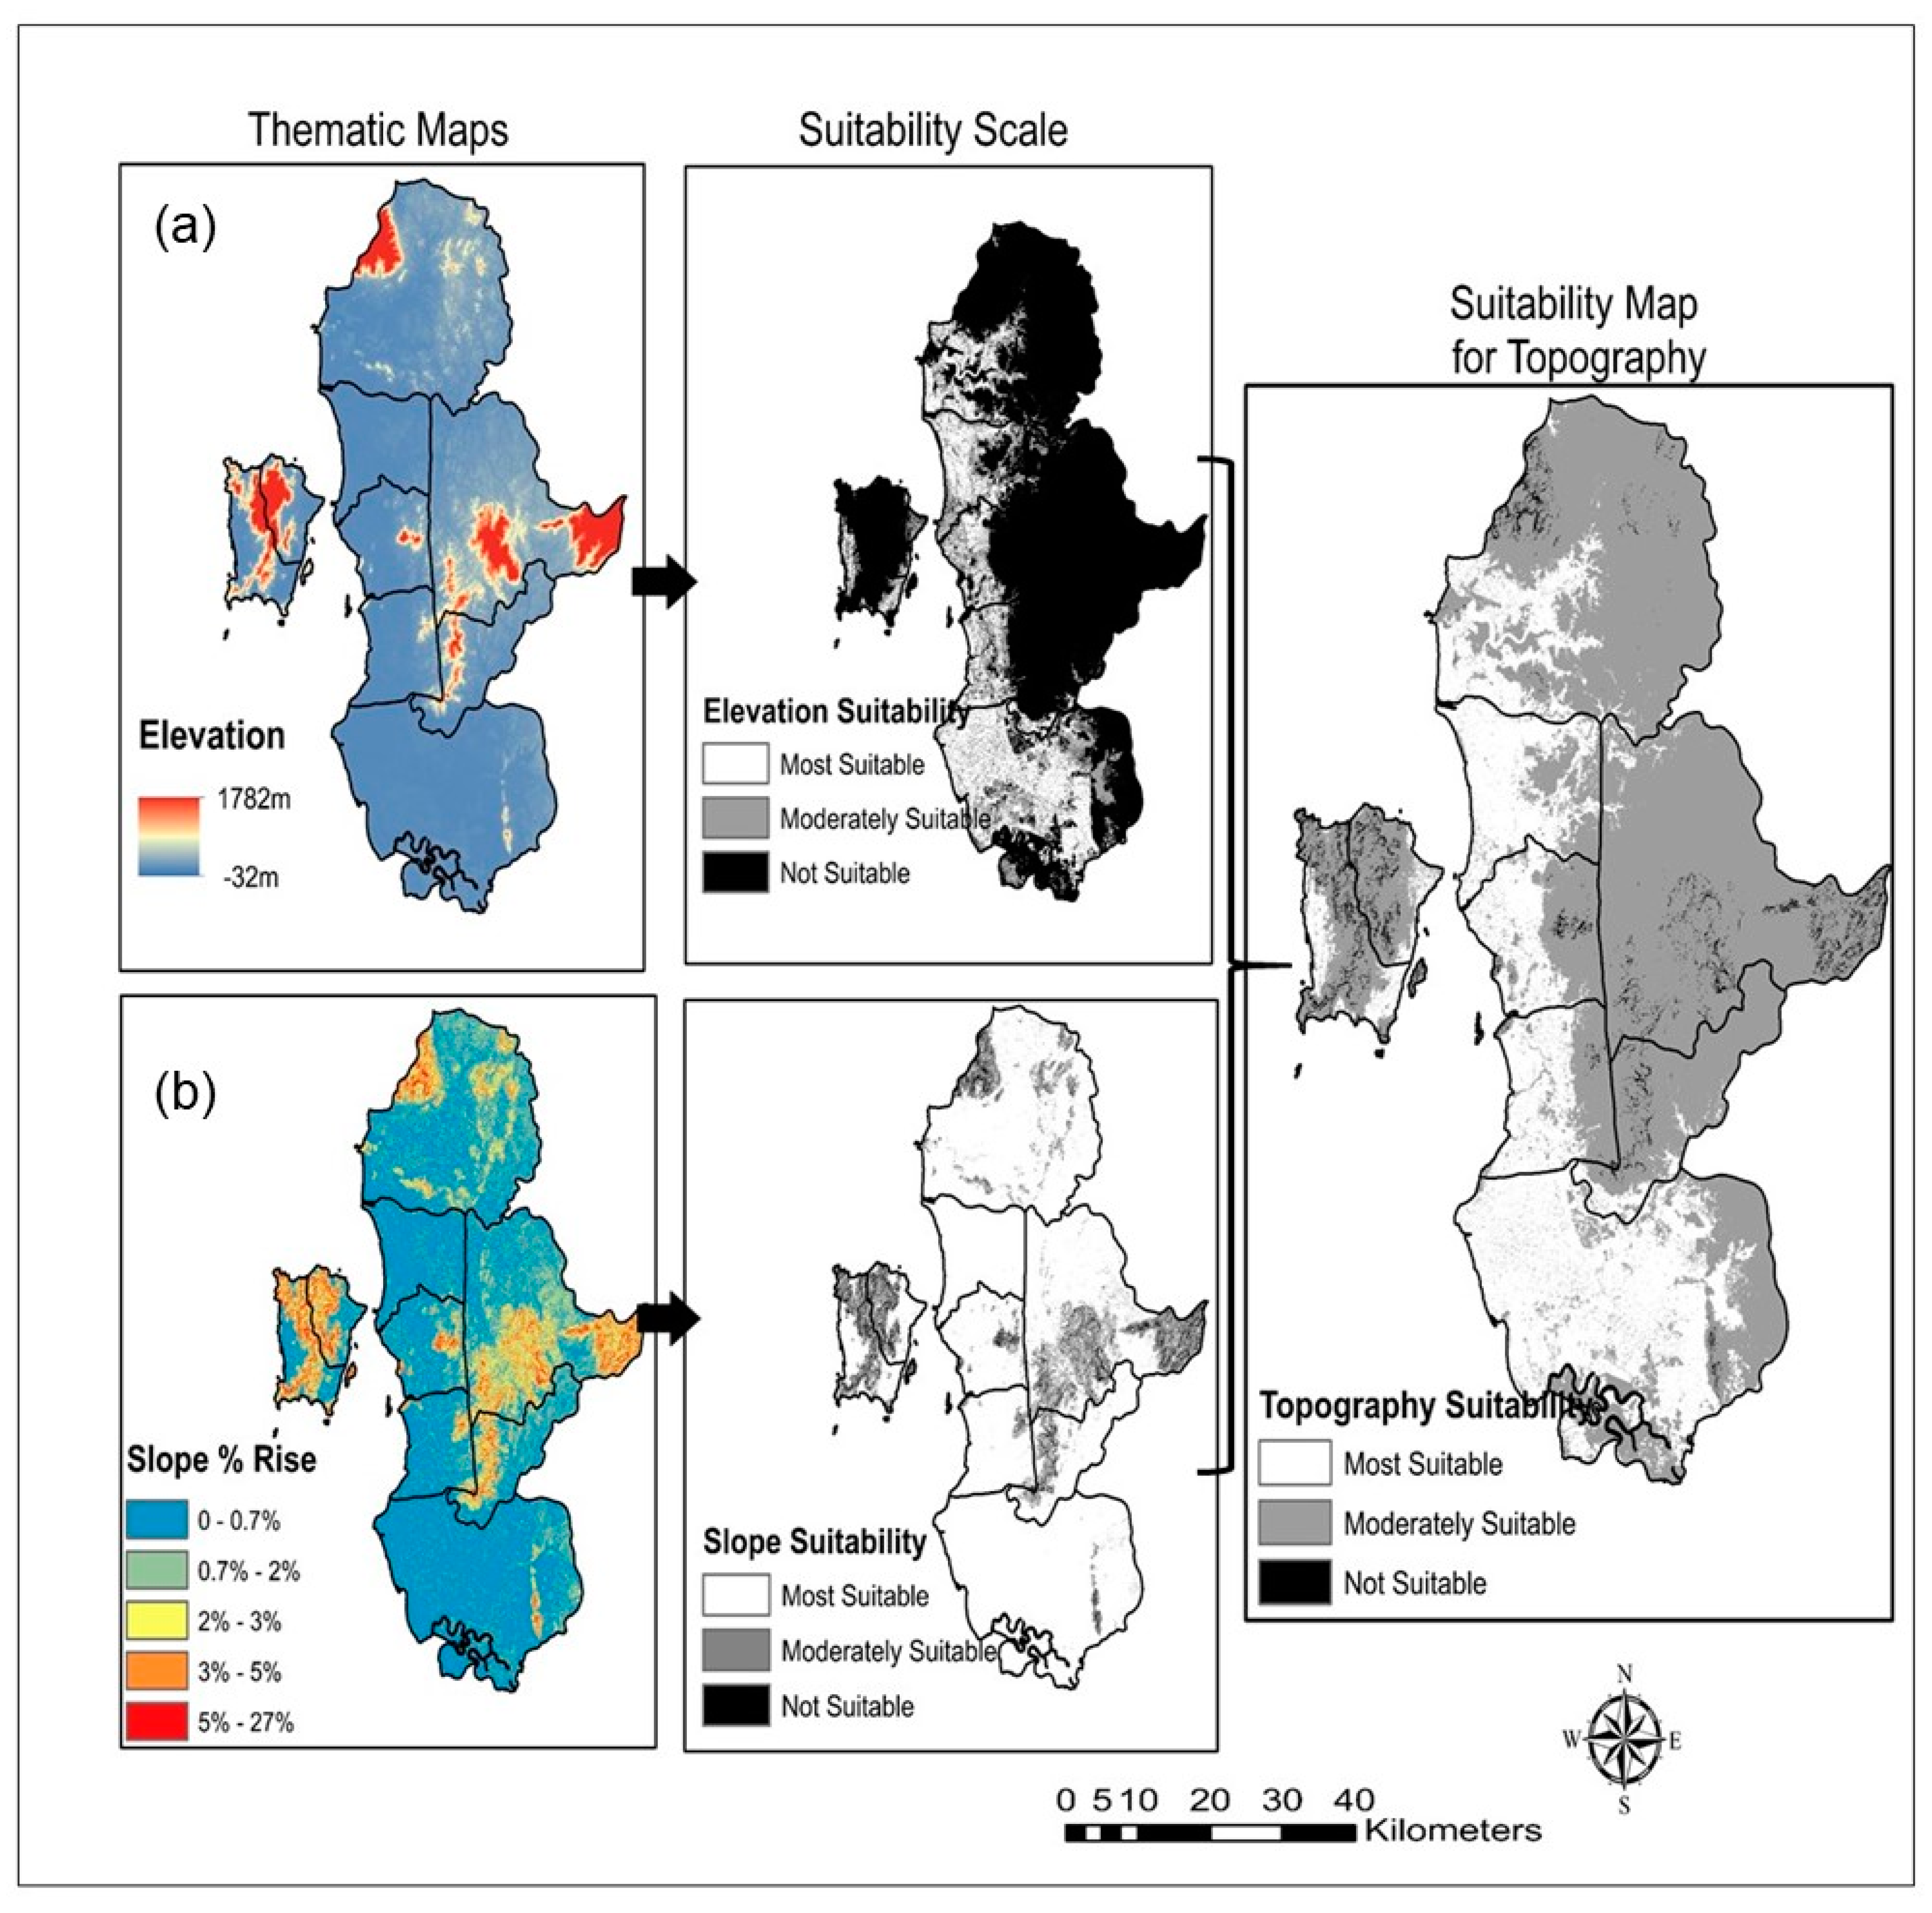
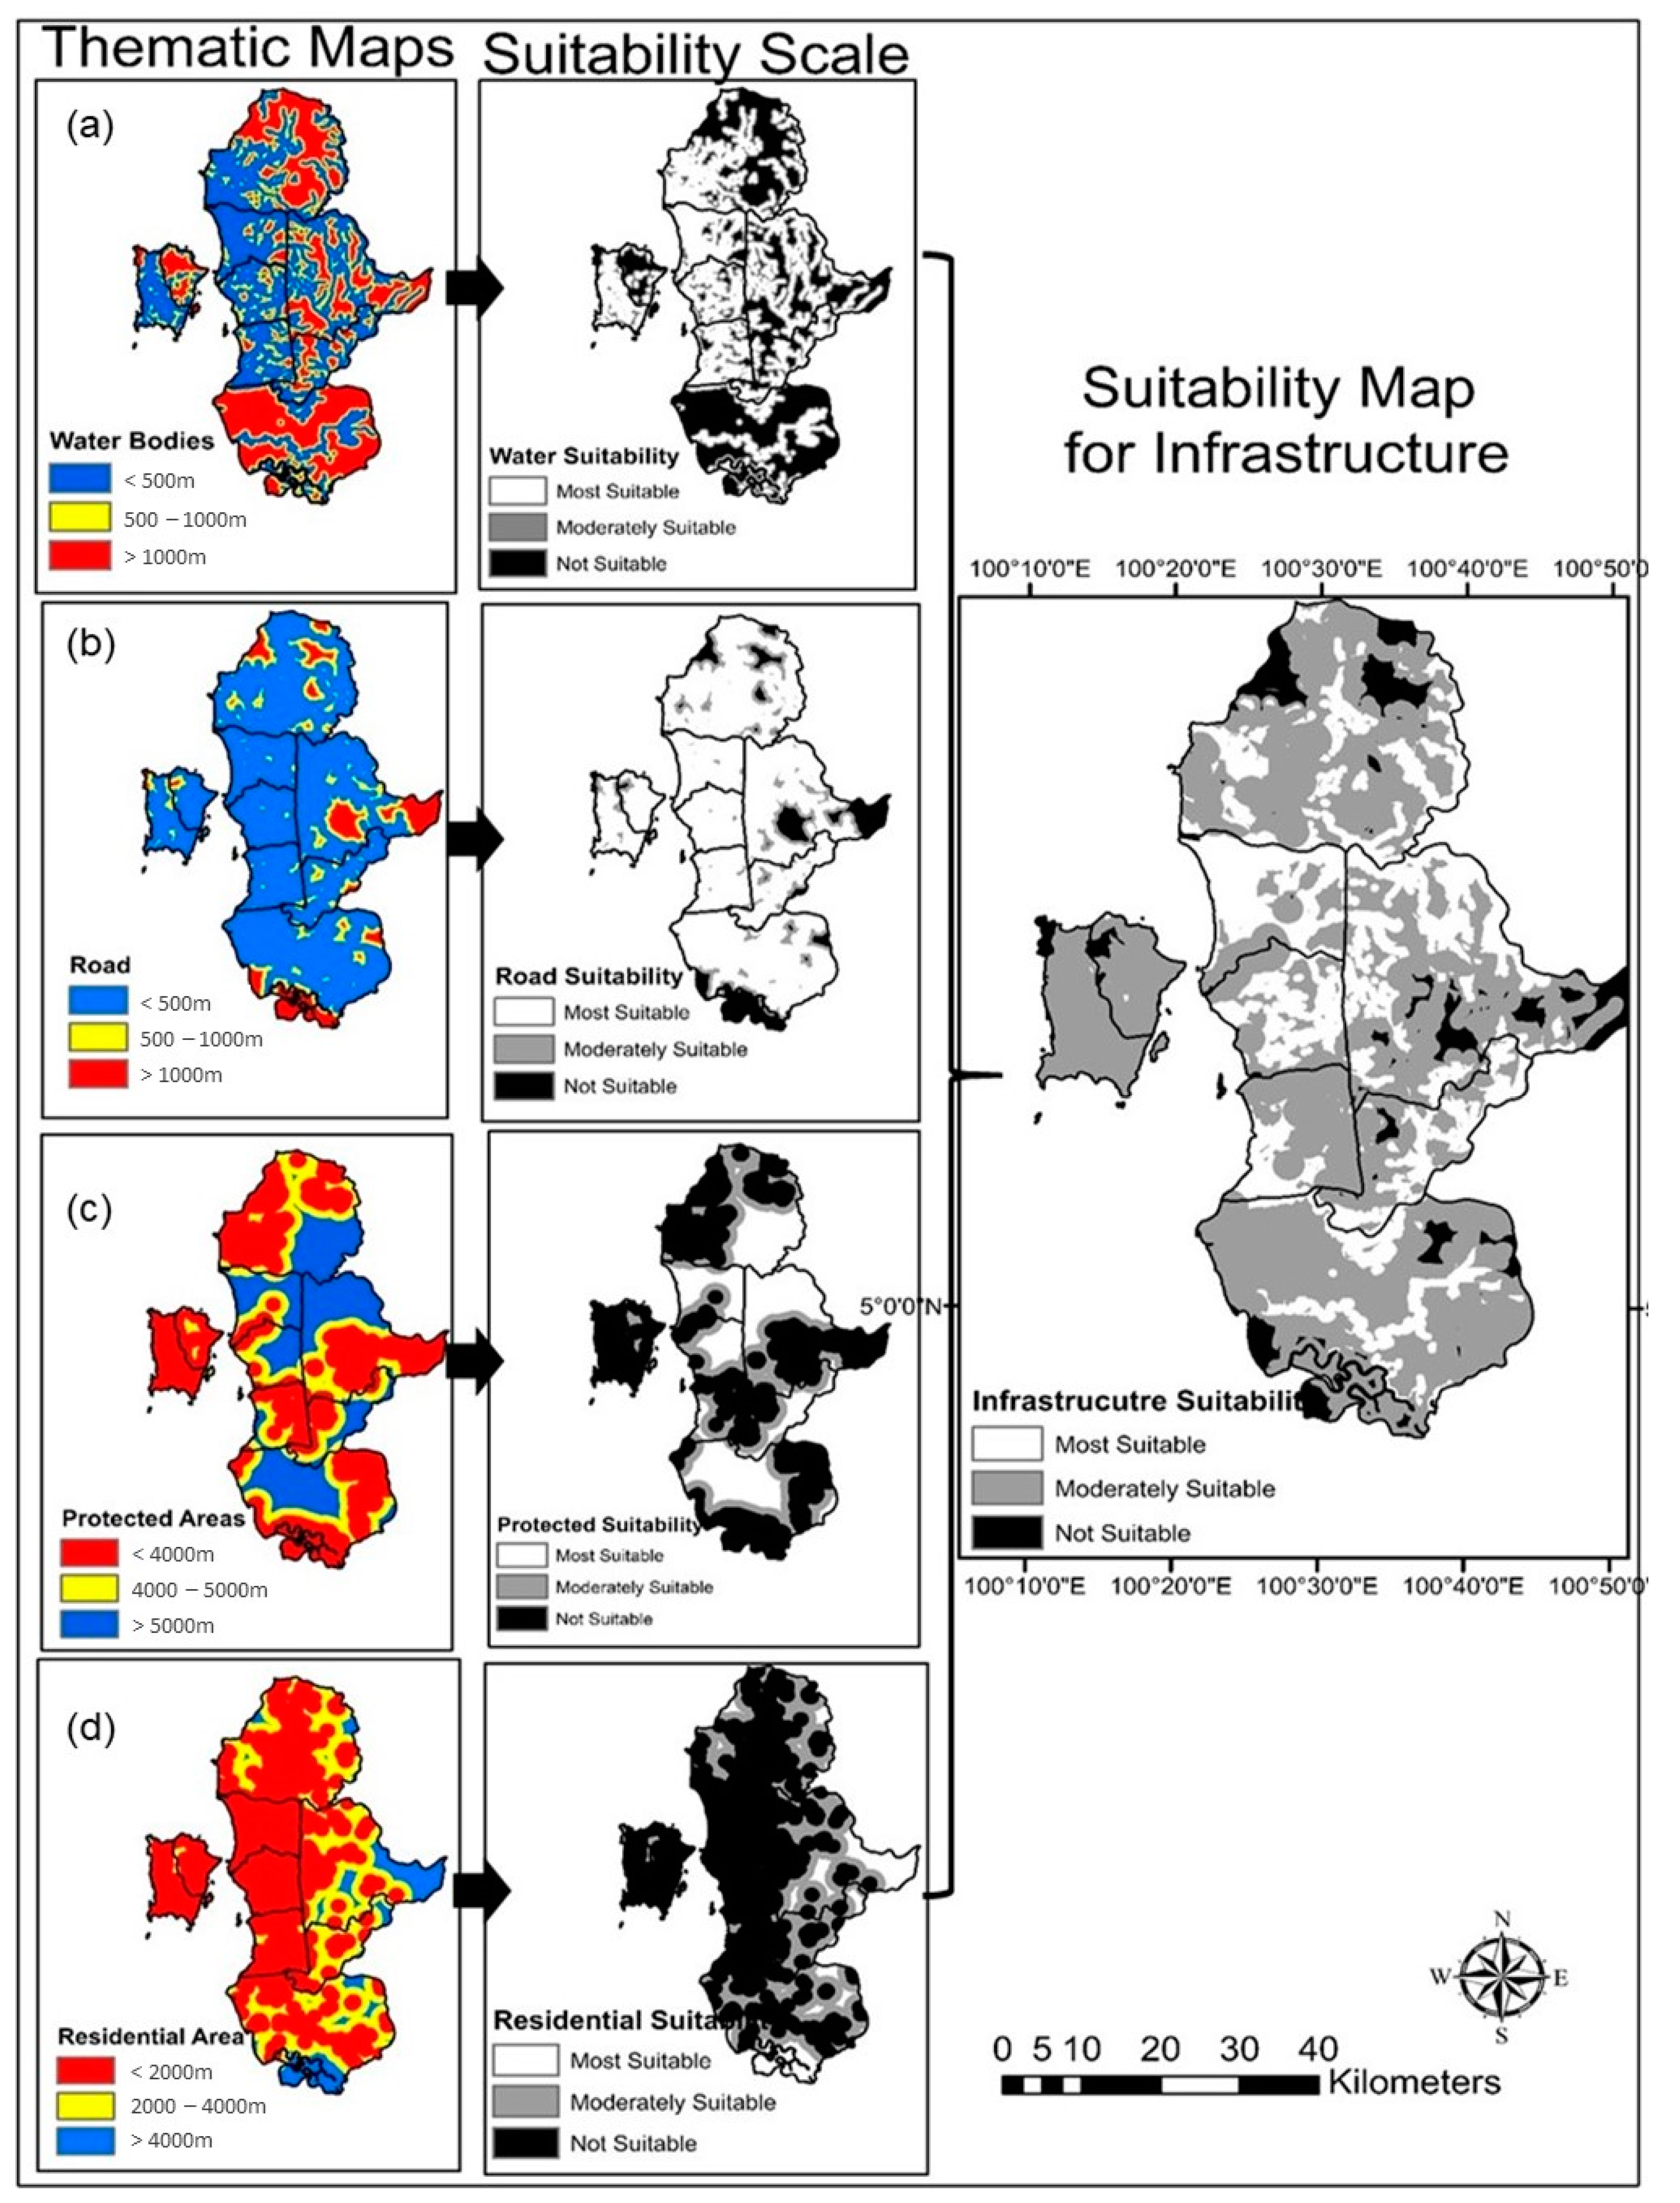
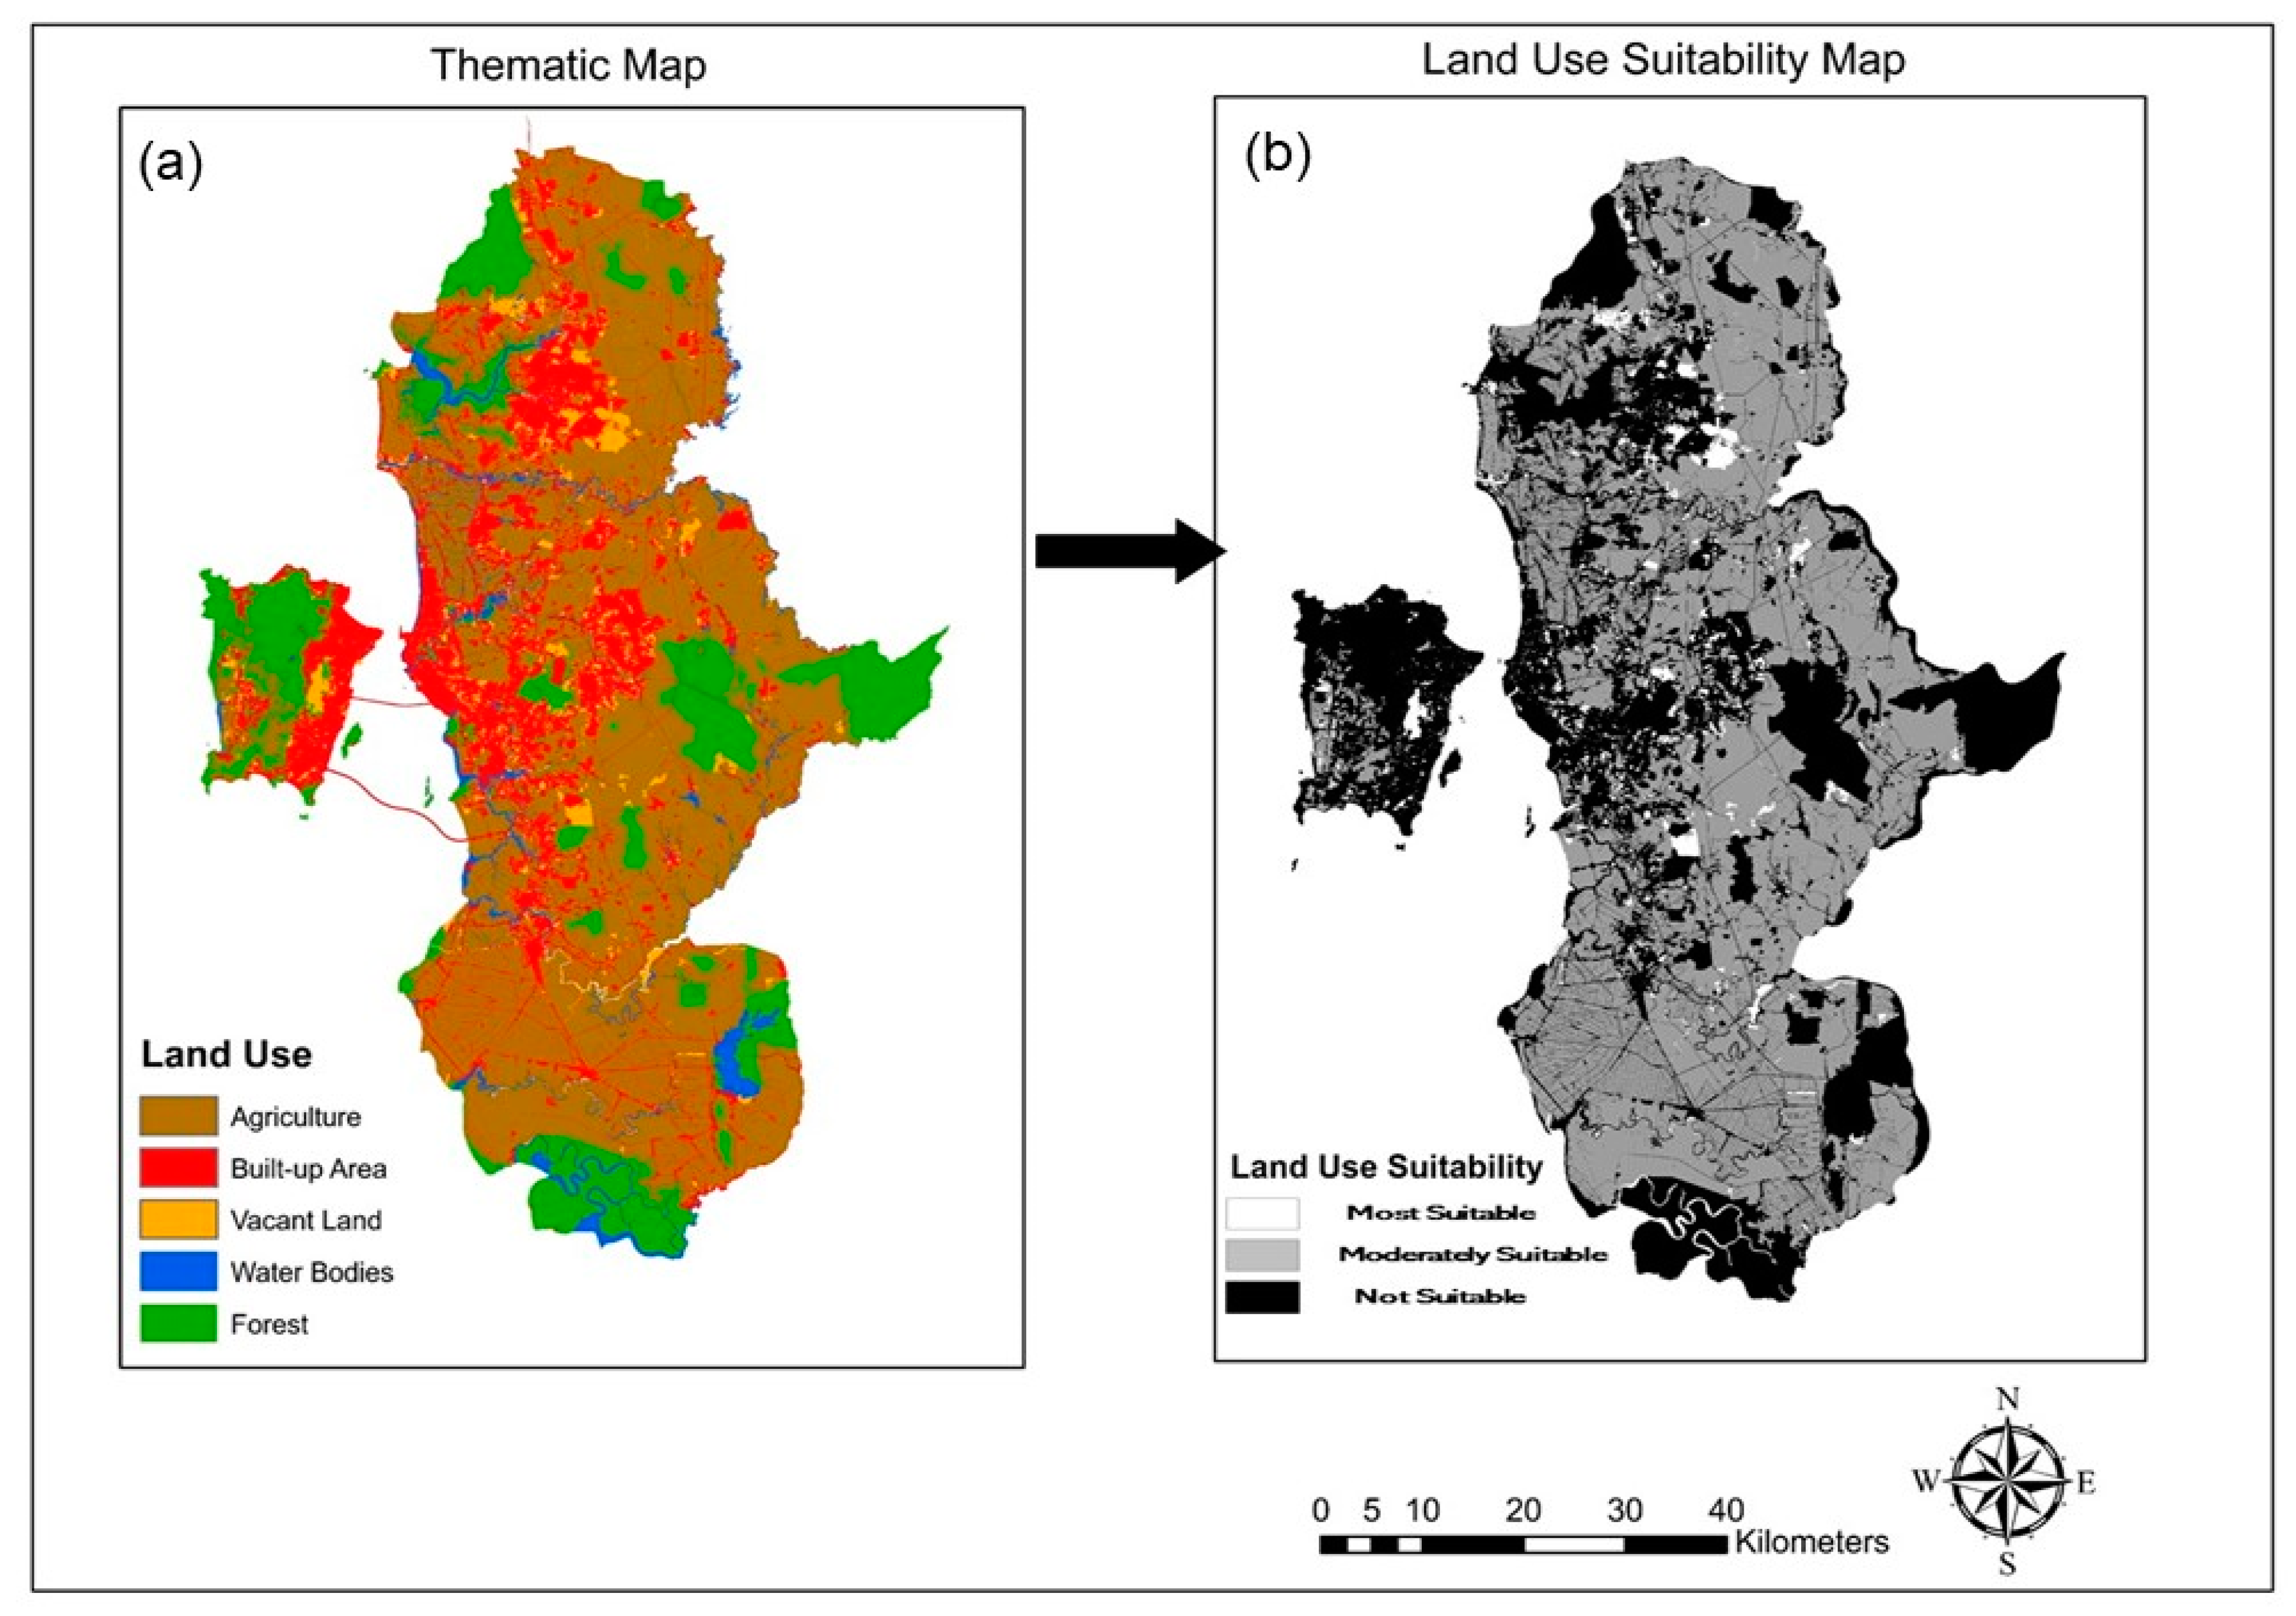
Model validation is vital for quality control of specific data and for testing the output of the models [20]. The model validation was carried out by comparing the existing aquaculture farm with the predicted suitable site location. The model is considered acceptable when more than 60% of the existing farm lies in a suitable site identified through the analysis.

3. Results

Remote sensing and GIS were used to identify the appropriate sites for establishing aquaculture farms in George Town Conurbation. According to the AHP model, soil organic matter has the highest importance (30%) for soil quality suitability maps than other soil quality parameters. In the case of infrastructure facilities, water sources scored the highest importance (40%) in comparison to the other parameters included. Land use has the most critical decision role (60%) compared to soil quality (30%) and infrastructural facilities (10%) for aquaculture development in the study area. Thematic maps were prepared for all the criteria chosen and reclassified into a map with cell values ranging from 1 to 3. Finally, soil quality and infrastructure facilities suitability were prepared based on Equations (3) and (4), as presented in Figure 3, Figure 4 and Figure 5.
For land-use classification, built-up area, water bodies and forest are classified into a non-suitable location to be considered in identifying a suitable site for aquaculture farm establishment. These three types of land use encompass about 93.10% of the total area in the study area, signifying that 93.10% of the area in George Town Conurbation prohibits aquaculture farm development. However, there are still trade-offs for water bodies and built-up areas depending upon each criterion’s weightage. The forest covers about 1.28% of the area’s total area, signifying that this area is strictly prohibited from any development. Since 1972, the Penang State Forestry Department [37] has never granted anyone a license for any economic development in the forest area. The Department of Town and Country Planning Malaysia recommended that a green buffer of 5000 m be allocated around the reserved forest [38]. This green buffer forbids the development of road, drain and trench, river and lake, car park, open space, service building and small agriculture plot including aquaculture pond. A buffer of 4000 m from the residential area is required; to prevent sewage from seeping into the aquaculture pond and due to space limitation and demand. Domestic waste in urban areas can significantly impact aquaculture farms [22]. Vacant land is classified as the most suitable land for aquaculture development. The main reason is that the installation cost will be minimised due to the absence of an intense land clearing process. The same procedure is applied with the land use map, where a thematic map is created then reclassified into suitability scale, as shown in Figure 6 and Figure 7.
The final suitability map combines all the suitability map, soil suitability, infrastructure facilities suitability and land use suitability. The process of combination is constructed following Equation (5) and presented in Figure 8.
Based on Figure 8a, out of the total area of 1690166.6 ha of the George Town Conurbation region, only 6229.4 ha (0.37%) scores most suitable for aquaculture development. Further selection was made based on the size of the area. As mentioned earlier, the size of the potential site should be than 35 ha to accommodate future needs [37]. Based on the analysis, which comprises 0.31% of the total area in the region. The highlighted site is presented in Figure 8b above. Model validation showed that around 65% of the existing ponds are in the most suitable areas while the others fall under moderately suitable areas. As indicated in Figure 8b above, the most suitable sites are in the northern part of the study area and have good access to the transport network and major town. Other areas are scattered near Bukit Mertajam of Penang, which has a population of more than 1.7 million [3,6].

4. Discussion

The growing global population has increased the demand for protein triggering the aquaculture industry’s expansion. Due to the industry’s rapid expansion, the unplanned and unregulated farm has been established at the cost of environmental stress and subsequent yield failure in the aquaculture farm. In Malaysia, for example, site selection for aquaculture is mainly done using an ad hoc approach based on availability [24,37]. This approach has resulted in environmental impacts such as odour and land-use conflicts, which negatively impacts the community nearby. Furthermore, inland aquaculture naturally competes for space demand with other land users, particularly urbanisation, industry, tourism, and agriculture [39]. Hence, structured spatial planning for aquaculture development should be prioritised to avoid interferences and conflicts of space and water [40]. Proper spatial planning plays a vital role in aquaculture expansion, operation and diversification, affecting success and sustainability and rationalising the land [41].
Several authors have highlighted the importance of integrating RS, GIS, and MCE as a competent tool in assisting strategic decision making for aquaculture’s sustainable development. The implementation of MCE within GIS is used by Mamat et al. [24] to evaluate land suitability for oyster aquaculture in Terengganu, Malaysia; Mustafa et al. [42] utilises GIS technology in the characterisation of land and its suitability for Tilapia farming in Maros Regency, Indonesia; Estigade et al. [43] uses GIS and RS in water environment suitability evaluation for floating cages in Lampung and Hurun Bay. They also conducted a questionnaire survey to obtain water suitability characteristic information for floating net cages. However, the main problem with site selection for aquaculture is the lack of baseline information on the physicochemical and topographic conditions and existing land use patterns [27].
A suitable aquaculture site is affected by many aspects, including environmental (physical, biological and chemical) and socio-economic factors. Due to limited data availability, the site selection model used in this study only focused on several parameters such as soil texture, organic matter soil, soil pH, elevation, slope and some infrastructural facilities. Combining these parameters within a GIS environment enable relevant analysis for decision-makers than one based on individual parameters alone. Despite the extent of favourable locations, the GIS-based model does not imply actual estimates of carrying capacity (either physical, production, ecological or social) within the region but instead identifies locations where there may be maximised for the aquaculture activities [44]. This effort has maintained sustainability by reducing the exploration of unsuitable sites that may impact the environment. Logically, a separate development needs to be located some distance apart to minimise the potential cumulative impacts.
This study is lacking in terms of social factors. It is shown in [25] that indigenous knowledge can support the decision-making process, especially for less developed countries where indigenous knowledge is comprehensively handled and transmitted by communities. Therefore, the MCE method, combined with indigenous knowledge, can assist in the sites selection process by providing stakeholder engagements. Focus group discussion, interviews, or questionnaire surveys should be added to improve the weightage analysis accuracy and ensure an objective criteria selection specific for the study area. The social factor will also incorporate public opinion on an aquaculture farm in a specific location; hence, it would be more valuable.
Considering soil condition in the George Town Conurbation for aquaculture observed 6.7% area with most suitable whereas around 88.2% was moderately suitable. It seems that the study area is moderately suitable for inland aquaculture in terms of soil features. A similar trend is shown by infrastructure facilities suitability, where 0.5% of areas with the most suitable aquaculture location and 99% with moderately suitable. The overall most suitable area for aquaculture potential sites is 0.37%; it is logical as the study area are experiencing an expansion of built-up areas towards urban fringe areas; hence less land become available for aquaculture area. This study reveals that even though Penang is one of Malaysia’s primary aquaculture producers, thorough and structured spatial planning is essential for this industry’s future in Penang. A reasonable buffer zone should be designated as a boundary between urban development and aquaculture to avoid land-use conflict between the two activities. Although the approach used manages to show potential sites for aquaculture, it should be noted that the robustness of the result has not been analysed. Therefore, further study should include sensitivity analysis such as using a jackknifing approach which can potentially be used to evaluate the change in comparison matrix weights on the result.

5. Conclusions

The application of GIS in identifying the suitable potential sites for aquaculture farms shows that it works effectively. As expected, only a small number of areas (0.37%) in the Georgetown Conurbation had high suitability scores for the aquaculture farm establishment. In the George Town Conurbation for aquaculture, soil conditions were most favourable in 6.7% of the area, while somewhat suitable in 88.2%. In terms of soil characteristics, the research area appears to be relatively favourable for inland aquaculture. Infrastructure facility suitability follows a similar pattern, with 0.5% of places having the most favourable aquaculture setting and 99% having moderately suitable. The small number of suitable sites can be explained by the current urban expansion of the study area, hence less land suitable for aquaculture farms. GIS is indeed a powerful modelling tool for site selection decision making. The usefulness of GIS will be more significant as data availability increases.

Author Contributions

Conceptualization, P.N.A.B. and N.S.; methodology, P.N.A.B. and N.S.; software, P.N.A.B.; validation, P.N.A.B., N.S. and M.A.M.; formal analysis, P.N.A.B.; writing—original draft preparation, P.N.A.B. and N.S.; writing—review and editing, M.A.M. and M.L.T.; visualization, P.N.A.B. and M.A.M.; supervision, N.S. and N.W.C.; project administration, N.S., M.L.T. and N.W.C.; funding acquisition, N.W.C. and M.L.T. All authors have read and agreed to the published version of the manuscript.

Funding

The financial support of the Long-Term Research Grant Scheme (LRGS/1/2018/USM/01/1/5) (203/PHIMANITI/67215003), which is supported by the Ministry of Higher Education Malaysia.

Institutional Review Board Statement

Not applicable.

Informed Consent Statement

Not applicable.

Data Availability Statement

The data presented in this study are available on request from the corresponding author.

Acknowledgments

The authors also acknowledge the United States Geological Survey, FAO, Plan Malaysia and Malaysia Geospatial Data Infrastructure (MyGDI), for supplying geospatial data to this study.

Conflicts of Interest

The authors declare no conflict of interest.

References

  1. Naylor, R.L.; Hardy, R.W.; Buschmann, A.H.; Bush, S.R.; Cao, L.; Klinger, D.H.; Little, D.C.; Lubchenco, J.; Shumway, S.E.; Troell, M. A 20-year retrospective review of global aquaculture. Nature 2021, 591, 551–563. [Google Scholar] [CrossRef]
  2. Food and Agriculture Organization—FAO. The State of World Fisheries and Aquaculture 2020: Sustainability in Action. Available online: https://doi.org/10.4060/ca9229en (accessed on 19 March 2020).
  3. Samat, N.; Mahamud, M.A. Simulating urban growth in the george town conurbation. J. Fundam. Appl. Sci. 2017, 9, 144–156. [Google Scholar]
  4. White, P. Aquaculture Pollution: An Overview of Issues with a Focus on China, Vietnam, and the Philippines; World Bank: Washington, DC, USA, 2017; Volume 52. [Google Scholar]
  5. Nurfadillah, N.; Dewiyanti, I.; Yunizar, S.; Mellisa, S.; Arisa, I.I. Suitability analysis of aquaculture ponds based on primary productivity parameters in Mangrove Area of Banda Aceh. IOP Conf. Ser. Earth Environ. Sci. 2020, 493, 012019. [Google Scholar] [CrossRef]
  6. Samat, N.; Mahamud, M.A. Urbanisation in the George Town conurbation and its impact to the environment. Int. J. Environ. Eng. 2018, 9, 240–253. [Google Scholar] [CrossRef]
  7. Edwards, P. Aquaculture environment interactions: Past, present and likely future trends. Aquaculture 2015, 447, 2–14. [Google Scholar] [CrossRef]
  8. Kokou, F.; Fountoulaki, E. Aquaculture waste production associated with antinutrient presence in common fish feed plant ingredients. Aquaculture 2018, 495, 295–310. [Google Scholar] [CrossRef]
  9. Mungkung, R.; Aubin, J.; Prihadi, T.H.; Slembrouck, J.; Van Der Werf, H.M.G.; Legendre, M. Life Cycle Assessment for Environmentally Sustainable Aquaculture Management: A Case Study of Combined Aquaculture Systems for Carp and Tilapia. J. Clean. Prod. 2013, 57, 249–256. [Google Scholar] [CrossRef]
  10. Sampantamit, T.; Ho, L.; Lachat, C.; Sutummawong, N.; Sorgeloos, P.; Goethals, P. Aquaculture production and its environmental sustainability in thailand: Challenges and potential solutions. Sustainability 2020, 12, 2010. [Google Scholar] [CrossRef] [Green Version]
  11. White, P.G. Environmental consequences of poor feed quality and feed management: On-farm feeding and feed management. Aquaculture 2013, 100, 553–564. [Google Scholar]
  12. Crawford, C.; Macleod, C. Predicting and assessing the environmental impact of aquaculture. In New Technologies in Aquaculture: Improving Production Efficiency, Quality and Environmental Management; Woodhead Publishing Limited: Oxford, UK; Cambridge, UK; New Delhi, India, 2009; pp. 679–706. [Google Scholar]
  13. Gentry, R.R.; Lester, S.E.; Kappel, C.V.; White, C.; Bell, T.W.; Stevens, J.; Gaines, S.D. Offshore aquaculture: Spatial planning principles for sustainable development. Ecol. Evol. 2017, 7, 733–743. [Google Scholar] [CrossRef] [PubMed]
  14. Lester, S.E.; Stevens, J.M.; Gentry, R.R.; Kappel, C.V.; Bell, T.W.; Costello, C.J.; Gaines, S.D.; Kiefer, D.A.; Maue, C.C.; Rensel, J.E.; et al. Spatial planning makes room for offshore aquaculture in crowded coastal waters. Nat. Communed. 2018, 9, 1–13. [Google Scholar] [CrossRef] [PubMed] [Green Version]
  15. Shahbudin, S.; Zuhairi, A.; Kamaruzzaman, B.Y. Impact of Coastal development on mangrove cover in Kilim River, Langkawi Island, Malaysia. J. For. Res. 2012, 23, 185–190. [Google Scholar] [CrossRef]
  16. Luo, Z.; Hu, S.; Chen, D. The trends of aquacultural nitrogen budget and its environmental implications in China. Sci. Rep. 2018, 8, 1–9. [Google Scholar] [CrossRef] [PubMed]
  17. Food and Agriculture Organization—FAO. Mangroves of Asia 1980–2005: Country reports. In Forest Resources Assessment Programme Working Paper; FAO: Rome, Italy, 2007; Volume 137. [Google Scholar]
  18. Radiarta, I.N.; Saitoh, S.I.; Yasui, H. Aquaculture site selection for Japanese kelp (Laminaria japonica) in Southern Hokkaido, Japan, using satellite remote sensing and GIS-based models. ICES J. Mar. Sci. 2011, 68, 773–780. [Google Scholar] [CrossRef] [Green Version]
  19. Falconer, L.; Middelboe, A.L.; Kaas, H.; Ross, L.G.; Telfer, T.C. Use of geographic information systems for aquaculture and recommendations for development of spatial tools. Aquaculture 2020, 12, 664–677. [Google Scholar] [CrossRef] [Green Version]
  20. Radiarta, I.N.; Saitoh, S.; Miyazono, A. GIS-based multi-criteria evaluation models for identifying suitable sites for Japanese scallop (Mizuhopecten yessoensis) aquaculture in Funka Bay, southwestern Hokkaido, Japan. Aquaculture 2008, 284, 127–135. [Google Scholar] [CrossRef]
  21. Longley, P.A.; Goodchild, M.F.; Maguire, D.J.; Rhind, D.W. Geographic Information Science and Systems; John Wiley & Sons: Hoboken, NJ, USA, 2015. [Google Scholar]
  22. Giap, D.H.; Yi, Y.; Yakupitiyage, A. GIS for land evaluation for shrimp farming in Haiphong of Vietnam. Ocean Coast. Manag. 2005, 48, 51–63. [Google Scholar] [CrossRef]
  23. Landucci, F.S.; Rodrigues, D.F.; Fernandes, A.M.; Scott, P.C.; Poersch, L.H.S. Geographic information system as an instrument to determine suitable areas and identify suitable zones to the development of emerging marine finfish farming in Brazil. Aquac. Res. 2020, 51, 3305–3322. [Google Scholar] [CrossRef]
  24. Mamat, N.; Rasam, A.R.A.; Adnan, N.A.; Abdullah, I.C. GIS-based multi-criteria decision making system for determining potential site of oyster aquaculture in Terengganu. In Proceedings of the IEEE 10th International Colloquium on Signal Processing and Its Applications (CSPA), Kuala Lumpur, Malaysia, 7–9 March 2014; pp. 71–76. [Google Scholar]
  25. Yin, S.; Takeshige, A.; Miyake, Y.; Kimura, S. Selection of suitable coastal aquaculture sites using multi-criteria decision analysis in Menai Strait, UK. Ocean Coast. Manag. 2018, 165, 268–279. [Google Scholar] [CrossRef]
  26. Nayak, A.K.; Kumar, P.; Pant, D.; Mohanty, R.K. Land Suitability modelling for enhancing fishery resource development in Central Himalayas (India) using GIS and multi-criteria evaluation approach. Aquac. Eng. 2018, 83, 120–129. [Google Scholar] [CrossRef]
  27. Esmaeilpour-Poodeh, S.; Ghorbani, R.; Hosseini, S.A.; Salmanmahiny, A.; Rezaei, H.; Kamyab, H. A multi-criteria evaluation method for sturgeon farming site selection in the southern coasts of the Caspian Sea. Aquaculture 2019, 513, 734416. [Google Scholar] [CrossRef]
  28. Beard, K.; Kimble, M.; Yuan, J.; Evans, K.S.; Liu, W.; Brady, D.; Moore, S. A method for heterogeneous spatio-temporal data integration in support of marine aquaculture site selection. J. Mar. Sci. Eng. 2020, 8, 96. [Google Scholar] [CrossRef] [Green Version]
  29. Yunis, C.R.C.; López, R.S.; Cruz, S.M.O.; Castillo, E.B.; López, J.O.S.; Trigoso, D.I.; Briceño, N.B.R. Land suitability for sustainable aquaculture of rainbow trout (Oncorhynchus mykiss) in Molinopampa (Peru) based on RS, GIS, and AHP. ISPRS Int. J. Geo-Inf. 2020, 9, 28. [Google Scholar] [CrossRef] [Green Version]
  30. Ghobadi, M.; Nasri, M.; Ahmadipari, M. Land suitability assessment (LSA) for aquaculture site selection via an integrated GIS-DANP multi-criteria method: A case study of lorestan Province, Iran. Aquaculture 2021, 530, 735776. [Google Scholar] [CrossRef]
  31. Eastman, J.R. Multi-criteria evaluation and GIS. In Geographical Information Systems; Goodchild, M.F., Maguire, D.J., Rhind, D.W., Longley, P.A., Eds.; John Wiley and Sons: New York, NY, USA, 1999; pp. 493–502. [Google Scholar]
  32. Cardia, F.; Ciattaglia, A.; Corner, R. Guidelines and Criteria on Technical and Environmental Aspects of Cage Aquaculture Site Selection in the Kingdom of Saudi Arabia; Food and Agriculture Organization of the United Nations: Rome, Italy, 2017; (English Version). [Google Scholar]
  33. United States Geological Survey—USGS. Earth Explorer. Available online: https://earthexplorer.usgs.gov/ (accessed on 19 March 2020).
  34. FAO; UNESCO. Soil Map of The World: South East Asia. Soil Map World; FAO: Rome, Italy, 1979; Volume 9. Available online: http://www.fao.org/soils-portal/data-hub/soil-maps-and-databases/faounesco-soil-map-of-the-world/en/ (accessed on 15 August 2021).
  35. Hossain, M.S.; Chowdhury, S.R.; Das, N.G.; Sharifuzzaman, S.M.; Sultana, A. integration of GIS and multi-criteria decision analysis for urban aquaculture development in Bangladesh. Landsc. Urban Plan. 2009, 90, 119–133. [Google Scholar] [CrossRef]
  36. Saaty, T.L. How to make a decision: The analytic hierarchy process. Eur. J. Oper. Res. 1990, 48, 9–26. [Google Scholar] [CrossRef]
  37. Penang State of Forestry Department. Available online: https://jhn.penang.gov.my/index.php/en/ (accessed on 19 March 2020).
  38. Pathansali, D.; Zainol, S. National Plan for Development of Aquaculture in Malaysia. Available online: http://www.fao.org/3/X5629E/x5629e0h.htm (accessed on 19 March 2020).
  39. Chahinez, L.; Abderrahim, H.; El Islem, B.N. Site selection for finfish cage farming using spatial multi-criteria evaluation and their validation at field in the bay of Souahlia (Algeria). Aquac. Int. 2020, 28, 2419–2436. [Google Scholar] [CrossRef]
  40. Perez, O.M.; Telfer, T.C.; Ross, L.G. Geographical information systems-based models for offshore floating marine fish cage aquaculture site selection in Tenerife, Canary Islands. Aquac. Res. 2005, 36, 946–961. [Google Scholar] [CrossRef]
  41. Vafaie, F.; Hadipour, A.; Hadipour, V. GIS-based fuzzy multi-criteria decision making model for coastal aquaculture site selection. Environ. Eng. Manag. J. 2015, 14, 2415–2426. [Google Scholar] [CrossRef]
  42. Mustafa, A.; Asaad, A.I.J.; Rimmer, M.A. Land characteristics and suitability for tilapia culture at different seasons in brackish water ponds of Bontoa Subdistrict, Maros Regency, Indonesia. IOP Conf. Ser. Earth Environ. Sci. 2020, 473, 012072. [Google Scholar] [CrossRef]
  43. Estigade, A.P.; Astuti, A.P.; Wicaksono, A.; Maitela, T.; Widyatmanti, W. Remote Sensing and GIS Application for Water Environment Suitability Evaluation in Lampung and Hurun Bay. IOP Conf. Ser. Earth Environ. Sci. 2009, 256, 012016. [Google Scholar] [CrossRef]
  44. Longdill, P.C.; Healy, T.R.; Black, K.P. An integrated GIS approach for sustainable aquaculture management area site selection. Ocean Coast. Manag. 2008, 51, 612–624. [Google Scholar] [CrossRef]
Figure 1. The study area.
Land 10 01174 g001
Figure 2. Schematic diagram of the modelling procedure for potential aquaculture farm sites.
Land 10 01174 g002
Figure 3. Process of producing a suitability map for soil characteristics from (a) soil pH, (b) soil texture, and (c) soil organic matter.
Land 10 01174 g003
Figure 4. Process of producing a suitability soil condition map from (a) elevation, and (b) slope rise.
Land 10 01174 g004
Figure 5. Process of producing infrastructure facilities suitability map from (a) water bodies, (b) road, (c) protected area, and (d) residential area.
Land 10 01174 g005
Figure 6. (a) Land use and (b) land use suitability map in the George Town Conurbation.
Land 10 01174 g006
Figure 7. Restriction map generated from (a) protected area and (b) built-up area.
Land 10 01174 g007
Figure 8. (a) Final suitability map for aquaculture development in George Town Conurbation and (b) most suitable sites with a size of more than 35 ha.
Land 10 01174 g008
Table 1. Summary of previous studies on aquaculture site selection analysis.
Related Studies on Site Selection TaskMethod UsedTypes of AquacultureCriteria Included
[22]GIS-based quantitative land evaluation method InlandSlope, land use type, soil thickness, soil pH, elevation requirements, suitability of soil type, soil texture, distance to sea or/and other water sources, population density, road distance, local markets, and incubators.
[20,23]GIS-based multi-criteria evaluation (MCE) methodMarineSea temperature, chlorophyll, suspended sediment, bathymetry, distance to town, pier, and land-based facilities. Constraint layers consist of the harbour, area near town/industrial, and river mouth.
[24]GIS-based multi-criteria evaluation (MCE)MarineAmmoniacal nitrogen, water depth, water pH, DO, salinity, water movement, soil type, turbidity, and plankton.
[25]GIS-based multi-criteria evaluation (MCE)MarineDistance from fishery port, distance from river mouths, avoidance of shipping zone, and buffer zone of the special protection area.
[26]GIS-based multi-criteria evaluation (MCE) method InlandSoil (pH, texture, organic matter), water quality (temperature, pH, DO, CO2, phosphate, nitrate, hardness, total alkalinity, transparency), infrastructure (distance to water source, road, market, hatchery)
[27]GIS-based multi-criteria evaluation (MCE) method MarineVegetation density, geology, geomorphology, soil (texture, pH, clay percentage, organic matter, sand percentage, EC, fertility, depth), infrastructure (distance to the sea, water outlet channel, residential areas) land use, height, slope, direction, distance to, distance to roads, distance to the industrial areas, distance to the aquaculture farms.
[28]Flexible Voroni cell-based GIS model MarineSea surface temperature, chlorophyll-α, turbidity, and salinity
[29]GIS-based multi-criteria evaluation (MCE) methodInlandEnvironmental (slope, land use, clay content of soil, pH soil, distance to rivers), economic (distance to roads, markets and inputs), Social (distance to populations, protected areas), and Physicochemical (pH, DO, temperature, alkalinity, and hardness)
[30]GIS-based DANP (combination of decision-making trial and evaluation laboratory method (DEEMATEL) and analytical network process (ANP)) InlandSoil quality, water quality infrastructural and land use, soil pH, soil texture, soil organic matter, water temperature, water pH, water DO, phosphate, nitrate, hardness, water TDS, geology, distance from the fault, elevation, slope, aspect, land cover, distance from the protected area, distance from water resources, distance from the residential area, distance from roads, distance from the market.
Table 2. The suitability rating for the aquaculture site selection criteria [26,30,32,35].
CriteriaSuitability Rating and Score
3
(Most Suitable)
2
(Moderately Suitable)
1
(Not Suitable)
Description
Soil Characteristic Fishpond requires low salinity and natural pH with low water infiltration
Soil pH6.5–8.55.5–6.5 and 8.5–9.0<5.5 and >9.0
Soil texture (texture)Clay loamSandy clayLoam, sand
OM (% of carbon)<11–2>2
Soil Condition
Elevation (m)0–55–10>10The moderate slope is the most suitable for aquaculture pond
Slope (%)0–22–5>5
Infrastructural facilities
Distance to water (m)<500500–1000>1000
Distance to road (m)<500500–1000>1000Proximity to existing infrastructure provides easy access to the aquaculture sites
Distance from protected area (m)>50004000–5000<4000
Distance from residential area (m)>40002000–4000<2000Aquaculture should not be too close to residential and protected areas to avoid environmental problems such as odour
Land Use
Land UseVacant landAgricultureBuilt-up area, forest, water bodiesVacant land is less expensive
Table 3. The relative importance of two criteria.
1/91/81/71/61/51/41/31/2123456789
ExtremelyVery StronglyStronglyModeratelyEquallyModeratelyStronglyVery StronglyExtremely
Less ImportantMore Important
Table 4. Pairwise comparison matrix and the weight assigned for each criterion.
CriteriaSoil pHSoil TextureSoil Organic MatterWeight
Soil quality
Soil pH1 0.3
Soil texture1/21 0.2
Soil organic matter3210.5
Consistency ratio 0.031
Soil Condition
CriteriaElevationSlope Weight
Elevation 1 0.3
Slope21 0.7
Consistency ratio0.000
Infrastructure Facilities
CriteriaDistance to Water SourceDistance to the RoadDistance from Protected AreaDistance from Residential AreaWeight
Distance to water source1 0.4
Distance to road 1/21 0.3
Distance from protected area221 0.2
Distance from residential area1/51/5110.1
Consistency Ratio–0.220
Overall
CriteriaSoil CharacteristicInfrastructural FacilitiesLand UseSoil ConditionWeight
Soil Characteristic 1 0.2
Infrastructural facilities1/31 0.2
Land Use341 0.4
Soil Condition21/21/210.2
Consistency Ratio–0.7407
Table 5. Random consistency index (RI) [36].
n12345678910
RI000.580.901.121.241.321.411.451.49
Publisher’s Note: MDPI stays neutral with regard to jurisdictional claims in published maps and institutional affiliations.

