
The Perceived Value and Future Behavioral Intentions in Ecotourism: A Study in the Mediterranean Natural Parks from Spain


Abstract
:1. Introduction
2. Literature Review
2.1. Perceived Value in Tourism
2.2. The Perceived Value in Ecotourism
2.3. Perceived Value Related to Satisfaction and Loyalty in Ecoturism
3. Methodology
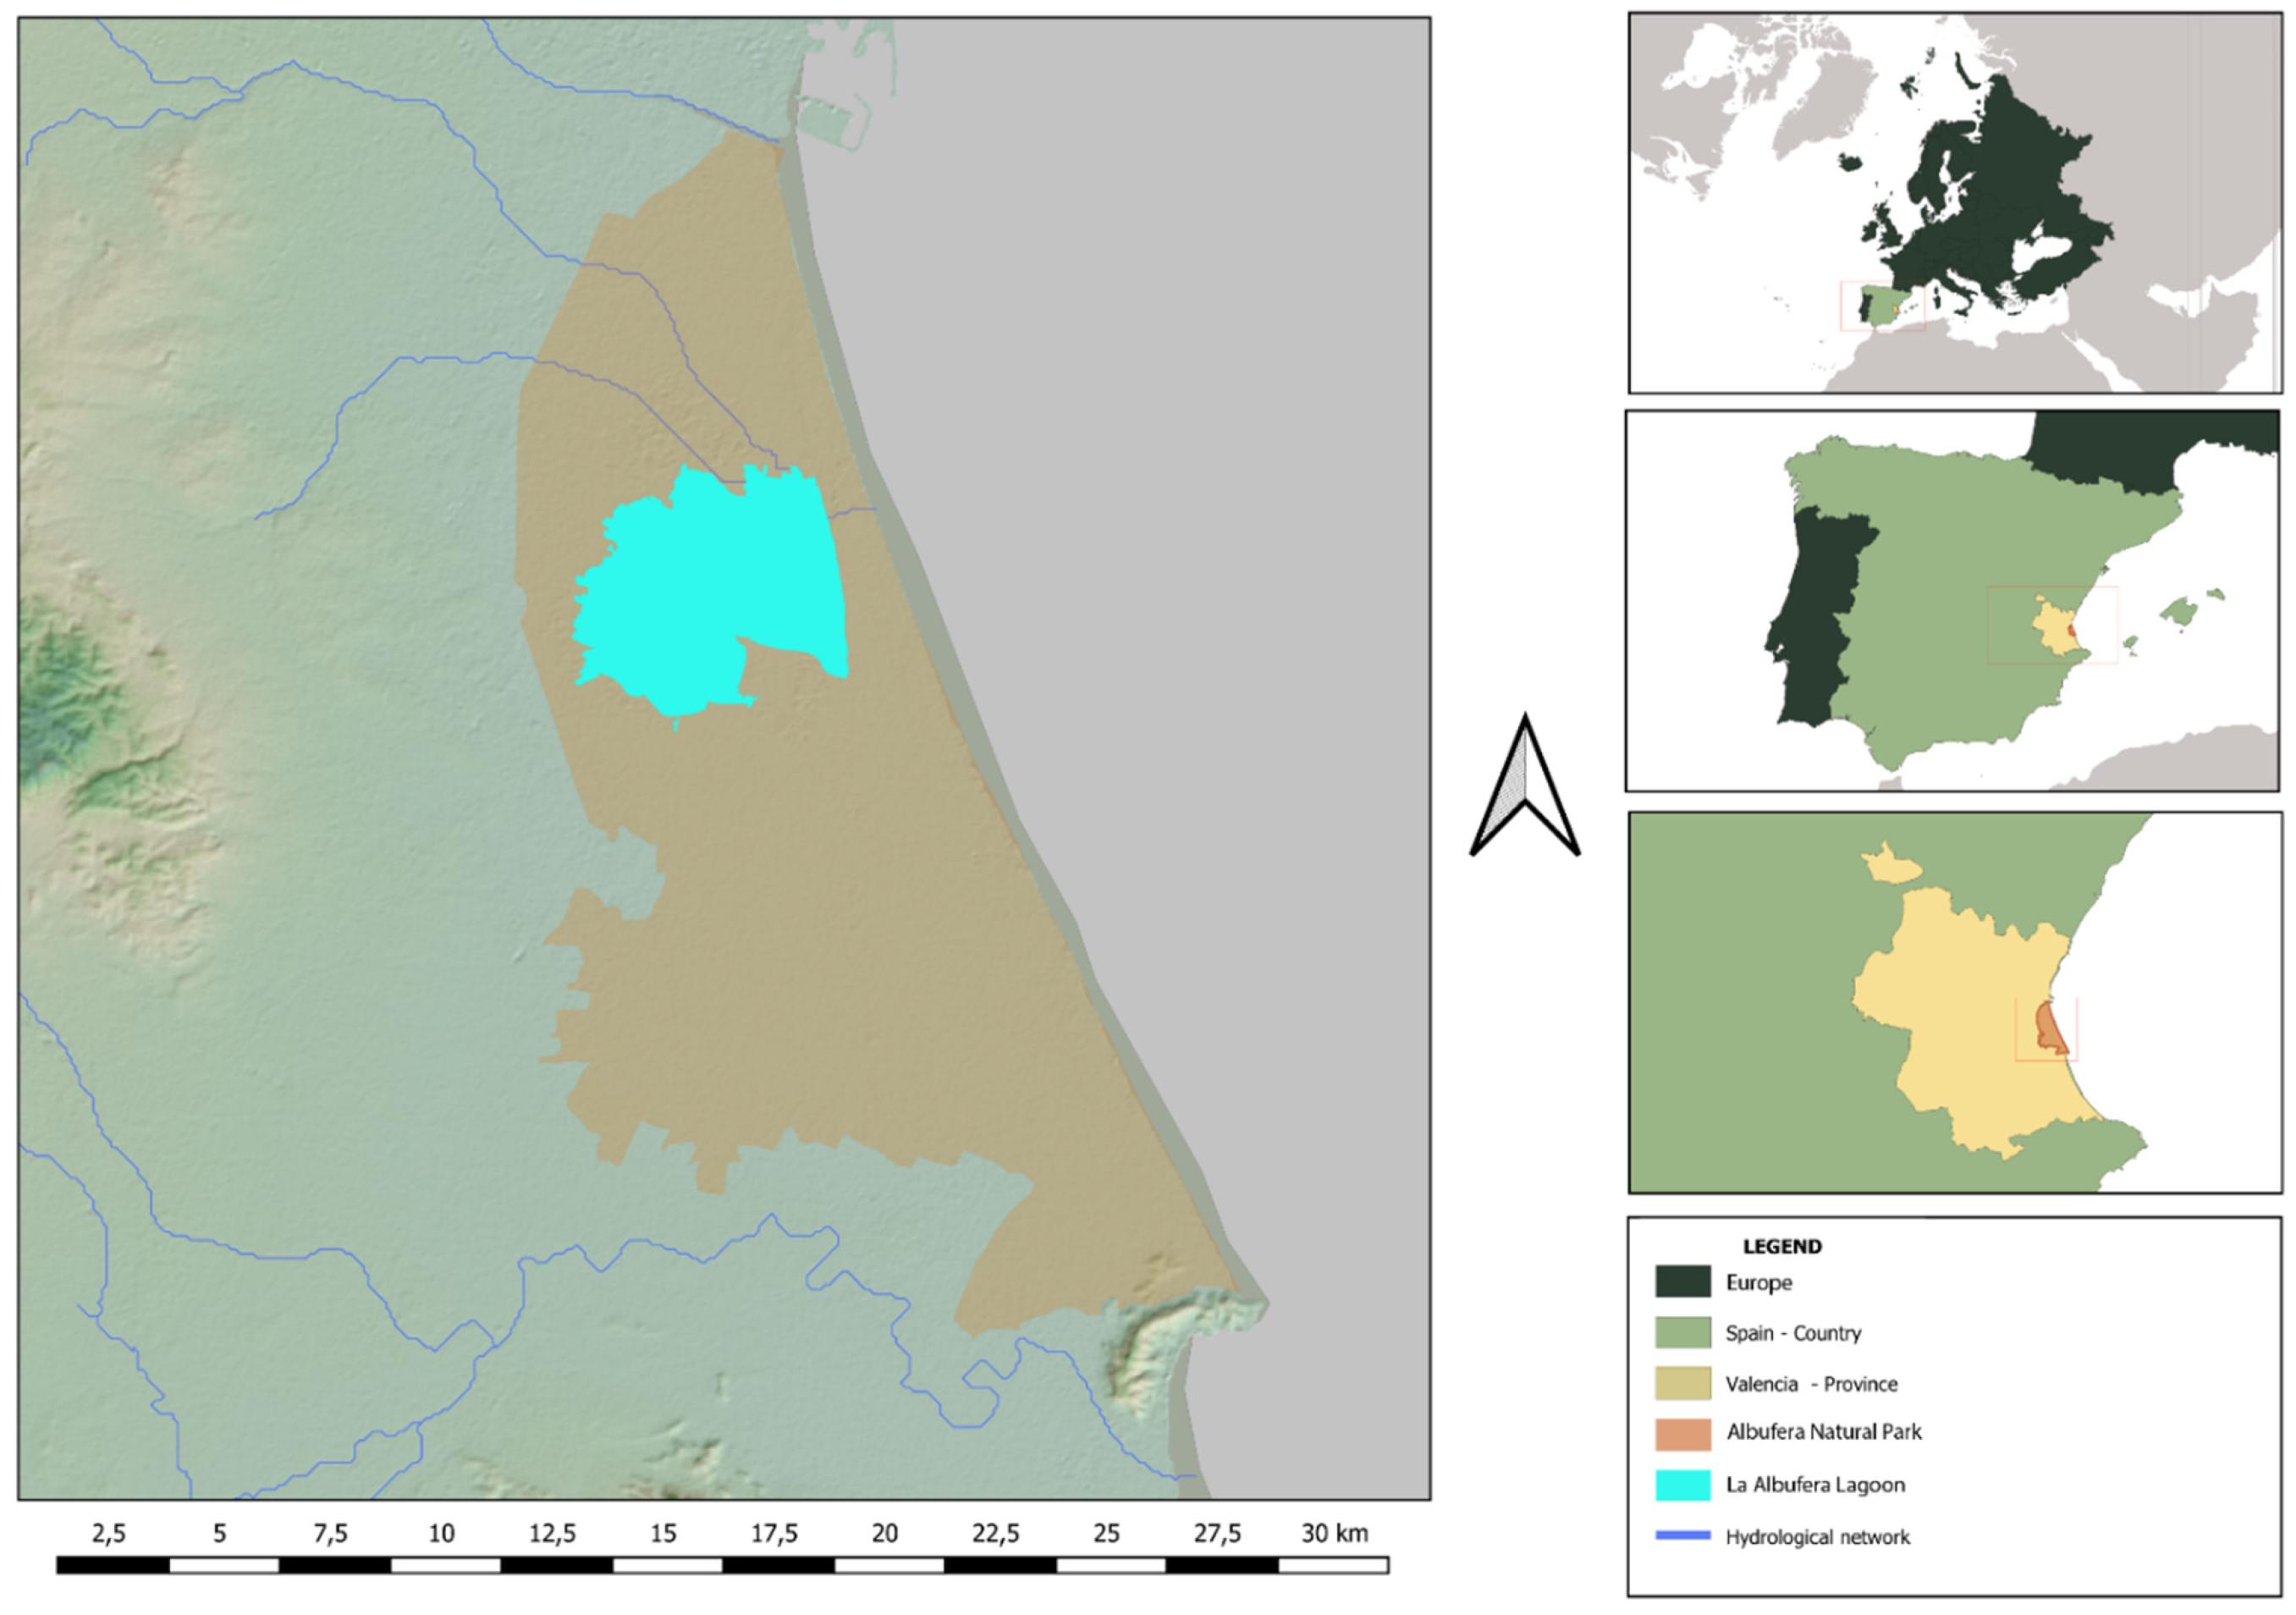
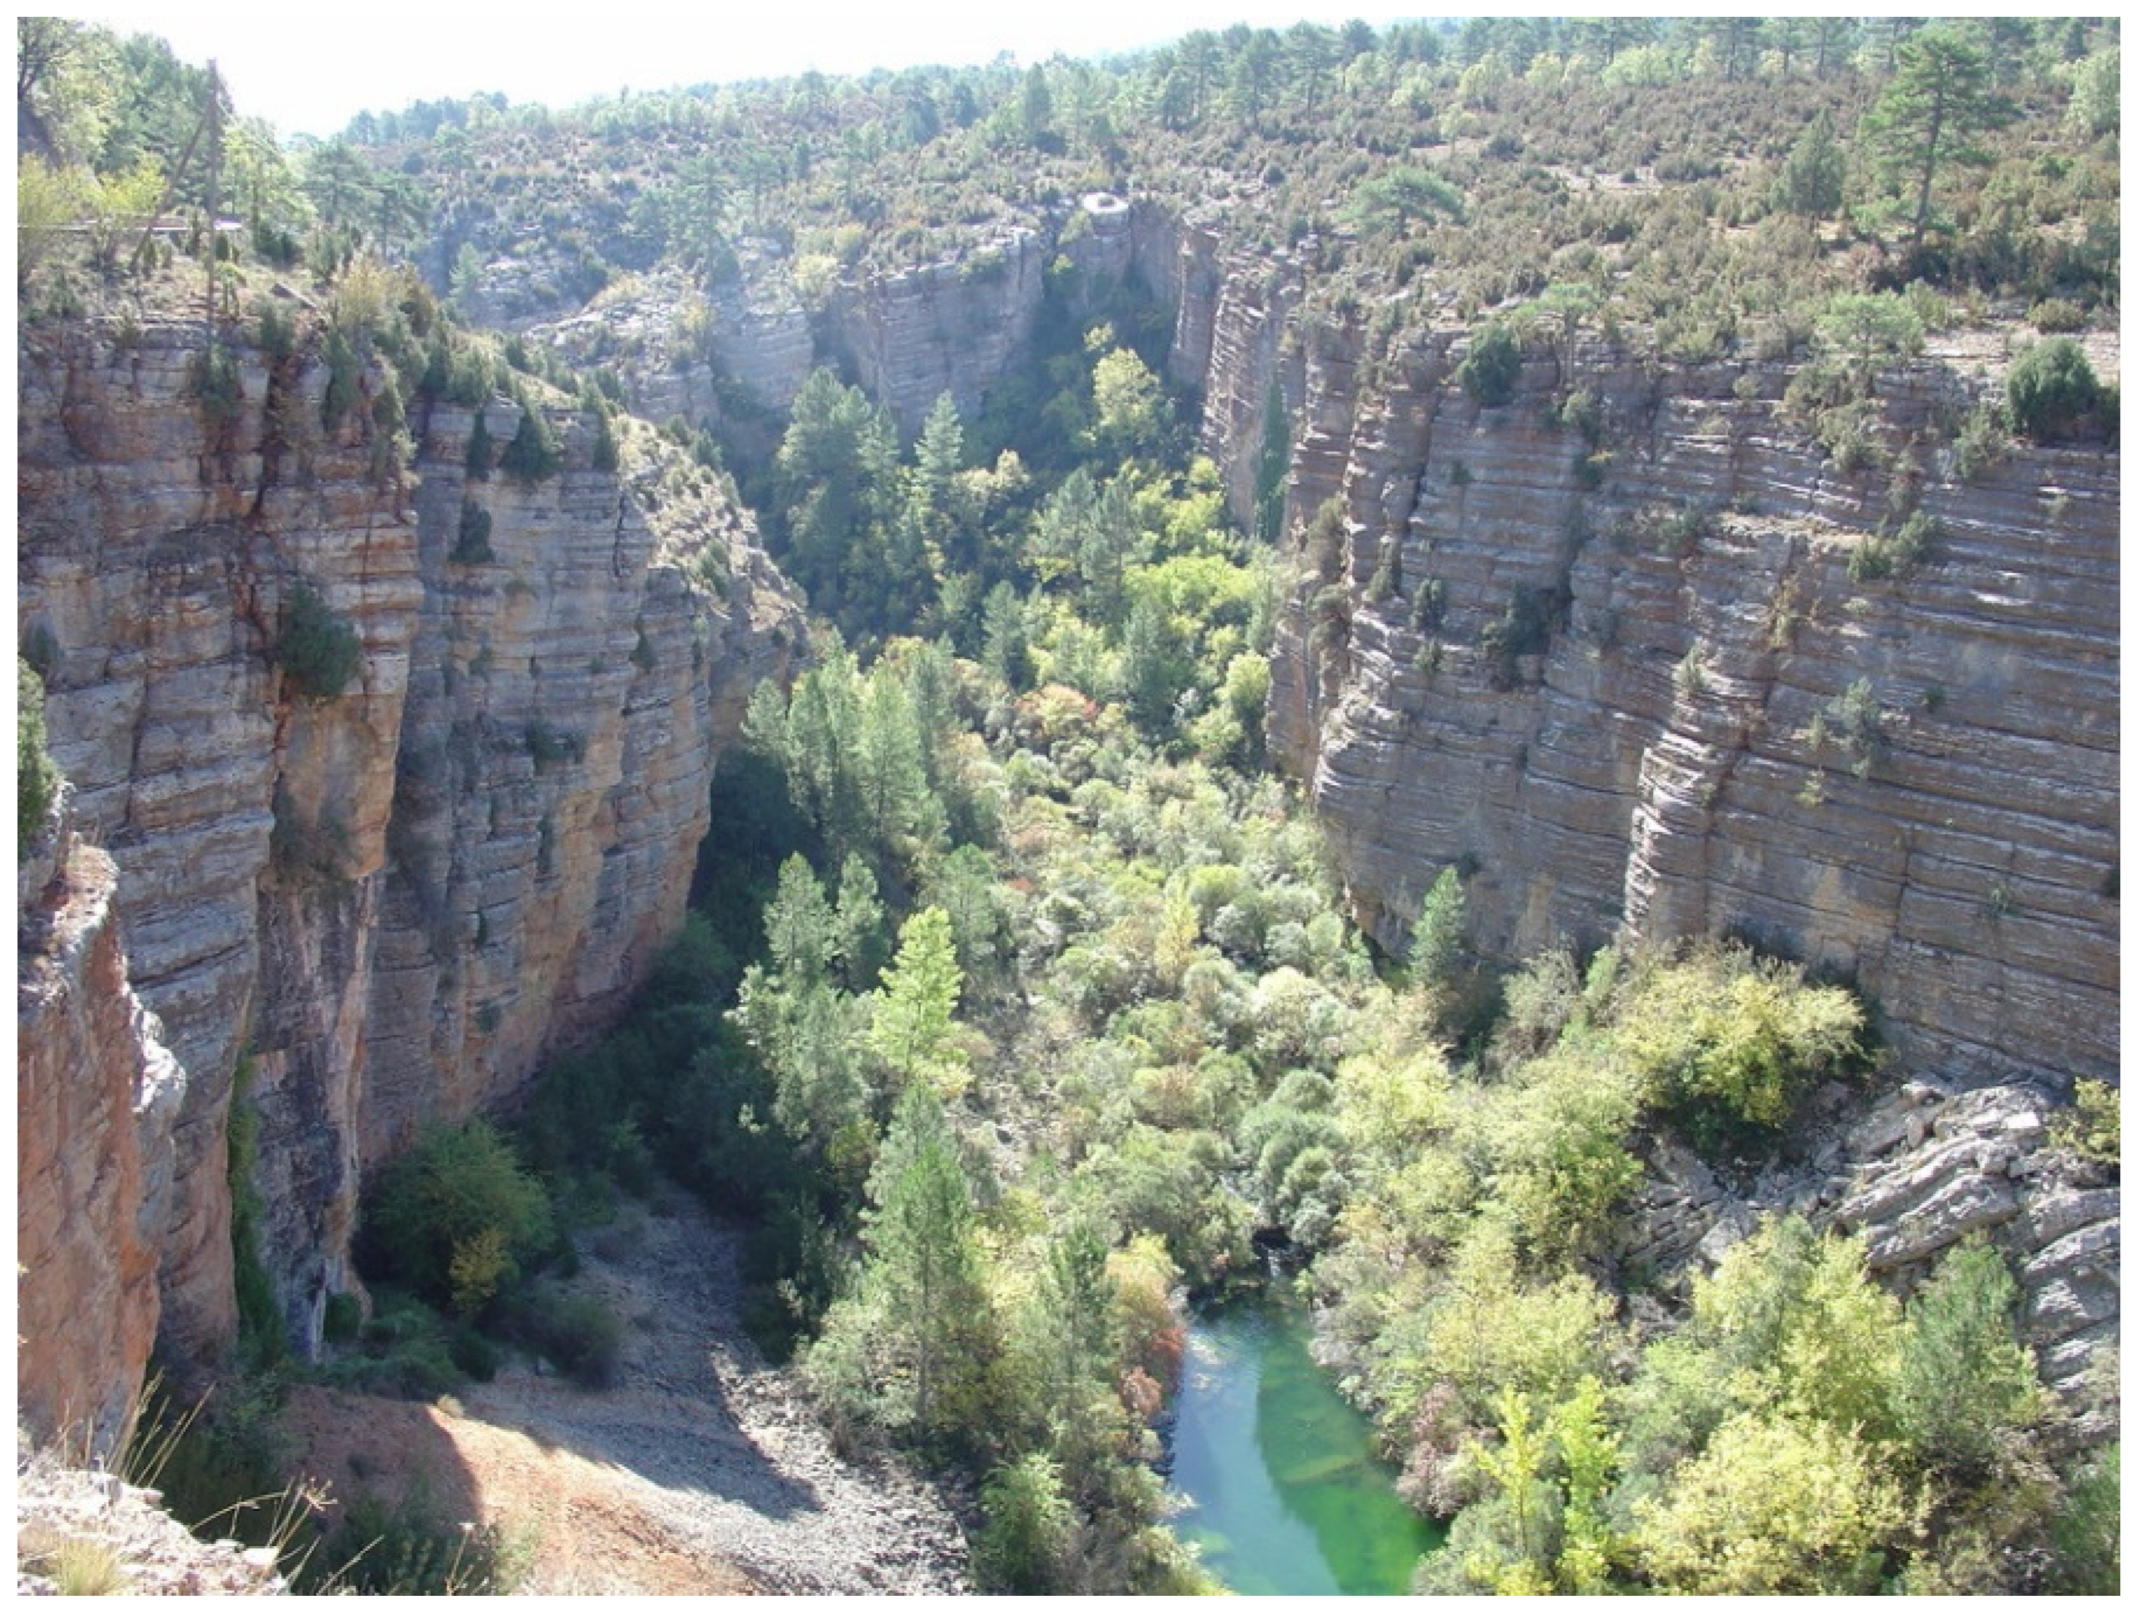
3.1. Study Area
- −
- The restinga or sand barrier that divides the lake from the sea.
- −
- The Albufera lake, for its extraordinary economic, environmental and landscape value.
- −
- The rice territory, which covers two thirds of the total park area.
3.2. Survey, Data Collection, and Analyses
4. Results
4.1. Research Sample Profile
4.2. Dimensions of Perceived Value
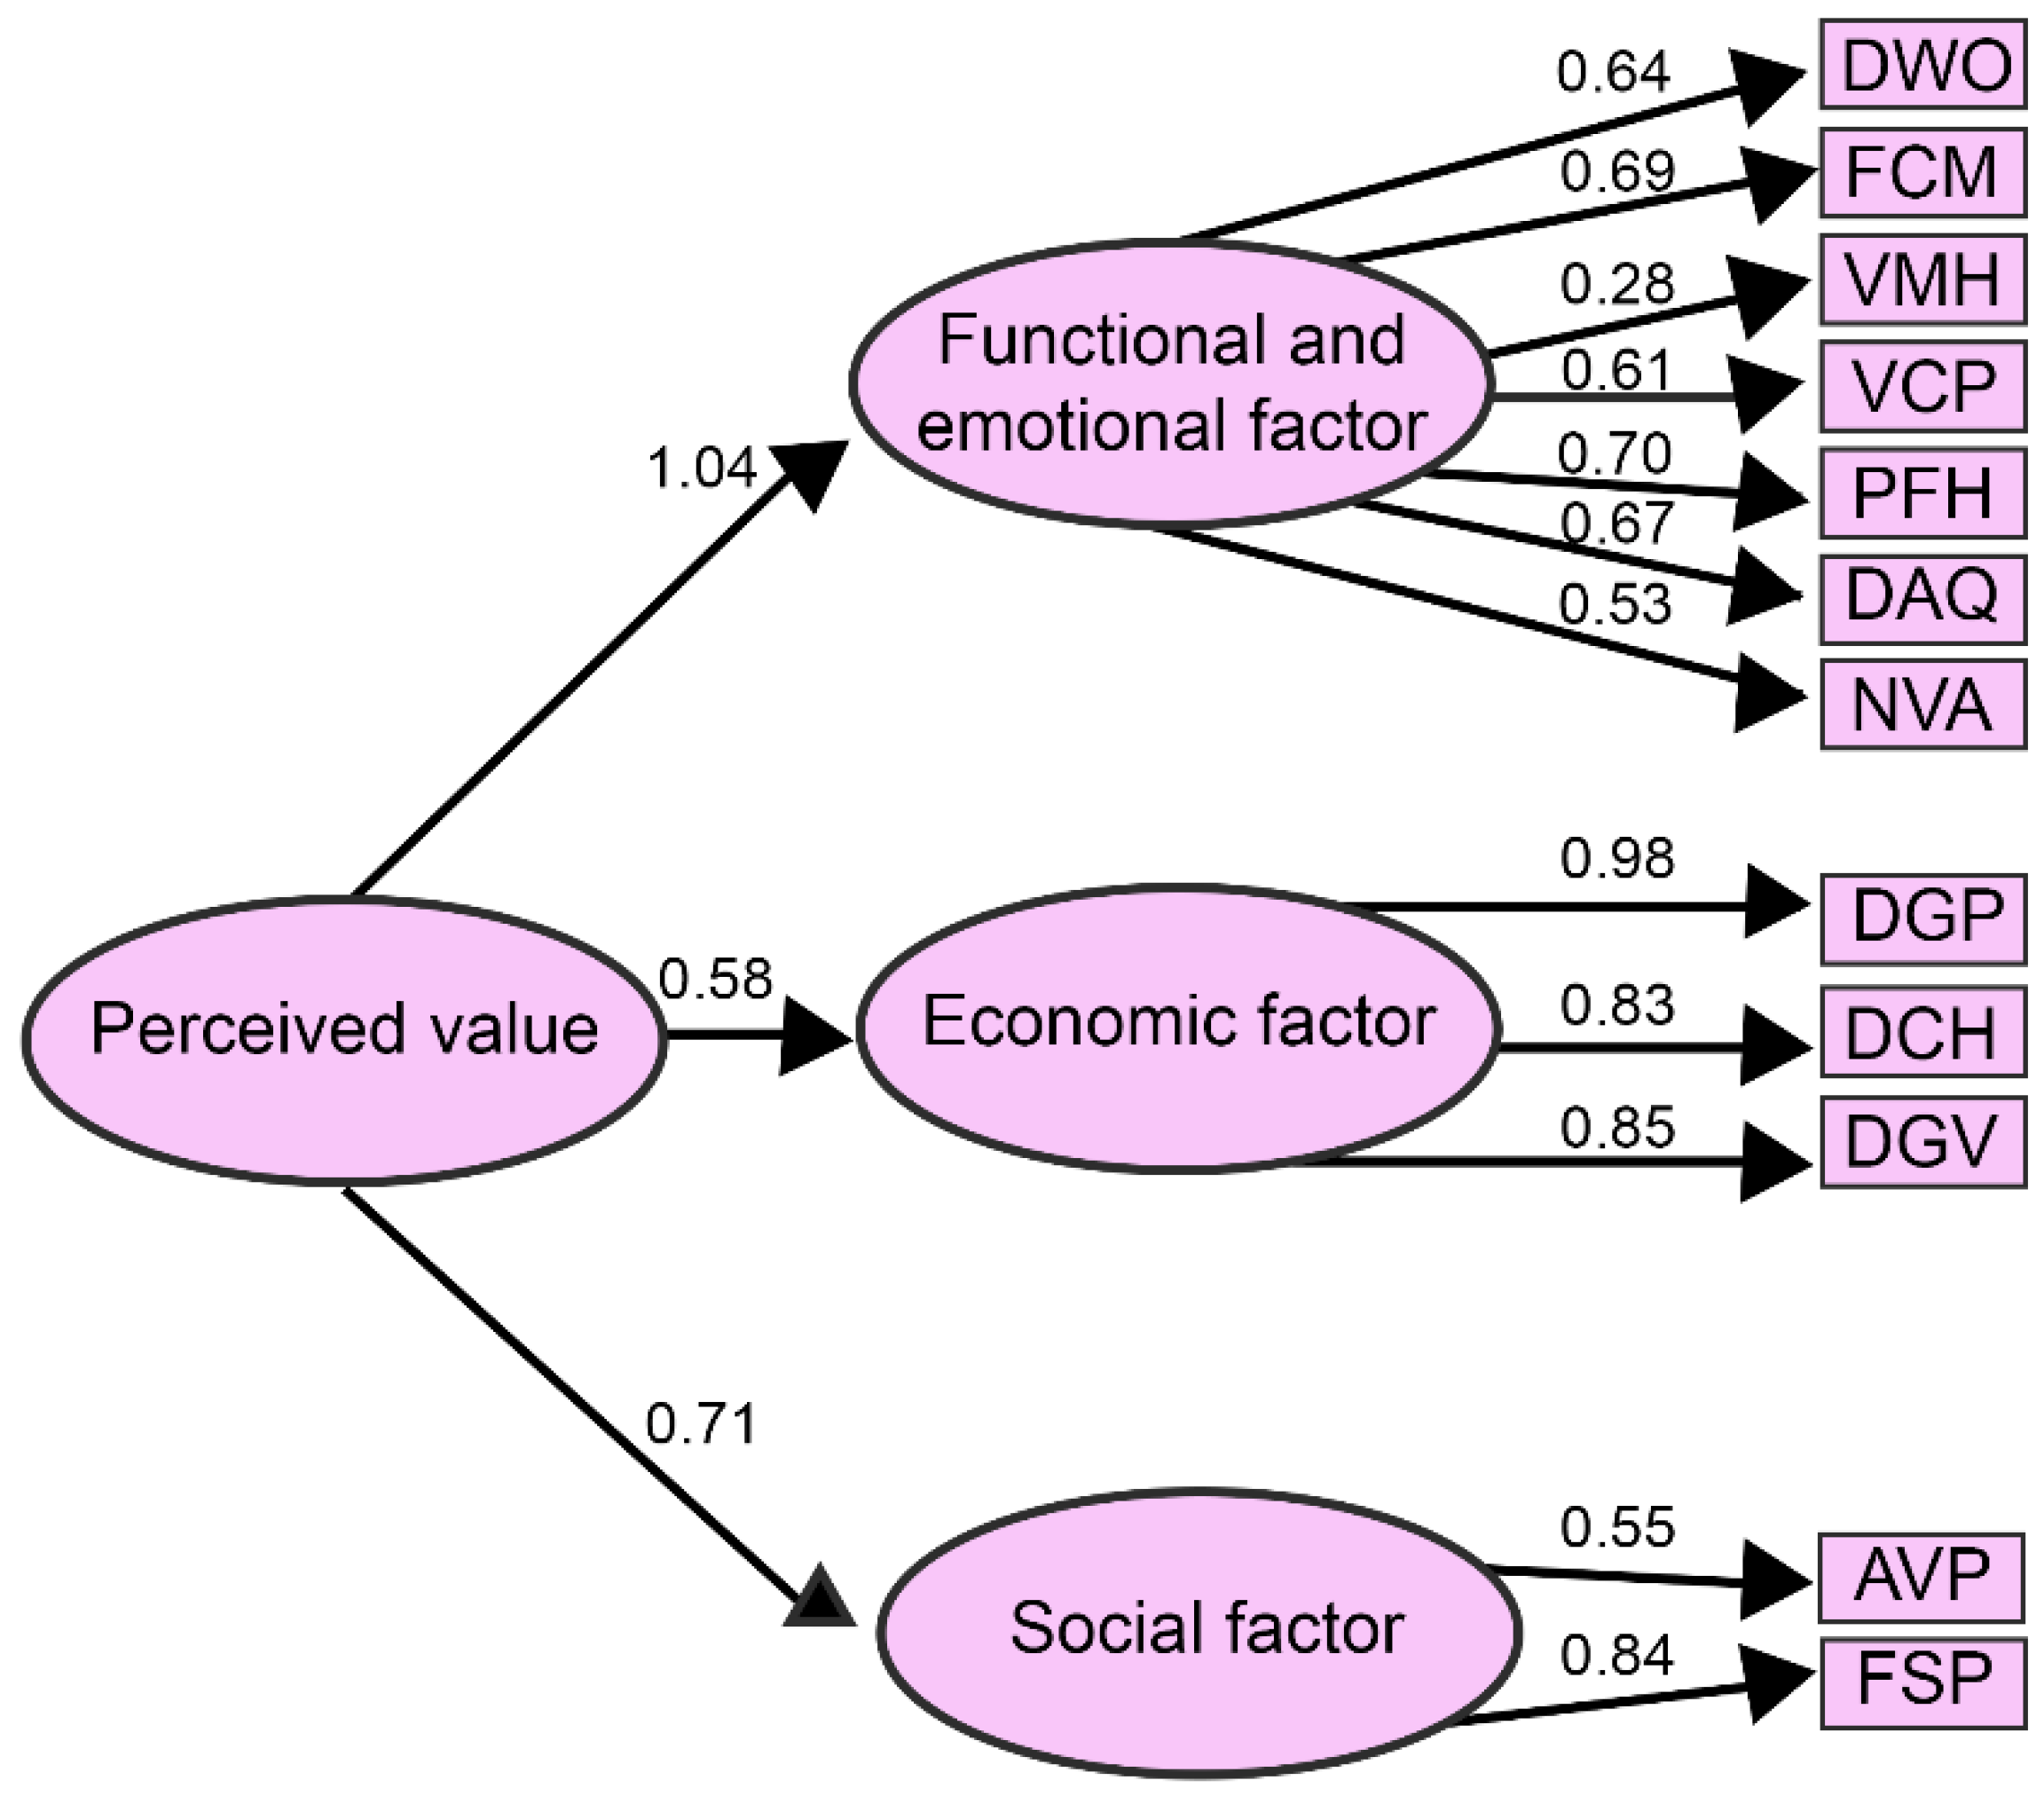
4.3. Confirmatory Factor Analysis
4.4. Perceived Value and Overall Satisfaction
4.5. Perceived Value and Intentions to Return to Protected Areas
4.6. The Perceived Value and Intentions of Recommending a Protected Area
4.7. Perceived Value and Saying Positive Things about Destination
5. Discussion
6. Conclusions
Author Contributions
Funding
Institutional Review Board Statement
Informed Consent Statement
Data Availability Statement
Conflicts of Interest
References
- Hultman, M.; Skarmeas, D.; Oghazi, P.; Beheshti, H.M. Achieving tourist loyalty through destination personality, satisfaction, and identification. J. Bus. Res. 2015, 68, 2227–2231. [Google Scholar] [CrossRef]
- Cheng, T.M.; Wu, H.C. How do environmental knowledge, environmental sensitivity, and place attachment affect environmentally responsible behavior? An integrated approach for sustainable island tourism. J. Sustain. Tour. 2015, 23, 557–576. [Google Scholar] [CrossRef]
- Choi, Y.E.; Oh, C.O.; Chon, J. Applying the resilience principles for sustainable ecotourism development: A case study of the Nakdong Estuary, South Korea. Tour. Manag. 2021, 83, 104237. [Google Scholar] [CrossRef]
- Wondirad, A.; Tolkach, D.; King, B. Stakeholder collaboration as a major factor for sustainable ecotourism development in developing countries. Tour. Manag. 2020, 78, 1–21. [Google Scholar] [CrossRef]
- Fletcher, R. Ecotourism after nature: Anthropocene tourism as a new capitalist “fix”. J. Sustain. Tour. 2019, 27, 522–535. [Google Scholar] [CrossRef] [Green Version]
- Briassoulis, H.; Van Der Straaten, J. Tourism and the Environment: Regional, Economic, Cultural and Policy Issues; Springer Science & Business Media: Berlin/Heidelberg, Germany, 2013; p. 6. Available online: https://books.google.cm/books?id=krqLBQAAQBAJ (accessed on 21 October 2021).
- Tanti, H.; Raya, A. Responsible environmental health intention of travelers on ecotourism sites. Tour. Hosp. Manag. 2016, 22, 135–150. [Google Scholar] [CrossRef]
- Si-Shyun, L.J. The moderating role of intercultural service encounters in the relationship among tourist’s destination image, perceived value and environmentally responsible behaviors. Am. J. Tour. Manag. 2018, 7, 1–9. [Google Scholar] [CrossRef]
- Beall, J.M.; Boley, B.B.; Landon, A.C.; Woosnam, K.M. What drives ecotourism: Environmental values or symbolic conspicuous consumption? J. Sustain. Tour. 2020, 29, 1–20. [Google Scholar] [CrossRef]
- Björk, P. Definition paradoxes: From concept to definition. In Critical Issues in Ecoturism; Higham, J., Ed.; Elsevier: Burlington, MA, USA, 2007; pp. 23–45. [Google Scholar]
- Honey, M. Ecotourism and Sustainable Development: Who Owns Paradise? 2nd ed.; Island Press: Washington, DC, USA, 2008. [Google Scholar]
- Jones, S. Community-based ecotourism: The significance of social capital. Ann. Tour. Res. 2005, 32, 303–324. [Google Scholar] [CrossRef]
- Liu, J.; Qu, H.; Huang, D.; Chen, G.; Yue, X.; Zhao, X.; Liang, Z. The role of social capital in encouraging residents’ pro-environmental behaviors in community-based ecotourism. Tour. Manag. 2014, 41, 190–201. [Google Scholar] [CrossRef]
- Reimer, J.K.; Walter, P. How do you know it when you see it? Community-based ecotourism in the cardamom mountains of southwestern Cambodia. Tour. Manag. 2013, 34, 122–132. [Google Scholar] [CrossRef]
- Ketema, T.D. Development of community based ecotourism in Wenchi Crater Lake, Ethiopia: Challenges and prospects. J. Hosp. Manag. Tour. 2015, 6, 39–46. Available online: http://www.academicjournals.org/JHMT (accessed on 2 May 2021).
- Osman, T.; Shaw, D.; Kenawy, E. Examining the extent to which stakeholder collaboration during ecotourism planning processes could be applied within an Egyptian context. Land Use Policy 2018, 78, 126–137. [Google Scholar] [CrossRef]
- Thapa, B.; Lee, J. Visitor experience in Kafue National Park, Zambia. J. Ecotourism. 2017, 16, 112–130. [Google Scholar] [CrossRef]
- Wolf, I.D.; Ainsworth, G.B.; Crowley, J. Transformative travel as a sustainable market niche for protected areas: A new development, marketing and conservation model. J. Sustain. Tour. 2017, 25, 1650–1673. [Google Scholar] [CrossRef] [Green Version]
- Chiu, Y.T.H.; Lee, W.I.; Chen, T.H. Environmentally responsible behavior in ecotourism: Exploring the role of destination image and value perception. Asia Pac. J. Tour. Res. 2014, 19, 876–889. [Google Scholar] [CrossRef]
- Cronin, J.J., Jr.; Brady, M.; Hult, T. Assessing the effects of quality, value, and customer satisfaction on consumer behavioral intentions in service environments. J. Retail. 2000, 76, 193–218. [Google Scholar] [CrossRef]
- Grewal, D.; Monroe, K.; Krishnan, R. The effects of price comparison advertising on buyers’ perceptions of acquisition value, transaction value, and behavioral intentions. J. Mark. 1998, 62, 46–59. [Google Scholar] [CrossRef]
- Jamal, A.; Sharifuddin, J. Perceived value and perceived usefulness of halal labeling: The role of religion and culture. J. Bus. Res. 2015, 68, 933–941. [Google Scholar] [CrossRef]
- Chua, B.L.; Lee, S.; Goh, B.; Han, H. Impacts of cruise service quality and price on vacationers’ cruise experience: Moderating role of price sensitivity. Int. J. Hosp. Manag. 2015, 44, 131–145. [Google Scholar] [CrossRef]
- Kim, H.; Woo, E.; Uysal, M. Tourism experience and quality of life among elderly tourists. Tour. Manag. 2015, 46, 465–476. [Google Scholar] [CrossRef]
- Adam, I.; Adongo, C.A.; Amuquandoh, F.E. A structural decompositional analysis of eco-visitors’ motivations, satisfaction and post-purchase behaviour. J. Ecotourism. 2019, 18, 60–81. [Google Scholar] [CrossRef]
- Meng, S.M.; Liang, G.S.; Yang, S.H. The relationships of cruise image, perceived value, satisfaction, and post-purchase behavioral intention on Taiwanese tourists. Afr. J. Bus. Manag. 2011, 5, 19–29. Available online: http://www.academicjournals.org/AJBM (accessed on 21 October 2021).
- La Barbera, P.A.; Mazursky, D. A longitudinal assessment of consumer satisfaction/dissatisfaction: The dynamic aspect of the cognitive process. J. Mark. Res. 1983, 20, 393–404. [Google Scholar] [CrossRef] [Green Version]
- Turnbull, P.W.; Wilson, D.T. Developing and protecting profitable customer relationships. Ind. Mark. Manag. 1989, 18, 233–238. [Google Scholar] [CrossRef]
- Pine, B.J.; Peppers, D.; Rogers, M. Do You Want to Keep Your Customers Forever? Harvard Business Press: Brighton, MA, USA, 2009; Available online: https://www.researchgate.net/profile/B_Pine_Ii/publication/243782919_Do_You_Want_to_Keep_Your_Customers_Forever_Harvard_Business_Rev/links/56dd9e4408aed4e2a99c53ed/Do-You-Want-to-Keep-Your-Customers-Forever-Harvard-Business-Rev.pdf (accessed on 2 August 2021).
- Bauer, H.H.; Grether, M.; Leach, M. Building customer relations over the Internet. Ind. Mark. Manag. 2002, 31, 155–163. [Google Scholar] [CrossRef]
- Kim, S.-H.; Holland, S.; Han, H.-S. A Structural Model for Examining how Destination Image, Perceived Value, and Service Quality Affect Destination Loyalty: A Case Study of Orlando. Int. J. Tour. Res. 2013, 15, 313–328. [Google Scholar] [CrossRef]
- Thiumsak, T.; Ruangkanjanases, A. Factors influencing international visitors to revisit Bangkok, Thailand. J. Bus. Econ. Manag. 2016, 4, 220–230. Available online: https://www.researchgate.net/profile/Athapol_Ruangkanjanases/publication/283179233_Factors_Influencing_International_Visitors_to_Revisit_Bangkok_Thailand/links/5b11857ba6fdcc4611dbbe36/Factors-Influencing-International-Visitors-to-Revisit-Bangkok-Thailand.pdf (accessed on 2 August 2021). [CrossRef]
- Zeithaml, V.A. Consumer perceptions of price, quality, and value: A meansend model and synthesis of evidence. J. Mark. 1988, 52, 2–22. [Google Scholar] [CrossRef]
- Bajs, I. Tourist perceived value, relationship to satisfaction, and behavioral intentions: The example of the Croatian tourist destination Dubrovnik. J. Travel. Res. 2015, 54, 122–134. [Google Scholar] [CrossRef]
- Eid, R.; El-Gohary, H. The role of Islamic religiosity on the relationship between perceived value and tourist satisfaction. Tour. Manag. 2015, 46, 477–488. [Google Scholar] [CrossRef]
- Oh, H. Diners’ perceptions of quality, value, and satisfaction: A practical viewpoint. Cornell. Hotel. Restaur. Adm. Q. 2000, 41, 58–66. [Google Scholar] [CrossRef]
- Sánchez-Fernández, R.; Iniesta-Bonillo, M.Á. Efficiency and quality as economic dimensions of perceived value: Conceptualization, measurement, and effect on satisfaction. J. Retail. Consum. Serv. 2009, 16, 425–433. [Google Scholar] [CrossRef]
- Lee, J.S.; Lee, C.K.; Choi, Y. Examining the role of emotional and functional values in festival evaluation. J. Travel. Res. 2011, 50, 685–696. [Google Scholar] [CrossRef]
- Kim, K.-H.; Park, D.-B. Relationships among perceived value, satisfaction, and loyalty: Community-based ecotourism in Korea. J. Travel Tour. Mark. 2017, 34, 171–191. [Google Scholar] [CrossRef]
- Petrick, J.F. Development of a multi-dimensional scale for measuring the perceived value of a service. J. Leis Res. 2002, 34, 119–134. [Google Scholar] [CrossRef]
- Williams, P.; Soutar, G. Value, satisfaction and behavioral intentions in an adventure tourism context. Ann. Tour. Res. 2009, 36, 413–438. [Google Scholar] [CrossRef]
- Jamal, S.A.; Othman, N.A.; Muhammad, N. Tourist perceived value in a community based homestay visit: An investigation into the functional and experiential aspect of value. J. Vacat. Mark. 2011, 17, 5–15. [Google Scholar] [CrossRef]
- Kim, M.; Thapa, B. Perceived value and flow experience: Application in a nature-based tourism context. J. Dest. Mark. Manag. 2018, 8, 373–384. [Google Scholar] [CrossRef]
- Carvache-Franco, M.; Carvache-Franco, O.; Solis-Radilla, M.M.; Carvache-Franco, W. The perceived value and profile of protected areas visitors: A case study of the Guayas province, Ecuador. Geogr. Pannonica. 2019, 23, 135–147. [Google Scholar] [CrossRef]
- Carvache-Franco, M.; Perez-Orozco, A.; Carvache-Franco, O.; Víquez-Paniagua, A.G.; Carvache-Franco, W. The perceived value in ecotourism related to satisfaction and loyalty: A study from Costa Rica. Geogr. Pannonica. 2020, 24, 229–243. [Google Scholar] [CrossRef]
- Lee, C.K.; Yoon, Y.S.; Lee, S.K. Investigating the relationships among perceived value, satisfaction, and recommendations: The case of the Korean DMZ. Tour. Manag. 2007, 28, 204–214. [Google Scholar] [CrossRef]
- Chen, C.F.; Tsai, D. How destination image and evaluative factors affect behavioral intentions? Tour. Manag. 2007, 28, 1115–1122. [Google Scholar] [CrossRef]
- Sun, X.; Chi, C.G.Q.; Xu, H. Developing destination loyalty: The case of Hainan Island. Ann. Tour. Res. 2013, 4, 547–577. [Google Scholar] [CrossRef]
- Peña, A.I.P.; Jamilena, D.M.F.; Molina, M.Á.R. The perceived value of the rural tourism stay and its effect on rural tourist behavior. J. Sustain. Tour. 2012, 20, 1045–1065. [Google Scholar] [CrossRef]
- Li, J. Impact of tourists’ perceived value on brand loyalty: A case study of Xixi National Wetland Park. Asia Pacific J. Tour. Res. 2021, 26, 262–276. [Google Scholar] [CrossRef]
- Lee, T.H.; Jan, F.H.; Tseng, C.H.; Lin, Y.F. Segmentation by recreation experience in island-based tourism: A case study of Taiwan’s Liuqiu Island. J. Sustain. Tour. 2018, 26, 362–378. [Google Scholar] [CrossRef]
- Chen, C.-F.; Chen, F.-S. Experience quality, perceived value, satisfaction and behavioral intentions for heritage tourists. Tour. Manag. 2010, 31, 29–35. [Google Scholar] [CrossRef]
- Oliver, R.L. Satisfaction: A Behavioral Perspective on the Consumer: A Behavioral Perspective on the Consumer; Routledge: London, UK, 2014. [Google Scholar]
- Kline, R.B. Principles and Practice of Structural Equation Modeling, 3rd ed.; The Guilford Press: New York, NY, USA, 2011. [Google Scholar]
- MacCallum, R.C.; Wegener, D.T.; Uchino, B.N.; Fabrigar, L.R. The problem of equivalent models in applications of covariance structure analysis. Psychol. Bull. 1993, 114, 185–199. Available online: https://psycnet.apa.org/buy/1993-39917-001 (accessed on 10 May 2021). [CrossRef] [PubMed]
- Hooper, D.; Coughlan, J.; Mullen, M.R. Structural equation modelling: Guidelines for determining model fit. Electron. J. Bus. Res. Methods 2008, 6, 53–60. [Google Scholar]
- Steiger, J.H. Understanding the limitations of global fit assessment in structural equation modeling. Pers.-Ality Individ. Differ. 2007, 42, 893–898. [Google Scholar] [CrossRef]
- Wu, W.; West, S.G.; Taylor, A.B. Evaluating model fit for growth curve models: Integration of fit indices from SEM and MLM frameworks. Psychol. Methods 2009, 14, 183. [Google Scholar] [CrossRef] [Green Version]
- Chung, Y.; Song, T.; Park, J. Freeway booking policy: Public discourse and acceptability analysis. Transp. Policy 2012, 24, 223–231. [Google Scholar] [CrossRef]
- Delbosc, A.; Currie, G. Modelling the causes and impacts of personal safety perceptions on public transport ridership. Transp. Policy 2012, 24, 302–309. [Google Scholar] [CrossRef]
- Van Acker, V.; Witlox, F. Car ownership as a mediating variable in car travel behaviour research using a structural equation modelling approach to identify its dual relationship. J. Transp. Geogr. 2010, 18, 65–74. [Google Scholar] [CrossRef] [Green Version]


| Factors | Factor Loads | Half | Eigen Values | % Explained Variance | Cronbach’s Alpha |
|---|---|---|---|---|---|
| Functional and emotional factors | 5.26 | 43.82 | 0.72 | ||
| The destination is well organized | 0.763 | 4.09 | |||
| Fate is convenient for me | 0.703 | 4.13 | |||
| This visit makes me feel happy | 0.691 | 4.15 | |||
| This visit is pleasant | 0.636 | 4.35 | |||
| People are friendly and make you feel at home | 0.600 | 4.00 | |||
| The destination has an adequate level of quality | 0.593 | 4.12 | |||
| The number of visitors the area receives is adequate | 0.568 | 4.04 | |||
| Economic factor | 1.49 | 12.45 | 0.91 | ||
| The destination has good prices | 0.907 | 3.75 | |||
| The destination is cheap (cheap) | 0.892 | 3.76 | |||
| The destination has good value for money | 0.84 | 3.94 | |||
| Social factor | 1.02 | 8.52 | 0.60 | ||
| This destination is visited by many people I know | 0.881 | 2.51 | |||
| I feel like a special person | 0.655 | 2.86 | |||
| % explained variance of all items | 64.79 | ||||
| Alpha of Cronbach of all items | 0.86 |
| Variable | Beta | t | Sig. | Tolerance |
|---|---|---|---|---|
| Functional and emotional factor | 0.526 | 12.427 | 0.000 | 1.000 |
| Economic factor | 0.285 | 6.743 | 0.000 | 1.000 |
| Social factor | 0.191 | 4.510 | 0.000 | 1.000 |
| (Constant) | 158.070 | 0.000 | ||
| F | 73.369 | |||
| Sig. | 0.000 | |||
| Durbin-Watson | 1.996 |
| Variable | Beta | t | Sig. | Tolerance |
|---|---|---|---|---|
| Functional and emotional factor | 0.346 | 7.471 | 0.000 | 1.000 |
| Economic factor | 0.236 | 5.097 | 0.000 | 1.000 |
| Social factor | 0.311 | 6.707 | 0.000 | 1.000 |
| (Constant) | 79.514 | 0.000 | ||
| F | 42.261 | |||
| Sig. | 0.000 | |||
| Durbin-Watson | 1.608 |
| Variable | Beta | t | Sig. | Tolerance |
|---|---|---|---|---|
| Functional and emotional factor | 0.504 | 11.488 | 0.000 | 1.000 |
| Economic factor | 0.257 | 5.869 | 0.000 | 1.000 |
| Social factor | 0.169 | 3.855 | 0.000 | 1.000 |
| (Constant) | 131.159 | 0.000 | ||
| F | 60.427 | |||
| Sig. | 0.000 | |||
| Durbin-Watson | 1.733 |
| Variable | Beta | t | Sig. | Tolerance |
|---|---|---|---|---|
| Functional and emotional factor | 0.588 | 14.059 | 0.000 | 1.000 |
| Economic factor | 0.223 | 5.332 | 0.000 | 1.000 |
| Social factor | 0.108 | 2.580 | 0.010 | 1.000 |
| (Constant) | 164.250 | 0.000 | ||
| F | 77.583 | |||
| Sig. | ||||
| Durbin-Watson | 1.784 |
Publisher’s Note: MDPI stays neutral with regard to jurisdictional claims in published maps and institutional affiliations. |
© 2021 by the authors. Licensee MDPI, Basel, Switzerland. This article is an open access article distributed under the terms and conditions of the Creative Commons Attribution (CC BY) license (https://creativecommons.org/licenses/by/4.0/).
Share and Cite
Carvache-Franco, M.; Carrascosa-López, C.; Carvache-Franco, W. The Perceived Value and Future Behavioral Intentions in Ecotourism: A Study in the Mediterranean Natural Parks from Spain. Land 2021, 10, 1133. https://doi.org/10.3390/land10111133
Carvache-Franco M, Carrascosa-López C, Carvache-Franco W. The Perceived Value and Future Behavioral Intentions in Ecotourism: A Study in the Mediterranean Natural Parks from Spain. Land. 2021; 10(11):1133. https://doi.org/10.3390/land10111133
Chicago/Turabian StyleCarvache-Franco, Mauricio, Conrado Carrascosa-López, and Wilmer Carvache-Franco. 2021. "The Perceived Value and Future Behavioral Intentions in Ecotourism: A Study in the Mediterranean Natural Parks from Spain" Land 10, no. 11: 1133. https://doi.org/10.3390/land10111133
APA StyleCarvache-Franco, M., Carrascosa-López, C., & Carvache-Franco, W. (2021). The Perceived Value and Future Behavioral Intentions in Ecotourism: A Study in the Mediterranean Natural Parks from Spain. Land, 10(11), 1133. https://doi.org/10.3390/land10111133