Technical Note

High Mountains Becoming Wetter While Deserts Getting Drier in Xinjiang, China since the 1980s

Key Laboratory of Western China’s Environmental Systems (Ministry of Education), College of Earth and Environmental Sciences, Lanzhou University, Lanzhou 730000, China
*
Author to whom correspondence should be addressed.
Land 2021, 10(11), 1131; https://doi.org/10.3390/land10111131
Submission received: 17 September 2021 / Revised: 21 October 2021 / Accepted: 22 October 2021 / Published: 25 October 2021

Abstract

:
Climate change has been thought to drive the accelerated expansion of global drylands. However, many studies reveal that Arid Central Asia (ACA) has been warming and wetting in recent decades, representing an anomalous response to global climate change. Given that ACA is composed of complex ecosystems and landforms, it is not clear whether or not this trend is uniform in this topographically heterogenous region. Here, we integrate the Google Earth Engine and ERA5-Land reanalysis data to study the trend of changes, since the 1980s, in temperature and precipitation in the Tianshan Mountains and the surrounding deserts, collectively referred to as the Tianshan and Desert Ecozone, which is in Northwest China. Our results show that only 20.4% of this area is becoming both warmer and wetter, which occurs mainly in the altitudes above 2800 m (Tianshan Ecozone). All three alpine ecosystems (coniferous forests, alpine meadow, and nival zone) in the Tianshan Ecozone exhibit similar warming and wetting trends, including of elevation-dependent wetting on the specific altitude range. In contrast, the low-lying oasis where human activities are mostly concentrated is undergoing warming and drying, which will face a greater threat of drought projected under three emissions scenarios (SSP1-2.6, SSP2-4.5, and SSP5-8.5). These results highlight the importance of considering the differences of climate change in different altitude gradients and different ecosystems when studying climate change in drylands.

Graphical Abstract

1. Introduction

Arid and semi-arid regions, composed of deserts, shrubs, and savanna, account for 40% of the global terrestrial ecosystem, and they feed approximately 38% of the world’s population [1]. In addition to the socioeconomic values, arid ecosystems are sensitive to global climate change and play an important role in the global carbon cycle [2]. The greatest magnitude of warming has been observed in arid and semi-arid regions in the past 100 years, which also accounts for more than half of the land experiencing warming [3]. Large warming may lead to increased evaporation, decreased precipitation, prolonged droughts, and ultimately the accelerated expansion of drylands [4], which in turn may reduce carbon sequestration and further enhance global warming [5].
There are regional differences in the world’s dryland climate change. Reanalysis datasets show that the global semi-arid and arid regions show a significant warming and drying trend, but there are obvious regional differences in precipitation changes [6]. Specifically, precipitation in southern Asia, southern Africa, and the northeastern part of the drylands of North America have increased significantly, while precipitation in central North America, southwestern South America, eastern Africa and western Asia have decreased significantly [7,8,9]. Based on the above research, we found that the research on climate change in arid regions is mainly focused on large-scale areas, but there is less attention to climate change in different ecological systems and different altitude gradients in arid regions.
It has been reported that ACA has experienced warming and wetting over recent decades [10]. Meteorological data show an overall increasing trend in annual precipitation in Central Asia and Northwest China, due primarily to the increase in the number and intensity of extreme rainstorms [11,12,13,14]. However, ACA is topographically and thus ecologically complex, which has an altitudinal heterogeneity in terms of physical and ecological response to global climate change [15]. Studies in the surrounding area of ACA have shown that the precipitation in the steppe and forest steppe of southern Siberia has decreased, but the precipitation in the coniferous forest belt has increased [16]. In addition, the elevation-dependent wetting and warming of the Qinghai–Tibet Plateau has also been widely reported [17]. Therefore, several interesting questions arise: is the warming and wetting widespread across the ACA? is the trend uniform or altitude-dependent?
In order to answer these questions, in this paper we focus on Xinjiang, NW China, the core area of ACA, specifically the Tianshan Mountains and Desert Ecozone. The boundaries of the Tianshan Mountains and Desert Ecozone are determined using the China Ecosystem Assessment and Ecological Security Pattern Database (http://english.igsnrr.cas.cn/sd/, accessed on 25 September 2020). The study area is home of the world’s tenth largest desert (i.e., the Taklamakan Desert) and one of the world’s largest mountain systems (i.e., the Tianshan Mountains), which consists of desert, oasis, forest, grassland, and tundra ecosystems, following a topographical gradient. These unique geographical features make it an ideal place to study the topographical difference in warming and wetting in ACA. We combine the ERA5-Land reanalysis data with the cloud-based Google Earth Engine platform to answer the following questions: (1) Is warming and wetting geographically uniform across ACA? (2) If not, are there spatial or elevational differences in warming and wetting that correspond to different ecosystem types in the region? (3) Does the variation in warming and wetting pose differential potential impacts on local ecosystems or society?

2. Study Area and Data
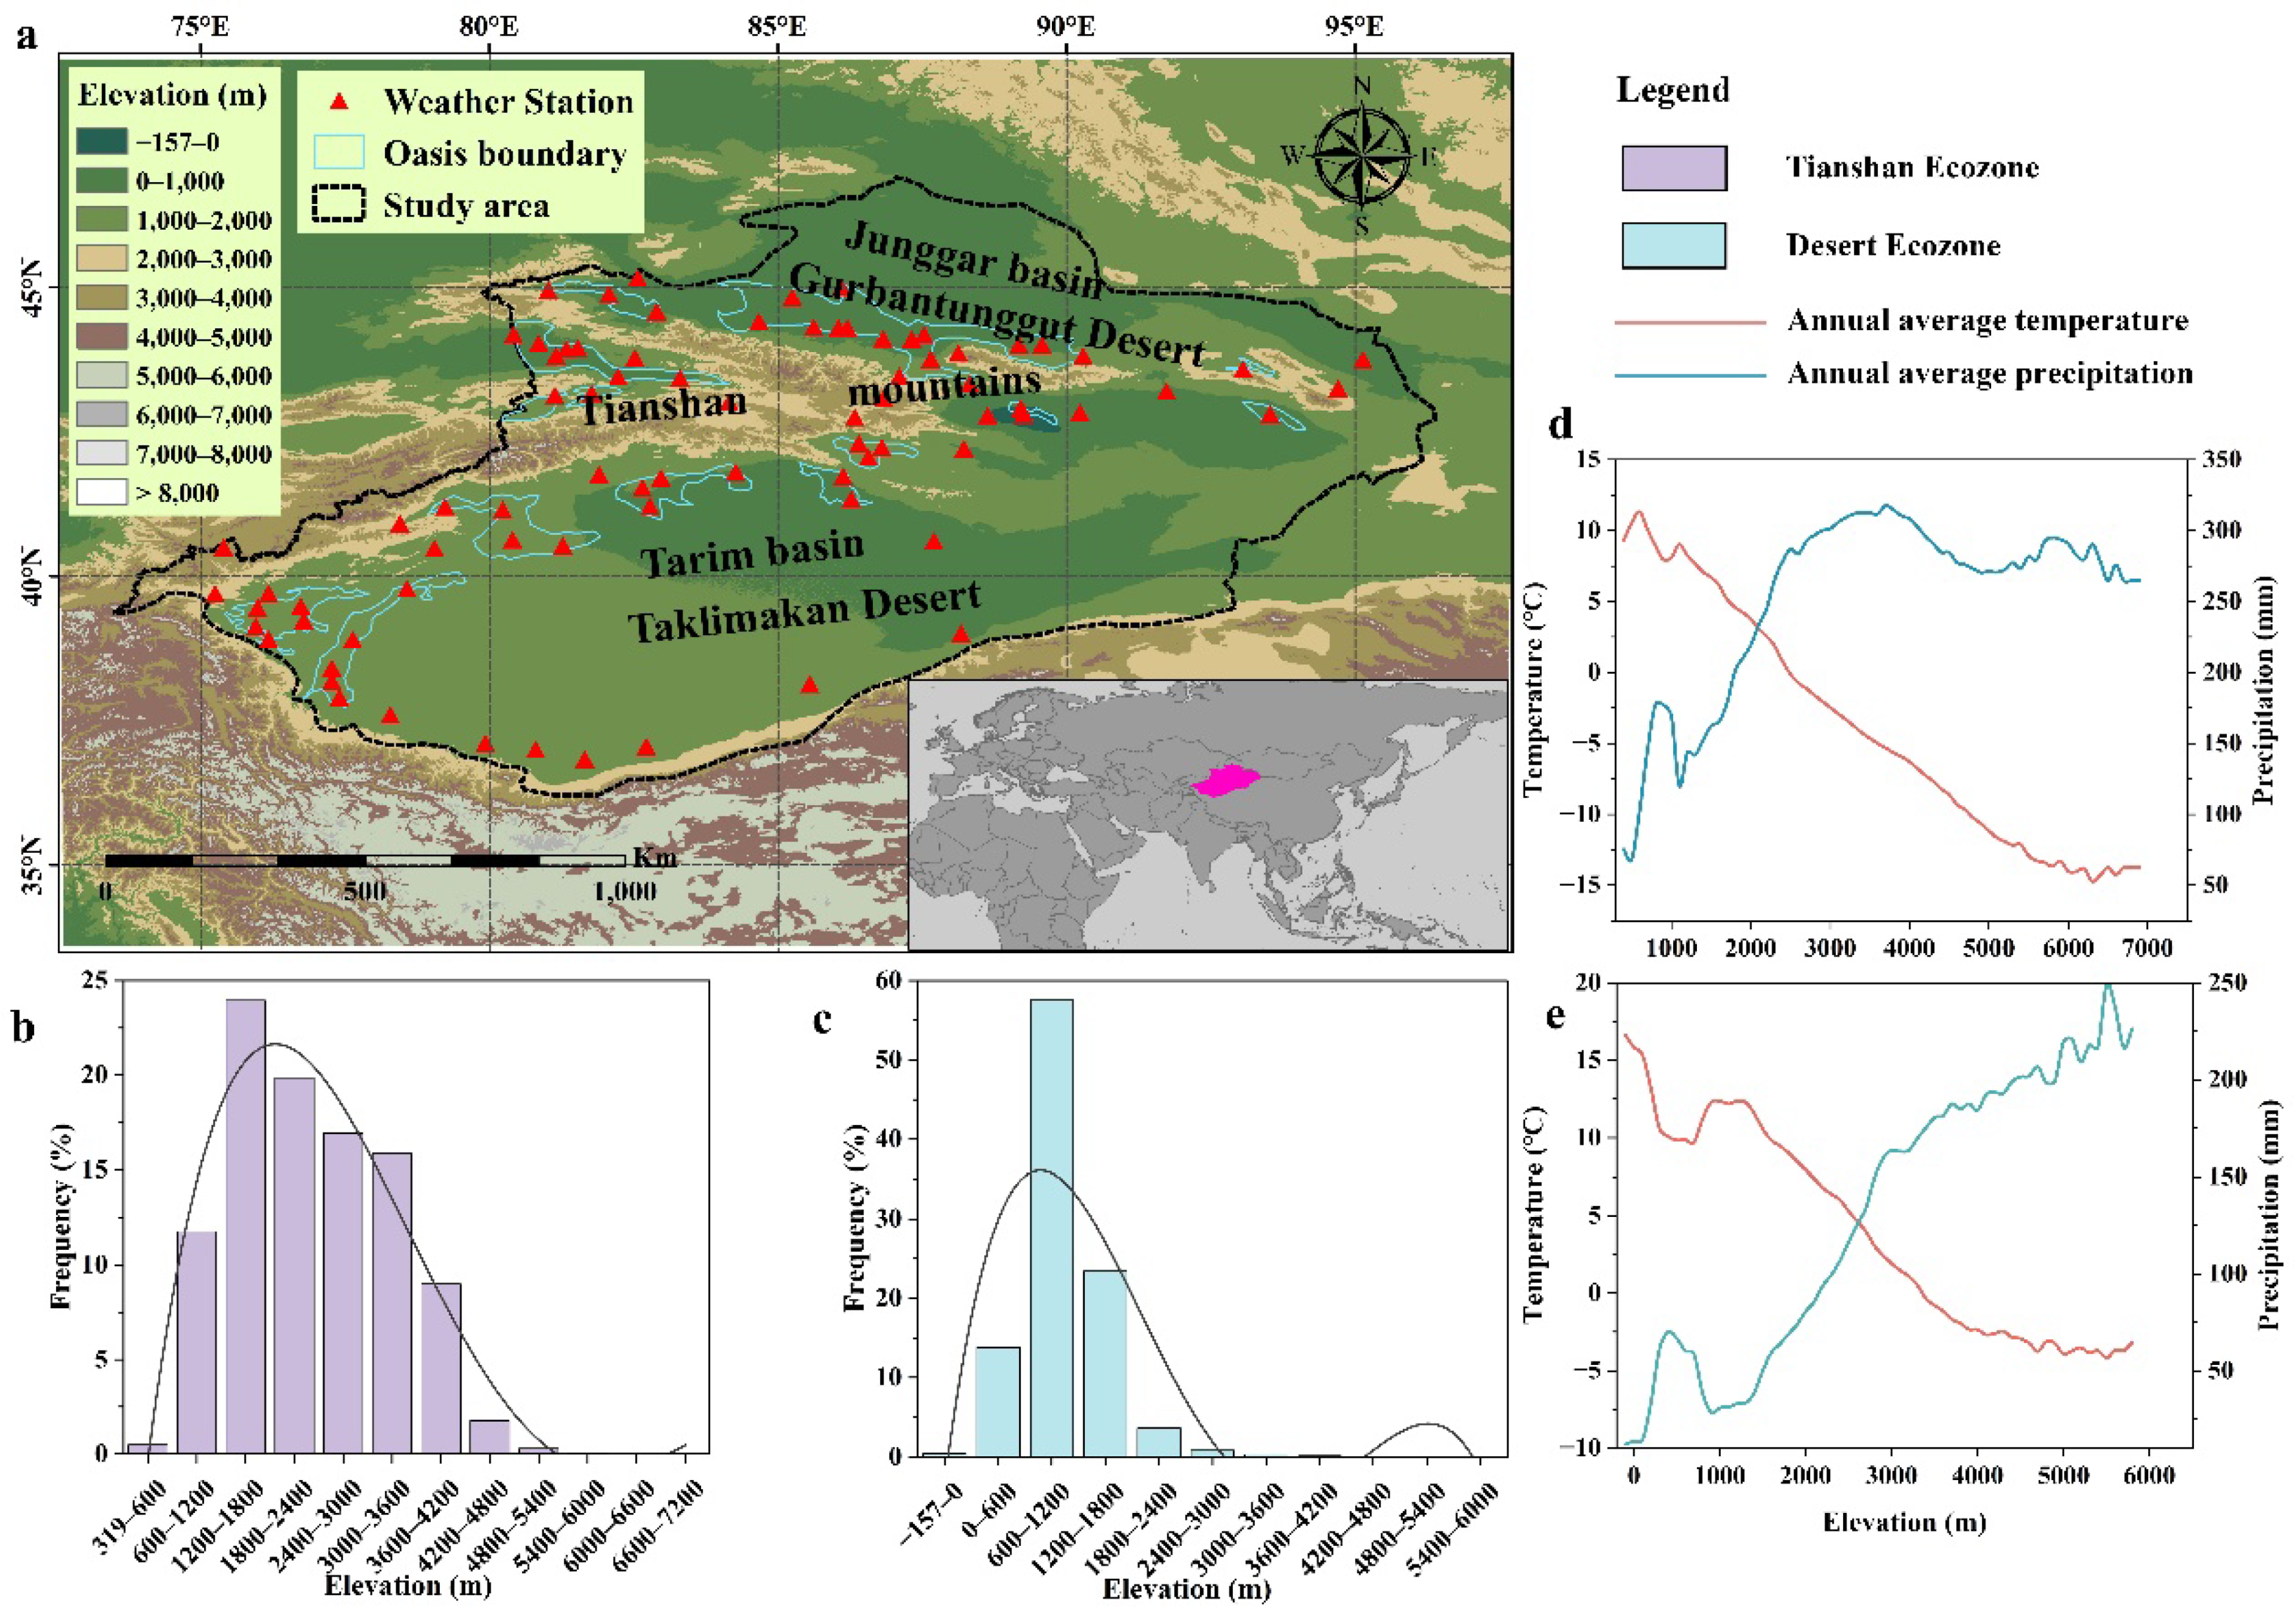
2.1. Study Area

The Tianshan Mountains and surrounding Desert Ecozone (TMDE) are located in the arid region of Northwest China, the heartland of Eurasia (Figure 1a). Among them, Tianshan Mountains Ecozone, also known as the Central Asian Water Tower, is the birthplace of many Central Asian rivers. A variety of vegetation belts and abundant glaciers developed in different altitudes, becoming an important ecological barrier and water source for low-altitude oases. The Desert Ecozone is located in the north and south of the Tianshan Mountains Ecozone. It is mainly composed of alpine deserts (e.g., the northern slope of the Kunlun Mountain), large deserts, and oases. The oases are co-located with the area of the highest population concentrations. The terrain of the Tianshan Mountains Ecozone has significant elevations, with altitudes of 600–4200 m (Figure 1b). The Desert Ecozone is mainly composed of large enclosed intermountain basins, where the terrain is relatively flat, with an altitude ranging between 0 and 1800 m (Figure 1c). The TMDE is characterized by a temperate continental climate. Among them, the Tianshan Mountains Ecozone have a multi-year (30-year average) average temperature of 1.5 °C and a multi-year average precipitation of 238 mm, whereas the Desert Ecozone has a multi-year average temperature of 11.4 °C and a multi-year average precipitation of 43 mm. Both the Tianshan Mountains Ecozone and the Desert Ecozone have the maximum amount of precipitation in June of the year. The distribution of annual average temperature and total annual precipitation in the TMDE exhibits an obvious altitude difference. For example, temperature in the Tianshan Mountains Ecozone decreases as altitude increases, and precipitation first increases and then decreases with an increase in altitude. Maximum precipitation (the sum of rainfall and snowfall) in the Tianshan Mountains Ecozone occurs at an elevation of 3700 m (Figure 1d). In the Desert Ecozone, annual average temperature decreases as altitude increases, while precipitation increases with an increase in altitude (Figure 1e).

2.2. Meteorological Data

There are 24 weather stations with long-term weather records in the Tianshan Mountains Ecozone. Among them, 18 stations are situated at an altitude of less than 2000 m, four stations situate at an altitude of 2000–3000 m, and only one station is located above 3000 m. There are 56 meteorological stations in the Desert Ecozone with 54 stations located below 2000 m and only two stations situated above 2000 m. The weather stations in the Tianshan Mountains Ecozone are mainly distributed in the central and western regions, and the weather stations in the Desert Ecozone are mainly distributed in low-altitude oases and cities. Due to the coarse spatial resolution, it is unrealistic to use weather station data to analyze the trend of changes in temperature and precipitation at different altitudes.
The ERA5-Land reanalysis data set, containing 50 climate variables and covering all land areas of the world, can accurately reflect climate changes of the past few decades with a relatively high temporal and spatial resolution. Therefore, this dataset has been used increasingly to study long-term climate change in areas where observational data is scarce [18]. Here, we retrieved temperature and total precipitation data with a monthly temporal resolution and a time range of 1981–2020 in ERA5-Land from the European Centre for Medium-Range Weather Forecasts (ECMWF) (https://www.ecmwf.int/, accessed on 3 October 2020). By using the Google Earth Engine, the meteorological data were ultimately synthesized into an annual scale (annual average temperature and annual total precipitation). On the cloud-based Google Earth Engine platform, first, we used the non-parametric Mann–Kendall trend test to analyze the inter-annual climate trend of the study area [19]. Then, we used linear regression coefficients (slope) to quantify the trend rate of temperature and precipitation along an altitudinal gradient [20]. In order to compare the differences in climate trends between different subregions, finally, we calculated the average rate of change in temperature and precipitation using the ArcMap platform.

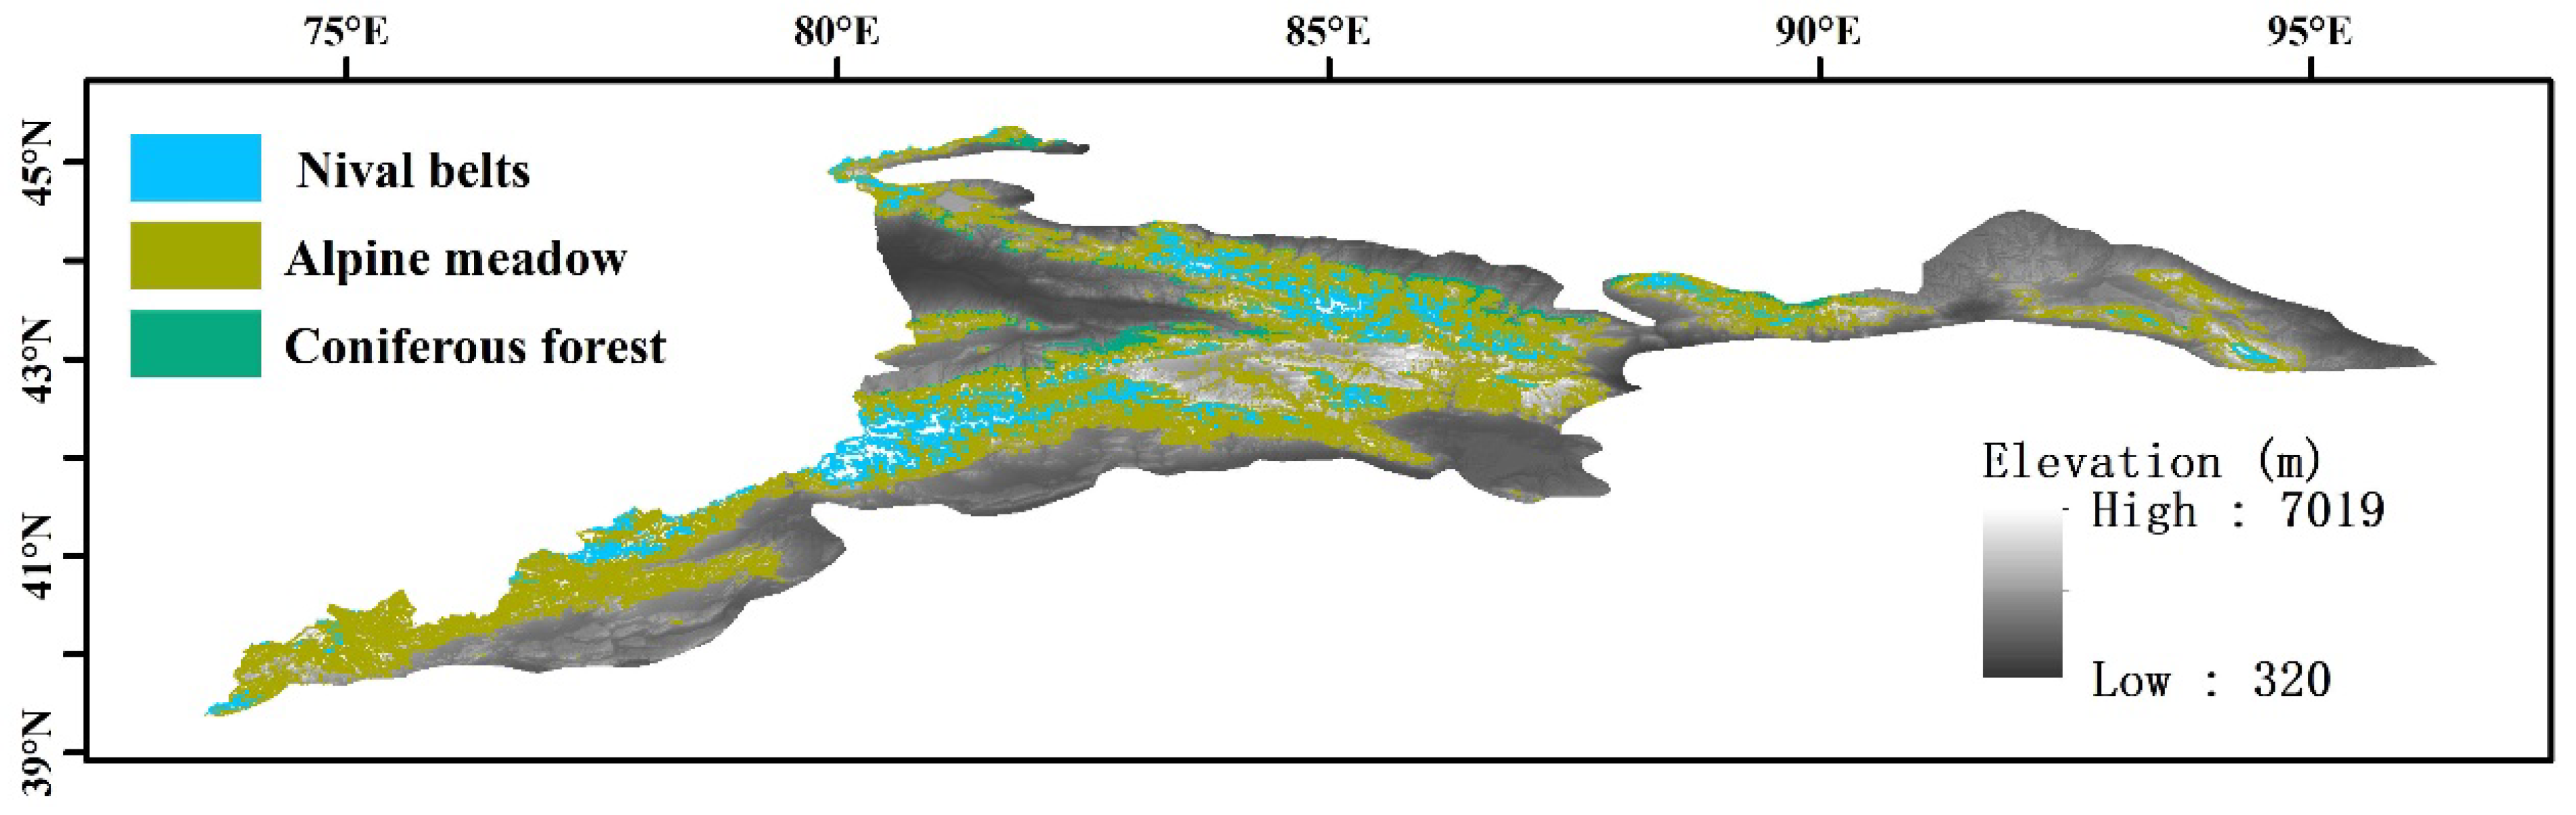
2.3. Digital Elevation and Landcover Data

High-precision elevation data are indispensable auxiliary data for studying the elevational difference in climate changes. Our elevation dataset comes from the SRTM-DEM (Shuttle Radar Topography Mission, Digital elevation models) of the U.S. Space Radar Topography Mission. This dataset has been widely used in geological disaster monitoring, forest resource investigation, glacier degradation monitoring etc. [21]. The land cover dataset comes from Copernicus Global Land Service (CGLS). CGLS provides a global land-cover product with a resolution of 100 m (https://lcviewer.vito.be/2015, accessed on 11 October 2020), which has played a role in forest monitoring, biodiversity protection, climate change, and other fields. We used this data to extract the spatial extent of the altitudinal vegetation belts in the Tianshan Mountains in order to analyze the climate change trends of different altitudinal vegetation belts. In order to extract the spatial extent of the altitudinal vegetation belts in the Tianshan Mountains, we reclassified the CGLS land cover data. We merged the different types of needle leaf forest (evergreen needle leaf and deciduous needle leaf) into one category, namely the coniferous forest belt. The grassland higher than the altitude of the coniferous forest belt is named alpine meadow [22]. The grasslands below the elevation of the coniferous forest belt are named montane steppe [23]. We renamed sparse vegetation to desert grassland. The spatial extent of snow and ice is defined as the nival belt.

3. Results

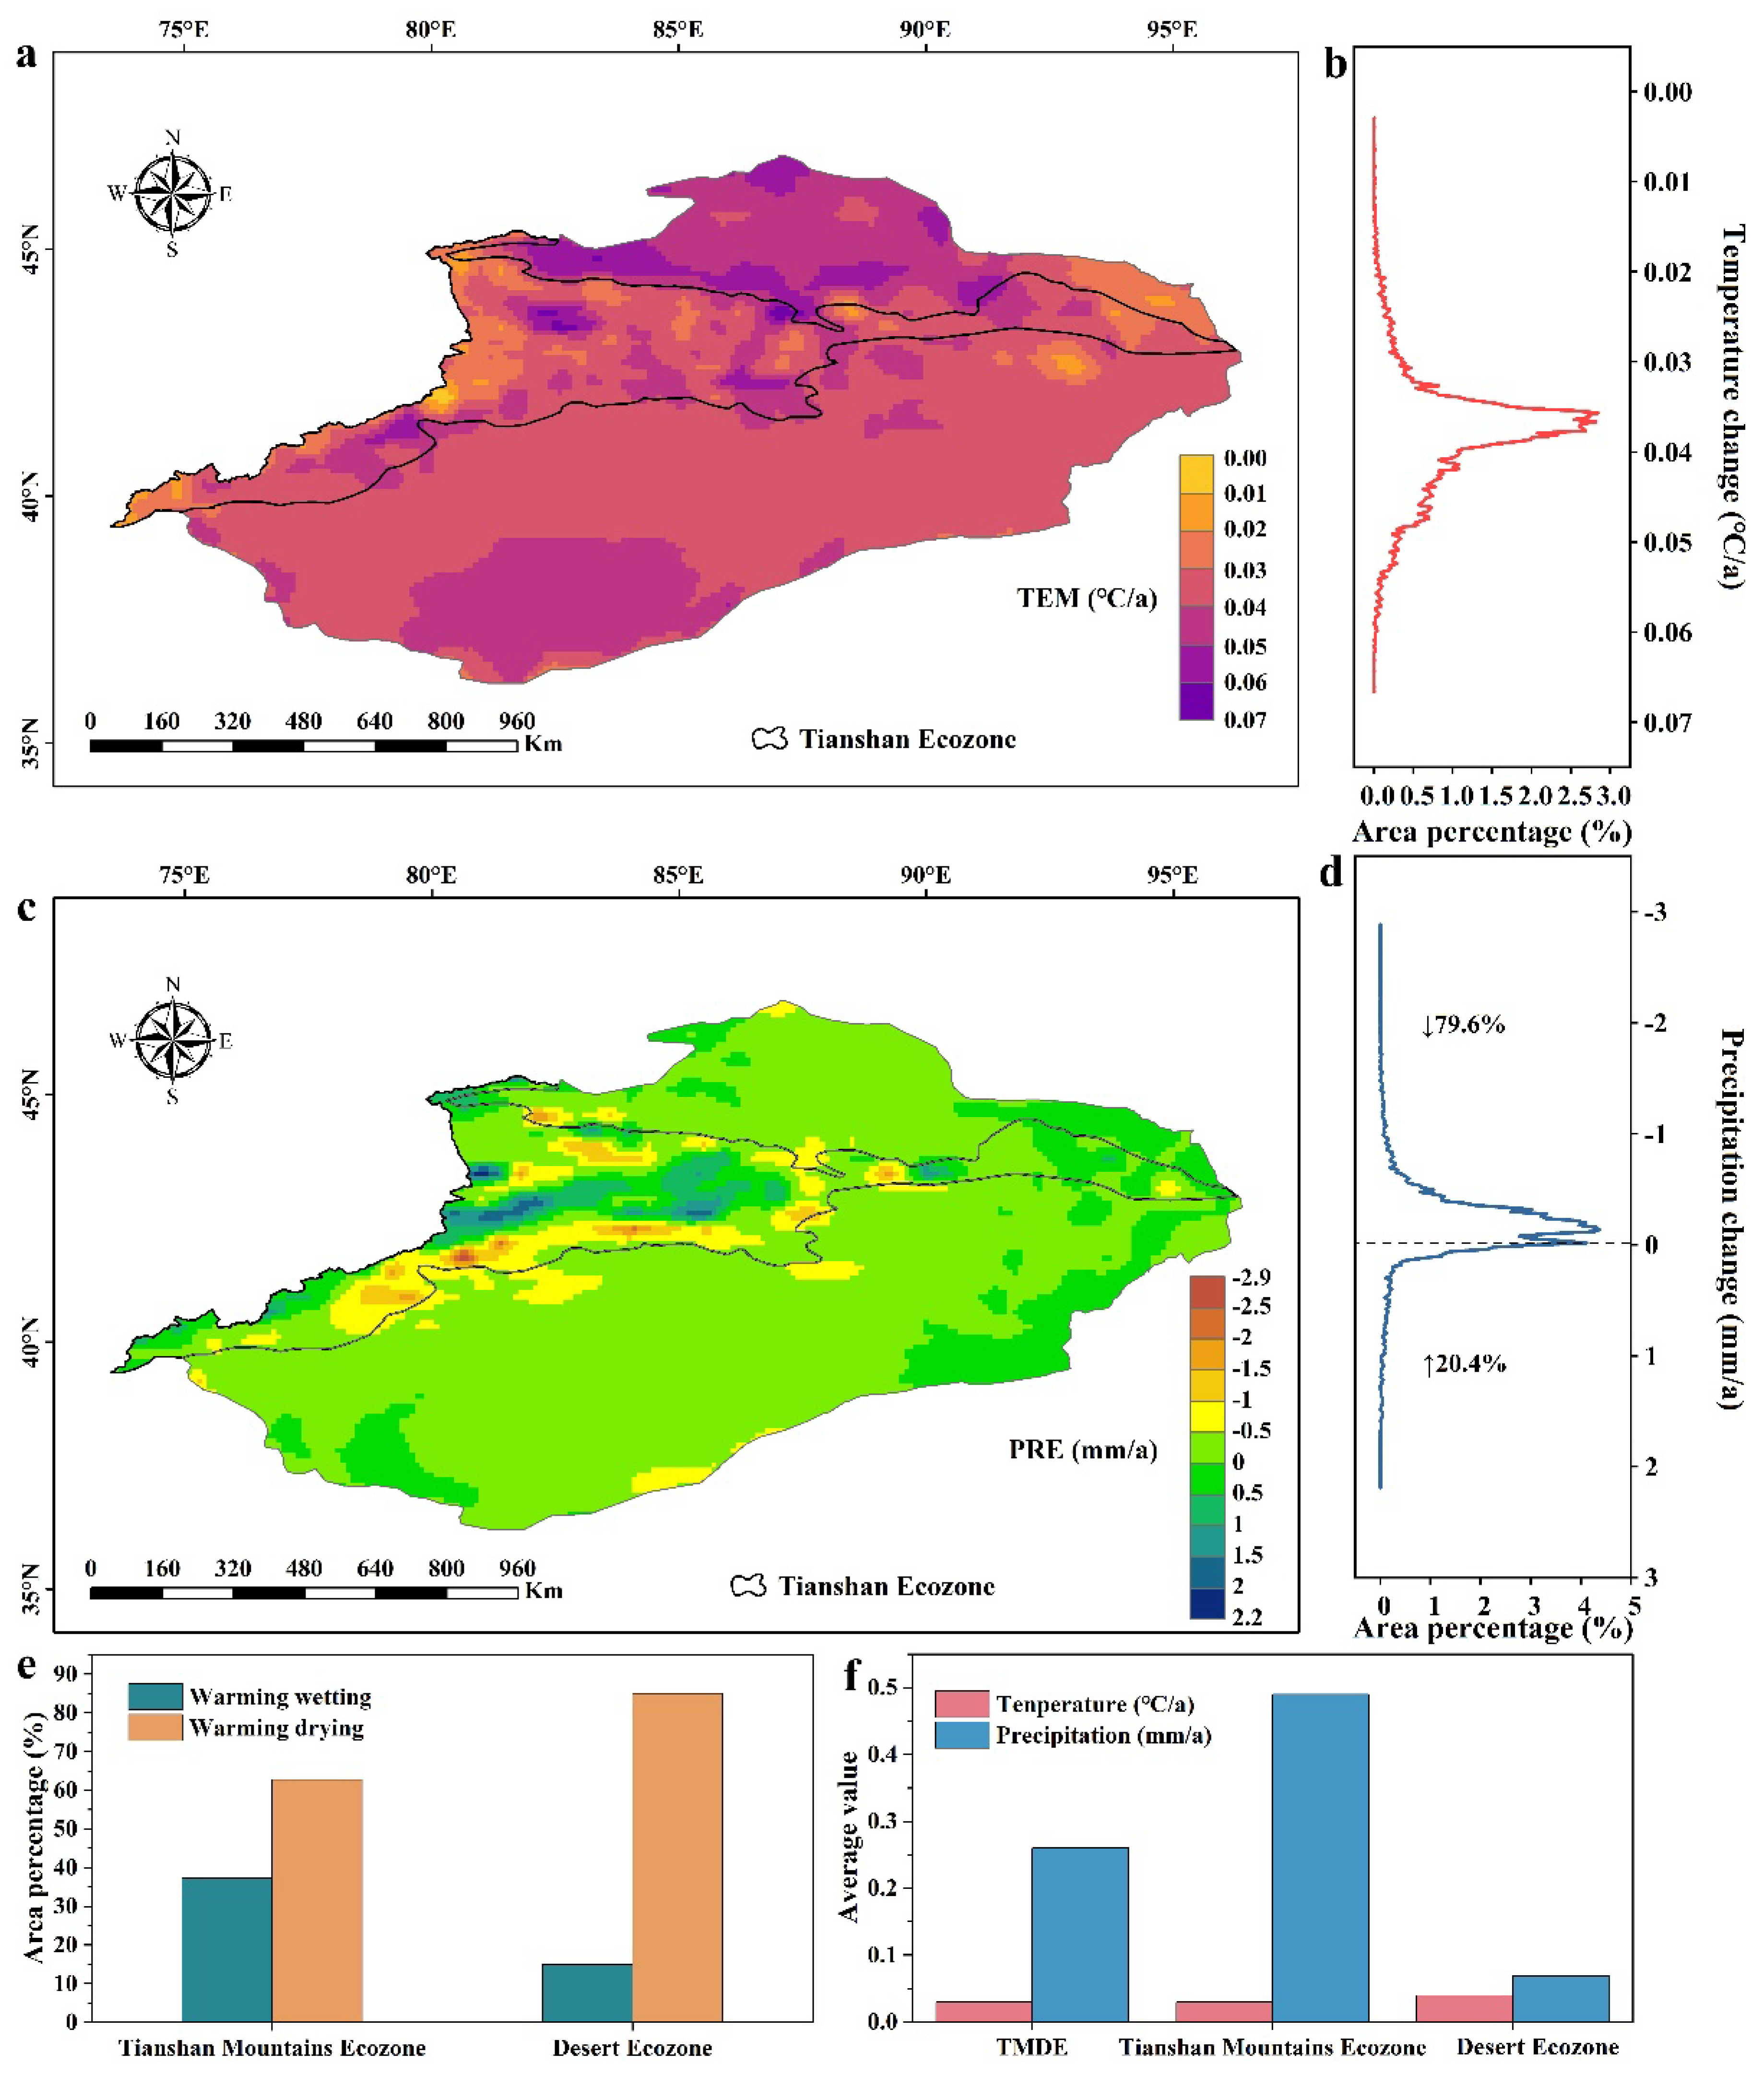
3.1. Spatial Differences in Climate Trends

We found a clear spatial pattern in regional temperature trends since the 1980s (Figure 2a). The Desert Ecozone had a higher rate of warming than the Tianshan Mountains Ecozone. The highest rate of warming occurred to the north of the Tianshan Mountains Ecozone. All parts of the study area exhibited some degree of warming over the study interval. A total of 95% of the region warmed at a rate between 0.3 and 0.5 °C/10a (“10a” means a decade). In addition, we found that the average rate of warming was 0.4 °C/10a (Figure 2b). The western Tianshan Mountains Ecozone warmed the least, and the spatial difference in other regions is not obvious. In contrast, we found a significant spatial difference in the warming trend of the Desert Ecozone. Among them, the Jungar Basin in the north warmed more than the Tarim Basin in the south, and the warming rate ranges from 0.4 to 0.7 °C/10a. The highest rate of warming in the Jungar Basin occurred in the oases at the northern foot of the Tianshan Mountains Ecozone. The warming trend in the southern Tarim Basin was relatively weak, with a warming rate of 0.3–0.4 °C/10a in most areas, with patches of high values around the oases of southern Tianshan Mountains Ecozone.
There are obvious spatial differences in the trend of total annual precipitation, and only a small portion of the area shows a wetting trend (Figure 2c). A total of 79.6% of the area shows a drying trend, with an average rate of −14.5 mm/10a (Figure 2d). Only 20.4% of the area shows a wetting trend, with an average rate of 11.0 mm/10a. The average rate of changes in precipitation in the Tianshan Mountains Ecozone is −1.3 mm/10a, and only the western and central parts show a wetting trend. The Desert Ecozone generally shows a drying trend, with an average rate of −1.7 mm/10a. The spatial difference in precipitation trends in the Desert Ecozone is small, and the rate of changes in precipitation is mainly between −5 and 5 mm/10a, and only some areas in the east showed a slight wetting trend.
Most parts of the study area are experiencing warming and drying, and only a few areas are experiencing warming and wetting. In the Tianshan Mountains Ecozone, a total of 37.3% of the area is experiencing warming and wetting, with an average warming rate of 0.3 °C/10a and an average wetting rate of 4.9 mm/10a. A total of 62.7% of the area shows a warming and drying trend (Figure 2e,f). In the Desert Ecozone, only 15% of the area is experiencing warming and wetting, with an average warming rate of 0.4 °C/10a and an average wetting rate of 0.7 mm/10a. However, the climate in 85% of the area is warming and drying (Figure 2e,f). In the warming and wetting area, the average warming rate is 0.3 °C/10a and the average wetting rate is 2.6 mm/10a (Figure 2f).

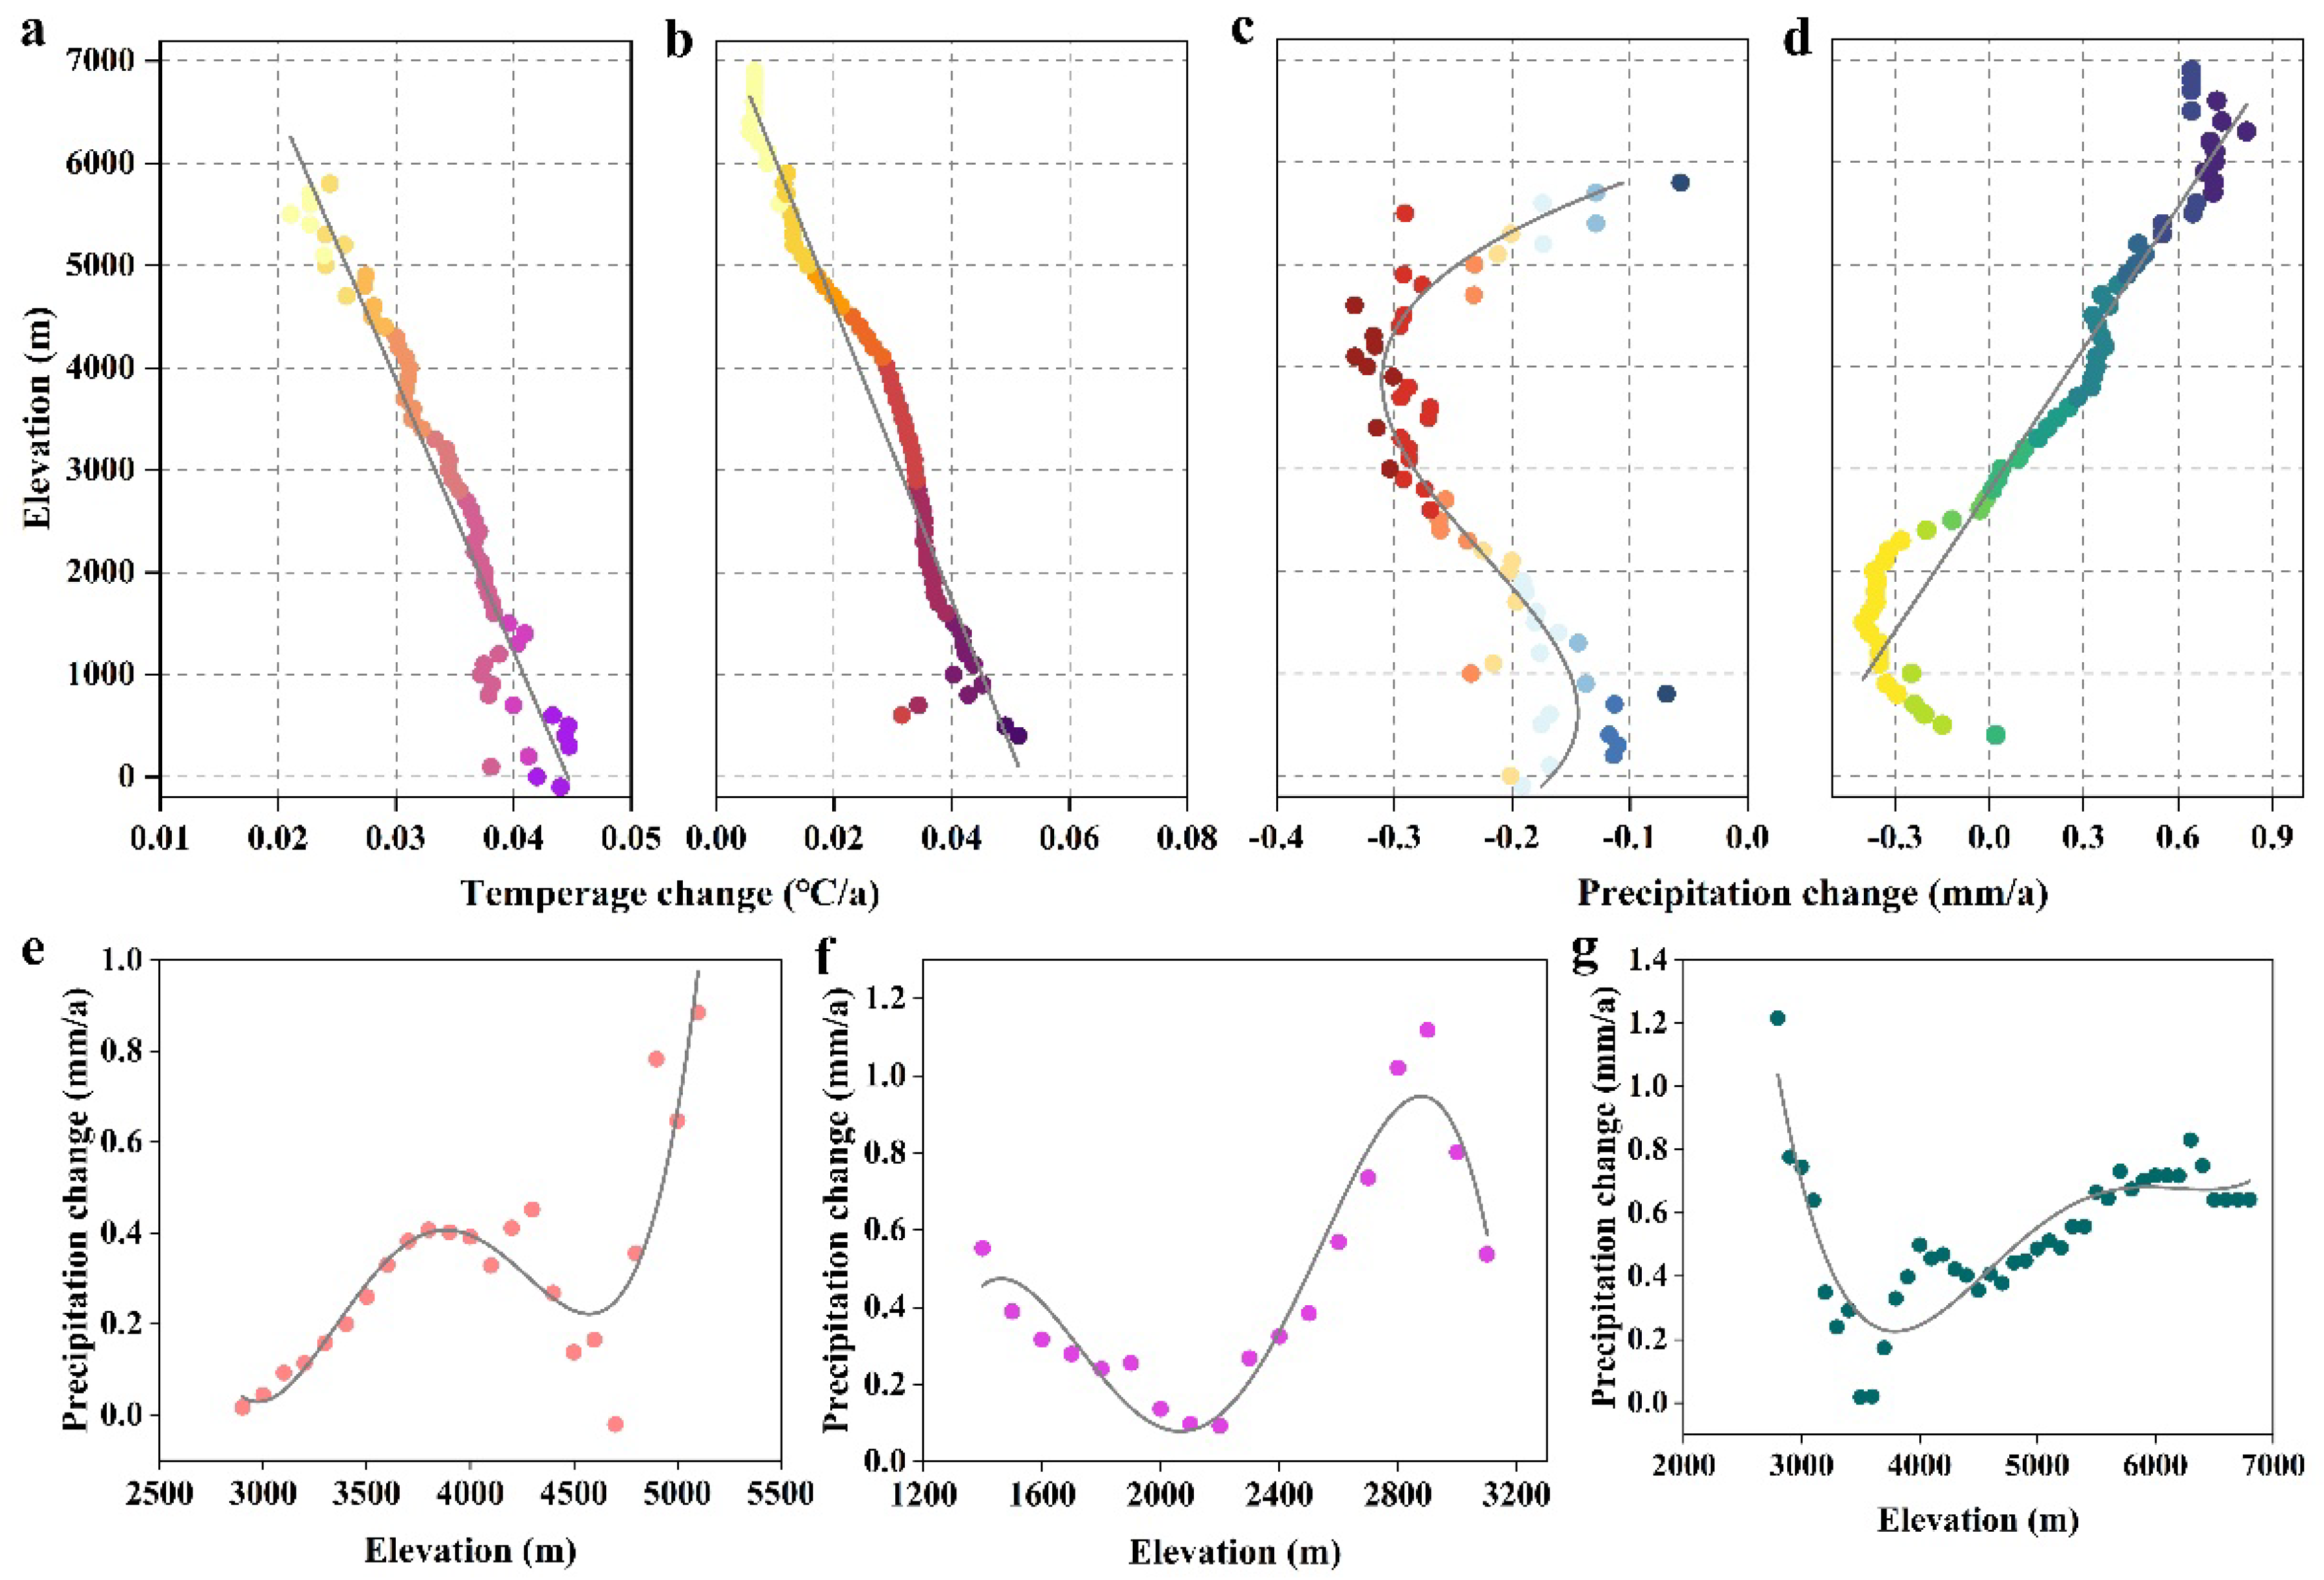
3.2. Altitudinal Difference in Climate Trends

We found a clear difference in temperature trends along altitudinal gradients. Based on DEM data, we calculated the average trend of climate change at different altitudes in 100 m intervals. We found significantly (p < 0.01) higher rates of warming at lower elevations in the Tianshan Mountains Ecozone and Desert Ecozone (Figure 3a,b). The correlation coefficient between warming rate and altitude was −0.97 and −0.96 for the Tianshan Mountains Ecozone and Desert Ecozone, respectively. The warming rate decreased from 0.4 °C/10a at −155 m below sea level to 0.2 °C/10a at 5800 m above sea level in the Desert Ecozone, while the warming rate decreased from 0.5 °C/10a at 400 m to 0.1 °C/10a at 6900 m in the Tianshan Mountains Ecozone. These results indicate that there is not elevation-dependent warming in the Tianshan Mountains Ecozone and Desert Ecozone, and the low-altitude foothills show the greatest warming. In addition, the altitudinal difference of the warming trend is more obvious in the Tianshan Mountains Ecozone than of that elsewhere.
We found a significant altitudinal difference in precipitation trends in the two sub-regions (Figure 3c,d). In the Desert Ecozone, precipitation shows a decreasing trend at all altitudes. However, the precipitation trend has a significant negative correlation with altitude below 4000 m above sea level (p < 0.01) and a clear positive correlation with altitude above 4000 m (p < 0.01). In addition, we found that, between 2000–5000 m above sea level, the drying trend is more pronounced than of that in other altitude ranges. In the Tianshan Mountains Ecozone, precipitation shows a decreasing trend at altitudes below 2800 m, but an increasing trend appears at altitudes above 2800 m. The wetting trend became significantly more pronounced at higher elevations. For example, at elevations above 2800 m, the correlation coefficient between wetting rate and altitude was 0.96 (p < 0.01).
The Tianshan Mountains Ecozone has developed complete altitudinal vegetation belts, including the desert steppe belt, montane steppe belt, coniferous forest belt, alpine meadow belt, and nival belt. Only the altitudes above 2800 m in the Tianshan Mountains Ecozone showed elevation-dependent wetting. Because only three vegetation belts (i.e., coniferous forest, alpine meadow, and nival) are found at these altitudes, we further analyze whether or not these vegetation belts exhibited elevation-dependent wetting. Because almost no coniferous forest belt is found in the south, the lower line of the alpine meadow belt in the south is generally lower than the forest line in the north and west. Therefore, the altitude ranges of the two vegetation belts (the entire Tianshan Mountains) overlap in some altitude ranges (Figure 4). In addition, the snow line of the nival belt in the east of the Tianshan Mountains is higher than the snow line in the north, causing the upper line of the eastern alpine meadow to be higher than the snow line in parts of the north. Therefore, we calculated that the elevation ranges of the two vegetation belts in the entire Tianshan Mountains overlap in some elevation ranges (Figure 4).
For the alpine meadow, we did not find an altitudinally consistent relationship between elevation and precipitation change, but there is a significant (p < 0.01) elevation-dependent wetting between 2900–3800 m, where we found a correlation coefficient of 0.99 (Figure 3e). Similarly, for the coniferous forest belt, we found no relationship between precipitation change and altitude, but precipitation had a significant (p < 0.01) elevation dependence between 2200–2900 m, with a correlation coefficient of 0.98 (Figure 3f). The rate of change in precipitation in the nival belt showed a decreasing trend with altitude below 3500 m, but an increasing trend with altitude above 3500 m (p < 0.01; correlation coefficient 0.87) (Figure 3g). These results indicate that the elevation-dependent wetting in the high-altitude vegetation belts of the Tianshan Mountains Ecozone is not universal but occurs only in a specific altitude range.

3.3. Relationship between Warming and Wetting at High Altitudes

In the Tianshan Mountains Ecozone, we found a negative correlation between the rates of changes in temperature or precipitation and elevation in the warming and wetting areas. Therefore, we further analyzed the possible relationship between temperature and precipitation trends in different vegetation zones including alpine meadow, coniferous forest, and nival belt at different altitudes in the Tianshan Mountains Ecozone (Figure 5). For the Tianshan Mountains Ecozone, we found that the rate of warming decreased significantly with altitude, while the rate of changes in precipitation showed the opposite pattern, indicating that there is a significant (p < 0.01) negative correlation (R2 = −0.95) of the rate of changes in both temperature and precipitation with altitude (Figure 5a).
For the alpine meadow, the trend in the rate of changes in temperature and precipitation were also negatively correlated with altitude (R2 = −0.88 and p < 0.01) (Figure 5b). However, neither relationship was altitudinally consistent. There is a significant positive correlation between the rate of changes in precipitation and altitude, which is persistent at the altitudes below 4300 m and above 4700 m, and a negative correlation prevails in between. For the coniferous forest, the strongest warming trend occurs at the lower elevations and the weakest warming trend occurs at the higher elevations (Figure 5c). As discussed above, the relationship between the rate of changes in precipitation and elevation is more complex (Figure 3f and Figure 5c). However, we still found a significant negative correlation between temperature and precipitation trends over the entire altitude range (p < 0.01 and R2 = −0.71) (Figure 5c). For the nival belt, we found a significant negative correlation between the trend of changes in temperature and precipitation (R2 = −0.56 and p < 0.01) (Figure 5d). According to our analysis, in the entire Tianshan Mountains Ecozone and high-altitude vegetation belts, precipitation and temperature trends are negatively correlated at all altitudes.

4. Discussion

4.1. Temporal and Spatial Differences in the Warming and Wetting Trends

Spatial differences in the warming and wetting trends have been widely reported. Most studies reveal that the Arid Central Asia generally shows a warming and wetting trend, but it is also generally believed that the mountainous areas have the largest increase in precipitation. Although annual precipitation in the ACA showed an overall increasing trend [24], the increase in precipitation in the mountainous areas (e.g., west Tianshan) was significantly higher than that in the plains, while the desert areas showed a decreasing trend [25,26]. Our results also show that the increasing trend of precipitation in high mountain areas is more pronounced, but the desert areas show varying degrees of warming and drying. Our research results not only make the previous findings clearer, but also study in more detail the differences in warming and wetting trends within a different ecozone and different altitudinal vegetation belts. Specifically, first, we focused on the warming and wetting since 1980s whether there is spatial heterogeneity. Second, in order to avoid potential errors arising from the use of scarce and unevenly distributed station records, we used spatially continuous reanalysis data to conduct our analyses. Because of the diverse nature of the ecosystem and altitude-dependent climate conditions, the reanalysis data we used can more finely and accurately characterize the current and past climate changes.

4.2. Pronounced Warming and Drying Trends in Oases

Some studies have suggested that temperature rise in oases around the Tianshan Mountains Ecozone is more significant than of that in the mountains [27]. Especially after the 1990s, the rate of warming in oases was significantly higher than that in mountains and deserts [28]. Our findings reinforced previous results by showing that warming and drying is more pronounced in oases, where human population centers are concentrated. In recent decades, due to the rapid economic development in Xinjiang and the adjustment of industrial structure, the expansion of oases and the process of urbanization have accelerated [29]. The areal extent of oases in Xinjiang increased by 35% in 1990–2008, severely squeezing the area of the transitional zone between oases and deserts, which decreased by 43% [30]. The expansion of oases and the process of urbanization have further reduced vegetation cover, especially in the transitional zone between oases and deserts, where there is a wealth of biodiversity. The result of this change has been a reduced oases effect. In addition, due to the increase in urban population density and the expansion of industrial activities, more greenhouse gases and aerosol pollutants are emitted [31]. Warming and drying in low-altitude areas may limit vegetation growth and reduce vegetation coverage, thereby weakening the storage capacity of soil organic carbon and further aggravating the warming.
Anthropogenic effects (e.g., the expansion of artificial oases, etc.) and the natural drying are superimposed, making the trend of oases drying more obvious. Our results show that the drying trend in oases around the Tianshan Mountains is more pronounced than that in surrounding areas. A possible explanation is that the expansion of oases and agricultural irrigation may increase the evapotranspiration on the ground and increase the water vapor content in the air. However, in daytime, due to the influence of the mountains and the oases circulation system (i.e., the effect of valley winds), the water vapor of the oases is transported to high-altitude areas in the mountains, causing the humid air to cool down and form precipitation [32]. Therefore, the expansion of oases and agricultural irrigation mainly increased precipitation at high altitudes in the Tianshan Mountains Ecozone (mainly in summer), but the humidification effect on the oases themselves was weak. Other studies have also shown that the use of flood irrigation and drip irrigation in oases in the arid region of Central Asia increases the water vapor in the air and accelerates the hydrological cycle of the whole region. However, due to the existence of local circulation (the role of valley winds), summer precipitation in mountainous areas increased significantly, but there was no obvious trend of wetting in the deserts and oases [33].
The warming and drying climate trend may weaken the oases effect. In arid regions of China, due to the high-temperature and arid climate, the oases effect is particularly important. Oases are the main area for human life and economic activities in this region. Although oases only account for 5% of the total area of the arid regions, it feeds 95% of the regional population [34]. In addition, the evapotranspiration of oases vegetation not only reduces the temperature of the oases surface (oases effect), but also produces water vapor that flows into the surrounding desert, which is of great importance for maintaining the oases and surrounding desert ecosystems [35]. However, oases expansion and urbanization may further strengthen the trend of warming and drying and reduce vegetation cover, which in turn may weaken the oases effect [36]. Within this context, extreme high-temperature and drought events may occur frequently. Such a climate trend may reduce the vegetation coverage in oases and the desert transitional zone, causing sand dunes to encroach on villages and farmlands, thereby threatening local environment and residents. In addition, a drier climate may result in more frequent sandstorms and high dust loading in the atmosphere, which will adversely affect the lives and health of local residents.

4.3. Persistence of the Warming and Wetting Trend and Socioeconomic Implications

The TMDE is expected to become warmer and wetter by the end of this century, according to the CMIP5 ensemble model. Looking across three emissions scenarios (e.g., RCP 2.6, RCP4.5, and RCP8.5), annual precipitation is projected to increase further under higher emission scenarios [37]. However, the ensemble modeling projects that the highest increase of precipitation will occur at high elevations and the lowest values at low elevations (e.g., the piedmont of the Tianshan Mountains and oases). Conversely, the highest rates of warming occur at lower elevations, and vice versa. Precipitation in the southern oases of the Tianshan Mountains Ecozone does not have a clear increasing trend, but the magnitude of precipitation is higher than that in the mountain [38,39]. For the whole of Northwest China, both annual precipitation and annual average temperature are projected to increase under different emissions scenarios. Among them, the highest value of precipitation increase appears in high-elevation mountainous areas, but the highest value of temperature increase appears in low-elevation oases and deserts [40,41]. According to the analysis results of the CMIP6 ensemble modeling, annual precipitation in most arid regions of Central Asia, especially in Tianshan Mountains Ecozone and Northern Central Asia, increases significantly with the increase of temperature. In addition, the response of annual precipitation to global warming is also higher in areas with larger annual precipitation [42].
The slight wetting trend of the oases does not offset the risk of drought. Palmer Drought Severity Index (PDSI) is often used to evaluate the degree of drought in an area [43]. Specifically, a more severe drought has a more negative PDSI value, and a negative trend in PDSI indicates more severe droughts [44]. The authors of [45] analyzed the CMIP6 ensemble modeling and found that, under three climate change scenarios (SSP1-2.6, SSP2-4.5 and SSP5-8.5), the aridity of the arid region of Northwest China will increase, and the aridity of Xinjiang will also show a linear increasing trend (Figure 1). In [45], they also found that under SSP2-4.5, the oasis and desert in the northern part of the Tianshan Mountains were in a significant drought trend (Figure 6a), and drought events occurred more commonly in the oasis than in the Tianshan Mountains (Figure 6b). Although precipitation in the oases generally shows an increasing trend, the significant warming also enhances evapotranspiration. When evapotranspiration exceeds precipitation, the oases will face a serious risk of drought.
In the future, oases are likely to face weaker wetting trends and significantly higher warming than mountains. Higher precipitation changes increase the frequency of extreme precipitation, and flash floods may cause large-scale loss of life and economic damages. In addition, significant warming has increased vapor pressure deficit (VPD) and subsequently the occurrence of atmospheric aridity, and the increase of VPD may accelerate the transpiration of plants and the loss of soil moisture [46]. Oases are often an area with developed agriculture in arid regions. Corn and wheat belonging to the Poaceae family and some vegetables belonging to the Brassicaceae family are all shallow rooted plants. The content of soil water is important for the germination and growth of crops and vegetables. The loss of soil moisture caused by meteorological drought may reduce crop yields. Although under the background of elevated CO2, plants may reduce transpiration by reducing stomatal conductance and alleviate the water stress of atmospheric drought on vegetation. However, under conditions of high CO2 concentration, the ability of vegetation in arid regions to optimize water use is limited [47].

5. Conclusions

We combined the cloud-based Google Earth Engine platform and the ERA5-Land reanalysis dataset to analyze the altitudinal differences in the temperature and precipitation trends of the TMDE in Northwest China. Our analyses revealed that, since the 1980s, only 20.4% of the TMDE showed warming and wetting, which was mainly distributed in the high-altitude areas above 2800 m in the Tianshan Mountains Ecozone. Nearly 80% of the TMDE has been warming and drying since the 1980s. The warming and drying trends are significant in the oases area around Tianshan Mountains Ecozone where population and economic activities are concentrated. This area will be at greater risk of drought as projected under several future emissions scenarios.

Author Contributions

L.L.: conceptualization, methodology. Y.Z. (Yong Zhang): data curation, writing—original draft preparation. Y.Z. (Yanzhen Zhang): visualization, investigation. C.L. and W.Z.: code checking and data quality control. C.A.: writing—review and editing. All authors have read and agreed to the published version of the manuscript.

Funding

This work was supported by the National Natural Science Foundation of China (42071102).

Data Availability Statement

Data sharing not applicable.

Acknowledgments

We thank Tim Treuer at Princeton University for his assistance with English language and grammatical editing. We would also like to thank Professor Zhang Xu and Professor Yu Shi-yong for their suggestions and discussions.

Conflicts of Interest

The authors declare no conflict of interest.

References

  1. Yao, J.Y.; Liu, H.P.; Huang, J.P.; Gao, Z.M.; Wang, G.Y.; Li, D.; Yu, H.P.; Chen, X.Y. Accelerated dryland expansion regulates future variability in dryland gross primary production. Nat. Commun. 2020, 11, 1665. [Google Scholar] [CrossRef] [Green Version]
  2. Zhang, A.Z.; Jia, G.S.; Epstein, H.E.; Xia, J.J. ENSO elicits opposing responses of semi-arid vegetation between Hemispheres. Sci Rep. UK 2017, 7, 42281. [Google Scholar] [CrossRef] [Green Version]
  3. Huang, J.; Li, Y.; Fu, C.; Chen, F.; Fu, Q.; Dai, A.; Shinoda, M.; Ma, Z.; Guo, W.; Li, Z.; et al. Dryland climate change: Recent progress and challenges. Rev. Geophys. 2017, 55, 719–778. [Google Scholar] [CrossRef]
  4. Huang, J.P.; Ji, M.X.; Xie, Y.K.; Wang, S.S.; He, Y.L.; Ran, J.J. Global semi-arid climate change over last 60 years. Clim. Dynam. 2016, 46, 1131–1150. [Google Scholar] [CrossRef] [Green Version]
  5. Huang, J.P.; Yu, H.P.; Guan, X.D.; Wang, G.Y.; Guo, R.X. Accelerated dryland expansion under climate change. Nat. Clim. Chang. 2016, 6, 166–171. [Google Scholar] [CrossRef]
  6. Pan, N.; Wang, S.; Liu, Y.X.; Li, Y.; Xue, F.; Wei, F.L.; Yu, H.P.; Fu, B.J. Rapid increase of potential evapotranspiration weakens the effect of precipitation on aridity in global drylands. J. Arid Environ. 2021, 186, 104414. [Google Scholar] [CrossRef]
  7. Loh, P.S.; Alnoor, H.I.M.; He, S.Y. Impact of Climate Change on Vegetation Cover at South Port Sudan Area. Climate 2020, 8, 114. [Google Scholar] [CrossRef]
  8. Daramola, M.T.; Xu, M. Recent changes in global dryland temperature and precipitation. Int. J. Climatol. 2021. [Google Scholar] [CrossRef]
  9. Strydom, S.; Savage, M.J.; Clulow, A.D. Long-term trends and variability in the dryland microclimate of the Northern Cape Province, South Africa. Theor. Appl. Climatol. 2019, 137, 963–975. [Google Scholar] [CrossRef]
  10. Zhao, Y.; Zhang, H.Q. Impacts of SST Warming in tropical Indian Ocean on CMIP5 model-projected summer rainfall changes over Central Asia. Clim. Dynam. 2016, 46, 3223–3238. [Google Scholar] [CrossRef] [Green Version]
  11. Deng, H.J.; Chen, Y.N.; Shi, X.; Li, W.H.; Wang, H.J.; Zhang, S.H.; Fang, G.H. Dynamics of temperature and precipitation extremes and their spatial variation in the arid region of northwest China. Atmos Res. 2014, 138, 346–355. [Google Scholar] [CrossRef]
  12. Junqiang, Y.; Yaning, C.; Jing, C.; Yong, Z.; Dilinuer, T.; Jiangang, L.; Lianmei, Y.; Weiyi, M. Intensification of extreme precipitation in arid Central Asia. J. Hydrol. 2020, 598, 125760. [Google Scholar] [CrossRef]
  13. Li, B.F.; Chen, Y.N.; Chen, Z.S.; Xiong, H.G.; Lian, L.S. Why does precipitation in northwest China show a significant increasing trend from 1960 to 2010? Atmos Res. 2016, 167, 275–284. [Google Scholar] [CrossRef]
  14. Wang, Q.; Zhai, P.M.; Qin, D.H. New perspectives on ‘warming-wetting’ trend in Xinjiang, China. Adv. Clim. Chang. Res. 2020, 11, 252–260. [Google Scholar] [CrossRef]
  15. Yu, Y.; Pi, Y.Y.; Yu, X.; Ta, Z.J.; Sun, L.X.; Disse, M.; Zeng, F.J.; Li, Y.M.; Chen, X.; Yu, R.D. Climate change, water resources and sustainable development in the arid and semi-arid lands of Central Asia in the past 30 years. J. Arid Land 2019, 11, 1–14. [Google Scholar] [CrossRef] [Green Version]
  16. Kirpotin, S.N.; Callaghan, T.V.; Peregon, A.M.; Babenko, A.S.; Berman, D.I.; Bulakhova, N.A.; Byzaakay, A.A.; Chernykh, T.M.; Chursin, V.; Interesova, E.A.; et al. Impacts of environmental change on biodiversity and vegetation dynamics in Siberia. Ambio 2021, 1–27. [Google Scholar] [CrossRef]
  17. Li, X.P.; Wang, L.; Guo, X.Y.; Chen, D.L. Does summer precipitation trend over and around the Tibetan Plateau depend on elevation? Int. J. Climatol. 2017, 37, 1278–1284. [Google Scholar] [CrossRef]
  18. Crowhurst, D.; Dadson, S.; Peng, J.; Washington, R. Contrasting controls on Congo Basin evaporation at the two rainfall peaks. Clim. Dynam. 2021, 56, 1609–1624. [Google Scholar] [CrossRef]
  19. Guan, Y.L.; Lu, H.W.; Yin, C.; Xue, Y.X.; Jiang, Y.L.; Kang, Y.; He, L.; Heiskanen, J. Vegetation response to climate zone dynamics and its impacts on surface soil water content and albedo in China. Sci. Total Environ. 2020, 747, 141537. [Google Scholar] [CrossRef]
  20. Usman, M.; Nichol, J.E.; Ibrahim, A.T.; Buba, L.F. A spatio-temporal analysis of trends in rainfall from long term satellite rainfall products in the Sudano Sahelian zone of Nigeria. Agric. Forest Meteorol. 2018, 260, 273–286. [Google Scholar] [CrossRef]
  21. Chen, C.F.; Yang, S.; Li, Y.Y. Accuracy Assessment and Correction of SRTM DEM Using ICESat/GLAS Data under Data Coregistration. Remote Sens. 2020, 12, 3435. [Google Scholar] [CrossRef]
  22. Wan, H.; Wang, X.; Luo, L.; Guo, P.; Zhao, Y.; Wu, K.; Ren, H. Remotely-Sensed Identification of a Transition for the Two Ecosystem States Along the Elevation Gradient: A Case Study of Xinjiang Tianshan Bogda World Heritage Site. Remote Sens. 2019, 11, 2861. [Google Scholar] [CrossRef] [Green Version]
  23. Zhang, H.X.; Zhang, M.L.; Sanderson, S.C. Retreating or Standing: Responses of Forest Species and Steppe Species to Climate Change in Arid Eastern Central Asia. PLoS ONE 2013, 8, e61954. [Google Scholar] [CrossRef] [Green Version]
  24. Yang, H.; Xu, G.Y.; Mao, H.X.; Wang, Y. Spatiotemporal Variation in Precipitation and Water Vapor Transport Over Central Asia in Winter and Summer Under Global Warming. Front. Earth Sc. Switz. 2020, 8, 297. [Google Scholar] [CrossRef]
  25. Chen, F.H.; Huang, W.; Jin, L.Y.; Chen, J.H.; Wang, J.S. Spatiotemporal precipitation variations in the arid Central Asia in the context of global warming. Sci. China Earth Sci. 2011, 54, 1812–1821. [Google Scholar] [CrossRef]
  26. Luo, M.; Liu, T.; Meng, F.H.; Duan, Y.C.; Bao, A.M.; Frankl, A.; De Maeyer, P. Spatiotemporal characteristics of future changes in precipitation and temperature in Central Asia. Int. J. Climatol. 2019, 39, 1571–1588. [Google Scholar] [CrossRef]
  27. Fu, A.H.; Chen, Y.N.; Li, W.H.; Li, B.F.; Yang, Y.H.; Zhang, S.H. Spatial and temporal patterns of climate variations in the Kaidu River Basin of Xinjiang, Northwest China. Quatern. Int. 2013, 311, 117–122. [Google Scholar] [CrossRef]
  28. Li, B.F.; Chen, Y.N.; Shi, X.; Chen, Z.S.; Li, W.H. Temperature and precipitation changes in different environments in the arid region of northwest China. Theor. Appl. Climatol. 2013, 112, 589–596. [Google Scholar] [CrossRef]
  29. Cai, P.; Hamdi, R.; He, H.L.; Luo, G.P.; Wang, J.; Zhang, M.; Li, C.F.; Termonia, P.; De Maeyer, P. Numerical Study of the Interaction between Oasis and Urban Areas within an Arid Mountains-Desert System in Xinjiang, China. Atmosphere 2020, 11, 85. [Google Scholar] [CrossRef] [Green Version]
  30. Amuti, T.; Luo, G. Analysis of land cover change and its driving forces in a desert oasis landscape of Xinjiang, northwest China. Solid Earth 2014, 5, 1071–1085. [Google Scholar] [CrossRef] [Green Version]
  31. Huang, J.P.; Ma, J.R.; Guan, X.D.; Li, Y.; He, Y.L. Progress in Semi-arid Climate Change Studies in China. Adv. Atmos Sci. 2019, 36, 922–937. [Google Scholar] [CrossRef]
  32. Cai, P.; Hamdi, R.; Luo, G.P.; He, H.L.; Zhang, M.; Termonia, P.; De Maeyer, P. Agriculture intensification increases summer precipitation in Tianshan Mountains, China. Atmos Res. 2019, 227, 140–146. [Google Scholar] [CrossRef]
  33. Zhang, M.; Luo, G.P.; Cao, X.S.; Hamdi, R.; Li, T.; Cai, P.; Ye, H.; He, H.L. Numerical Simulation of the Irrigation Effects on Surface Fluxes and Local Climate in Typical Mountain-Oasis-Desert Systems in the Central Asia Arid Area. J. Geophys. Res. Atmos. 2019, 124, 12485–12506. [Google Scholar] [CrossRef]
  34. Liu, R.; Sogachev, A.; Yang, X.F.; Liu, S.M.; Xu, T.R.; Zhang, J.J. Investigating microclimate effects in an oasis-desert interaction zone. Agric. Forest Meteorol. 2020, 290, 107992. [Google Scholar] [CrossRef]
  35. Hao, X.M.; Li, W.H.; Deng, H.J. The oasis effect and summer temperature rise in arid regions—Case study in Tarim Basin. Sci. Rep. 2016, 6, 35418. [Google Scholar] [CrossRef]
  36. Fan, C.; Myint, S.W.; Kaplan, S.; Middel, A.; Zheng, B.; Rahman, A.; Huang, H.-P.; Brazel, A.; Blumberg, D.G. Understanding the Impact of Urbanization on Surface Urban Heat Islands—A Longitudinal Analysis of the Oasis Effect in Subtropical Desert Cities. Remote Sens. 2017, 9, 672. [Google Scholar] [CrossRef] [Green Version]
  37. Huang, A.N.; Zhou, Y.; Zhang, Y.C.; Huang, D.Q.; Zhao, Y.; Wu, H.M. Changes of the Annual Precipitation over Central Asia in the Twenty-First Century Projected by Multimodels of CMIP5. J. Clim. 2014, 27, 6627–6646. [Google Scholar] [CrossRef]
  38. Xue, L.Q.; Zhu, B.L.; Yang, C.B.; Wei, G.H.; Meng, X.Y.; Long, A.H.; Yang, G. Study on the characteristics of future precipitation in response to external changes over arid and humid basins. Sci. Rep. 2017, 7, 15148. [Google Scholar] [CrossRef] [Green Version]
  39. Yang, J.; Fang, G.H.; Chen, Y.N.; De-Maeyer, P. Climate change in the Tianshan and northern Kunlun Mountains based on GCM simulation ensemble with Bayesian model averaging. J. Arid Land 2017, 9, 622–634. [Google Scholar] [CrossRef]
  40. Wang, Y.J.; Zhou, B.T.; Qin, D.H.; Wu, J.; Gao, R.; Song, L.C. Changes in Mean and Extreme Temperature and Precipitation over the Arid Region of Northwestern China: Observation and Projection. Adv. Atmos. Sci. 2017, 34, 289–305. [Google Scholar] [CrossRef]
  41. Yin, Z.L.; Feng, Q.; Yang, L.S.; Deo, R.C.; Adamowski, J.F.; Wen, X.H.; Jia, B.; Si, J.H. Projected spatial patterns in precipitation and air temperature for China’s northwest region derived from high-resolution regional climate models. Int. J. Climatol. 2020, 40, 3922–3941. [Google Scholar] [CrossRef]
  42. Jiang, J.; Zhou, T.J.; Chen, X.L.; Zhang, L.X. Future changes in precipitation over Central Asia based on CMIP6 projections. Environ. Res. Lett. 2020, 15, 054009. [Google Scholar] [CrossRef]
  43. Zhai, J.Q.; Mondal, S.K.; Fischer, T.; Wang, Y.J.; Su, B.D.; Huang, J.L.; Tao, H.; Wang, G.J.; Ullah, W.; Uddin, M.J. Future drought characteristics through a multi-model ensemble from CMIP6 over South Asia. Atmos. Res. 2020, 246, 105111. [Google Scholar] [CrossRef]
  44. Xu, K.; Wu, C.H.; Zhang, C.; Hu, B.X. Uncertainty assessment of drought characteristics projections in humid subtropical basins in China based on multiple CMIP5 models and different index definitions. J. Hydrol. 2021, 600, 126502. [Google Scholar] [CrossRef]
  45. Li, S.Y.; Miao, L.J.; Jiang, Z.H.; Wang, G.J.; Gnyawali, K.R.; Zhang, J.; Zhang, H.; Fang, K.; He, Y.; Li, C. Projected drought conditions in Northwest China with CMIP6 models under combined SSPs and RCPs for 2015-2099. Adv. Clim. Chang. Res. 2020, 11, 210–217. [Google Scholar] [CrossRef]
  46. Berg, A.; Findell, K.; Lintner, B.; Giannini, A.; Seneviratne, S.I.; van den Hurk, B.; Lorenz, R.; Pitman, A.; Hagemann, S.; Meier, A.; et al. Land-atmosphere feedbacks amplify aridity increase over land under global warming. Nat. Clim. Chang. 2016, 6, 869–874. [Google Scholar] [CrossRef]
  47. Lian, X.; Piao, S.; Chen, A.; Huntingford, C.; Fu, B.; Li, L.Z.X.; Huang, J.; Sheffield, J.; Berg, A.M.; Keenan, T.F.; et al. Multifaceted characteristics of dryland aridity changes in a warming world. Nat. Rev. Earth Environ. 2021, 2, 232–250. [Google Scholar] [CrossRef]
Figure 1. Geographical and climatic features of the TMDE. (a): geographical location of the study area. (b,c): frequency (percentage) distribution of land area across different altitudes in Tianshan Mountains Ecozone and Desert Ecozone, respectively. (d,e): distribution of temperature and precipitation across altitudes in Tianshan Mountains Ecozone and Desert Ecozone, respectively.
Land 10 01131 g001
Figure 2. Spatial distribution of temperature and precipitation trends. (a,c): spatial distribution of temperature and precipitation trends. (b,d): frequency distributions of rates of changes in temperature and precipitation. (e): proportion of warming and wetting and warming and drying grid cells in the Tianshan Mountains Ecozone and Desert Ecozone. (f): mean annual change in temperature and precipitation for the warming-wetting subset of each ecozone.
Land 10 01131 g002
Figure 3. Climatic trends along an altitudinal gradient and main vegetation belts. (a,b): temperature trends of the Desert Ecozone and Tianshan Mountains Ecozone at different altitudes, respectively. (c,d): precipitation trends of the Desert Ecozone and Tianshan Mountains Ecozone at different altitudes, respectively. (eg): wetting trends of three vegetation belts in the Tianshan Mountains Ecozone (alpine meadow, coniferous forest, and nival belts, respectively) at different altitudes.
Land 10 01131 g003
Figure 4. The spatial distribution of high-altitude vegetation belts (coniferous forest, alpine meadow and nival belts) in the Tianshan Mountains.
Land 10 01131 g004
Figure 5. Climate trends at different altitudes in the warming and wetting areas of the Tianshan Mountains Ecozone. (a): all vegetation zones above 2800 m. (b): Alpine meadow. (c): coniferous forests. (d): nival belt.
Land 10 01131 g005
Figure 6. PDSI (Palmer Drought Severity Index) trend based on the CMIP6 model simulations in 2020–2099 [45]. (a): spatial distribution of PDSI trends in Northwest China under SSP2-4.5 (per year). (b): spatial distribution of frequency of drought events in Northwest China under SSP2-4.5 (number of drought events per 100 years).
Land 10 01131 g006
Publisher’s Note: MDPI stays neutral with regard to jurisdictional claims in published maps and institutional affiliations.

