Mixed Land Use Evaluation and Its Impact on Housing Prices in Beijing Based on Multi-Source Big Data
Abstract
:1. Introduction
2. Materials and Methods
2.1. Study Area
2.2. Data Source and Processing
2.2.1. Data Source
2.2.2. Construction of Land Use Data
2.3. Methods
2.3.1. Indicators of Mixed Land Use
- (1)
- Entropy Index
- (2)
- Type number index
2.3.2. Spatial Autocorrelation
- (1)
- Global spatial autocorrelation index
- (2)
- Local spatial autocorrelation index
2.3.3. Multi-Scale Geographically Weighted Regression Model
3. Results
3.1. Mixed Land Use Evaluation
3.1.1. Spatial Distribution of Mixed-Function Blocks
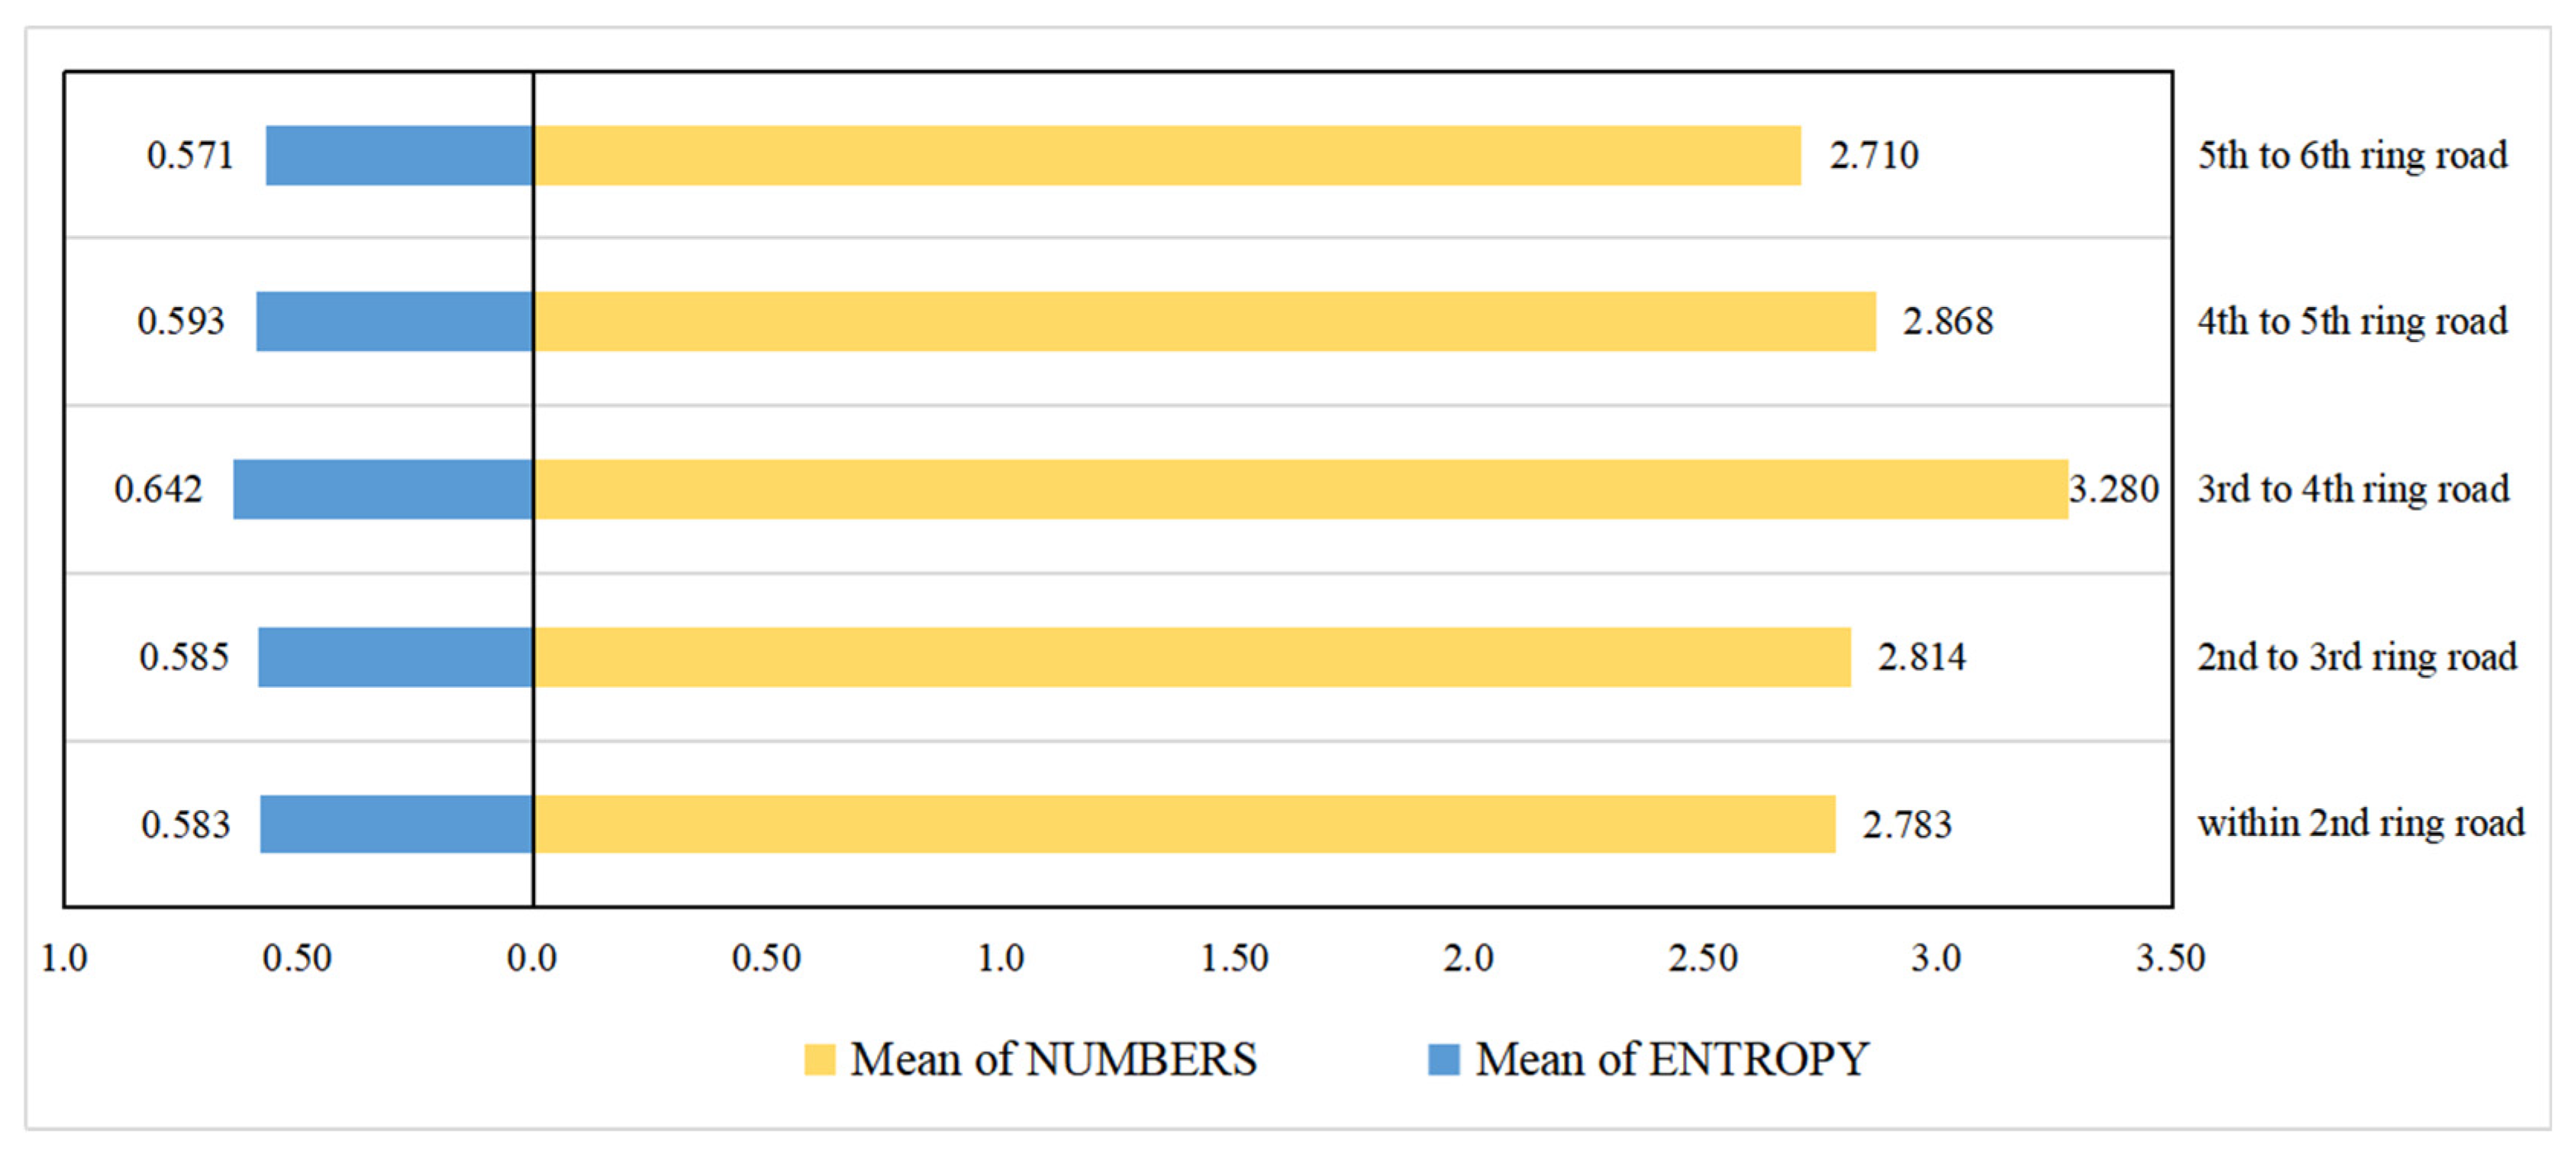
3.1.2. Spatial Distribution of Mixed Land Use Indicators
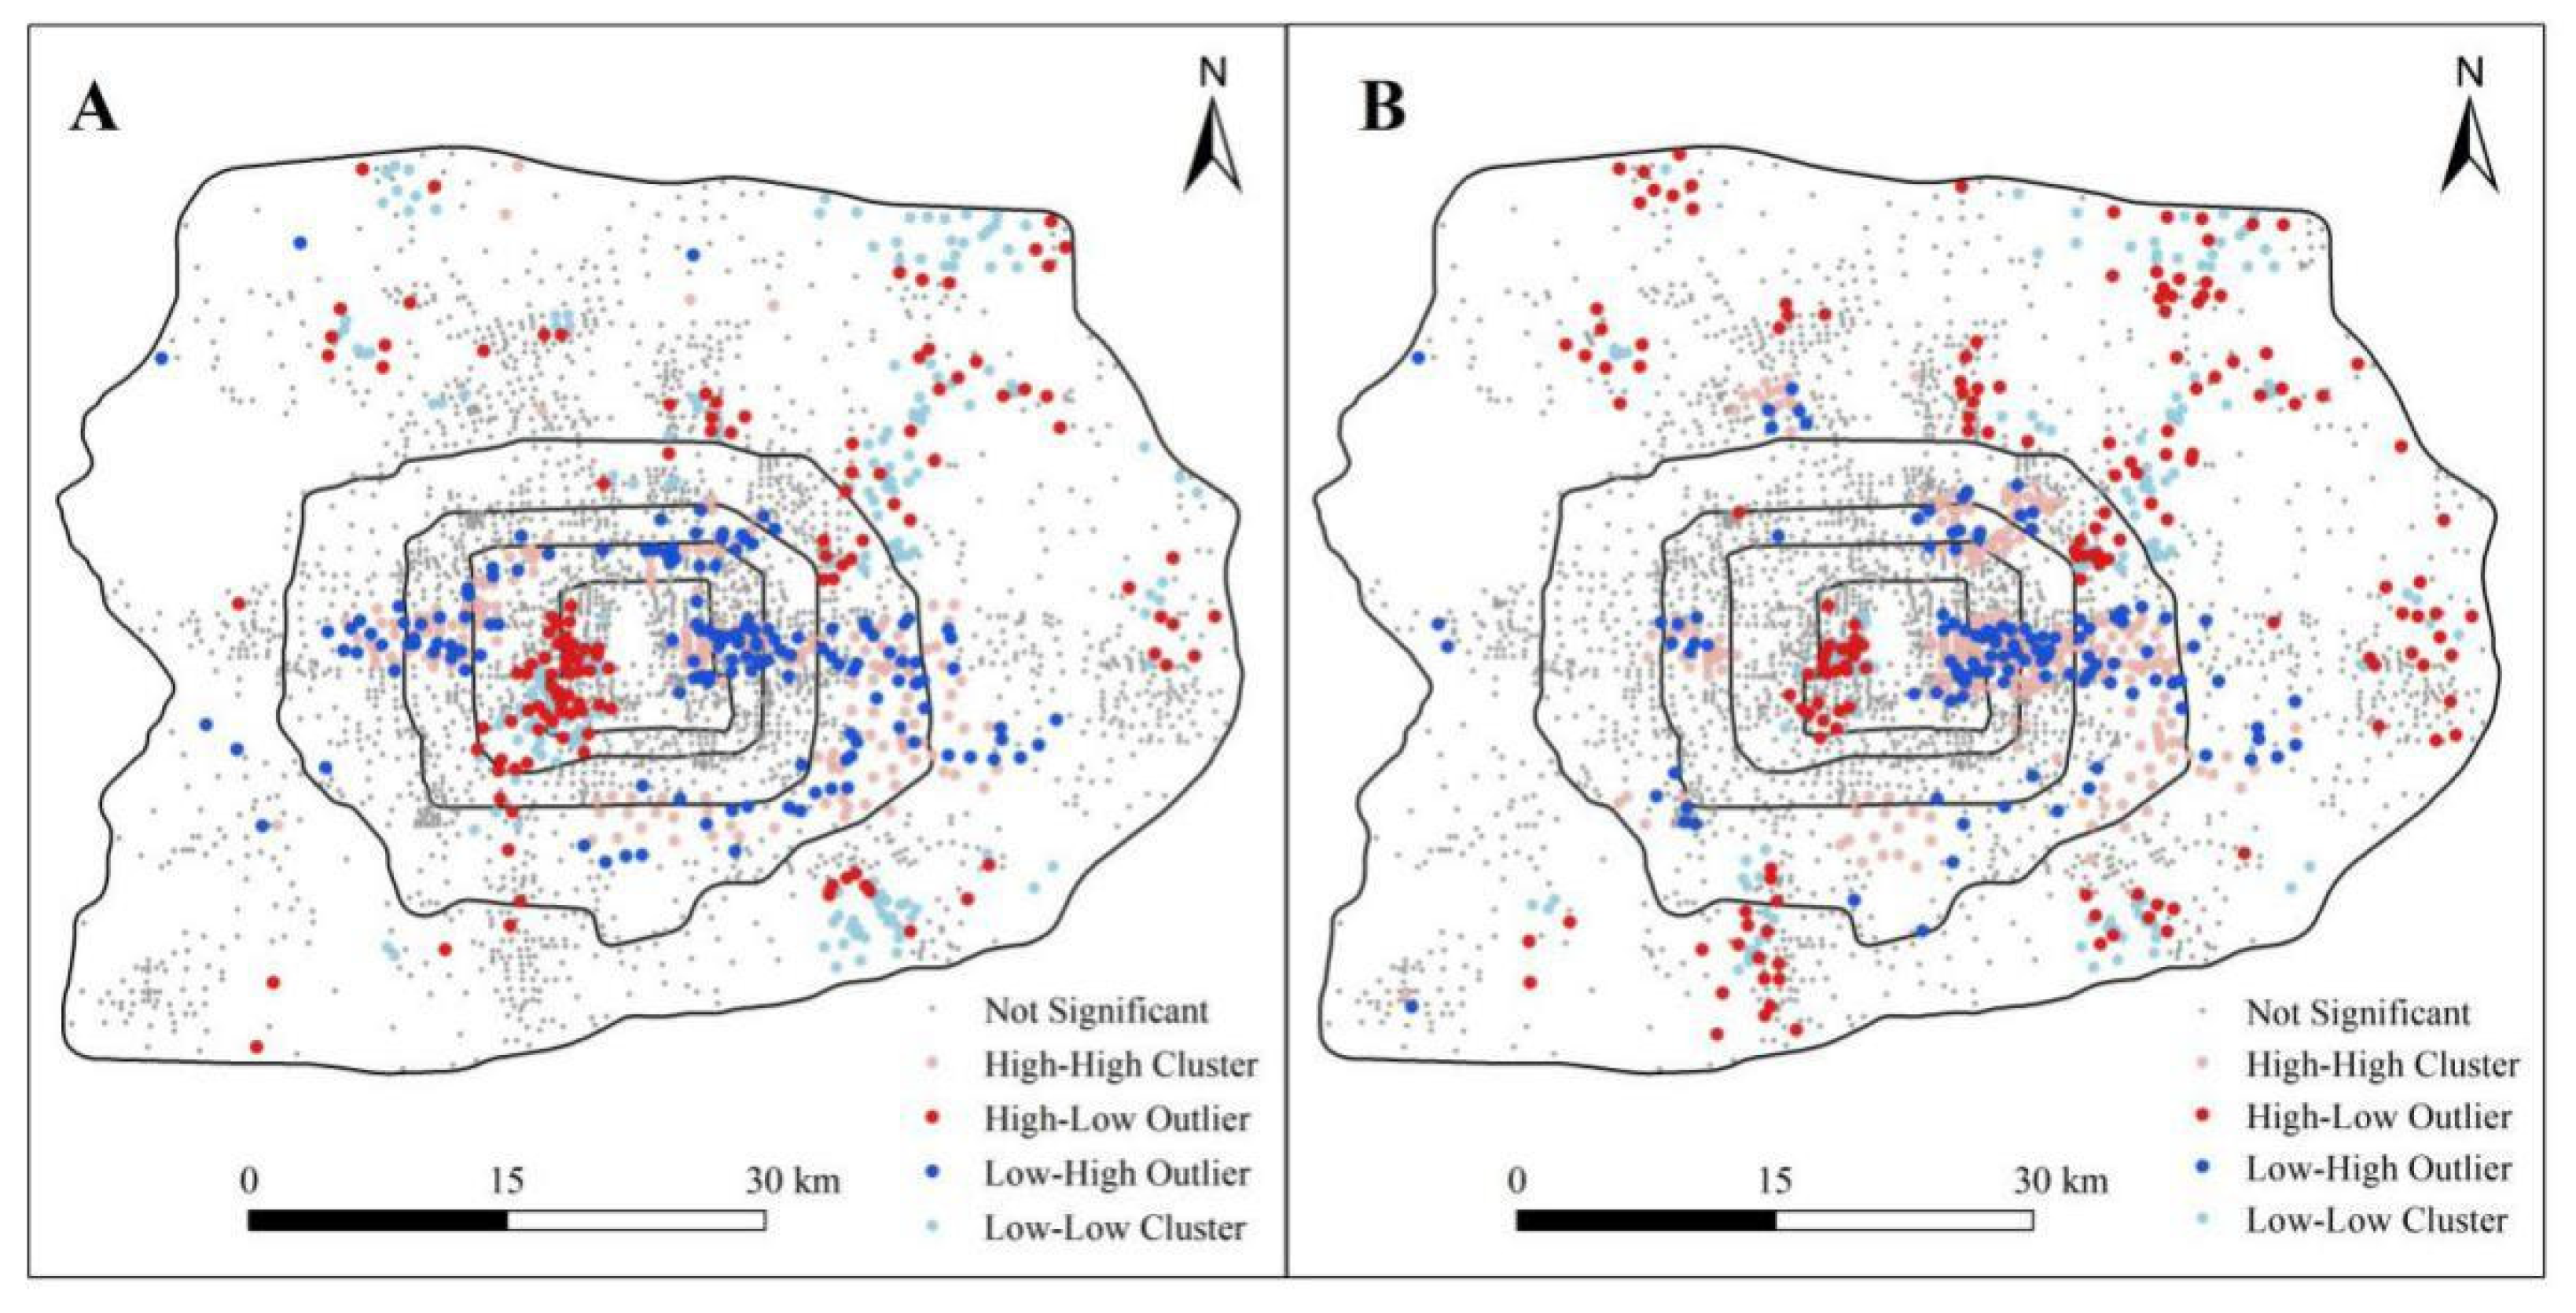
3.1.3. Spatial Agglomeration of Mixed Land Use Indicators
3.2. Impact of Mixed Land Use on Housing Price
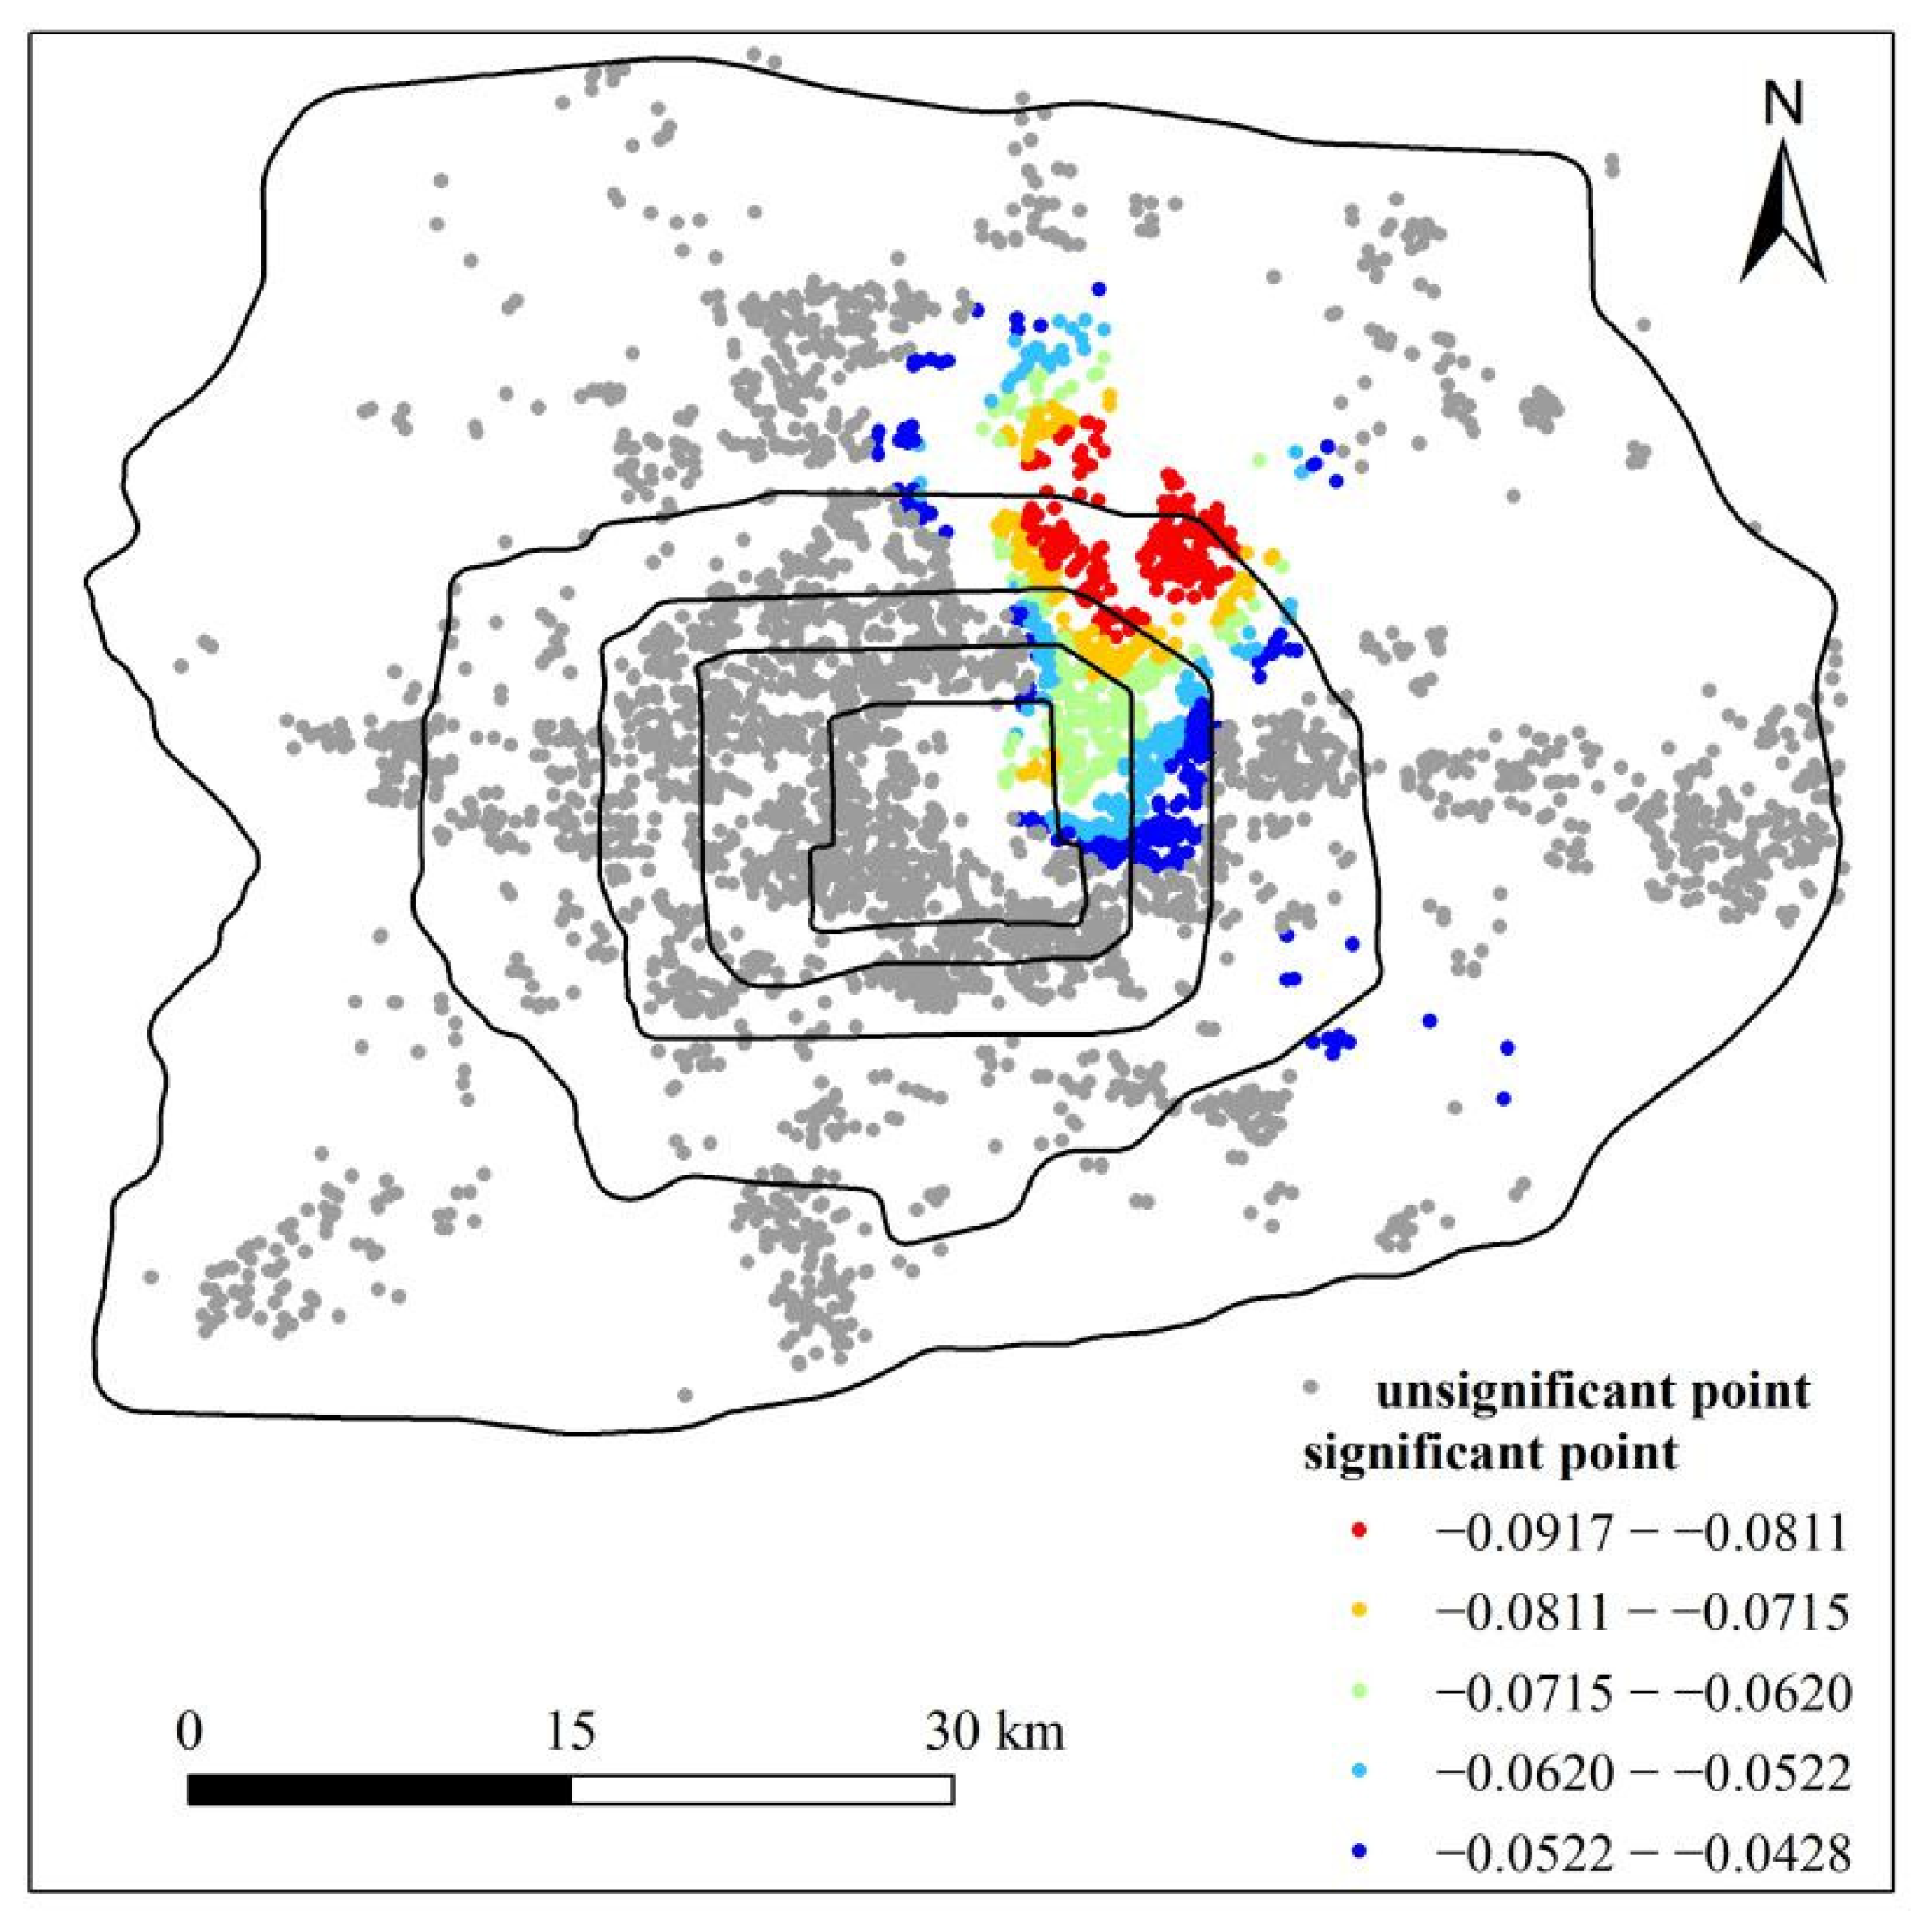
3.2.1. Impact of Mixed Land Use on Housing Price at Block Scale
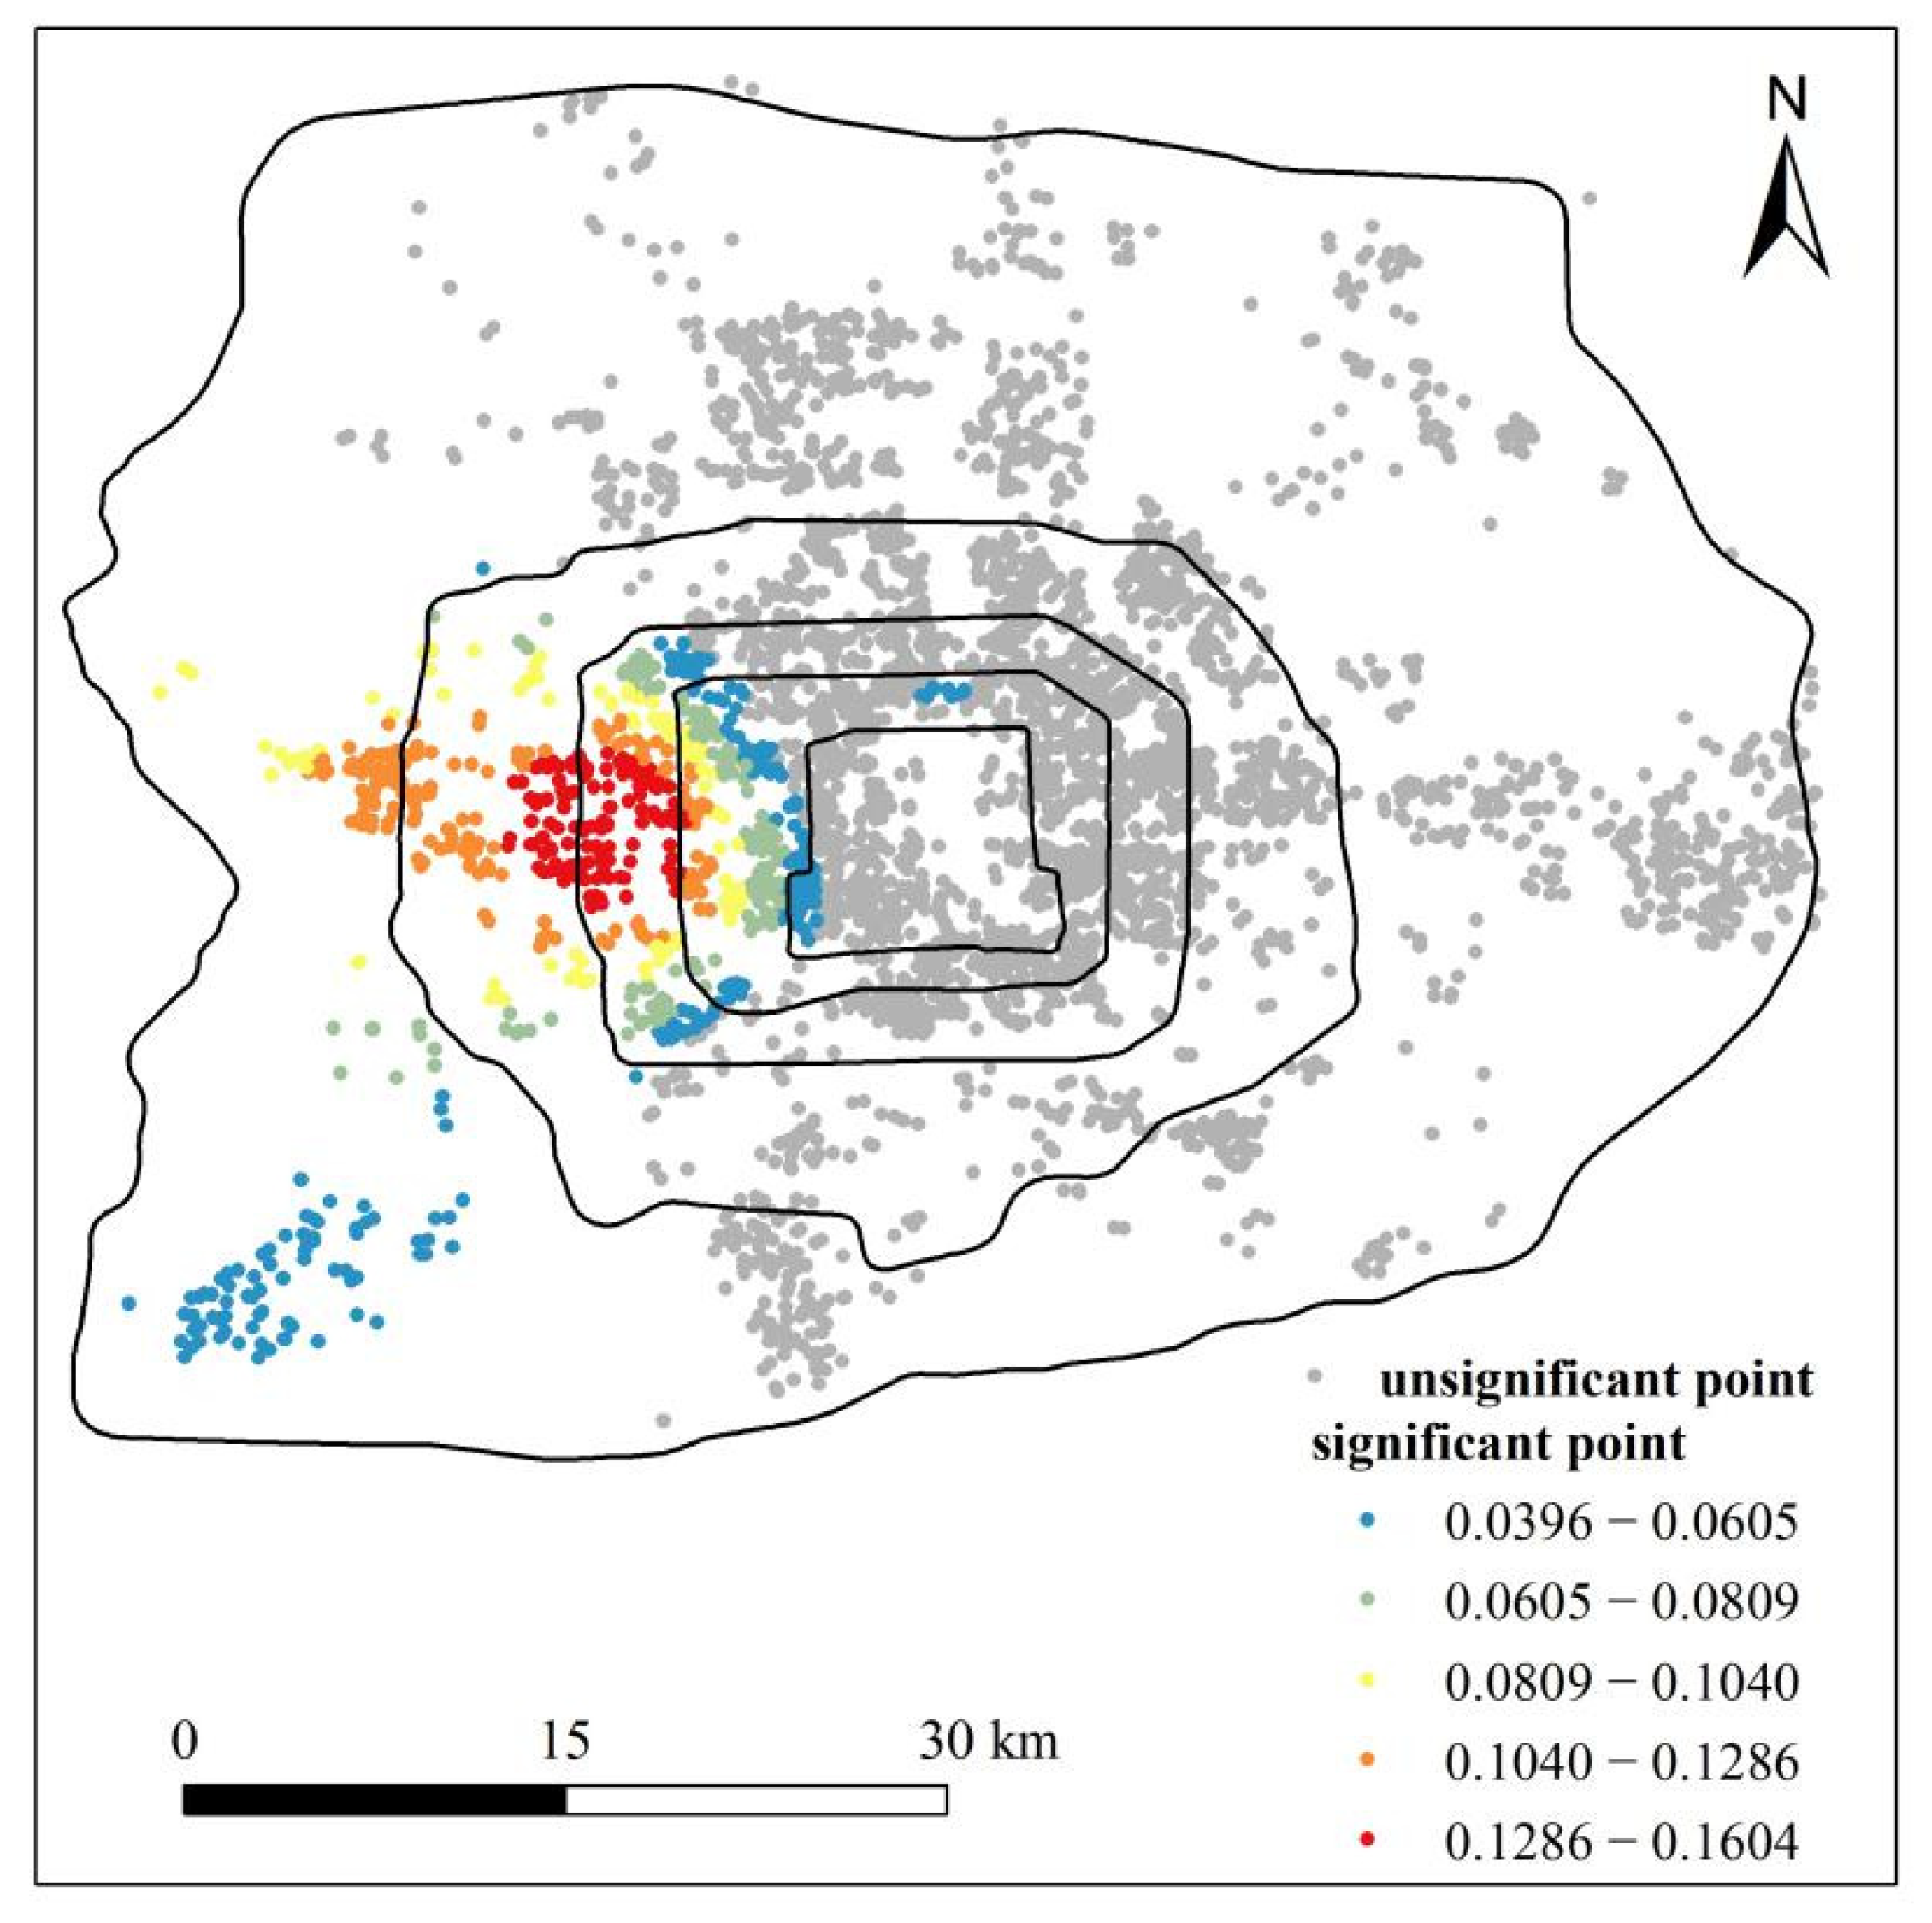
3.2.2. Impact of Mixed Land Use on Housing Price at Life Circle Scale
4. Discussion
5. Conclusions
Author Contributions
Funding
Institutional Review Board Statement
Informed Consent Statement
Data Availability Statement
Acknowledgments
Conflicts of Interest
References
- Wann-Ming, W. Constructing urban dynamic transportation planning strategies for improving quality of life and urban sustainability under emerging growth management principles. Sustain. Cities Soc. 2019, 44, 275–290. [Google Scholar] [CrossRef]
- Matthews, J.W.; Turnbull, G.K. Neighborhood Street Layout and Property Value: The Interaction of Accessibility and Land Use Mix. J. Real Estate Financ. Econ. 2007, 35, 11–141. [Google Scholar] [CrossRef]
- Bordoloi, R.; Mote, A.; Sarkar, P.P.; Mallikarjuna, C. Quantification of Land Use Diversity in the Context of Mixed Land Use. Procedia Soc. Behav. Sci. 2013, 104, 563–572. [Google Scholar] [CrossRef] [Green Version]
- Danie, J.; Du Plessis, D.J. Land-use mix in South African cities and the influence of spatial planning: Innovation or following the trend? S. Afr. Geogr. J. 2015, 97, 217–242. [Google Scholar] [CrossRef]
- Raman, R.; Roy, U.K. Taxonomy of urban mixed land use planning. Land Use Policy 2019, 88, 104102. [Google Scholar] [CrossRef]
- Abdullahi, S.; Pradhan, B.; Mansor, S.; Shariff, A.R.M. GIS-based modeling for the spatial measurement and evaluation of mixed land use development for a compact city. Mapp. Sci. Remote Sens. 2015, 52, 18–39. [Google Scholar] [CrossRef]
- Ghosh, P.A.; Raval, P.M. Does benefits of mixed land uses match up to people’s expectations from their living environments? Inst. Town Plan. India 2019, 6, 42–56. [Google Scholar]
- Zhang, M.; Zhou, S. Mixed Land Use Trend And Planning Management. Planners 2015, 7, 42–48. [Google Scholar] [CrossRef]
- Nabil, N.A.; Eldayem, G.E.A. Influence of mixed land-use on realizing the social capital. HBRC J. 2015, 11, 285–298. [Google Scholar] [CrossRef] [Green Version]
- Bao, Q.; Jiang, Y. Mixed Use and Development of Urban Central Business District. Urban Probl. 2007, 9, 54–58. [Google Scholar] [CrossRef]
- Jacobs-Crision, C.; Rietveld, P.; Koomen, E.; Tranos, E. Evaluating the impact of land-use density and mix on spatiotemporal urban activity patterns: An exploratory study using mobile phone data. Environ. Plan. A 2014, 46, 2769–2785. [Google Scholar] [CrossRef]
- Maleki, M.Z.; Zain, M.F.M.; Ismail, A. Variables communalities and dependence to factors of street system, density, and mixed land use in sustainable site design. Sustain. Cities Soc. 2012, 3, 46–53. [Google Scholar] [CrossRef]
- Raja, A.Z. Linking Job/Housing Balance, Land Use Mix and Commute to Work. Ph.D. Thesis, Texas A&M University, College Station, TX, USA, 2012. Available online: https://core.ac.uk/download/pdf/13642835.pdf (accessed on 18 November 2019).
- Lin, H.; Li, J. Relationship between spatial distribution of resident trips and mixed degree of land use: A case study of Guangzhou. City Plan. Rev. 2008, 32, 53–56. [Google Scholar] [CrossRef]
- Rehman, A.; Asghar, Z. Mixed Use of Land in Big cities of Pakistan and its Impact on Reduction in commuting and Congestion Cost. J. Archit. Plan. 2016, 21, 17–28. Available online: http://www.neduet.edu.pk/arch_planning/NED-JRAP/index.html (accessed on 13 April 2020).
- Dang, Y.; Dong, G.; Yu, J.; Zhang, W.; Chen, L. Impact of land-use mixed degree on resident’s home-work separation in Beijing. Acta Geogr. Sin. 2015, 70, 919–930. [Google Scholar] [CrossRef]
- Koster, H.; Rouwendal, J. The Impact of Mixed Land Use on Residential Property Values. Tinbergen Inst. Discuss. Pap. 2010, 52, 733–761. Available online: http://hdl.handle.net/10419/87011 (accessed on 2 September 2019). [CrossRef] [Green Version]
- Rowley, A. Mixed-use Development: Ambiguous concept, simplistic analysis and wishful thinking? Plan. Pract. Res. 1996, 11, 85–98. [Google Scholar] [CrossRef]
- Zhang, M.; Zhao, P. The impact of land-use mix on residents’ travel energy consumption: New evidence from Beijing. Transp. Res. D Transp. Environ. 2017, 57, 224–236. [Google Scholar] [CrossRef]
- Huang, J.; Du, N.; Liu, P.; Han, S. An Exploration of Land Use Mix Around Residence and Family Commuting Caused Carbon Emission: A Case Study of Wuhan City in China. Urban Plan. Int. 2013, 28, 25–30. [Google Scholar]
- Duncan, M.J.; Winkler, E.; Sugiyama, T.; Cerin, E.; Dutoit, L.; Leslie, E.; Owen, N. Relationships of Land Use Mix with Walking for Transport: Do Land Uses and Geographical Scale Matter? J. Urban Health 2010, 87, 782–795. [Google Scholar] [CrossRef] [Green Version]
- Bereitschaft, B. Pedestrian exposure to near-roadway PM2.5 in mixed-use urban corridors: A case study of Omaha, Nebraska. Sustain. Cities Soc. 2015, 15, 64–74. [Google Scholar] [CrossRef] [Green Version]
- Wu, C.; Ye, X.; Ren, F.; Wan, Y.; Ning, P.; Du, Q. Spatial and Social Media Data Analytics of Housing Prices in Shenzhen, China. PLoS ONE 2016, 11, e0164553. [Google Scholar] [CrossRef] [PubMed]
- Kim, D.; Jin, J. The Effect of Land Use on Housing Price and Rent: Empirical Evidence of Job Accessibility and Mixed Land Use. Sustainability 2019, 11, 938. [Google Scholar] [CrossRef] [Green Version]
- Aurand, A. Density, Housing Types and Mixed Land Use: Smart Tools for Affordable Housing? Urban Stud. 2010, 47, 1015–1036. [Google Scholar] [CrossRef]
- Gu, D.; Newman, G.; Kim, J.H.; Park, Y.; Lee, J. Neighborhood decline and mixed land uses: Mitigating housing abandonment in shrinking cities. Land Use Policy 2019, 83, 505–511. [Google Scholar] [CrossRef]
- Fu, Y.; Liu, G.; Papadimitriou, S.; Xiong, H.; Ge, Y.; Zhu, H.; Zhu, C. Real estate ranking via mixed land-use latent models. In Proceedings of the 21th ACM SIGKDD International Conference, Sydney, Australia, 10–13 August 2015. [Google Scholar] [CrossRef]
- Cao, T.V.; Cory, D.C. Mixed land uses, land-use externalities, and residential property values: A reevaluation. Ann. Reg. Sci. 1982, 16, 1–24. [Google Scholar] [CrossRef]
- Song, Y.; Knaap, G. New urbanism and housing values: A disaggregate assessment. J. Urban Econ. 2003, 54, 218–238. [Google Scholar] [CrossRef]
- Cao, T.V.; Cory, D.C. Mixed Land Uses and Residential Property Values in the Tucson Metropolitan Region: Implications for Public Policy, College of Agriculture; University of Arizona: Tucson, AZ, USA, 1981; Available online: http://hdl.handle.net/10150/602134 (accessed on 2 September 2019).
- Wu, J.; Song, Y.; Liang, J.; Wang, Q.; Lin, J. Impact of Mixed Land Use on Housing Values in High-Density Areas: Evidence from Beijing. J. Urban Plan. Dev. 2018, 144, 05017019. [Google Scholar] [CrossRef]
- Shi, B.; Yang, J. Scale, distribution, and pattern of mixed land use in central districts: A case study of Nanjing, China. Habitat Int. 2015, 46, 166–177. [Google Scholar] [CrossRef]
- Yue, Y.; Zhuang, Y.; Yeh, A.G.O.; Xie, J.; Ma, C.; Li, Q. Measurements of POI-based mixed use and their relationships with neighbourhood vibrancy. Int. J. Geogr. Inf. Sci. 2017, 31, 658–675. [Google Scholar] [CrossRef] [Green Version]
- Song, Y.; Merlin, L.; Rodriguez, D. Comparing measures of urban land use mix. Comput. Environ. Urban Syst. 2013, 42, 1–13. [Google Scholar] [CrossRef]
- Zhuo, Y.; Zheng, H.; Wu, C.; Xu, Z.; Li, G.; Yu, Z. Compatibility mix degree index: A novel measure to characterize urban land use mix pattern. Comput. Environ. Urban Syst. 2019, 75, 49–60. [Google Scholar] [CrossRef]
- Dovey, K.; Pafka, E. What is functional mix? An assemblage approach. Plan. Theory Pract. 2017, 18, 249–267. [Google Scholar] [CrossRef] [Green Version]
- Xu, Y.; Wang, L.; Fu, C.; Kosmyna, T. A fishnet-constrained land use mix index derived from remotely sensed data. Ann. GIS 2017, 23, 303–313. [Google Scholar] [CrossRef] [Green Version]
- Gök, G.; Gürbüz, O.A. Application of geostatistics for grid and random sampling schemes for a grassland in Nigde, Turkey. Environ. Monit. Assess. 2020, 192, 300. [Google Scholar] [CrossRef] [PubMed]
- Fotheringham, A.S.; Yang, W.; Kang, W. Multiscale geographically weighted regression (MGWR). Ann. Am. Assoc. Geogr. 2017, 107, 1247–1265. [Google Scholar] [CrossRef]
- Yu, H.; Fotheringham, A.S.; Li, Z.; Oshan, T.; Kang, W.; Wolf, L.J. Inference in multiscale geographically weighted regression. Geogr. Anal. 2019, 52, 87–106. [Google Scholar] [CrossRef]
- Wu, C.; Liu, P.; Nie, K. Analyzing multiscale spatial relationships between housing prices and influencing factors in Nanjing. Mod. Urban Res. 2021, 36, 93–98. [Google Scholar] [CrossRef]
- Wen, H.; Zhang, Y.; Zhang, L. Assessing amenity effects of urban landscapes on housing price in Hangzhou, China. Urban For. Urban Green. 2015, 14, 1017–1026. [Google Scholar] [CrossRef]
- Huang, S.; Hsieh, H. The Study of the Relationship between Accessibility and Mixed Land Use in Tainan, Taiwan. Int. J. Environ. Sci. Dev. 2014, 5, 352–356. [Google Scholar] [CrossRef] [Green Version]
- Long, Y.; Liu, X. Featured Graphic. How mixed is Beijing, China? A visual exploration of mixed land use. Environ. Plann. A 2013, 45, 2797–2798. [Google Scholar] [CrossRef]
- Kong, H.; Sui, D.Z.; Tong, X.; Wang, X. Paths to mixed-use development: A case study of Southern Changping in Beijing, China. Cities 2015, 44, 94–103. [Google Scholar] [CrossRef]
- Liu, X.; Long, Y. Automated identification and characterization of parcels with OpenStreetMap and points of interest. Environ. Plann. B Plann. Des. 2016, 43, 341–360. [Google Scholar] [CrossRef]
- Gervasoni, L.; Bosch, M.; Fenet, S.; Sturm, P. A framework for evaluating urban land use mix from crowd-sourcing data. In Proceedings of the 2016 IEEE International Conference on Big Data (Big Data), Boston, MA, USA, 11–14 December 2017. [Google Scholar] [CrossRef] [Green Version]
- Xing, H.; Yuan, M.; Shi, Y. A dynamic human activity-driven model for mixed land use evaluation using social media data. Trans. GIS 2018, 22, 1130–1151. [Google Scholar] [CrossRef]


| Land Use Types | POI Types | Weights |
|---|---|---|
| Industrial Land | industrial park | 100 |
| factory | 100 | |
| Public management and service facilities land | Public security organs, procuratorial organs and people’s courts | 5 |
| Scientific research institutions and schools | 20 | |
| Democratic parties and social organizations | 1 | |
| Training institutions and media institutions | 0.1 | |
| High-ranking hospitals | 5 | |
| Health center | 5 | |
| Administrative organ | 20 | |
| Leisure place | 5 | |
| Entertainment place | 0.1 | |
| Gallery and library | 5 | |
| Specialized hospital | 5 | |
| Transportation facilities land | Airport and railway station | 100 |
| Coach station | 20 | |
| Residential land | Villa | 100 |
| Residential area | 80 | |
| Residential communities | 80 | |
| Green space and square land | Green space and square | 100 |
| Commercial service land | Catering Service | 0.1 |
| Supermarket | 1 | |
| Shopping | 0.1 | |
| Shopping mall | 40 | |
| Financial and insurance | 0.1 | |
| Life service | 0.1 | |
| Accommodation services | 1 | |
| Company | 1 | |
| Well-known enterprise | 40 | |
| Enterprise | 1 |
| Independent Variables | Description of Variables | Minimum | Mean | Maximum |
|---|---|---|---|---|
| ENTROPY (Model 1) | Entropy index of the block where the residential community is located | 0.01 | 0.54 | 0.93 |
| NUMBERS (Model 1) | Type number index of the block where the residential community is located | 1.00 | 2.48 | 5.00 |
| ENTROPY (Model 2) | Entropy index of the life circle where the residential community is located | 0.05 | 0.71 | 0.93 |
| NUMBERS (Model 2) | Type number index of the life circle where the residential community is located | 1.00 | 3.12 | 5.00 |
| BUILDING AGE | 2017 minus the year the residential community was built | 1.00 | 17.32 | 68.00 |
| FEE | Property management fees of the community (yuan/m²/month) | 0.10 | 2.01 | 60.00 |
| PLOT RATIO | Gross floor area relative to the size of the piece of land for buildings | 0.04 | 2.52 | 20.00 |
| GREENING RATIO | Green space relative to the planned area for construction | 0.00 | 33.46 | 86.00 |
| CITY CENTRE | Shortest distance from city centre to the community | 763.53 | 13,448.82 | 37,354.65 |
| SUBWAY | Shortest distance from the nearest subway station to community | 70.15 | 1169.15 | 11,167.45 |
| SHOPPING MALL | Shortest distance from the nearest shopping malls to the community | 1.54 | 754.00 | 6505.76 |
| PARK | Shortest distance from the nearest parks to the community | 24.75 | 856.81 | 4432.36 |
| HOSPITAL | Shortest distance from the nearest hospitals to the community | 6.91 | 748.68 | 5827.04 |
| SCHOOL | Shortest distance from the nearest schools to the community | 7.91 | 475.04 | 4314.85 |
| BUS | Number of bus stations within 1000 m of the community | 0.00 | 16.89 | 43.00 |
| Diagnosis Information | OLS | GWR | MGWR | |||
|---|---|---|---|---|---|---|
| Model 1 | Model 2 | Model 1 | Model 2 | Model 1 | Model 2 | |
| Adjusted R2 | 0.451 | 0.463 | 0.844 | 0.839 | 0.852 | 0.849 |
| AICc | 8346.946 | 8257.889 | 4680.373 | 4670.950 | 4299.882 | 4181.140 |
| RSS | 2035.795 | 1989.604 | 464.887 | 489.581 | 454.957 | 480.010 |
| Variables | Mean | STD | Min | Median | Max | p < 5(%) | Bandwidth |
|---|---|---|---|---|---|---|---|
| INTERCEPT | −0.559 | 0.720 | −2.484 | −0.469 | 1.101 | 76.22 | 72 |
| ENTROPY1 | 0.010 | 0.001 | 0.007 | 0.01 | 0.013 | 0.00 | 3721 |
| NUMBER1 | −0.029 | 0.026 | −0.092 | −0.027 | 0.027 | 23.16 | 776 |
| BUILDING AGE | −0.071 | 0.032 | −0.129 | −0.067 | −0.031 | 100.00 | 1540 |
| FEE | 0.148 | 0.231 | −0.706 | 0.143 | 0.880 | 42.21 | 46 |
| GREENING RATIO | 0.044 | 0.000 | 0.043 | 0.044 | 0.045 | 100.00 | 3721 |
| PLOT RATIO | −0.064 | 0.055 | −0.238 | −0.056 | 0.091 | 39.44 | 213 |
| CITY CENTRE | −1.589 | 0.646 | −2.239 | −1.997 | −0.526 | 100.00 | 405 |
| SUBWAY | −0.056 | 0.004 | −0.061 | −0.056 | −0.048 | 100.00 | 3720 |
| SHOPPING MALL | 0.031 | 0.085 | −0.126 | 0.006 | 0.300 | 21.49 | 321 |
| PARK | 0.019 | 0.179 | −0.760 | 0.006 | 0.721 | 18.83 | 43 |
| HOSPITAL | 0.041 | 0.190 | −0.825 | 0.049 | 0.546 | 31.68 | 118 |
| SCHOOL | −0.009 | 0.002 | −0.014 | −0.009 | −0.004 | 0.00 | 3721 |
| BUS | −0.015 | 0.002 | −0.018 | −0.015 | −0.011 | 0.00 | 3721 |
| Variables | Mean | STD | Min | Median | Max | p < 5(%) | Bandwidth |
|---|---|---|---|---|---|---|---|
| INTERCEPT | −0.311 | 0.516 | −1.016 | −0.389 | 0.869 | 84.65 | 198 |
| ENTROPY2 | 0.033 | 0.037 | −0.017 | 0.026 | 0.160 | 20.68 | 880 |
| NUMBER2 | −0.020 | 0.001 | −0.021 | −0.020 | −0.017 | 0.00 | 3718 |
| BUILDING AGE | −0.070 | 0.025 | −0.112 | −0.064 | −0.039 | 100.00 | 1783 |
| FEE | 0.153 | 0.234 | −0.708 | 0.155 | 1.005 | 43.02 | 46 |
| GREENING RATIO | 0.047 | 0.001 | 0.044 | 0.047 | 0.048 | 100.00 | 3718 |
| PLOT RATIO | −0.065 | 0.055 | −0.257 | −0.056 | 0.071 | 39.93 | 213 |
| CITY CENTRE | −0.959 | 0.758 | −3.682 | −1.032 | 5.011 | 81.63 | 46 |
| SUBWAY | −0.069 | 0.004 | −0.075 | −0.069 | −0.059 | 100.00 | 3715 |
| SHOPPING MALL | 0.030 | 0.030 | −0.027 | 0.030 | 0.093 | 32.43 | 1366 |
| PARK | 0.002 | 0.002 | −0.002 | 0.002 | 0.005 | 0.00 | 3717 |
| HOSPITAL | 0.049 | 0.187 | −0.764 | 0.039 | 0.843 | 30.55 | 107 |
| SCHOOL | −0.007 | 0.002 | −0.011 | −0.007 | −0.003 | 0.00 | 3718 |
| BUS | −0.006 | 0.001 | −0.009 | −0.006 | −0.005 | 0.00 | 3718 |
Publisher’s Note: MDPI stays neutral with regard to jurisdictional claims in published maps and institutional affiliations. |
© 2021 by the authors. Licensee MDPI, Basel, Switzerland. This article is an open access article distributed under the terms and conditions of the Creative Commons Attribution (CC BY) license (https://creativecommons.org/licenses/by/4.0/).
Share and Cite
Yang, H.; Fu, M.; Wang, L.; Tang, F. Mixed Land Use Evaluation and Its Impact on Housing Prices in Beijing Based on Multi-Source Big Data. Land 2021, 10, 1103. https://doi.org/10.3390/land10101103
Yang H, Fu M, Wang L, Tang F. Mixed Land Use Evaluation and Its Impact on Housing Prices in Beijing Based on Multi-Source Big Data. Land. 2021; 10(10):1103. https://doi.org/10.3390/land10101103
Chicago/Turabian StyleYang, Hanbing, Meichen Fu, Li Wang, and Feng Tang. 2021. "Mixed Land Use Evaluation and Its Impact on Housing Prices in Beijing Based on Multi-Source Big Data" Land 10, no. 10: 1103. https://doi.org/10.3390/land10101103
APA StyleYang, H., Fu, M., Wang, L., & Tang, F. (2021). Mixed Land Use Evaluation and Its Impact on Housing Prices in Beijing Based on Multi-Source Big Data. Land, 10(10), 1103. https://doi.org/10.3390/land10101103


