1. Introduction
Urban-rural relations are the most basic economic and social relations, gradually formed in the division of social production and labor [
1]. The urban-rural relations are very rich in connotation, including urban-rural economic relations, social relations, class relations, ecological and environmental relations, cultural and location relations [
2]. Thus, the study of urban-rural relations can involve many disciplines. According to the general characteristics and implications of the evolution of urban-rural relations, they can be divided into three stages: merger, divergence, and integration [
3]. At the beginning of the period, the early classical theories emphasized the close connection between urban and rural areas. After that, the proposed dual structure theory led to the tendency of urban-rural division and urban-rural bias. Finally, after the 1980s, the study of urban-rural relations gradually returned to traditional thinking, and the development of urban-rural integration became a consensus.
In general, “core-periphery” theories are most relevant to urban-rural issues [
4]. At the time these theories were created, in the 1950s and 1960s, people were aware of the existence of the unbalanced status of urban and rural areas. Urban and rural areas are an organism, and only when both are sustainable can they support each other [
5]. However, rural areas were often at a disadvantage in the competition with cities, resulting in a host of problems [
6]. Although rural development processes and problems varied from country to country around the world, they all experienced common problems such as poor rural infrastructure, declining economic status of agriculture, continued exodus of young adults, worrying state of health literacy, environmental pollution, and resource shortages [
7,
8,
9].
Different countries adopted different strategies to face the problem of unbalanced development between rural and urban areas. The U.S. government placed great emphasis on rural infrastructure development [
10], and a series of agricultural subsidy systems enhanced the market adaptability and competitiveness of agriculture in rural areas [
11]. In addition, the development of the technology industry also greatly contributed to the linkages and synergies between rural and urban areas in the United States [
12]. For European regions, the development gap between urban and rural areas is not large. The balanced urban-rural development in the European region was promoted through a series of measures such as rural industrialization policy tilt and rural community organization [
13]. Similarly, permanent and temporary migration into rural areas was considered the most important factor in the development of Hungary’s rural areas in the last decades [
14]. Faced with the dramatic widening of the urban-rural gap, Japan adopted agricultural restructuring to promote balanced development of the primary and secondary industries, quickly achieved zero disparity between urban and rural incomes [
15].
Urban-rural issues are not a completely new problem. Academia and practitioners are more interested in this area to support balanced territorial development [
16,
17]. Some scholars have quantitatively analyzed and visualized the results of sustainable urban and rural studies during 1900–2018 [
18]. The shift in regional development strategies from an economic perspective to sustainable well-being was considered to be an important factor affecting urban-rural relations [
19]. Similarly, the introduction of the value of ecosystem services in urban planning helped people rethink the urban-rural divide [
20]. Relations between the development of urban and rural areas, including their mutual synergy and cooperation, were also discussed by several prominent economists and geographers [
21,
22]. Urban-rural linkages are considered an integral part of promoting development in both urban and rural areas [
23], and scholars attempted to identify the challenges of urban-rural linkages and their corresponding solutions [
24]. In addition, the concept of mixed urban-rural communities was also proposed and seen as a micro-unit for achieving urban-rural integration [
25].
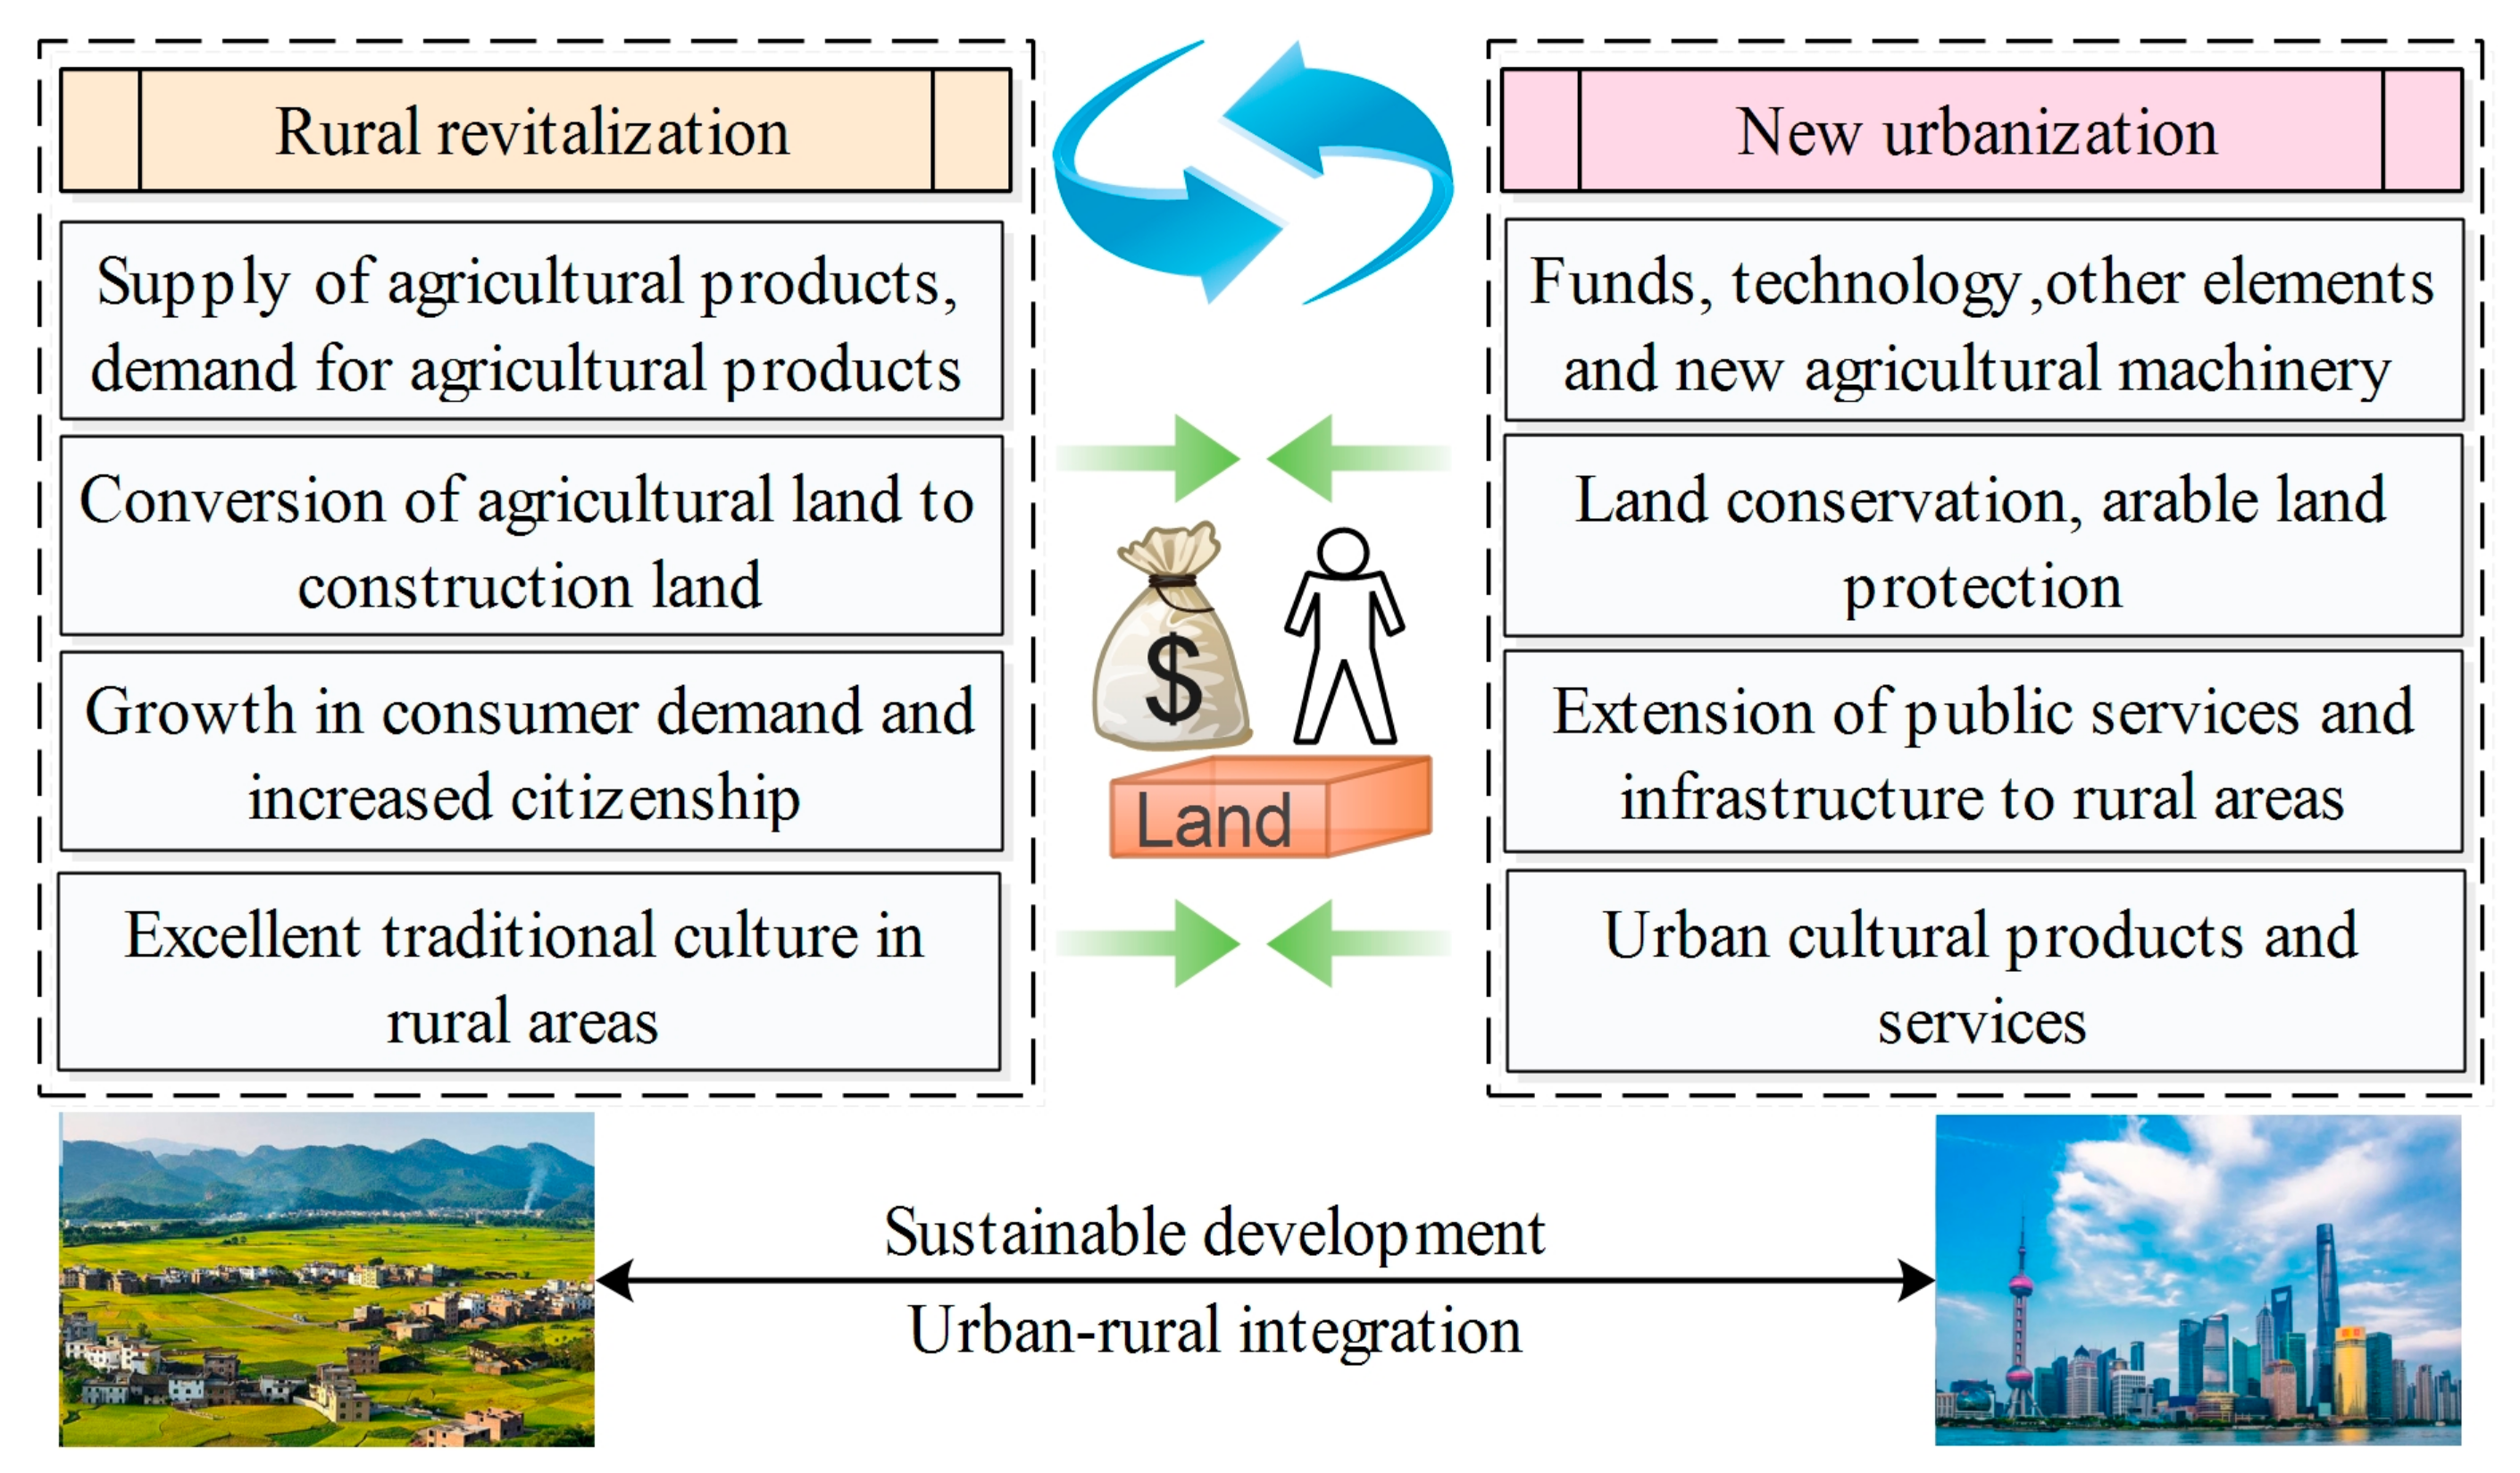
Since the reform and opening up in 1978, the urbanization process has been in full swing in China, and rapid economic and social development has been achieved. However, China’s long-standing urban-rural dual structure and emphasis on urban over rural areas has led to a widening urban-rural gap [
26]. Facing the withering and decay of rural areas, China proposed the implementation of the rural revitalization strategy in 2017. The Strategic Plan for Rural Revitalization (2018–2022), for the first time, proposed the “two-wheel drive” of new urbanization and rural revitalization. In 2020, the “Proposal of the Central Committee of CPC on Formulating the Fourteenth Five-Year Plan for National Economic and Social Development and the 2035 Visionary Goals” clearly proposed to form a new urban-rural relationship with complementary development of urban and rural areas, coordinated development, and common prosperity. However, at the present stage, China is in the period when the new urbanization strategy is deepening, and the rural revitalization strategy is just starting [
27]. Therefore, how to effectively promote the coordinated advancement of the two national strategies is the key point. For this purpose, many scholars explored the theoretical basis and realization paths for the integration of the two national strategies. [
28,
29,
30].
Chinese scholars reassessed the evolution of the urban-rural relations in China since the reform and opening up [
31] and analyzed the relationship between rural development and urbanization from the perspective of literature and policy evolution [
32]. Empirical study has revealed a strong relationship between connections between land conversion rates and urban-rural transformation intensity in China [
33]. Macro data was used to identify whether there was a turning point in the urban-rural relations from three dimensions: agriculture, rural areas, and farmers [
34]. Different urban-rural interaction patterns were identified, and specific ways were proposed to achieve urban-rural integration with respect to those different patterns [
35]. Some scholars explored the impact of reduced land system costs on the degree of urban-rural integration, using the example of Chengdu, China [
36]. With the idea of realizing green poverty reduction in rural areas, scholars designed models to explore an urban-rural sustainable cooperation pattern [
5]. In addition, the current status of urban-rural equalized development in China’s municipal cities was studied [
37].
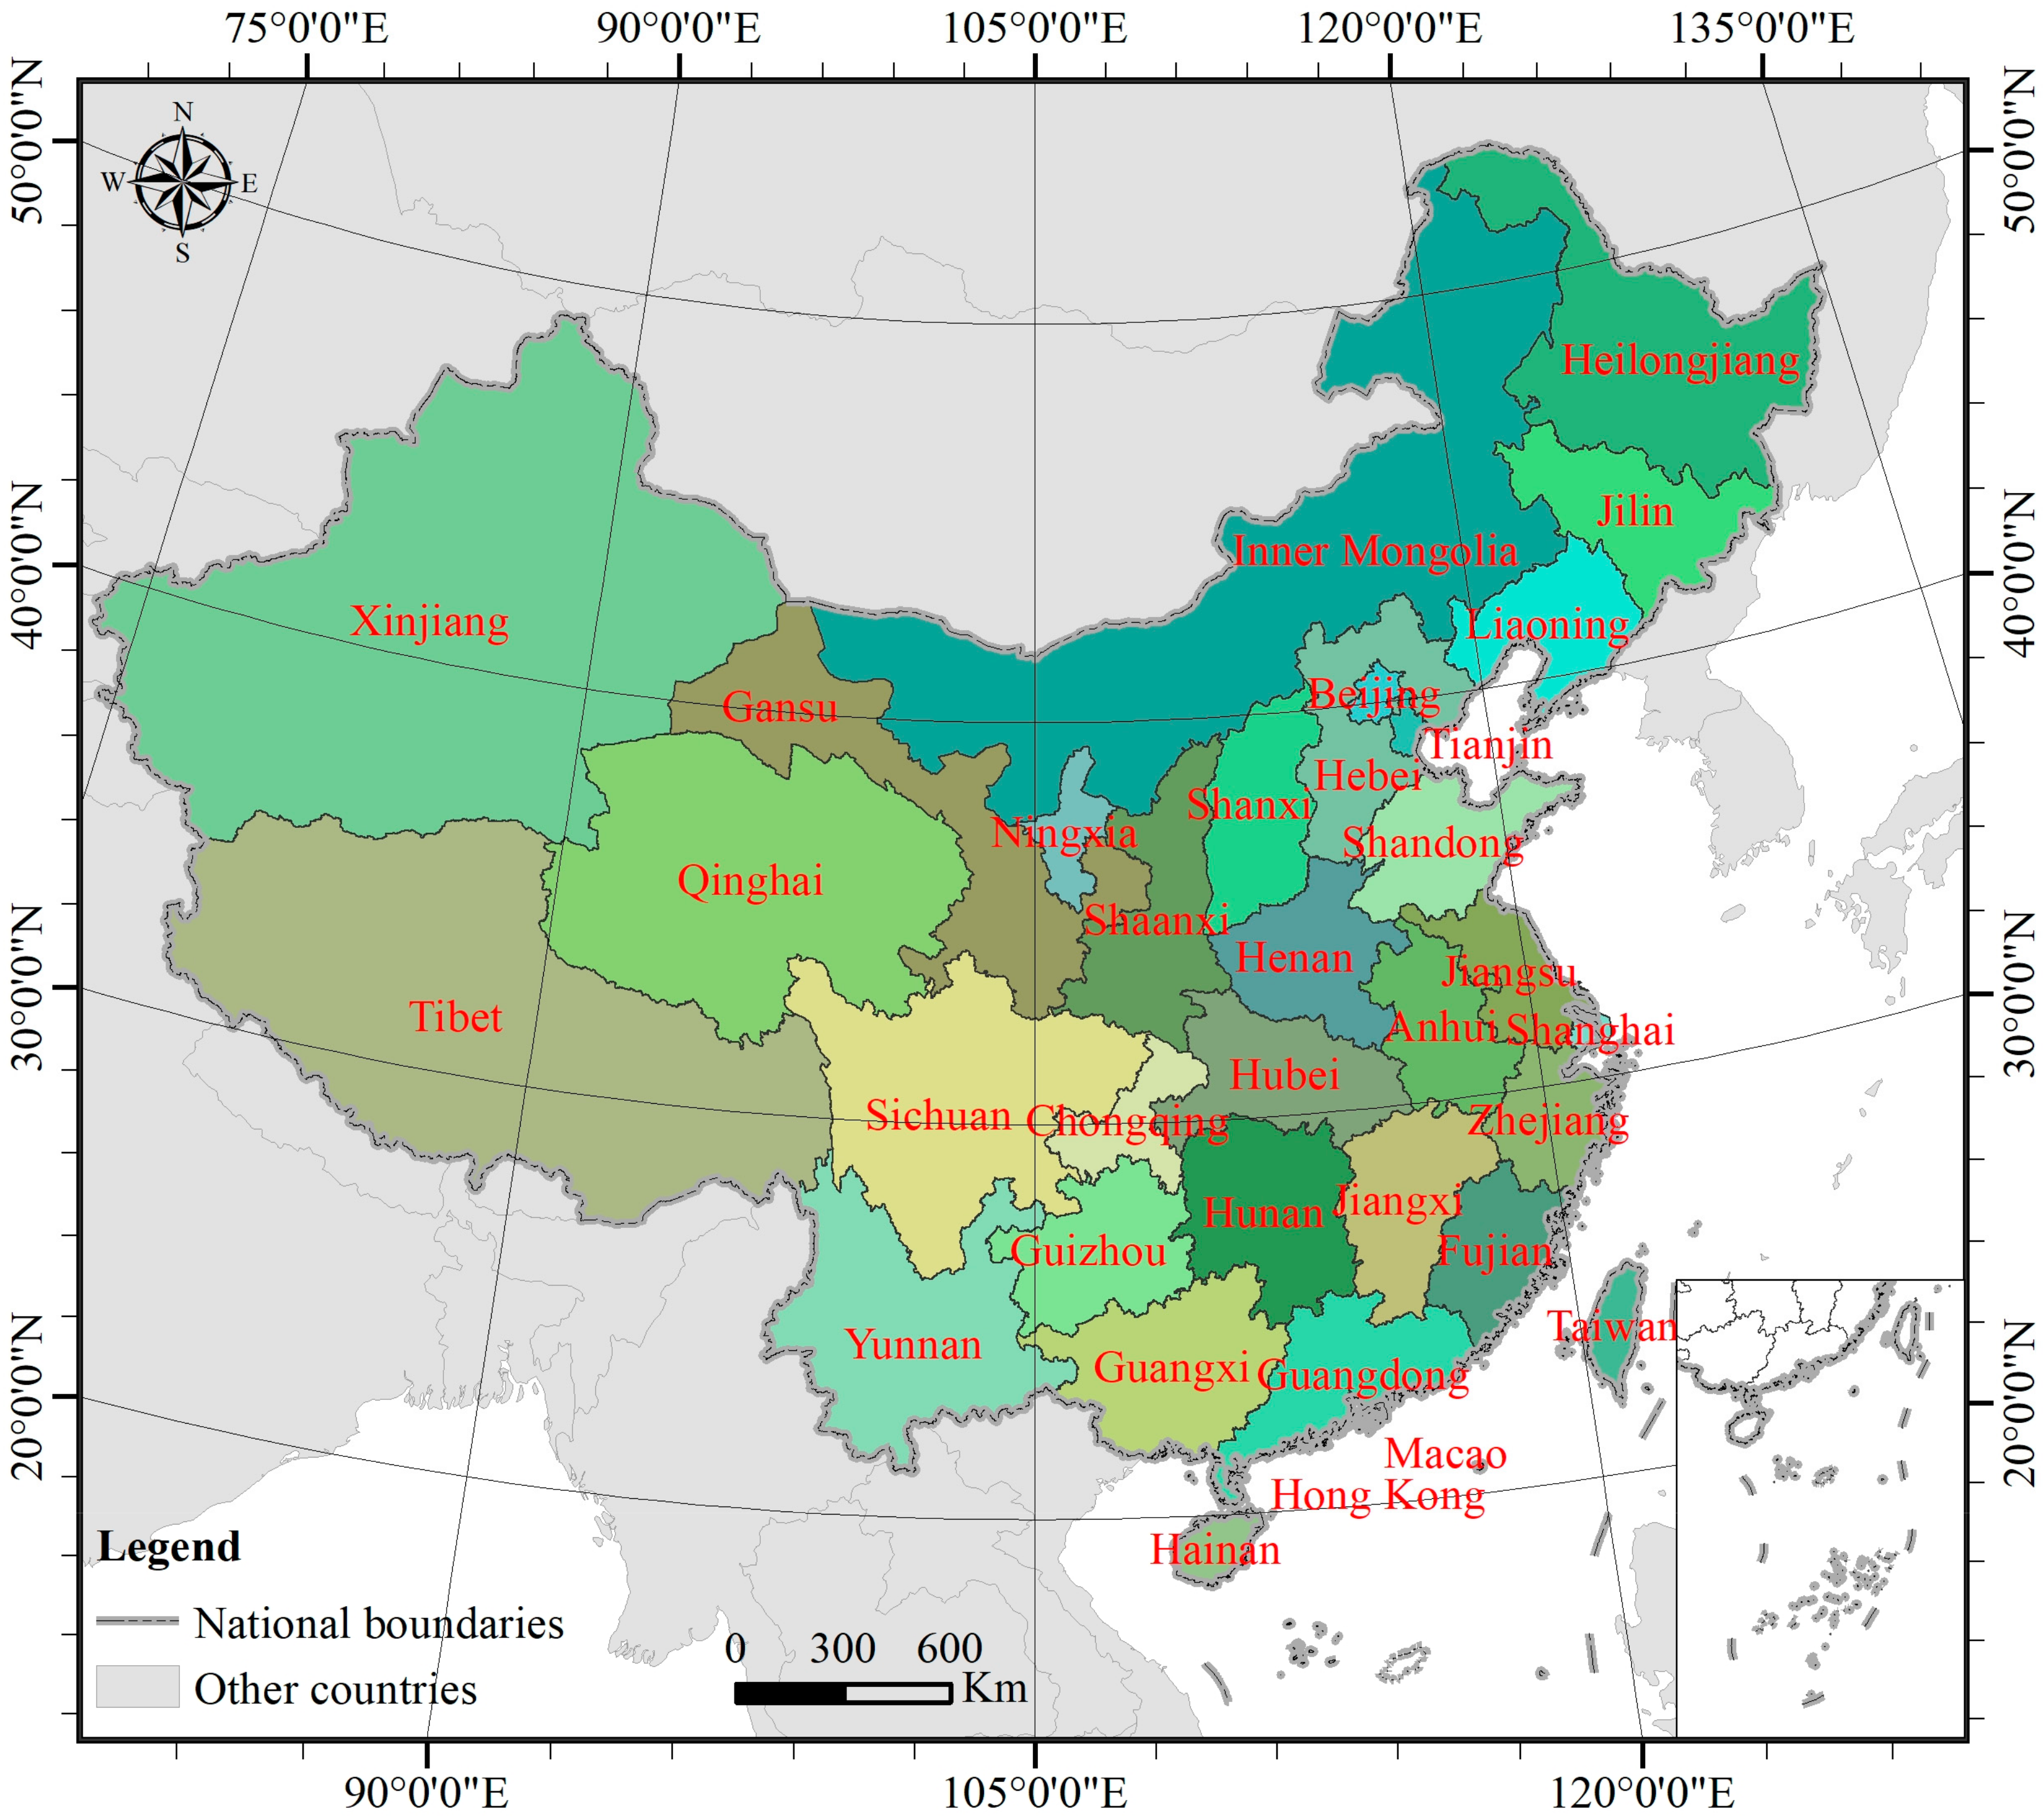
Most existing studies have explored sustainable urban-rural development on a theoretical level but are weak in conducting empirical studies, especially for China at a critical period of change in urban-rural relations. Therefore, on the basis of previous research, this study constructs an empirical study on urban-rural sustainable development based on Chinese provincial panel data. This paper reveals the spatial-temporal evolution characteristics and driving mechanisms of sustainable urban-rural development in 31 provincial-level administrative regions during the period of 2007–2018. The results of this research can further promote the organic integration of rural revitalization and new urbanization strategies. Likewise, it is of great practical significance for narrowing the urban-rural gap, adjusting the urban-rural structure, optimizing the urban-rural pattern, and finally realizing sustainable urban-rural development. In addition, it can be a reference for other developing countries around the world.
3. Results
The calculation results were obtained based on the method and formula mentioned above. ESRI ArcGIS version 10.7© software and Origin 2017© were further used to spatially visualize the results in order to discover and reveal more patterns, thus leading to more meaningful conclusions.
3.1. Characteristics of Rural Revitalization and New Urbanization during 2007–2018
As can be seen from
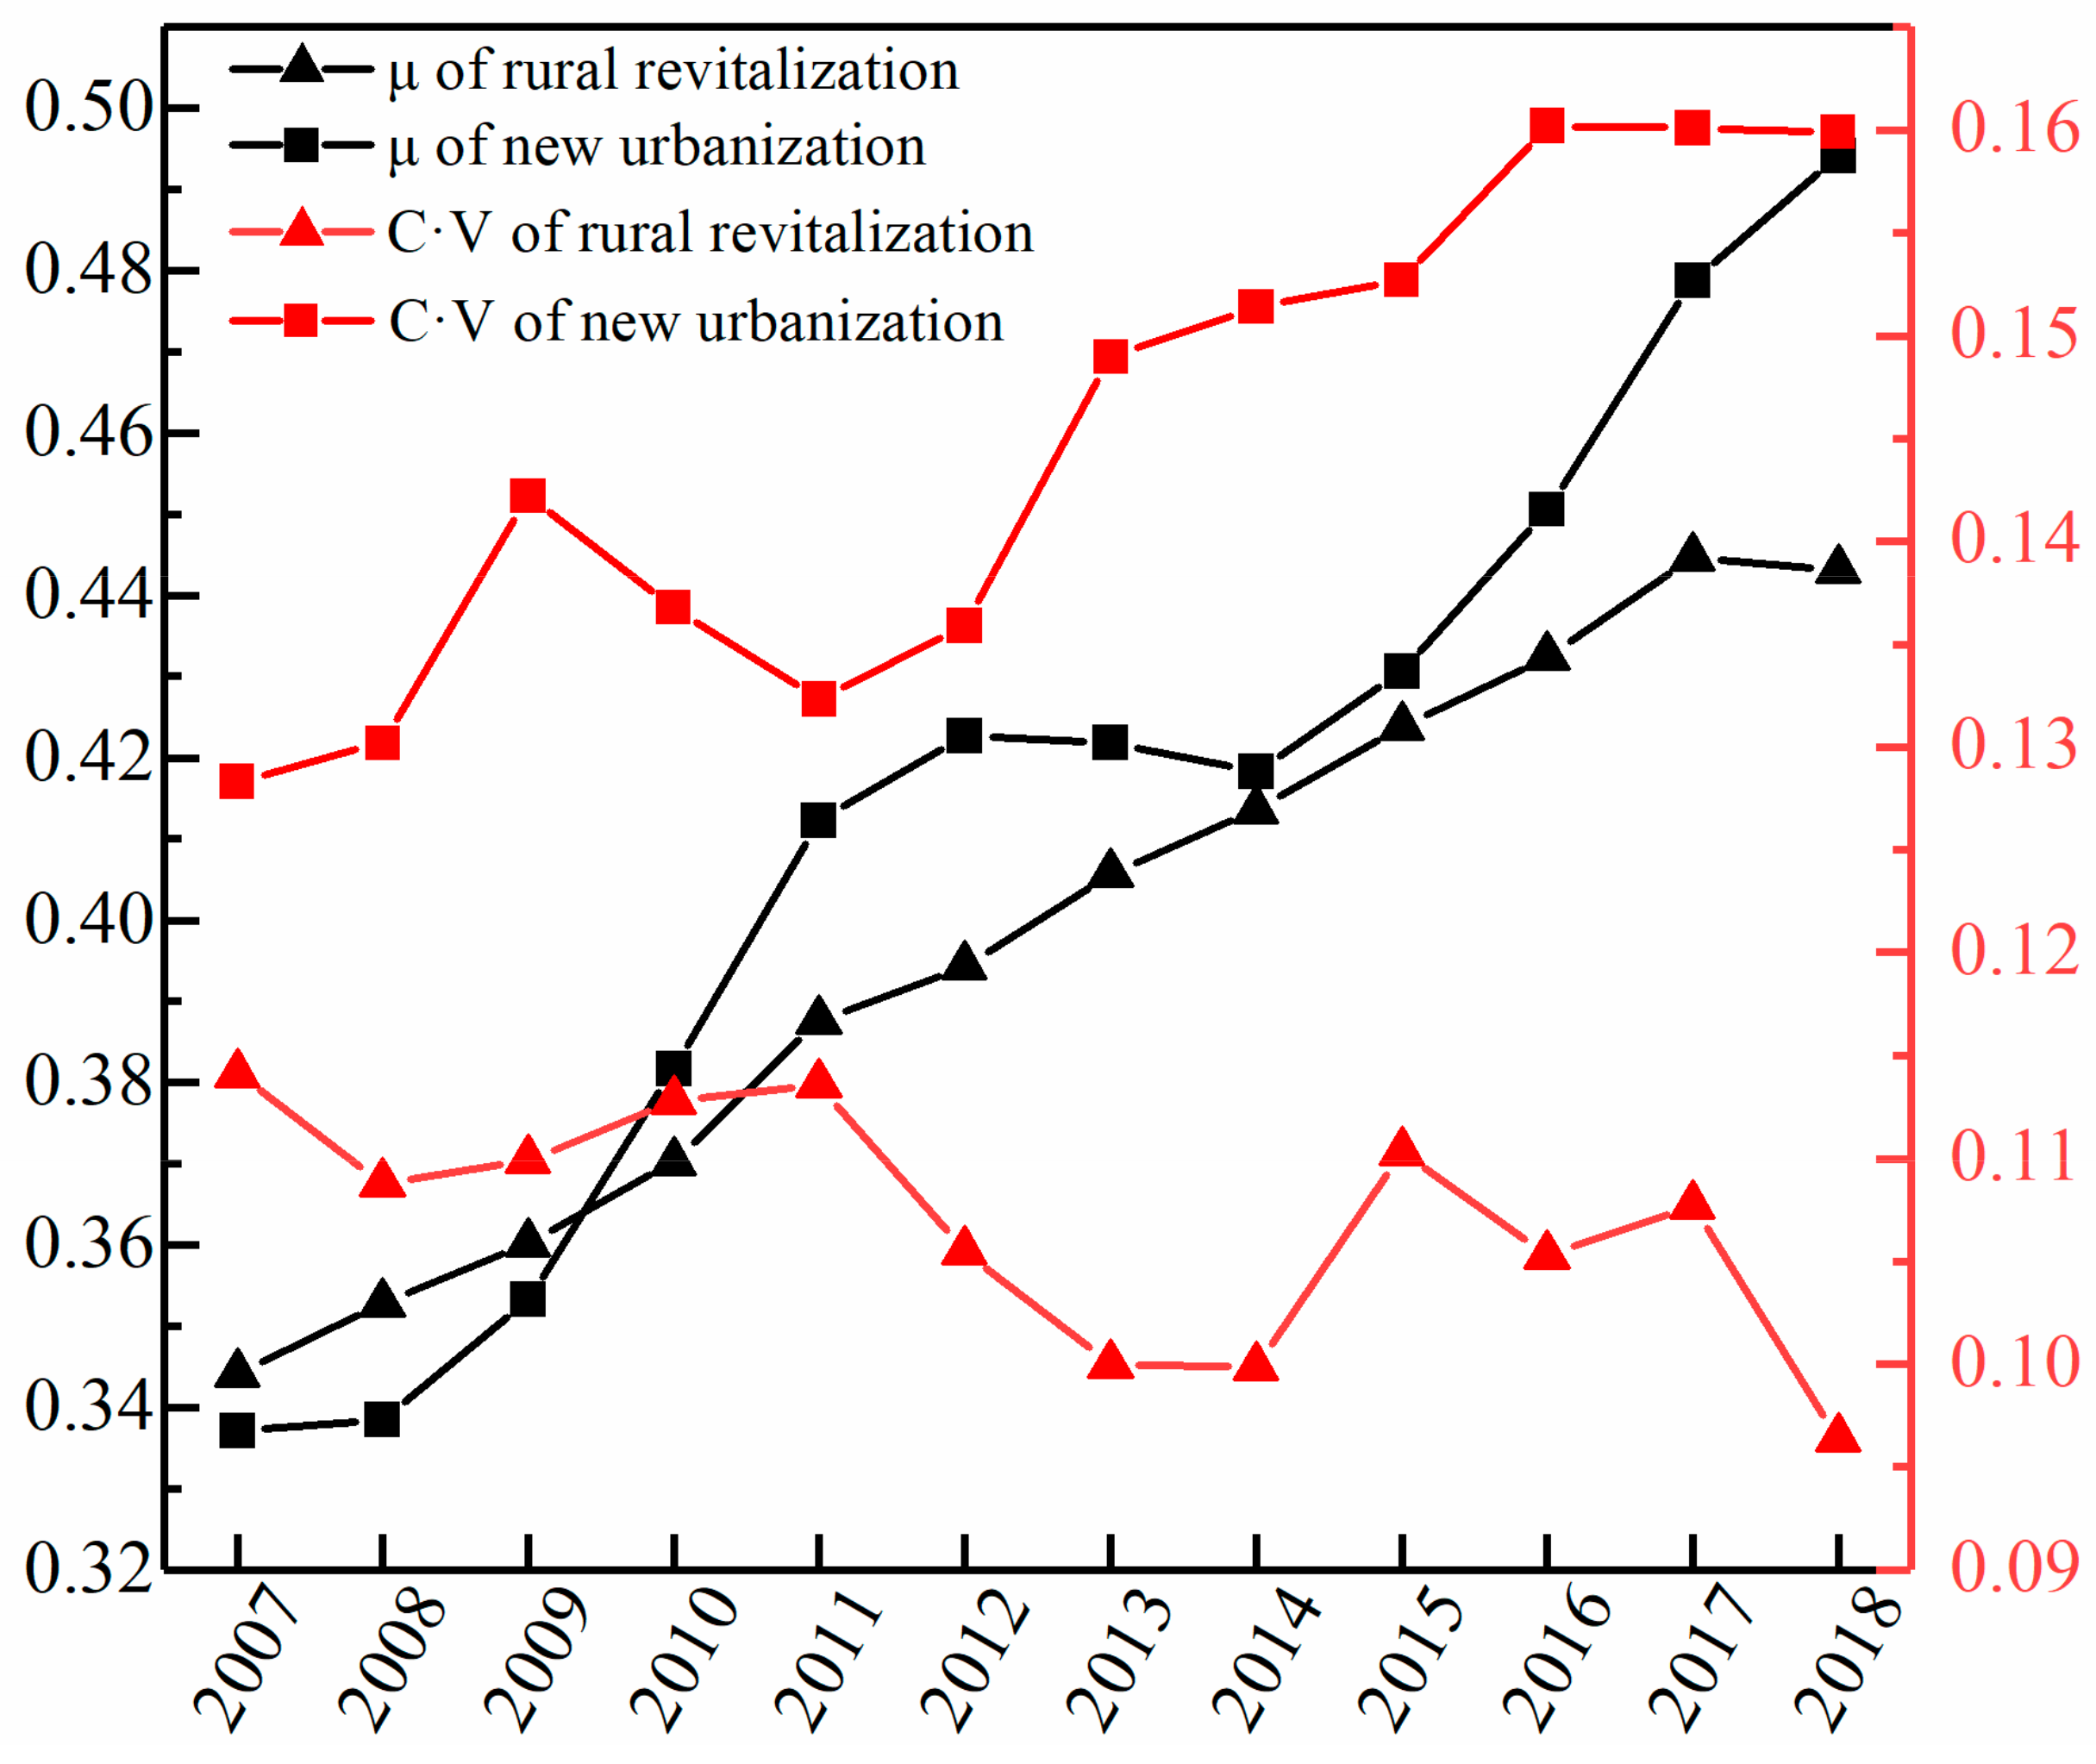
Figure 3, the overall level of
R(a) and
U(b) showed an upward trend during the study period, indicating that the quality of rural revitalization and new urbanization has both improved during the study period.
R(a) improved by 28.57% during the 12-year period, while
U(b) improved by 46.56%. It can be seen that the enhancement of
U(b) was significantly greater than that of
R(a) during the study period. In addition, the processes also differed.
R(a) showed a relatively linear and smooth growth during 2007–2017; then it fell slightly in 2018.
U(b) showed a phased growth. During 2007–2012, it showed an almost S-shaped growth pattern. However, during 2012–2014, it changed its previous growth momentum and saw a steady wave of small declines. Fortunately, the decline stopped in 2014, and then it resumed its rapid growth phase and reached a higher level in 2018. However, it should be noted that after more than a decade of improvement, the quality of both rural revitalization and new urbanization was still less than 0.5, implying further room for improvement on the overall level.
The relationship between R (a) and U(b), R(a) was above U(b) during 2007–2009, but by 2010, U(b) overtook R(a) and stayed ahead for the rest of the year. During 2010–2014, the gap between R(a) and U(b) first increased, then decreased, and by 2014, the gap reached its smallest level during the study period. However, good times did not last long, and the gap between the two widened rapidly after 2014, reaching a peak in 2018. It can be seen that the new urbanization level had been in the leading position after it surpassed the rural revitalization level in 2009. And the gap between them showed a trend of increasing after fluctuations.
It can also be seen from
Figure 3 that the coefficient of variation (C·V) of
U(b) was consistently higher than that of
R(a) during the study period, indicating that the difference in new urbanization quality among regions was significantly greater than that of rural revitalization. Regional differences in rural revitalization dropped to the lowest level in 2018 after fluctuation declines and rises during the study period, while the regional differences in new urbanization rose and fell through fluctuations but culminated in 2018. Although the average level of
R(a) was lower than that of
U(b), it showed a more balanced development among regions.
3.2. Spatial Evolution of Rural Revitalization and New Urbanization during 2007–2018
It can be seen from
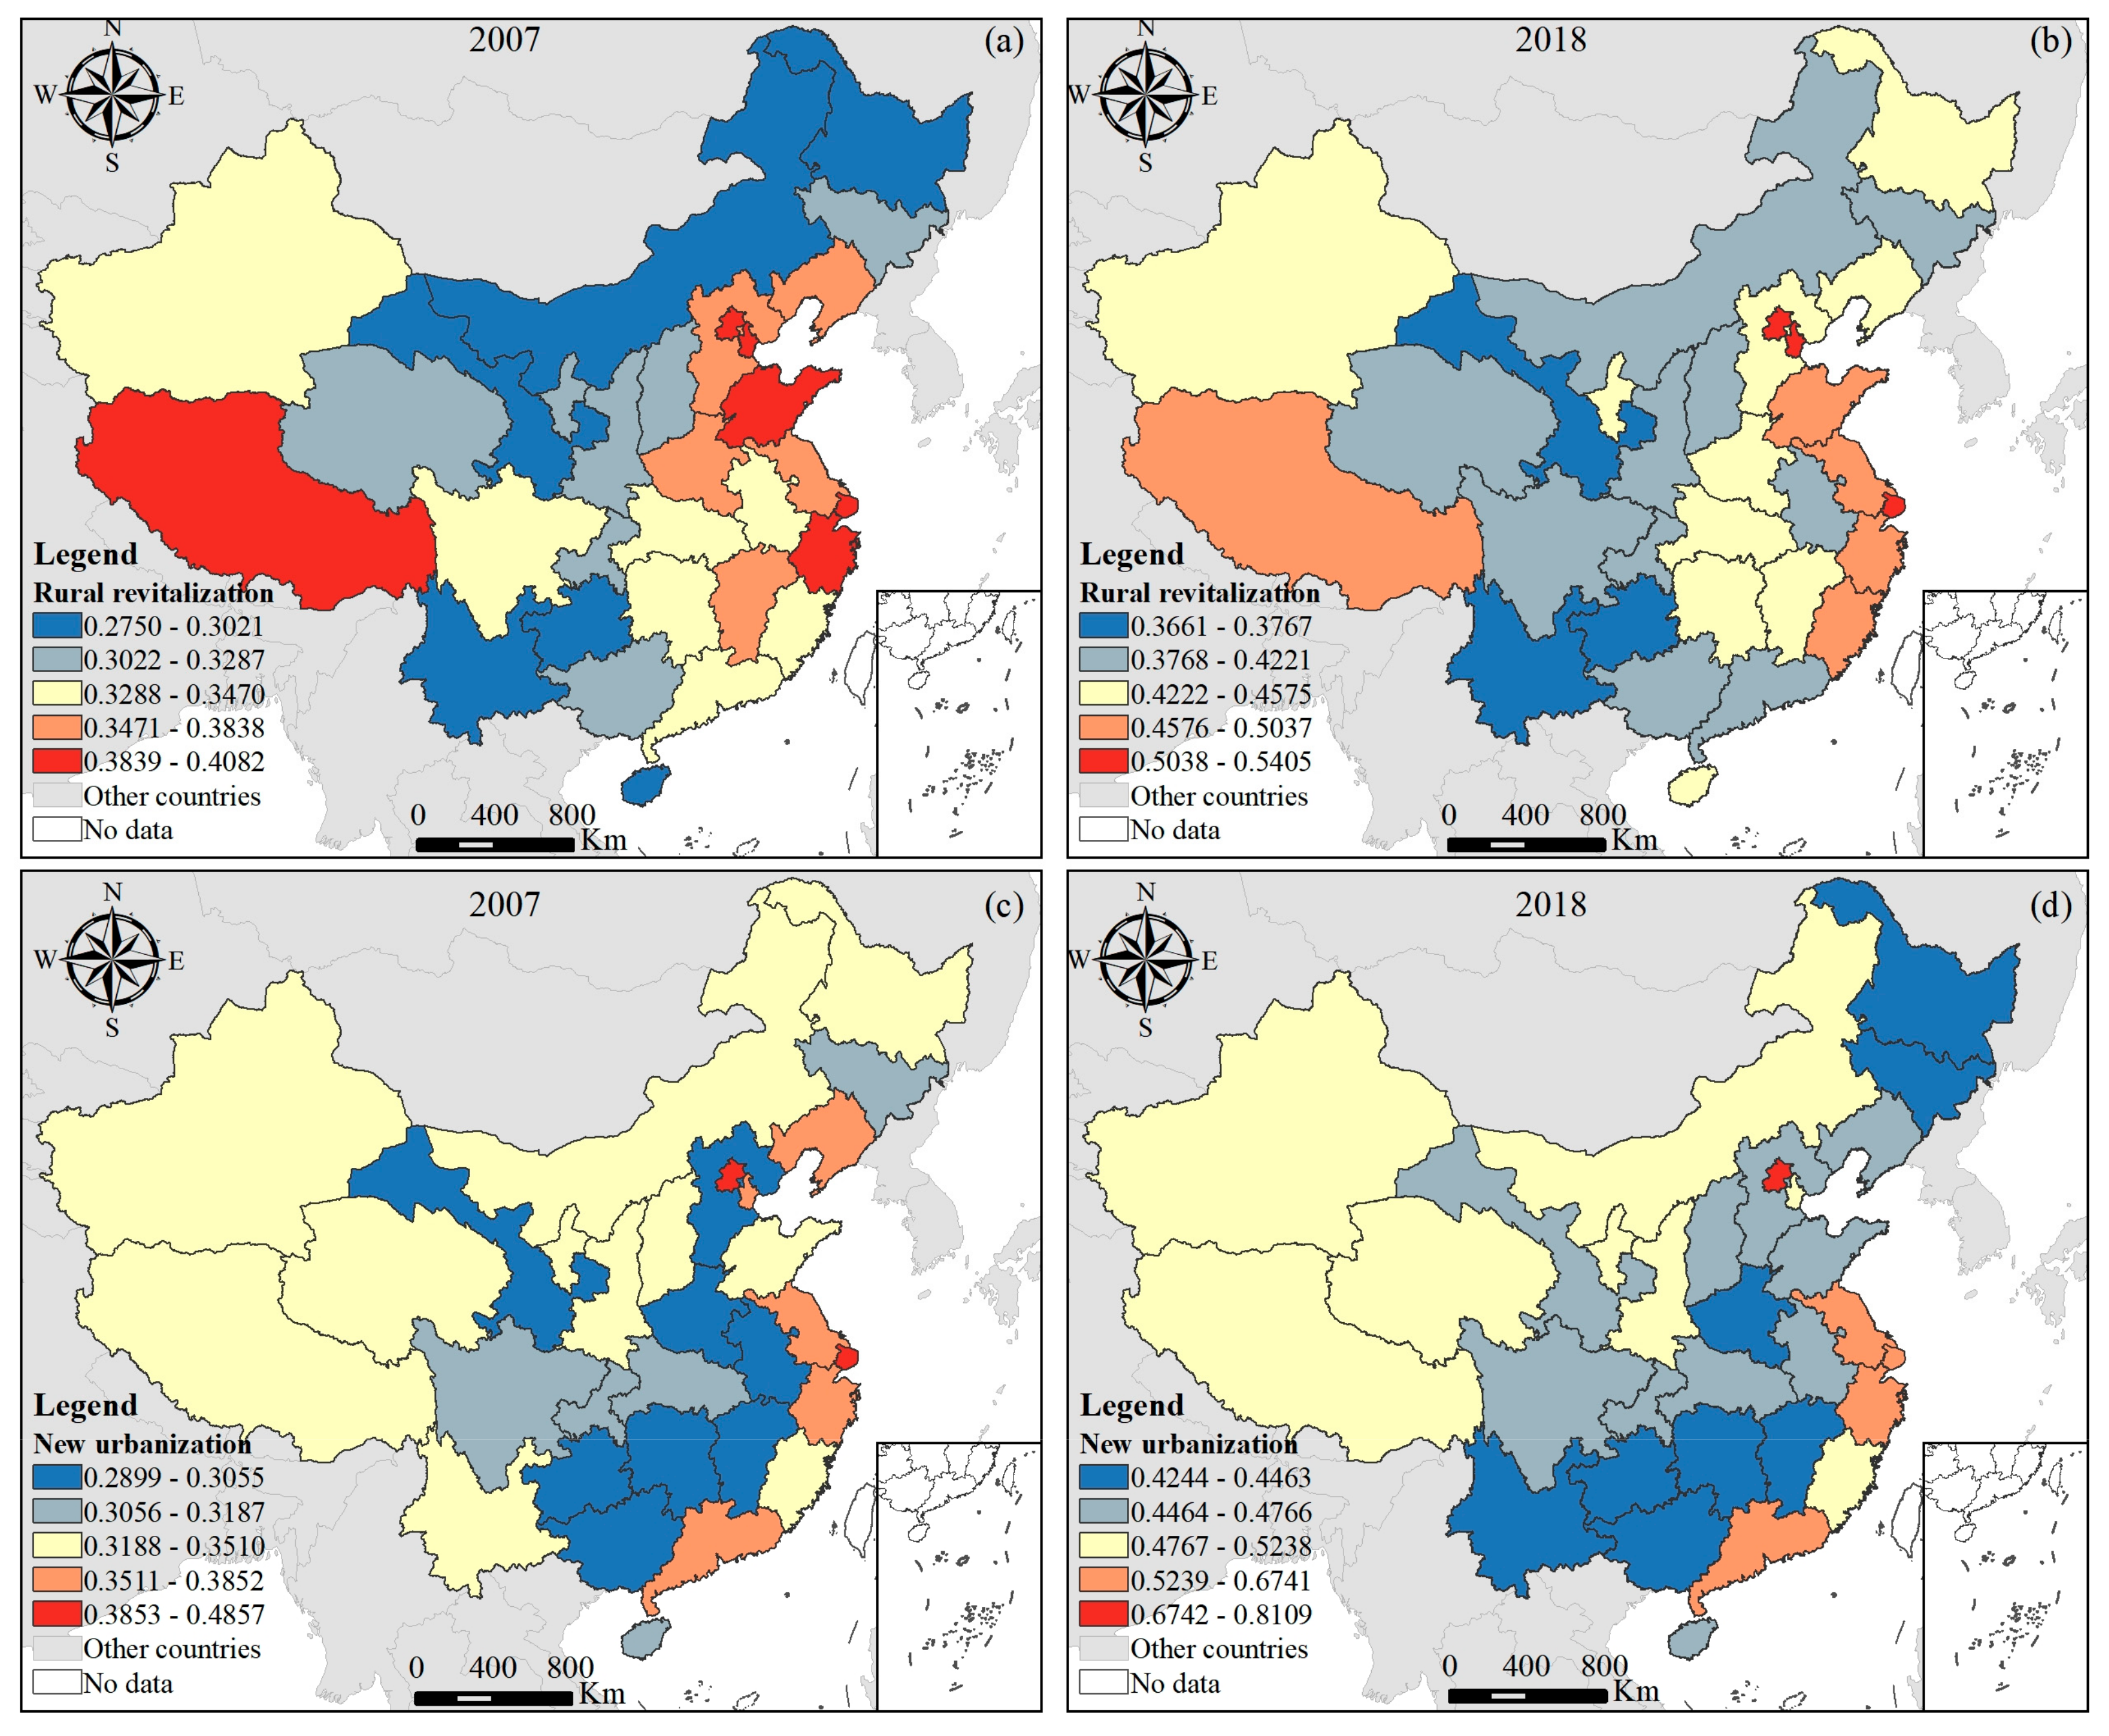
Figure 4a that the spatial distribution of
R(a) generally showed a development trend of “high in the central, eastern and northwest and low in the northeast and southwest” in 2007. The low-value area had a spatial T-shaped structure, dividing the high-value area into two parts, east and west. Six regions, including Beijing, Tianjin, Shandong, Shanghai, Fujian, and Tibet, were at the forefront in China, and six regions, including Heilongjiang, Inner Mongolia, Gansu, Yunnan, Guizhou, and Hainan, were at the bottom of the country.
Figure 4b showed that the spatial distribution pattern of
R(a) in China had changed somewhat by 2018. The number of regions in both the first and last classes decreased from six to three. The number of regions located in the middle level increased, and the spatial distribution gradually tended to develop towards a balanced state.
From
Figure 4c, we can see that the spatial distribution of
U(b) showed a “central collapse” in 2007, while Beijing and Tianjin (Bohai Sea Rim), the Yangtze River Delta, and the Pearl River Delta regions were high-value areas. The low-value areas were largely concentrated in the central regions. By 2018, Beijing was found in the absolute leading position.
Figure 4d showed that the high-value areas were still located in the eastern coastal region. The low-value areas were located in the southwest, central and northeast regions. The differences between regions became larger in 2018 compared to 2007.
3.3. Characteristics of Coupled Coordinated Development Degree during 2007–2018
As can be seen from the above
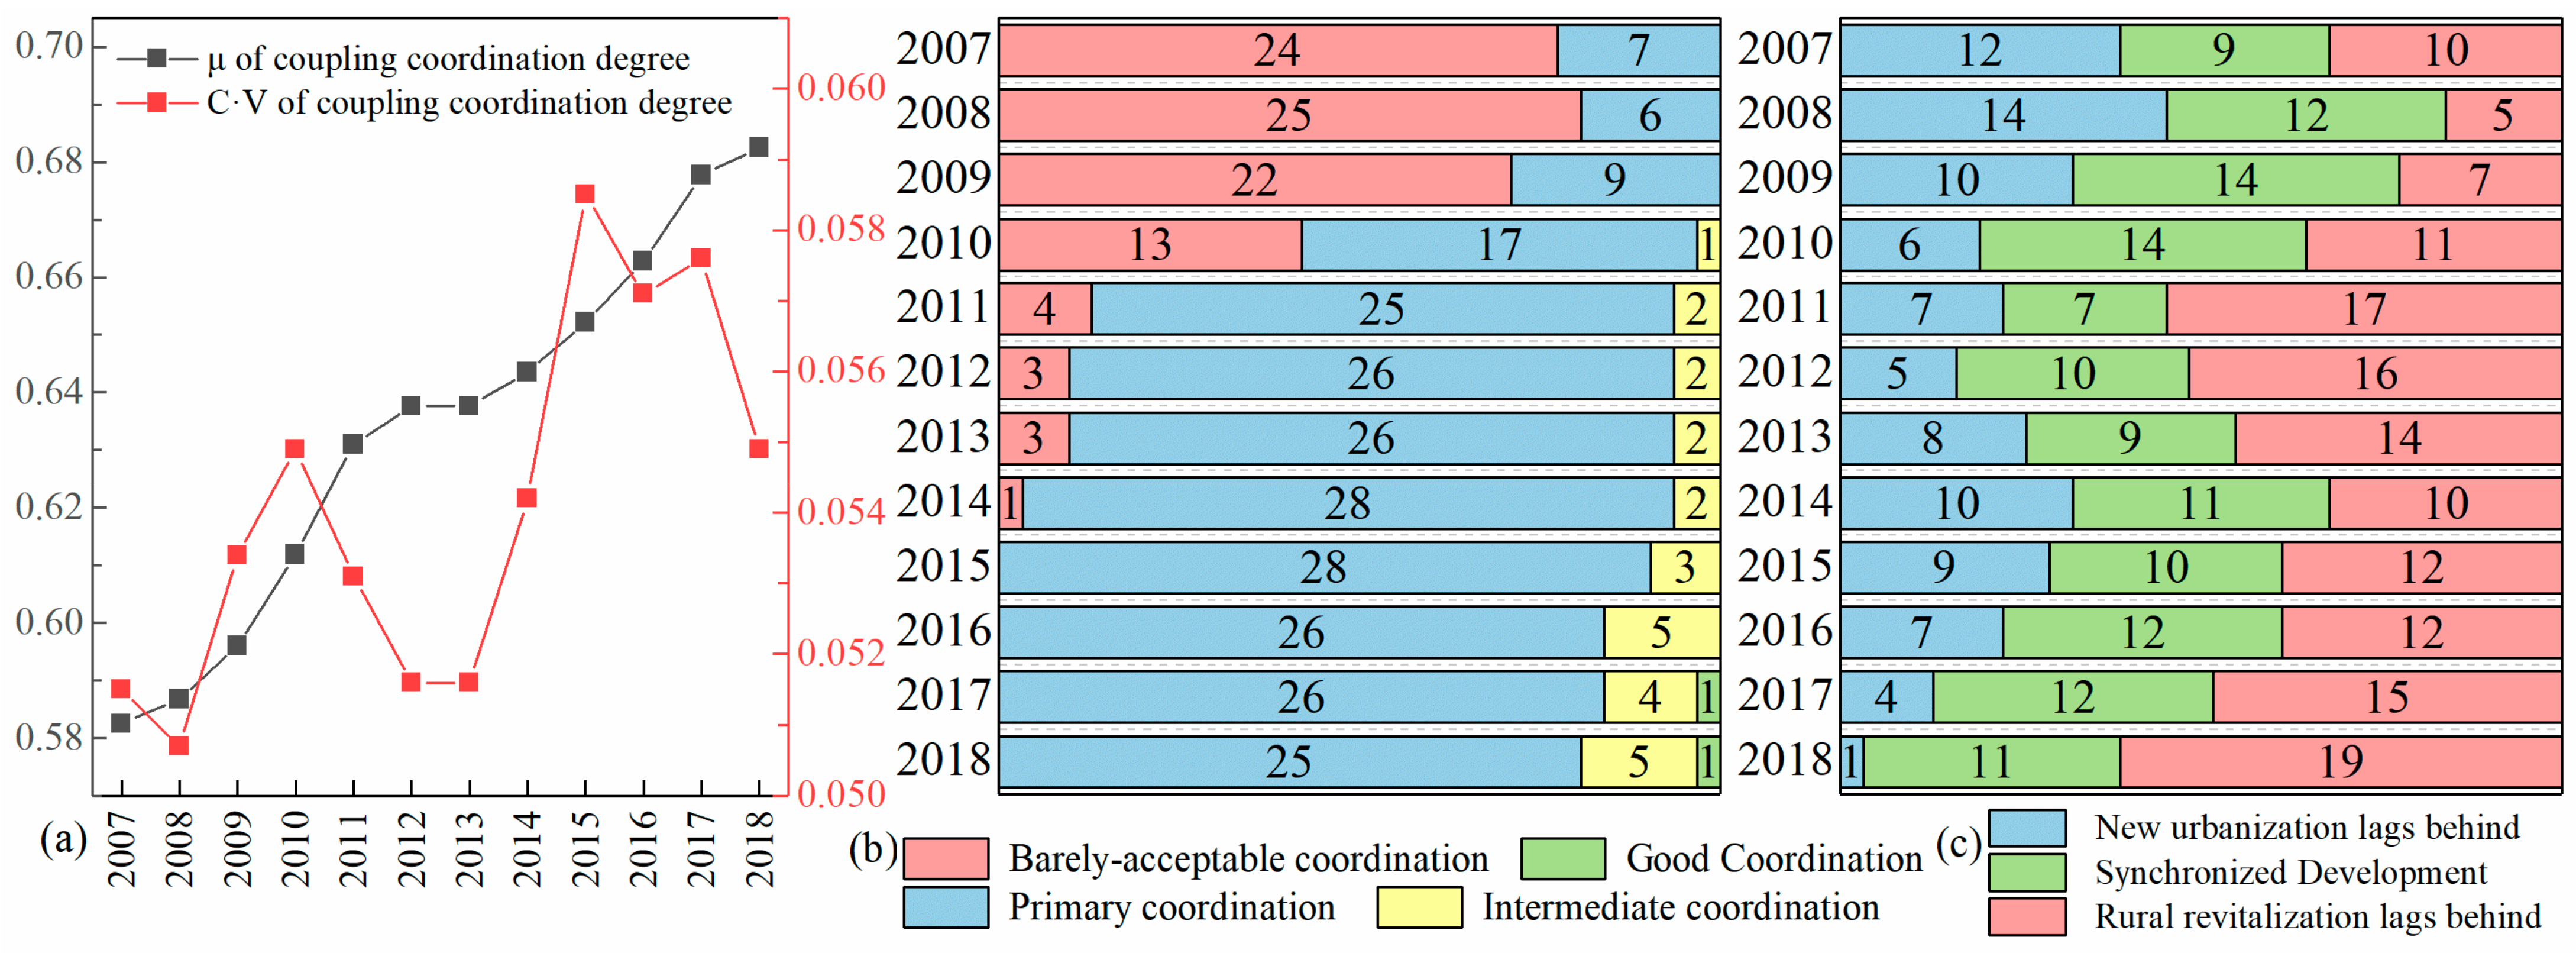
Figure 5a, the coupling coordination degree between rural revitalization and new urbanization in China was consistently rising during the study period. The overall level of D rose from 0.5824 in 2007 to 0.6825 in 2018, an increase of 17.19% in 12 years. The C·V of D fluctuated somewhat during the study period but was generally at a low level overall, which shows that the differences between regions were not significant.
The number of regions in each coordination level from 2007–2018 can be seen in
Figure 5b. In 2007, only seven regions, including Beijing, Tianjin, Shanghai, Jiangsu, Zhejiang, Shandong, and Tibet, were located in the primary coordination level, mostly distributed in the eastern coastal region except for Tibet. Twenty-four regions were on barely acceptable coordination grade in 2007, and then this number grew slightly in 2008 before decreasing rapidly. By 2015, there were no more districts at the barely acceptable coordination level nationwide. From 2010 on, Beijing was the first to enter the intermediate coordination stage, and the number of regions on intermediate coordination level gradually increased. By 2017, Beijing was again the first region to enter good coordination stage, and by 2018 it was still the only one at the good level stage. In 2018, the coordination development stage improved more comprehensively compared to 2007, and the vast majority of regions have raised their coordination development levels. In particular, the coupling coordination level for Beijing and Fujian was upgraded by two levels, where Fujian was upgraded from barely acceptable coordination to intermediate coordination, and Beijing was upgraded from primary coordination to good coordination. It is worth noting that among the 31 regions, only Tibet and Shandong failed to achieve an increase with regard to the coupling coordination level. In fact, the coupling coordination degree of these two regions improved somewhat during the study period, in which the coordination development of Shandong increased from 0.6057 in 2007 to 0.6910 in 2018, and Tibet increased from 0.6054 in 2007 to 0.6969 in 2018; only the degree of improvement was not enough to break the criteria of stratification.
The relative development of rural revitalization and new urbanization can be seen in
Figure 5c. In 2007, 12 regions were included in the new urbanization lagging type (NULT), nine regions in the synchronized development type (SDT), and ten regions in the rural revitalization lagging type (RRLT). During the study period, the number of NULT decreased to 1 by 2018 after fluctuations, indicating that urbanization was developing faster than rural revitalization. For RRLT, after declining in 2008 and 2009, it rose to its highest level in 2018, reaching 19 and accounting for more than 60% of all study areas. As for type SDT, its number changed little, increasing and decreasing during the study period, reaching 11 by 2018. The number of SDT did not achieve a significant breakthrough during the study period, indicating that the synchronized development between rural revitalization and new urbanization encountered a bottleneck.
3.4. Spatial Evolution of Coupled Coordinated Development Degree during 2007–2018
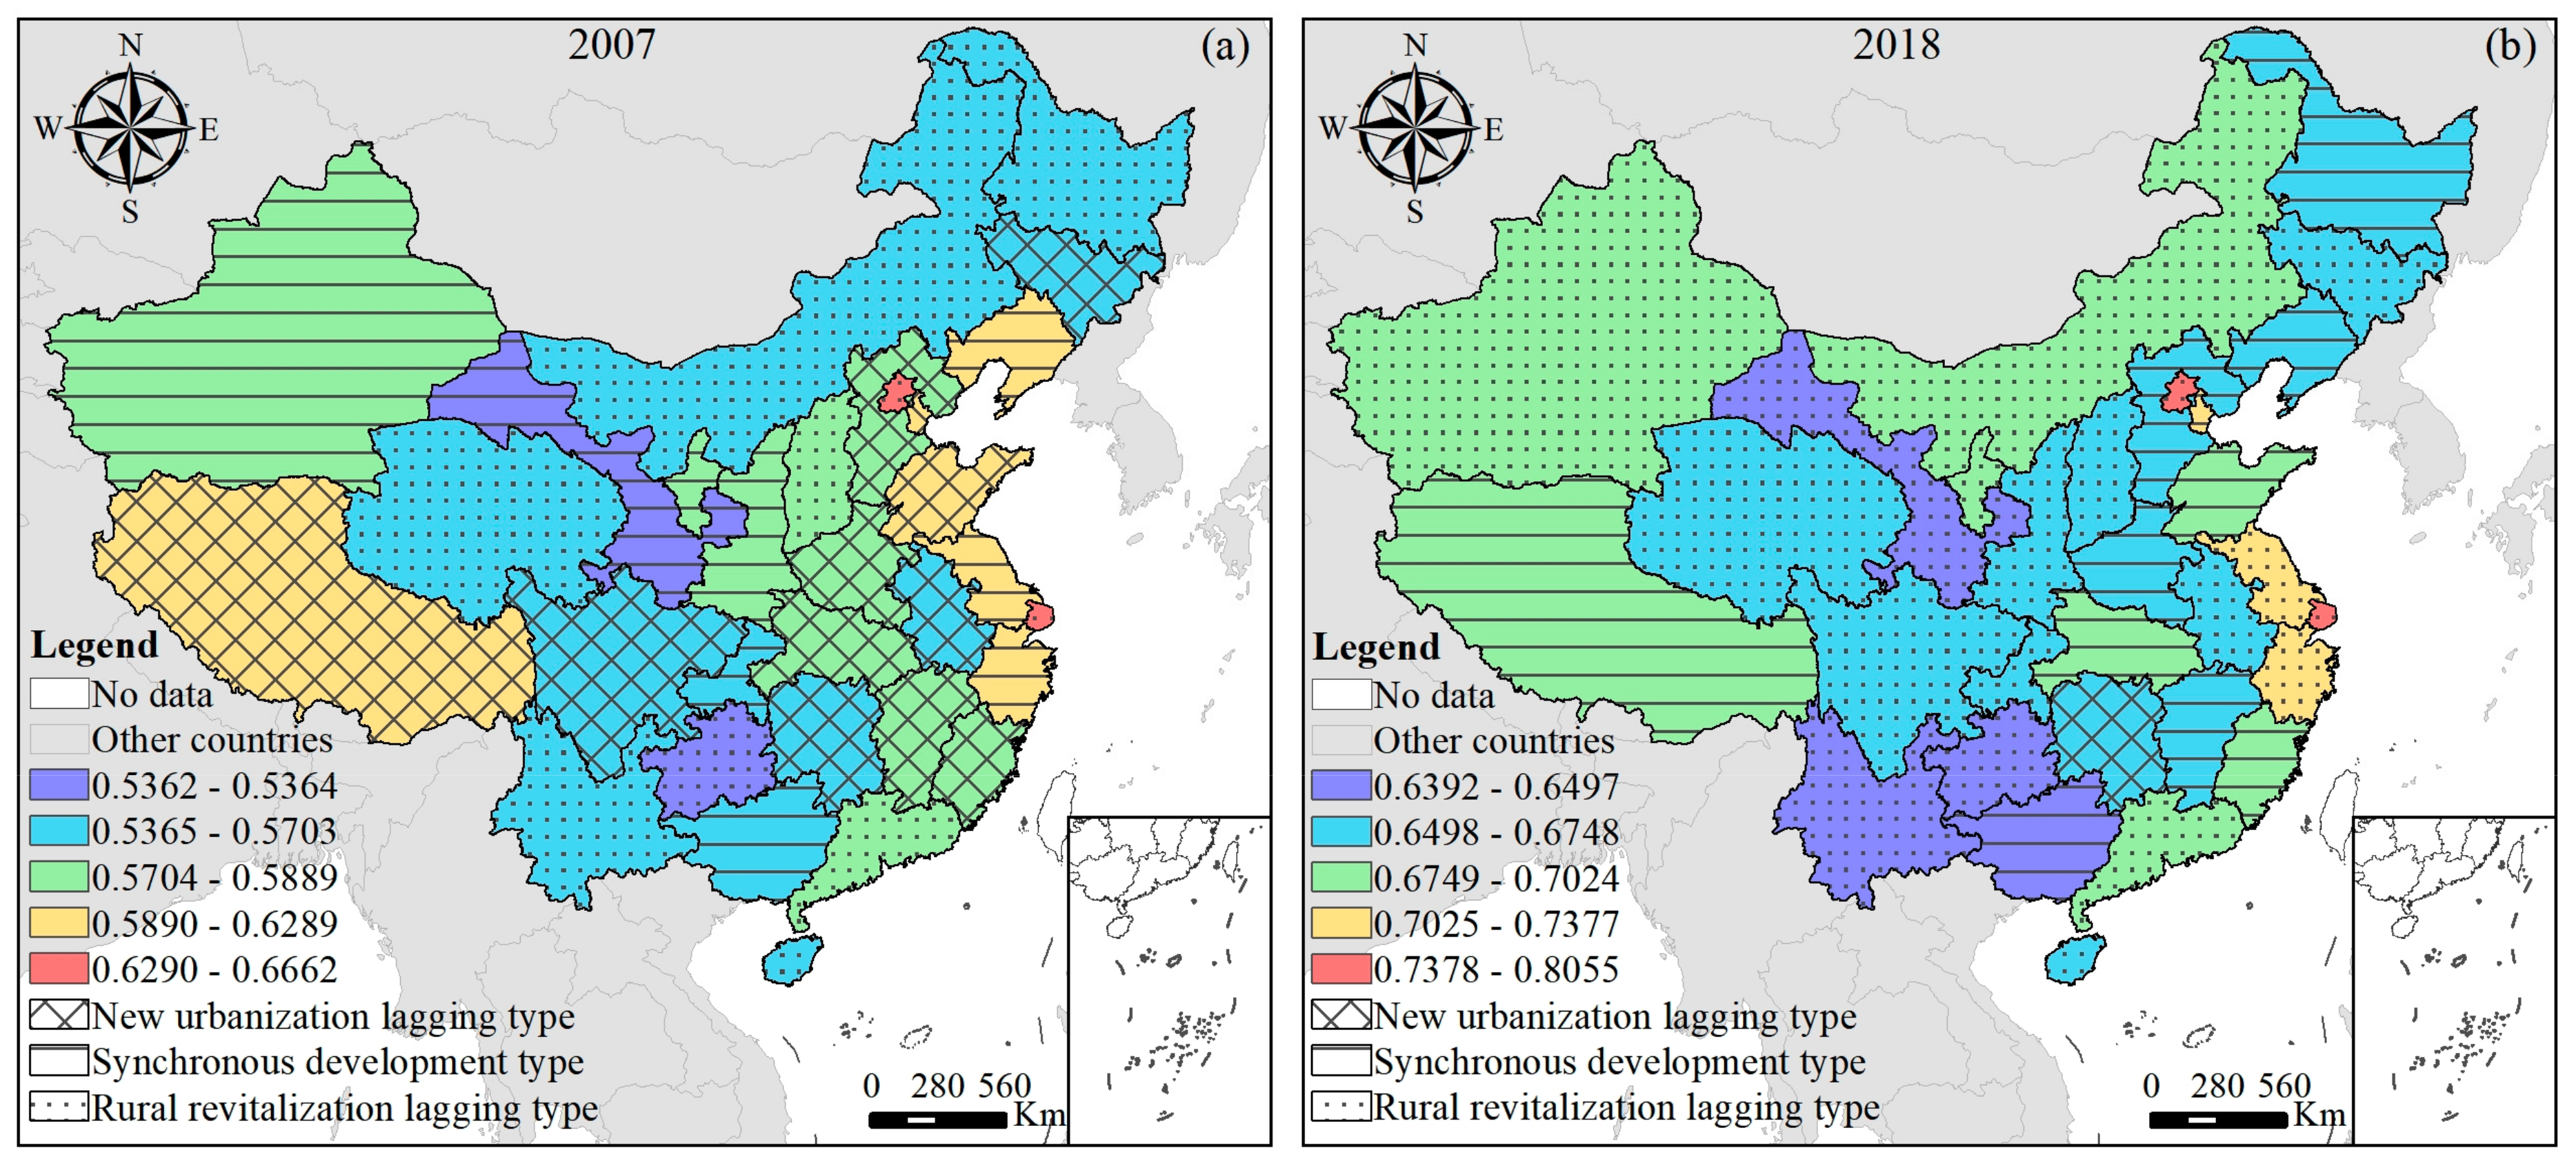
With the help of the natural break-point classification method (Jenks) in ArcGIS version 10.7© software, D was classified according to the principle of maximum difference between groups (
Figure 6). In 2007, D showed an overall pattern of “high in the east-west and low in the north and southwest”. In 2007, Beijing and Shanghai had the highest level of D, while Gansu and Guizhou had the lowest D. By 2018, the overall pattern of D compared to 2007 showed a trend of “contraction in the high-value area and expansion in the low-value area”. In particular, the most significant low-value expansion was seen in the Southwest and Central regions. The five regions of Beijing, Tianjin, and the Yangtze River Delta were the only remaining relatively high-value areas. Compared with these high-value areas, there is still some room for improving the coupling and coordination of rural revitalization and urbanization in most areas.
For L, it can be seen from the previous discussion that the numbers of the three types were relatively balanced in 2007. The spatial distribution of the three types in 2007 can be seen in
Figure 6a. (1) The overall spatial distribution of NULT was characterized by a “large concentration and small dispersion”. Seventy-five percent of the NULT regions were clustered on the periphery of Beijing and the Yangtze River Delta. The other three NULT regions were located in Tibet, Sichuan, and Jilin. (2) The distribution of RRLT types showed a spatial dispersion in 2007. They were mainly distributed in highly developed urbanized areas, such as Beijing, Shanghai, and Guangdong, as well as in areas unsuitable for agricultural development with a complex topography and harsher natural environment, such as Hainan, Yunnan, Guizhou, Qinghai, Shanxi, Heilongjiang, etc. (3) The spatial distribution of SDT formed two synergistic development belts in the east and west, namely the western line of Xinjiang, Gansu, Ningxia, Shaanxi, Chongqing and Guangxi, and the eastern line of Liaoning, Jiangsu, and Zhejiang. The difference is that D was lower in the western route and higher in the eastern route. In other words, although the development levels of rural revitalization and new urbanization in the western route areas were relatively consistent, they belonged to a lower level of synchronization.
The most intuitive feeling from
Figure 6b is that there was only one NULT left in 2018, which was Hunan. During 2007–2018, 19 regions experienced a change in relative development type. This variation can be divided into four types, with the largest to smallest percentages being NULT→SDT (42.11%), SDT→RRLT (36.84%), NULT→RRLT (15.79%), and RRLT→SDT (5.26%), and no type transferred to NULT. The above changes indicated that new urbanization had far surpassed rural revitalization during the study period, which resulted in 30 of the 31 study areas having urbanization levels that exceed or equal rural revitalization levels. In 2018, 61.29% of districts were RRLT, compared to 32.26% in 2007, and nearly doubled, indicating that rural revitalization has become a major issue limiting high-quality, sustainable development in China.
3.5. Analysis of the Driving Mechanism of the Coupling Coordination Degree during 2007–2018
Based on the coupling coordination status of rural revitalization and new urbanization in the previous section, as well as drawing on previous research results, the following eight indicators were taken as driving factors, which are the ratio of the output value of tertiary industry (TI), total factor productivity (TFP), the intensity of investment in research and development (RD), the proportion of total import and export to GDP (FT), equilibrium index of urban and rural per capita income (URI), equilibrium index of urban and rural per capita consumption (URC), equilibrium index of urban and rural fixed asset investment (URF), and the proportion of cultivated land transfer (CLF) respectively. The data of these eight indicators in 2007 and 2018 were selected and standardized as independent variables, and D of the corresponding year was used as a dependent variable.
With the help of GeoDa version 1.18.0© software, the global
Moran’s I of D from 2007–2018 was derived (
Table 3). As can be seen from
Table 3, the values of
Moran’s I were between 0.358 and 0.452, indicating that D had a significant positive correlation in the spatial distribution. Therefore, if the traditional ordinary least squares (OLS) model is used for regression analysis, the spatial factor may be neglected. Therefore, the OLS model was performed first, followed by the GWR model test.
The adjusted R
2 under OLS estimation was 0.711 in 2007 and 0.774 in 2018, while the corrected R
2 in the GWR model was 0.769 in 2007 and 0.819 in 2018, indicating that the GWR model had more explanatory power, and therefore the GWR model was selected for driving force analysis. With the help of ESRI ArcGIS version 10.7 software, the regression coefficients of the GWR model were visualized, as shown in
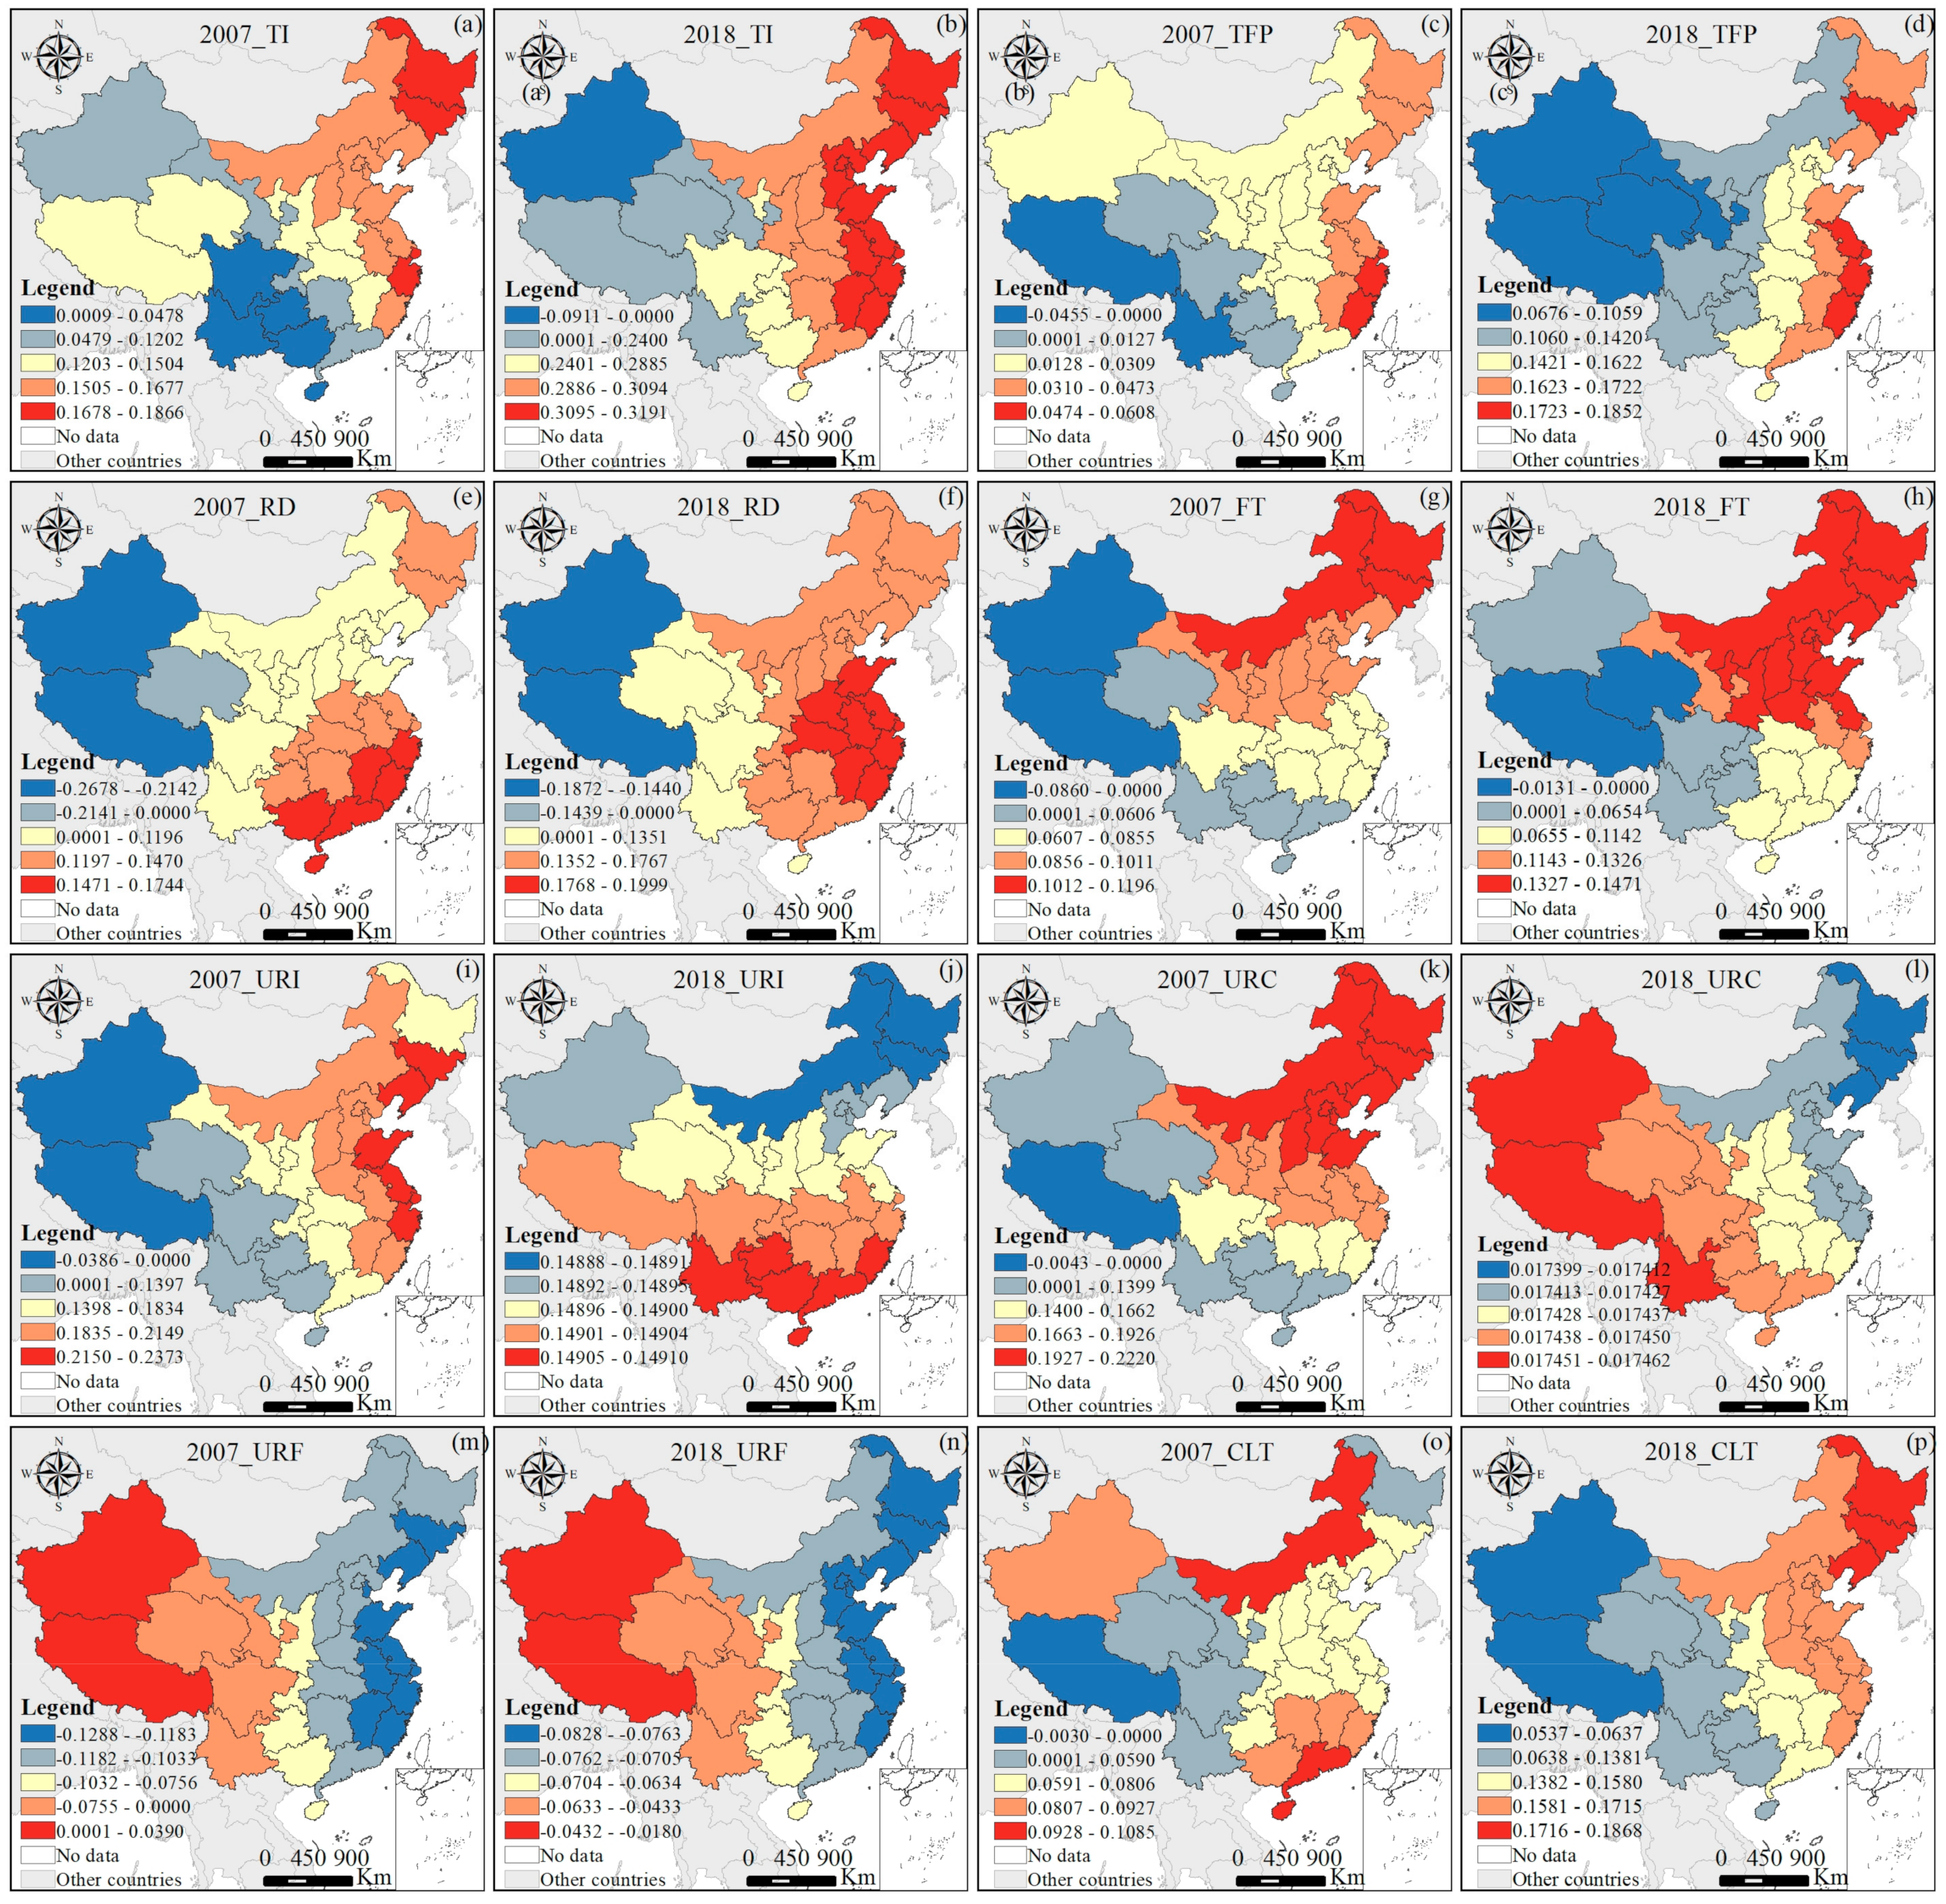
Figure 7.
As shown in
Figure 7, the coefficients of driving factors varied significantly in space and generally showed a development trend of hierarchical band distribution. Except for URF, which showed a significant negative spatial correlation, the other influences all showed a strong positive correlation in the vast majority of regions. In 2018, the absolute values of regression coefficients according to the drivers, in descending order, were TI > RD > CLT > TFP > URI > FT > URF > URC.
(1) For TI, the development of the tertiary industry can promote the transformation and upgrading of industrial structure, thus accelerating the development of urbanization. At the same time, it also promotes the improvement of agricultural production efficiency and drives the linkage development of agricultural and non-agricultural sectors. It can be seen from
Figure 7a,b that the regression coefficients increased significantly over the study period and showed a more pronounced banding feature in 2018 than in 2007. In 2007, the development of the tertiary sector had a strong positive impact on the coordinated development of urban and rural areas in Shanghai, Zhejiang, Heilongjiang, and Jilin. By 2018, the impact coefficient of TI showed a more pronounced east-west divergence, with the eastern region being more sensitive to changes in the tertiary sector than the western region.
(2) For TFP, it is the main driving force of national economic growth, and the report of the Nineteenth National Congress of the CPC put forward for the first time the urgent requirement to improve total factor productivity back in 2017. It clearly advocated improving production efficiency and optimizing resource allocation through technological progress to achieve more output with less input, marking a new era for national economic development. It can be seen from
Figure 7c,d that TFP also exhibited significant east-west divergence, with urban-rural coordination in the eastern region being more sensitive to changes in TFP. The improvement of TFP is important for promoting urban-rural integration, integrating their unique quality resources for innovative development.
(3) For RD, in 2007, it had the greatest impact on the southeast coastal region, gradually weakening towards the west and north, with a strong negative correlation for Xinjiang and Tibet. This is because Xinjiang and Tibet have a higher demand for infrastructure and livelihood capital than research and development funding, and limited investment in research funding cannot achieve qualitative changes in research. By 2018, the high-value area shifted to the northeast, mainly in the eastern coastal and central regions, indicating that RD had become an important driver of coordinated urban-rural development in the central-eastern region.
(4) For FT, foreign trade can reduce production costs by expanding the scale of production and develop new foreign markets to bring more profits. It can be seen from
Figure 7g,h that in 2007, the high-value area focused on the northeast, and by 2018 the high-value area spread to the central and coastal regions. FT had a strong drive for coupled urban-rural coordination in these regions, and urban-rural coordination in the west was not very significant for FT, showing a weak negative correlation.
(5) For URI, too large a gap between urban and rural areas will inhibit not only economic growth but also stimulate social conflicts and exacerbate the unbalanced and insufficient regional development. It can be seen from
Figure 7i,j that the spatial distribution changed significantly during the study period. In 2007, the improvement of urban-rural income balance had a greater impact on urban-rural coordination in the eastern coastal and northeastern regions, and the regression coefficients showed an obvious decay from east to west. By 2018, the high-value area shifted to the southern region of China, showing an overall decreasing trend from north to south. However, the regression coefficients did not differ significantly across regions of the country, indicating that the improvement of urban-rural income balance had a significant driving effect on urban-rural coordination on the national level.
(6) For URC, consumption is the driving force of production development, and poor consumption is a deep-seated contradiction and structural problem that has long plagued China’s economic development. The spatial pattern shifted significantly during the study period, with the high-value area in 2007 changing to the low-value area in 2018, and similarly, the low-value area in 2007 changing to the high-value area in 2018. In 2007, URC had the greatest impact on northeast China and decreased from northeast to southwest, and in 2018, the high-value area switched to northwest and southwest and decreased from west to east. Overall, the role of URC in driving urban-rural coordination was significantly greater in 2007 than in 2018.
(7) For URF, investment in fixed assets is the main means of reproduction of fixed assets in society. The economy is strengthened through the activity of building and acquiring fixed assets. The overall effect of URF on coordinated urban-rural development was negatively correlated, as seen in
Figure 7m,n. In 2007, only Xinjiang and Tibet were positively correlated, indicating that increasing rural fixed asset investment has played a positive role in coordinated urban-rural development in these two regions. By 2018, the regression coefficients of all regions were negative, showing that URF had a negative effect on coordinated urban-rural development.
(8) For CLT, the transfer of cultivated land can help rural areas realize the large-scale operation of cultivated land, thus enhancing farmers’ income and promoting the development of agriculture. At the same time, cultivated land transfer can release a large amount of agricultural labor, which can then be invested in labor-intensive secondary and tertiary industries. It can be seen from
Figure 7o,p that CLF had a strong positive driving effect on coordinated urban-rural development. High values of regression coefficients in 2007 were located in three regions, Guangdong, Hainan, and Inner Mongolia. The regression coefficients in 2018 were overall higher than those in 2007, and a more obvious spatial clustering and band distribution was formed/ Among them, the high-value areas were located in the three northeastern provinces, and the regression coefficients decreased from northeast to northwest layer by layer.
4. Discussion
Currently, the relationship between rural revitalization and new urbanization is both a classic urban-rural issue and a national strategic one, which has attracted continuous attention and discussion in academic circles [
48]. In this study, the Beijing-Tianjin region and the Yangtze River Delta region were both highly coupled and coordinated areas for rural revitalization and new urbanization. This is due to the strong comprehensive competitive strength and sound development of urban and rural systems in the eastern region, which is the economically developed region in China at this stage [
42]. However, rural revitalization in several of China’s most economically developed regions, such as Beijing, Shanghai, Jiangsu and Zhejiang, and Guangdong, has lagged behind new urbanization. By comparing urban-rural relations in different European countries (i.e., Finland, France, Hungary, the Netherlands, and Spain), it was confirmed that the pressure of cities on rural areas is not a negative process [
49]. Therefore, developed regions should exert their core regional advantages to drive the development of urbanization in the surrounding areas, and at the same time, do a good job in the revitalization of the countryside. Not only that, at the beginning of the study, the ratio of the number of NULT, SDT, and RRLT types was 12:9:10; by the end of the study period, the ratio changed to 1:11:19, which was sufficient to show that in recent years, the development momentum of rural revitalization was significantly lagging behind that of new urbanization. A British regional study also confirms that the economic development approach in urban areas has a negative impact on the competitiveness of rural areas [
50]. As a result, in future development, sufficient attention must be given to rural revitalization so that the two-wheel drive between urban and rural areas can advance smoothly.
Scholars have conducted a number of quantitative or qualitative studies on factors influencing sustainable urban and rural development. Research showed that processes for coordinating urban and rural development in China were driven by four major forces: the economic development and urbanization level, bottom-up rural development, national government policy, and local human developmental state practices [
51]. In addition, scholars also identified 10 key causes related to the urban-rural conflict in China from the factors observed in the literature [
52]. Based on existing studies and combined with specific practices, this paper selects eight driving factors that can reveal the coordinated urban-rural development in China. The driving mechanism analysis showed that different drivers had different effects on the coupling coordination in different regions. In terms of the most recent 2018, the hierarchical banding distribution of TI and TFP revealed a clear east-west divergence in the driving of coupling coordination degree, indicating that the eastern region should embark on industrial upgrading and total factor productivity improvement. Similarly, studies in the Romanian region demonstrated that some economic activities were transferred from urban to rural areas during economic fluctuations, thus promoting industrial shifts and upgrading [
53]. RD’s high-value areas were located in the eastern coast and central region, and it can be seen that these places should seize the key point of science and technology innovation to achieve a breakthrough. The high-value areas of FT and CLT were clustered in the northeastern part of China, showing that these regions should start to raise the level of foreign investment utilization and rely on their own characteristics to attract foreign investment for their development. In addition, the northeast region should strengthen the transfer of rural land so as to optimize the allocation of land resources between urban and rural areas and improve the efficiency of land resources utilization. Current research demonstrated that land use transformation has a negative impact on the development of urban-rural integration [
54]. However, according to the results of this paper, the act of arable land transfer played a role in promoting the coordinated development of urban and rural areas. For URI and URC, narrowing the income and consumption gap between urban and rural areas plays an obvious role in promoting the coordinated development of urban and rural areas nationwide. Therefore, it is necessary to narrow the income and consumption gap between urban and rural residents and promote the continuous improvement of the basic livelihood security level and consumption level in rural areas [
55]. Investments in territorial capital and regional capacity building were considered to be the main instruments of rural development [
56]. However, this study concludes that URF showed a weak negative correlation nationwide. This is because urban and rural fixed asset investments need a certain degree of concentration to reflect the agglomeration benefits, so urban concentrated investments can better reflect the investment benefits. A study in Romania also confirmed that investment in rural infrastructure was not the best strategy for economic development in rural areas [
57]. China’s urbanization rate exceeded 60% at the end of 2020, and the China Rural Development Report (2021) pointed out that China’s urbanization rate will reach about 72% by 2035, and there will still be a large number of farmers flocking to cities. Therefore, we should continue to increase the total amount of urban fixed-asset investment while raising the per capita level of rural fixed asset investment and promoting the simultaneous improvement of urban and rural infrastructure construction.
This paper tries to reconstruct the evaluation index system of rural revitalization and new urbanization. The existing research on new urbanization is relatively mature, while the research on rural revitalization is still at the exploratory stage. Rural revitalization is a complex system involving various elements of human, land, industry, and environment, and a unified research system has not yet been formed in the academic field. Therefore, it is one of the directions of future research to further explore the construction of a scientific, systematic, comprehensive, and practical index system for rural revitalization. In addition, based on the availability of data, this paper chooses to conduct the study on the provincial level. In the future, with the standardization and enrichment of statistical data, municipal or county-level data can be obtained. Then, a more detailed study can be conducted to reveal the inner laws of sustainable urban and rural development at a smaller scale.
5. Conclusions
This study firstly proposed an evaluation framework including four criteria layers and 20 indicators for rural revitalization and new urbanization, respectively. Then the subjective-objective weighting method (SWM-OWM) was used to calculate the rural revitalization index and new urbanization index of each region. Subsequently, the coupled coordination degree (CCD) model was introduced to measure the coupled and coordinated development status between rural revitalization and new urbanization. Finally, the geographically weighted regression (GWR) model was applied to analyze the driving mechanism of coordinated urban-rural development. The main conclusions can be drawn as follows:
(1) The quality of both rural revitalization and new urbanization improved during the study period, with R(a) improving by 28.57% and U(b) improving by 46.56%. U(b) had been in the leading position after it surpassed R(a) in 2009, and the gap between them showed a trend of increasing after fluctuations. Although the average level of R(a) was lower than that of U(b), it showed a more balanced development among regions. In 2007, the spatial distribution of R(a) generally showed a development trend of “high in the central, eastern and northwestern regions and low in the northeast and southwest”. By 2018, the spatial distribution gradually tended to develop towards a balanced state. The spatial distribution of U(b) showed a “central collapse” in 2007, while Beijing and Tianjin (Bohai Sea Rim), the Yangtze River Delta, and the Pearl River Delta regions were high-value areas. The differences between regions became larger in 2018 compared to 2007.
(2) The coupling coordination degree between rural revitalization and new urbanization in China was consistently rising during the study period. In 2007, D showed an overall pattern of “high in the east-west and low in the north and southwest”. By 2018, the overall pattern of D compared to 2007 showed a trend of “contraction in the high-value area and expansion in the low-value area”. During 2007–2018, 19 regions experienced a change in relative development type. This variation can be divided into four types, with the largest to smallest percentages being NULT→SDT (42.11%), SDT→RRLT (36.84%), NULT→RRLT (15.79%), and RRLT→SDT (5.26%), and no type transferred to NULT.
(3) The coefficients of driving factors varied significantly in space and generally showed a development trend of hierarchical band distribution. Except for URF, which showed a significant negative spatial correlation, the other factors showed a strong positive correlation in the vast majority of regions. In 2018, the absolute values of the regression coefficients according to the drivers, in descending order, were TI > RD > CLT > TFP > URI > FT > URF > URC.
Based on the results of the empirical study, this study proposes an operable path to providing institutional support and reference for the sustainable development of urban and rural areas, which is also the ultimate landing point of this study.
(1) Construction of a modern industrial system that integrates urban and rural industries
Industrial development is the fundamental solution to continuously improve the living standards of residents and achieve common prosperity. The core of urban and rural industrial system construction is the integration of urban and rural factors and product markets, especially the formation of a new pattern of urban and rural industries with complementary advantages and mutual support. Firstly, industrial development should enhance the radiation-driven effect of towns on rural industrial development. We should stimulate the transformation and promotion of agricultural science and technology achievements, and accelerate the application of the Internet of Things, big data, and remote sensing in agriculture, so as to enhance the innovative power of agricultural development comprehensively. Second, the integrated development of agriculture, industry and service industries should be promoted. We should comply with the new trend of consumption upgrade of urban and rural residents, and take “Internet +” “Ecology +” “Tourism +” as an opportunity to improve the leisure agriculture, rural tourism, rural e-commerce, health and pension, and other new industries. By extending the industrial chain and enhancing the value chain, the high-quality development of new rural industries can finally be realized.
(2) Accelerate the integration of basic public services and infrastructure between urban and rural areas
At this stage, the key to breaking the dual structure of urban and rural areas and achieving urban-rural integration and balanced development is to establish an integrated process of basic public services and infrastructure in urban and rural areas. (1) Public services including, education, medical care, and social assistance, are related to people’s survival and quality of life. The traditional policy of resource allocation is to emphasize urban areas over rural areas, which also forms a circular structure with the central city as the core and gradually decreasing outward. The more remote the areas are, the more marginalized they become. As a result, rural areas are facing a series of complex problems such as weak foundations and insufficient development momentum. Therefore, the government should promote the extension of public services to rural areas and establish a basic public service system that integrates urban and rural areas. (2) Infrastructure, including roads, water supply, electricity supply, heating, information, etc., is the basic material condition to ensure the convenience of life and modernization of life. The same bias in resource allocation has created a large gap between urban and rural areas, and the more remote and poor the areas are, the worse the condition of public facilities is, which cannot even guarantee people’s survival and quality of life. Therefore, it is important to focus on public infrastructure construction in the countryside, accelerate the upgrading of rural infrastructure, and promote the real integration of urban and rural infrastructure systems.
(3) Establish a comprehensive institutional mechanism and policy system to promote the free flow of urban and rural factors in both directions
The free flow of urban and rural elements in both directions, including people, land, money, and other elements, is the basis for the integrated development of rural revitalization and new urbanization. Firstly for the population factor, not only should we strengthen the willingness and ability of the rural population to enter the city, but also focus on attracting all kinds of talents to return to the rural areas to start businesses and employment, and increase rural vitality. Second, for land elements, the first thing is to strictly protect arable land and intensive use of land. Based on the premise of steadily promoting the reform of the rural land system, we should revitalize the idle land in rural areas and attract capital, technology, talent, and other elements to rural areas with the advantage of resources. Thirdly, in terms of capital elements, a diversified input mechanism for integrated urban-rural development should be constructed. Financial funds should actively play their leading role and strive to attract more social funds. In addition, capital should be tilted toward agriculture, and a reasonable benefit distribution mechanism should be established between farmers and agriculture-related enterprises in order to effectively protect farmers’ rights and interests.


