
Land Use Optimization and Simulation of Low-Carbon-Oriented—A Case Study of Jinhua, China

Abstract
:1. Introduction
- (1)
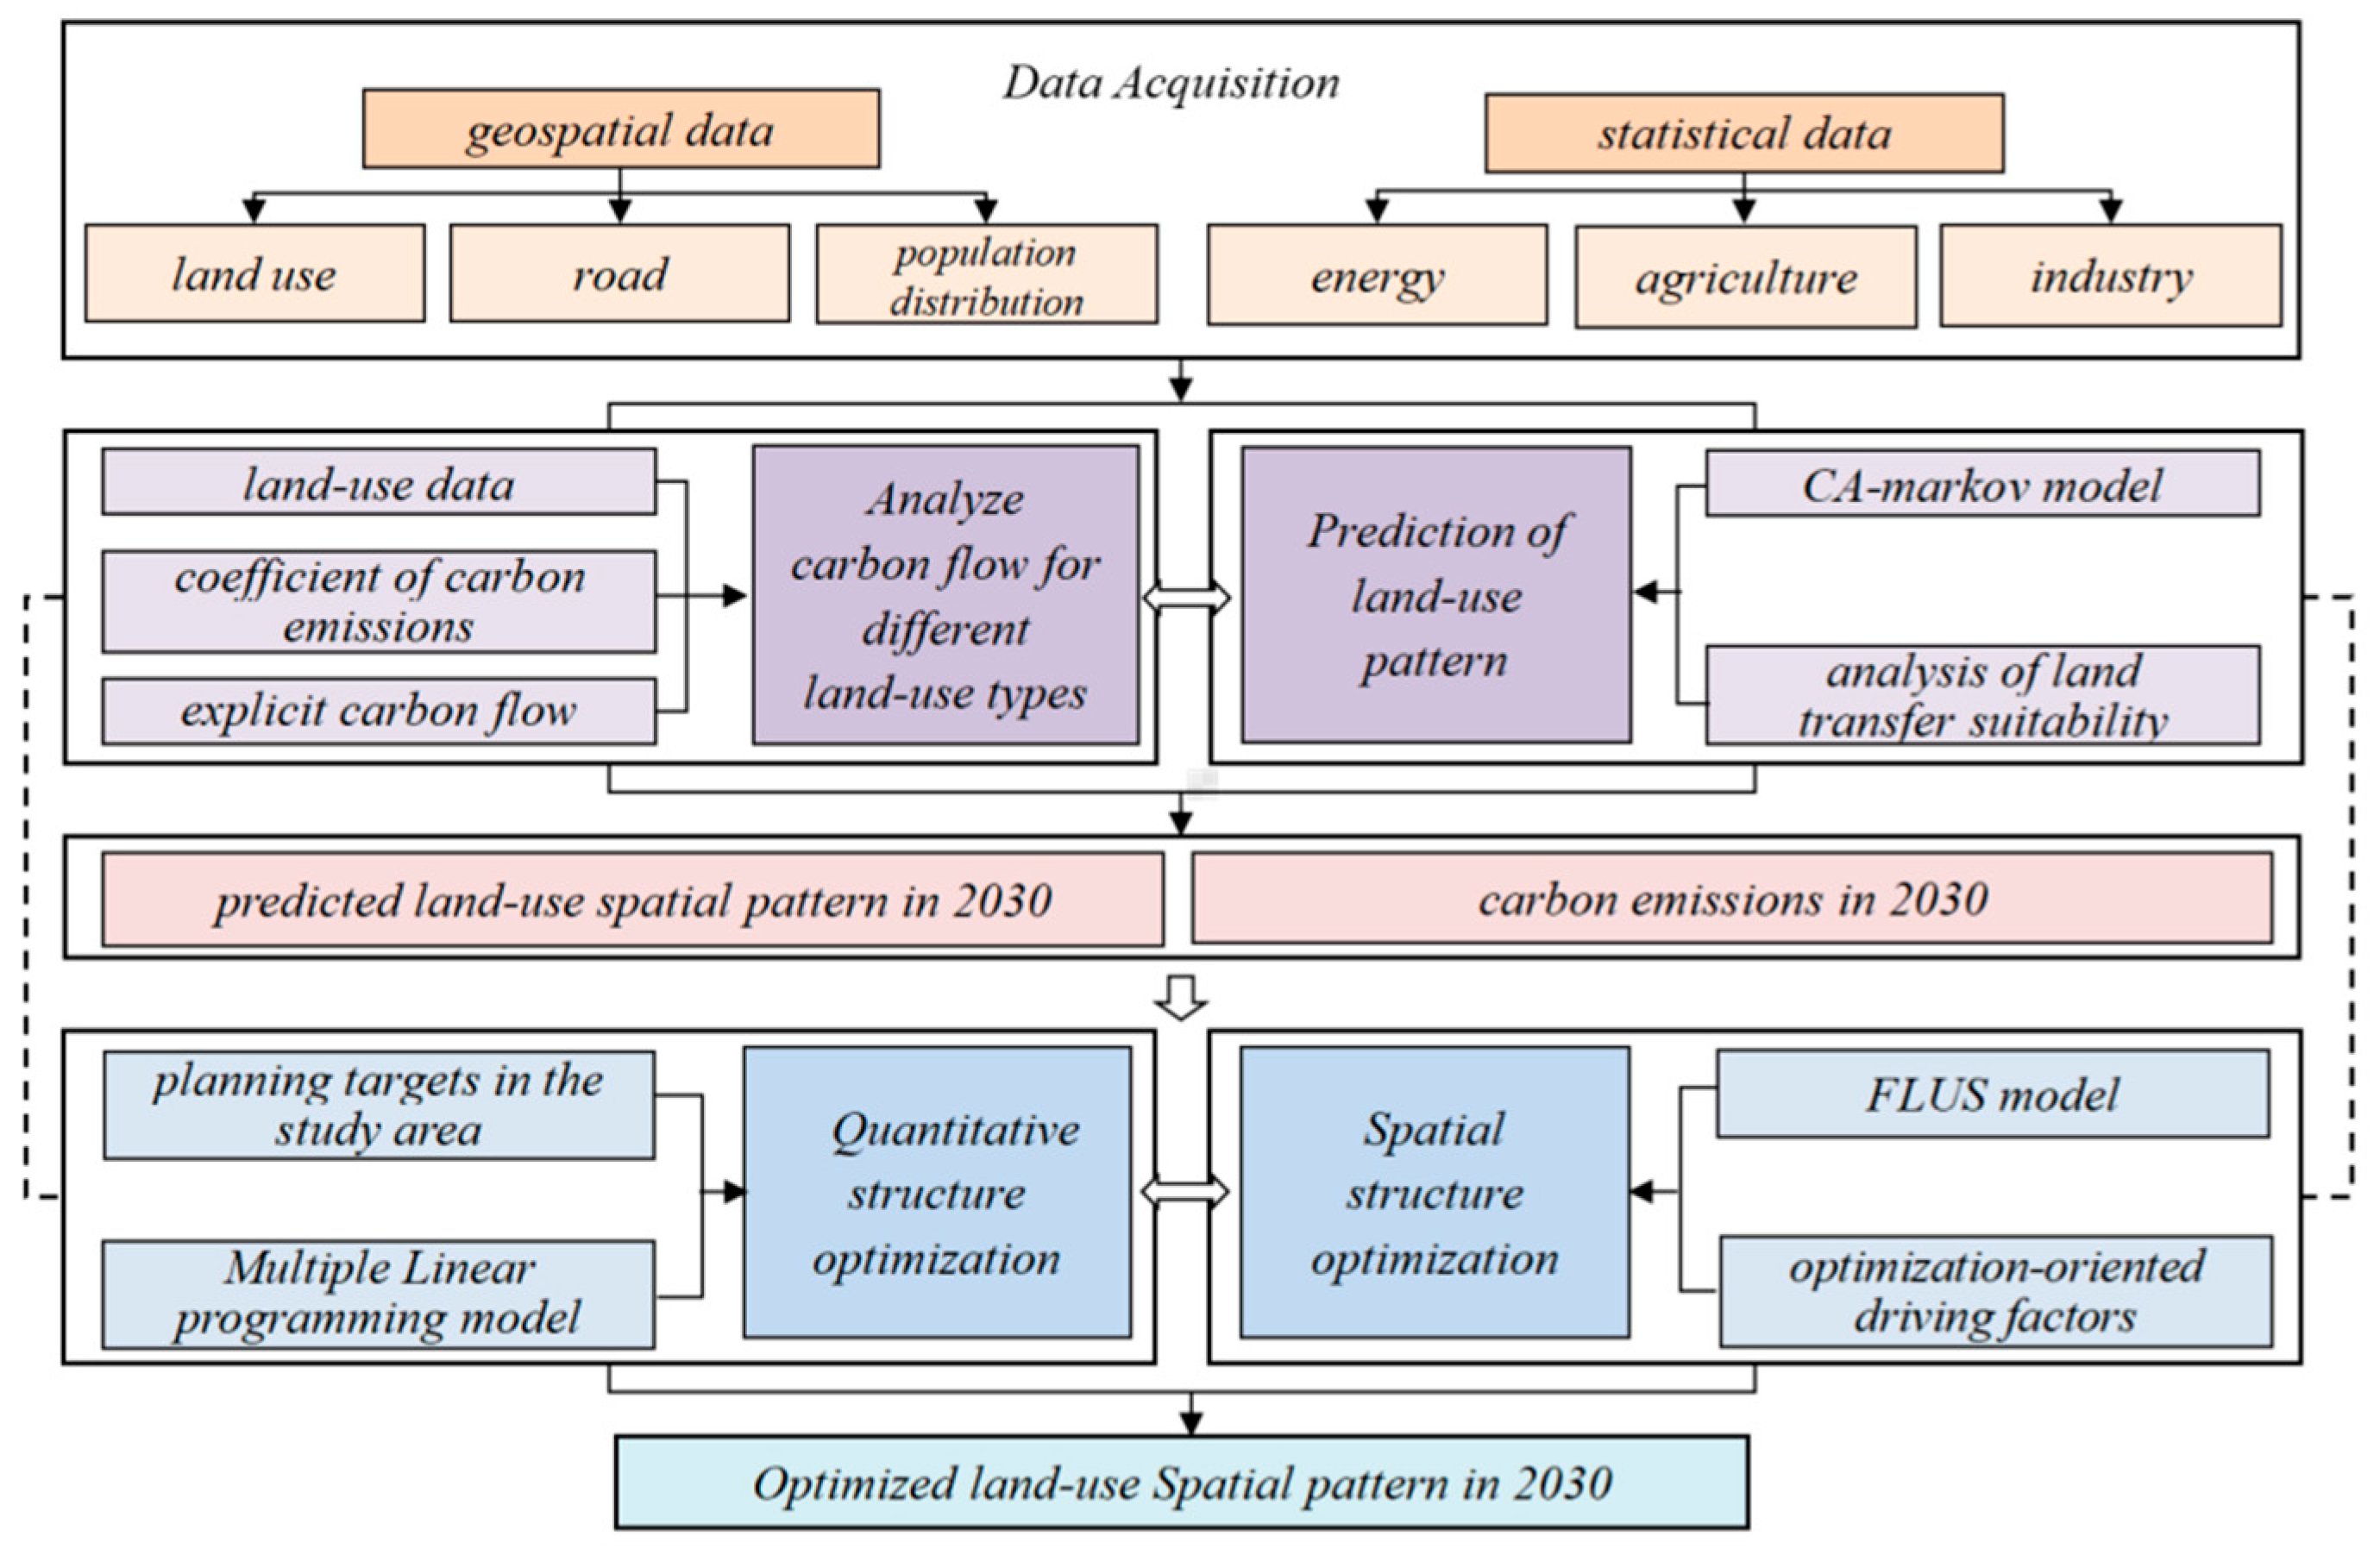
- the carbon emissions produced from land use and the transfer matrix of land use were calculated. Based on this, an explicit carbon flow model was used to calculate carbon transfer between different land-use types. It contributed to revealing the spatio-temporal variation rules of land-use carbon emissions.
- (2)
- we simulated the land-use spatial pattern that will be present in Jinhua under a natural change scenario in 2030 using the CA–Markov model and predicted the carbon emission change characteristics. Based on this, suggestions for carbon emission reduction from the perspective of land-use change can be proposed.
- (3)
- the low-carbon quantitative structure obtained from multiple linear programming models and optimization-oriented driving factors were added to the FLUS model to optimize the land-use spatial pattern in Jinhua in 2030. The simulation results meet both the requirements of urban development and carbon emission reduction, providing a reference for the future green development of land use in Jinhua city.
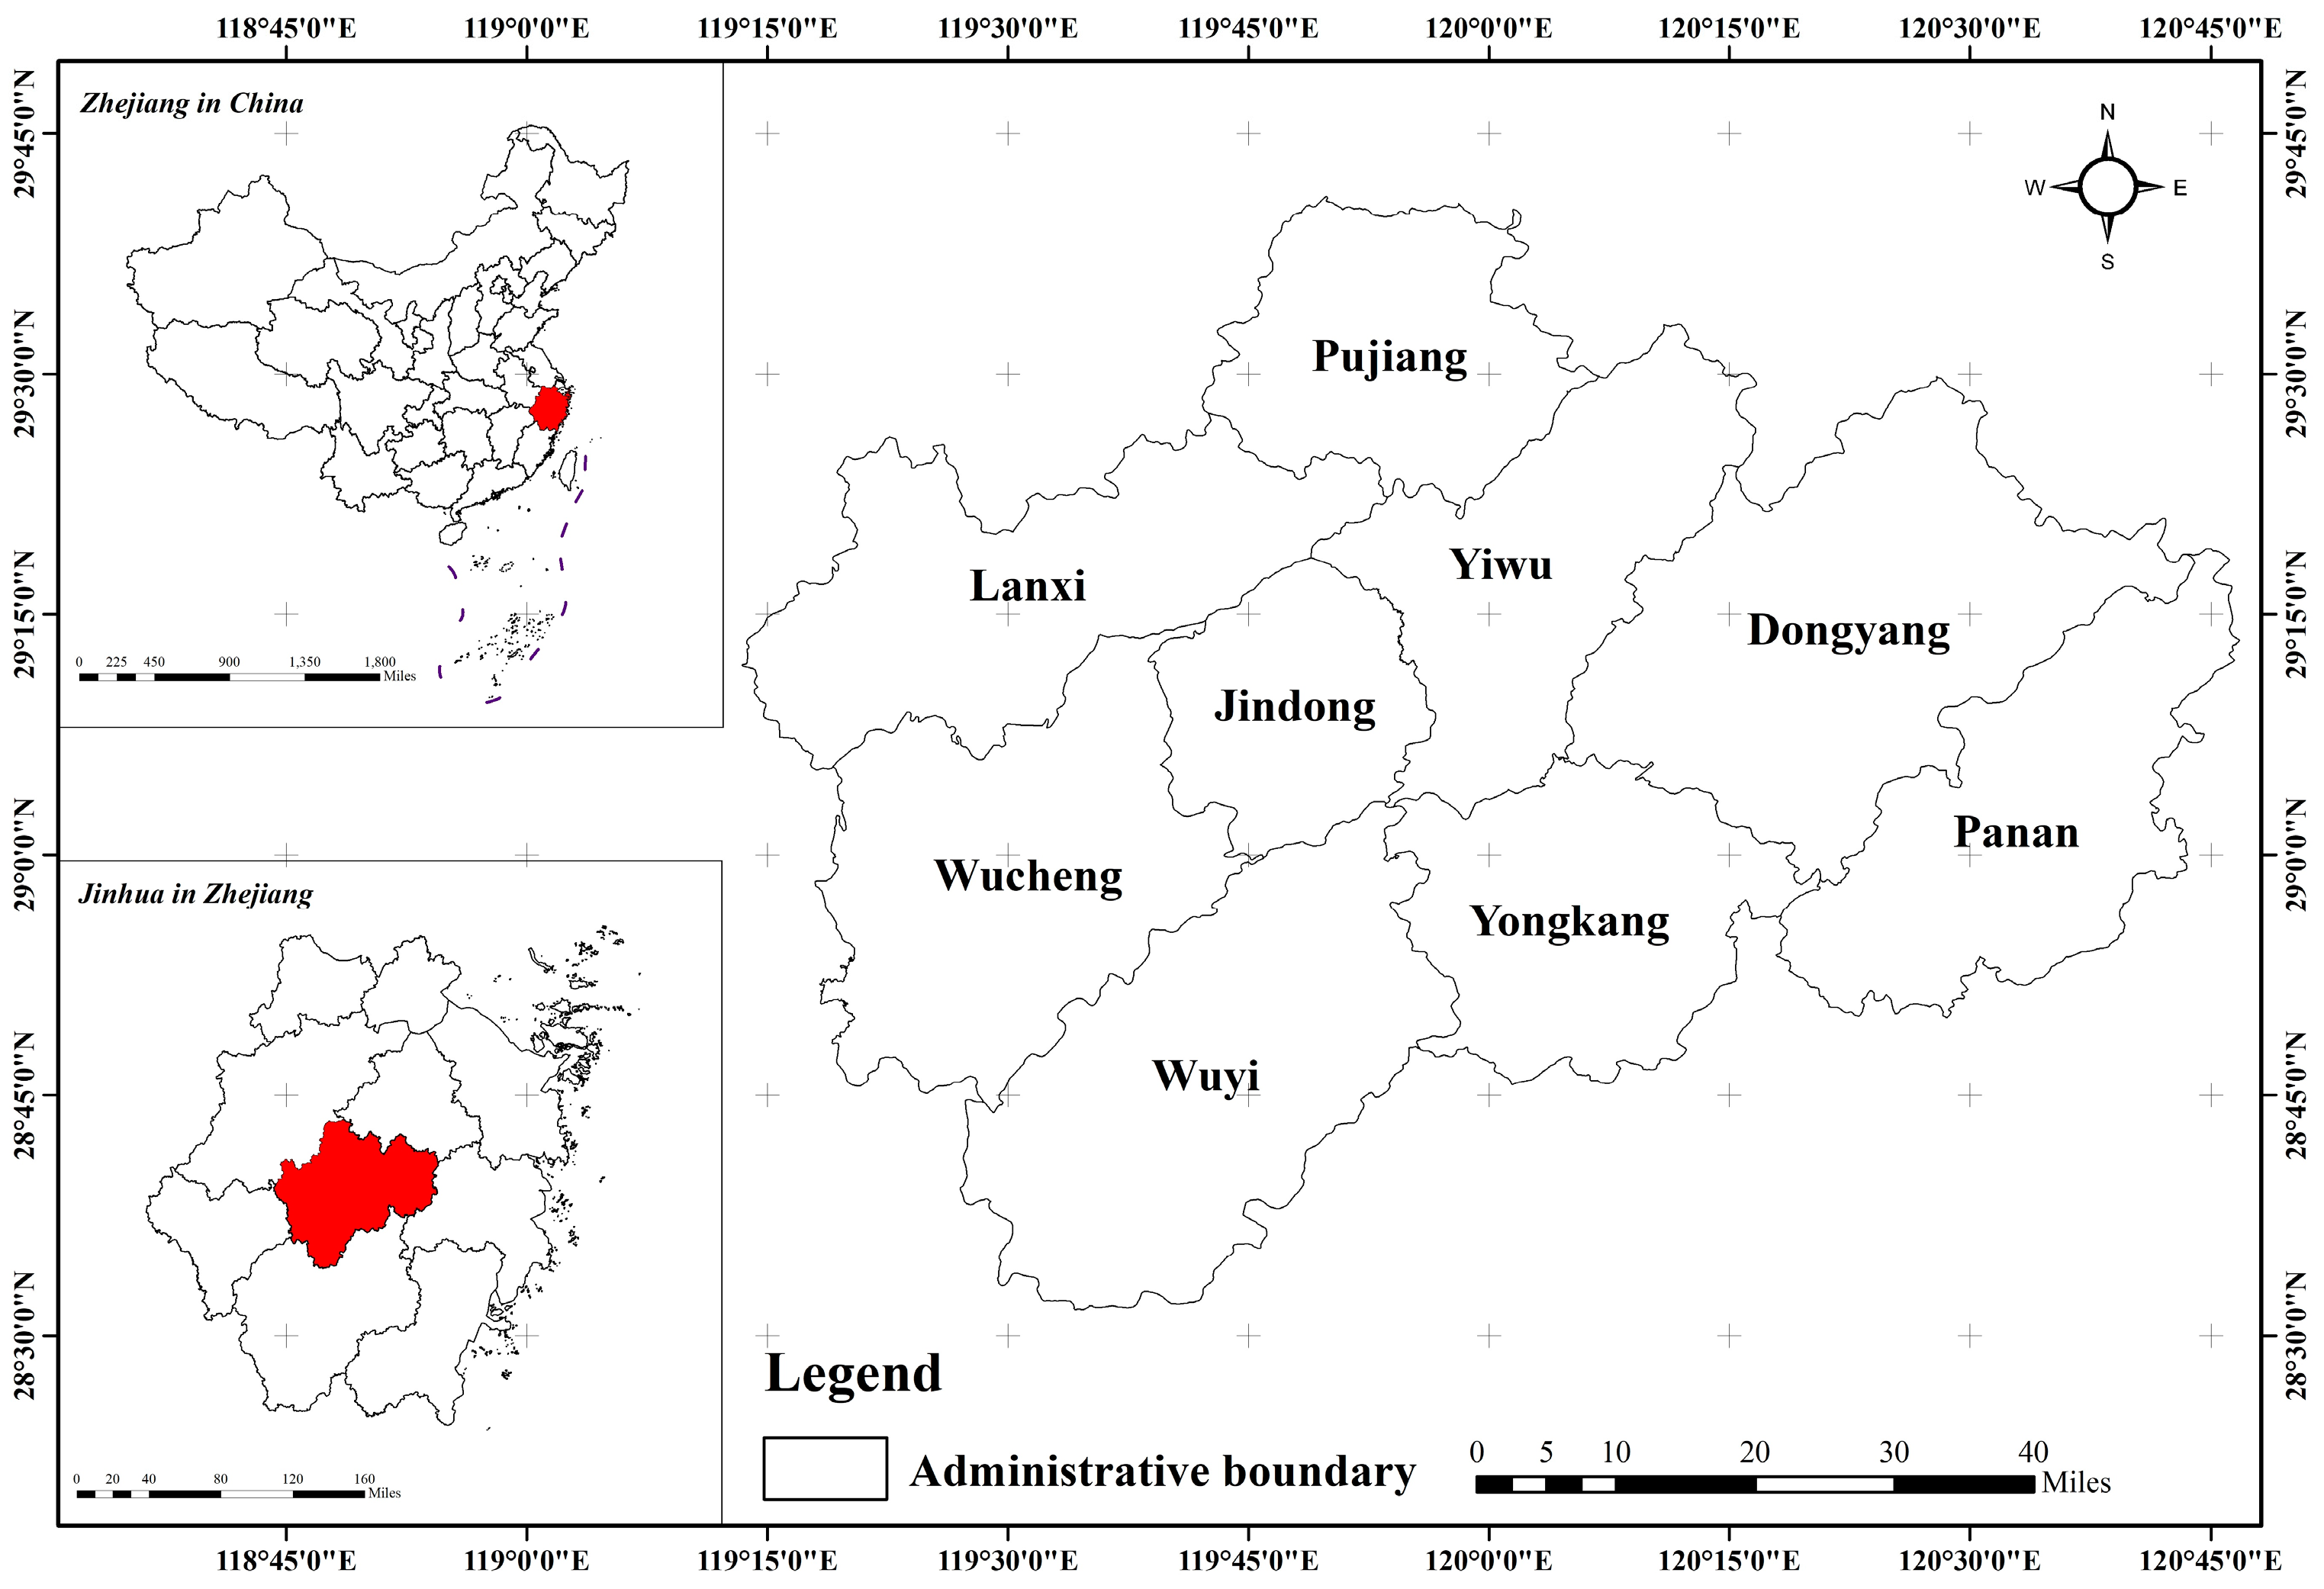
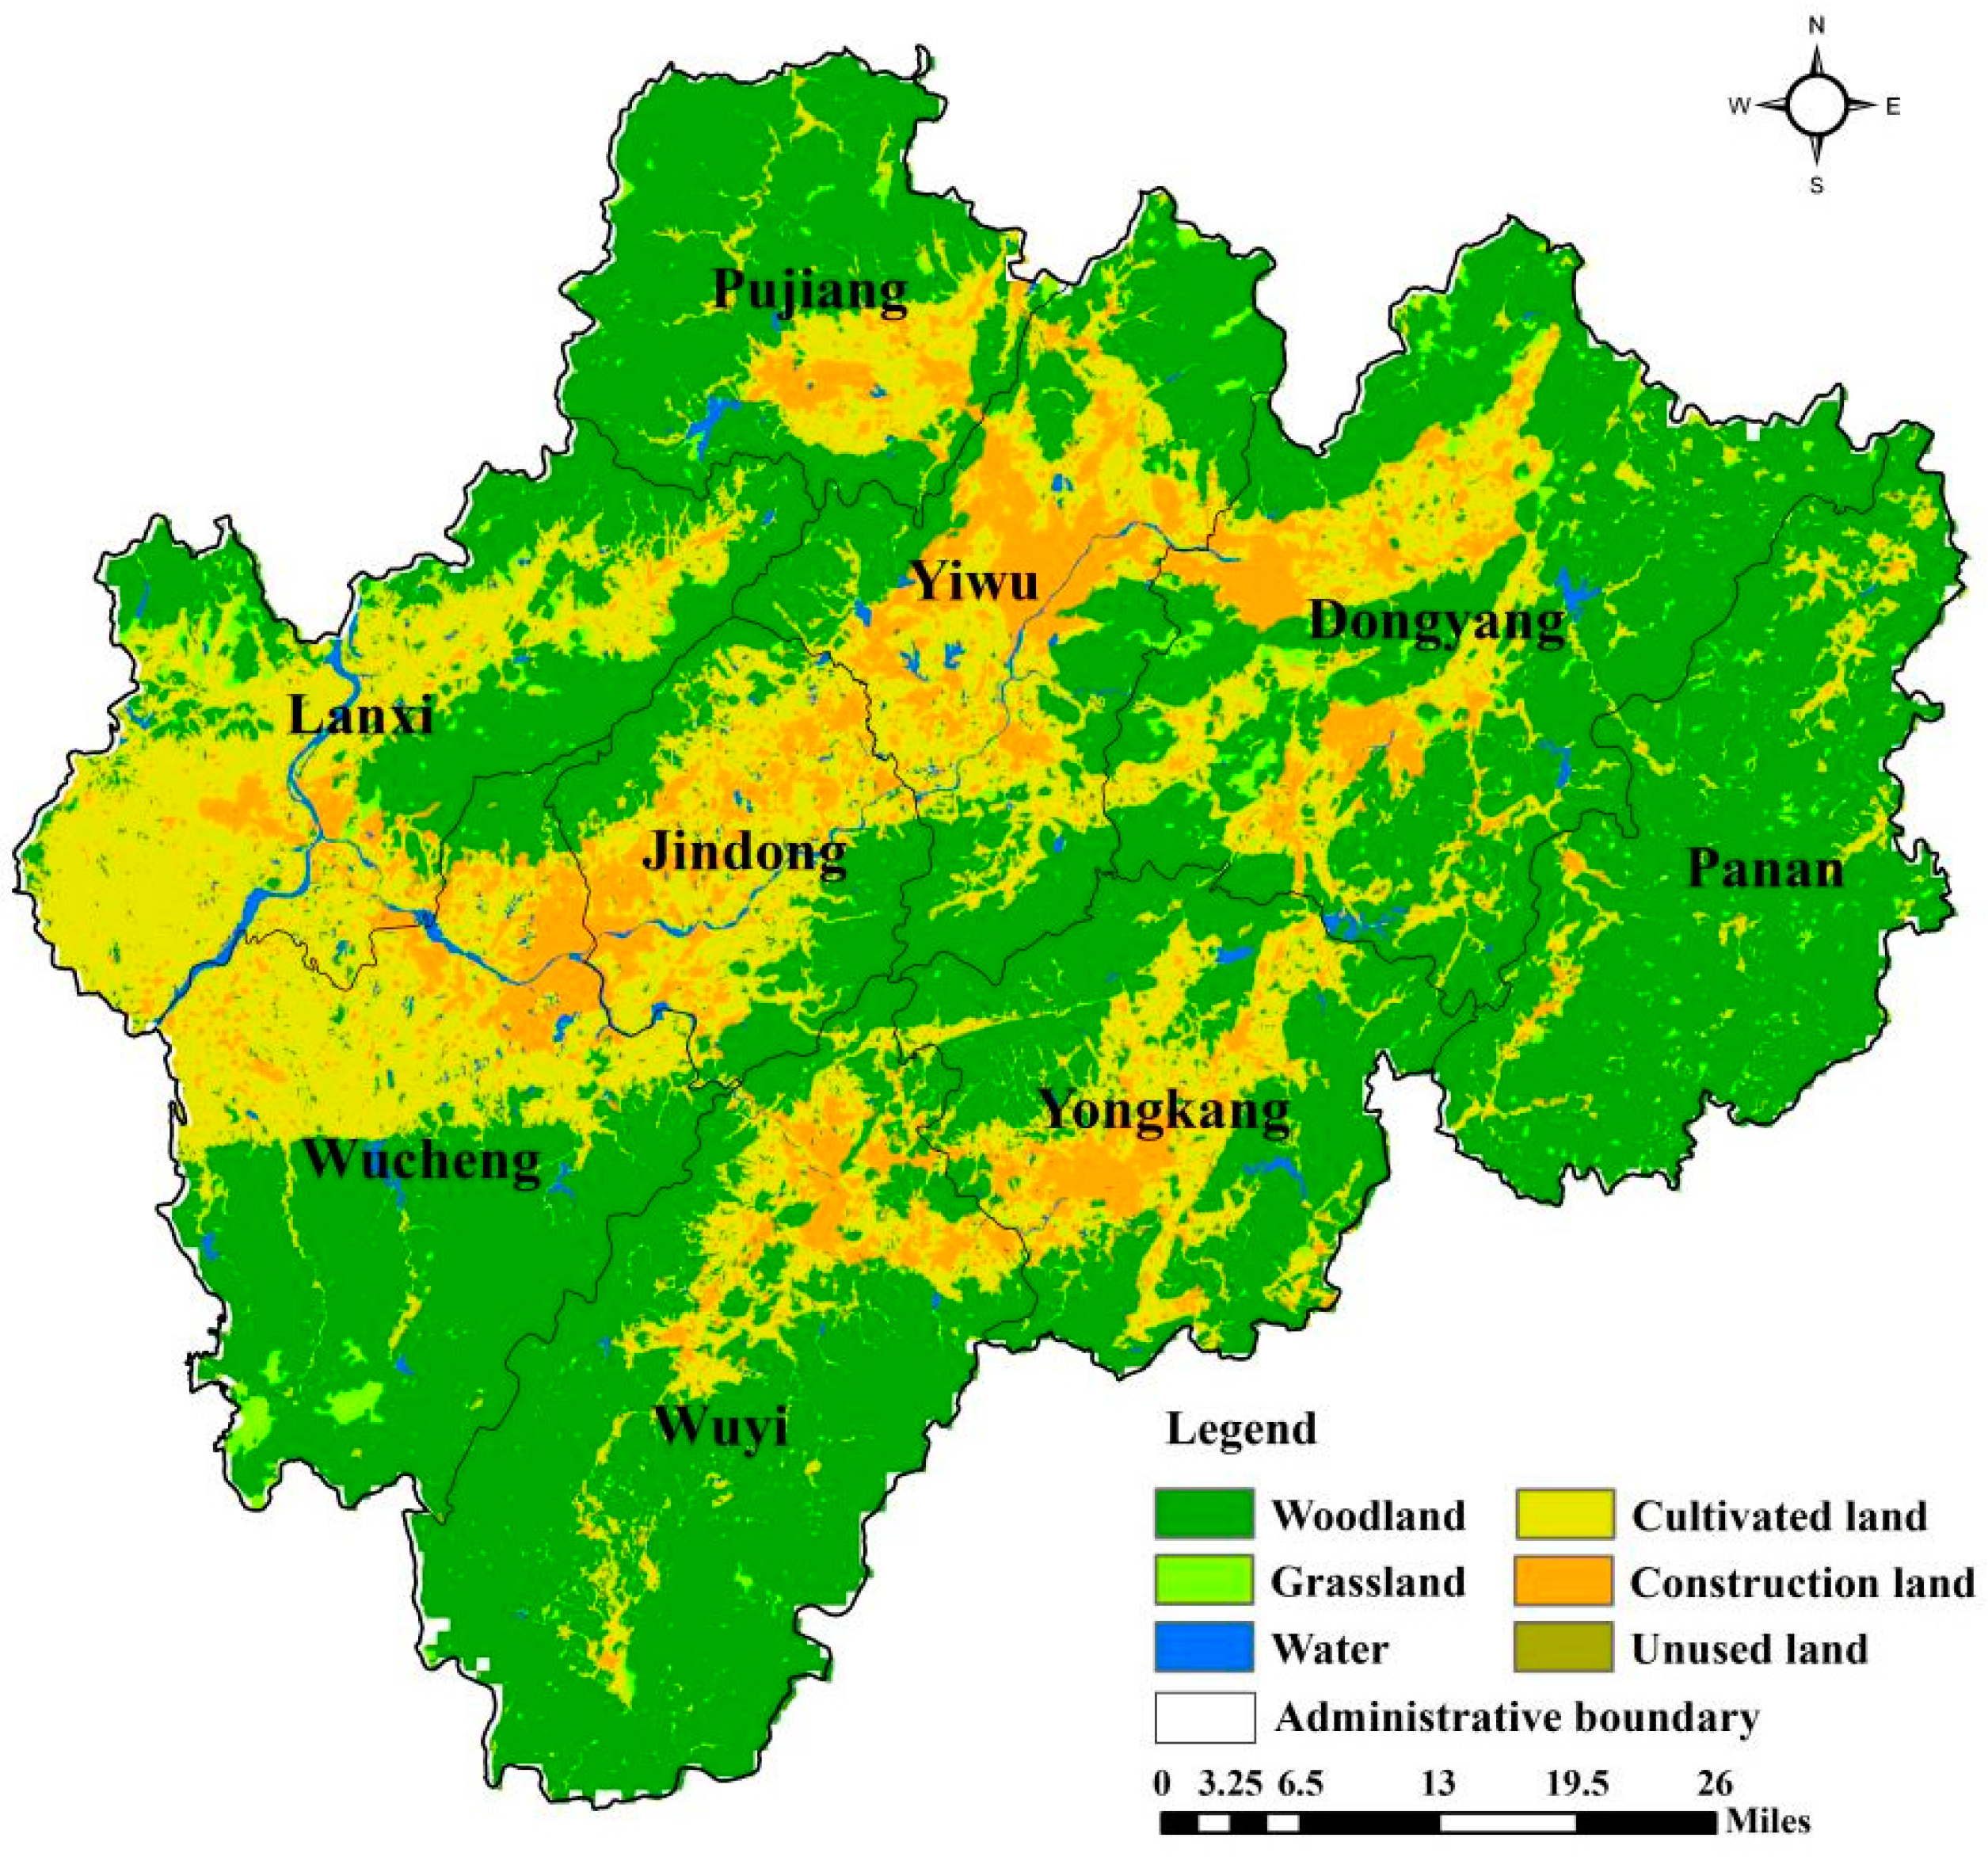
2. Study Area
3. Materials and Method
3.1. Data Acquisition
3.2. Methodology
3.3. Accounting Model Used to Assess “Carbon Flow”
3.3.1. Calculation of Carbon Emissions
3.3.2. Analysis of Carbon Flow for Different Land-Use Types
3.4. CA–Markov Model
3.4.1. Principles of the CA–Markov Model
3.4.2. Prediction Process Used by the CA–Markov Model
- (1)
- First, earlier and later land-use images were input into the Markov module to construct a probability matrix of conversion between different land-use types.
- (2)
- Then, we analyzed the land transfer suitability. This study mainly analyzed the suitability of the spatial distribution of construction land, because the expansion of construction land is fast and is greatly affected by human factors. First, we selected the driving factors. The driving factors include constraints and influencing factors. Constraints are expressed in the form of Boolean maps in which areas to be excluded from consideration have the value 0 and those to be considered have the value 1. Here we set existing construction land, water, and nature reserve as constraints. Water includes lake, river, beach, reservoir, and pit. Nature reserve includes ecosystem type reserves, biological species reserves, and natural heritage reserves. Influencing factors enhance or detract from the suitability of a location for the objective. All influencing factor images must be measured on the same scale. In this study, the scale 0–255 is used where 0 is not at all suitable and 255 is perfectly suitable. Then the weights of the influencing factors are produced follows the logic under the Analytical Hierarchy Process (AHP). That is, we should provide a series of pairwise comparisons of the relative importance of factors to the suitability of pixels for the activity being evaluated. (Table 1). Second, the constraints were transformed into a binary image. That is, areas with a construction land spatial distribution probability of zero were assigned a value of 0. The factors were transformed into standard data in the range of 0–255 using the Fuzzy module, and the fuzzy set membership function was applied to evaluate the effects of factors on suitability. Finally, the MCE module was used to generate a construction land transition suitability image.
- (3)
- Finally, the land-use spatial pattern in 2030 was predicted. We selected default 5 × 5 filters as the neighborhood scale, which is suitable for most simulation processes to ensure accuracy and also avoid running the simulation too far into the future. Then the number of iterations was set to 8. Land-use images from 2000 and 2010 were regarded as earlier and later images, respectively. We input the land-use transfer matrix and Transition suitability image collection so that we obtained a predicted land-use image for 2018. Then, the Crosstab module was applied to compare this with the actual image of land use in 2018 to get a kappa coefficient of 0.9243, indicating that the simulation effect was good. Therefore, the actual land-use image in 2018 could be served as the early image to simulate the land-use image in 2030 using the method above.
3.5. Low-Carbon Optimization Model of Land Use
3.5.1. Multiple Linear Programming Model
- (1)
- With the rapid development of the economy and the acceleration of urbanization in Jinhua, it is inevitable that the areas of cultivated land and woodland will reduce due to the expansion of construction land. So, it is necessary to strengthen the protection of cultivated land resources, strictly maintain the red line of cultivated land, and strictly control the use of cultivated land for non-agricultural construction. The national cultivated land reserves in 2020 and 2030 should not be less than 1.865 billion mu and 1.825 billion mu, respectively. Therefore, the annual rate of decrement in cultivated land should not exceed 0.2%.
- (2)
- Since 2005, the area of woodland in Jinhua was in a state of negative growth. In order to prevent woodland from becoming occupied without limit, the annual rate of decrement in woodland should not be greater than the rate of decrement over the last decade (0.31%), which was set as the lower limit. In addition, the Plan points out that the national forest coverage rate is predicted to increase from 21.66% in 2015 to more than 24% by 2030. To achieve this goal, the annual rate of growth in woodland areas needs to reach 1%. This represents the ideal state of land conversion in Jinhua, so it was set as the upper limit.
- (3)
- The acreage of water, grassland, and unused land have been decreasing to varying degrees over the last 10 years. The Plan points out that it is necessary to strengthen the protection and restoration of water source conservation areas to consolidate the achievements related to the grain for green and the return of farmland to lake strategies. Therefore, the annual rate of deceleration in grassland, water, and unused land areas should not exceed the deceleration rate from the past decade.
- (4)
- In the past decade, the annual GDP growth rate in Jinhua was close to 10%, and the annual population growth rate over the past ten years was 2.78% according to the seventh census. This led to a rapid expansion of construction land. The Outline points out that we will continue to promote economic construction. Thus, the area of construction land will inevitably continue to increase in the future. At the same time, intensive and economic use of land should be strengthened. The Plan points out that the land-use intensity in 2030 should be restricted to 4.62% based on a level of 4.02% in 2015. Thus, the growth rate of the construction land area should be capped at 0.93% with consideration of the socio-economic situation present in Jinhua.
3.5.2. Low-Carbon Space Optimization
4. Results
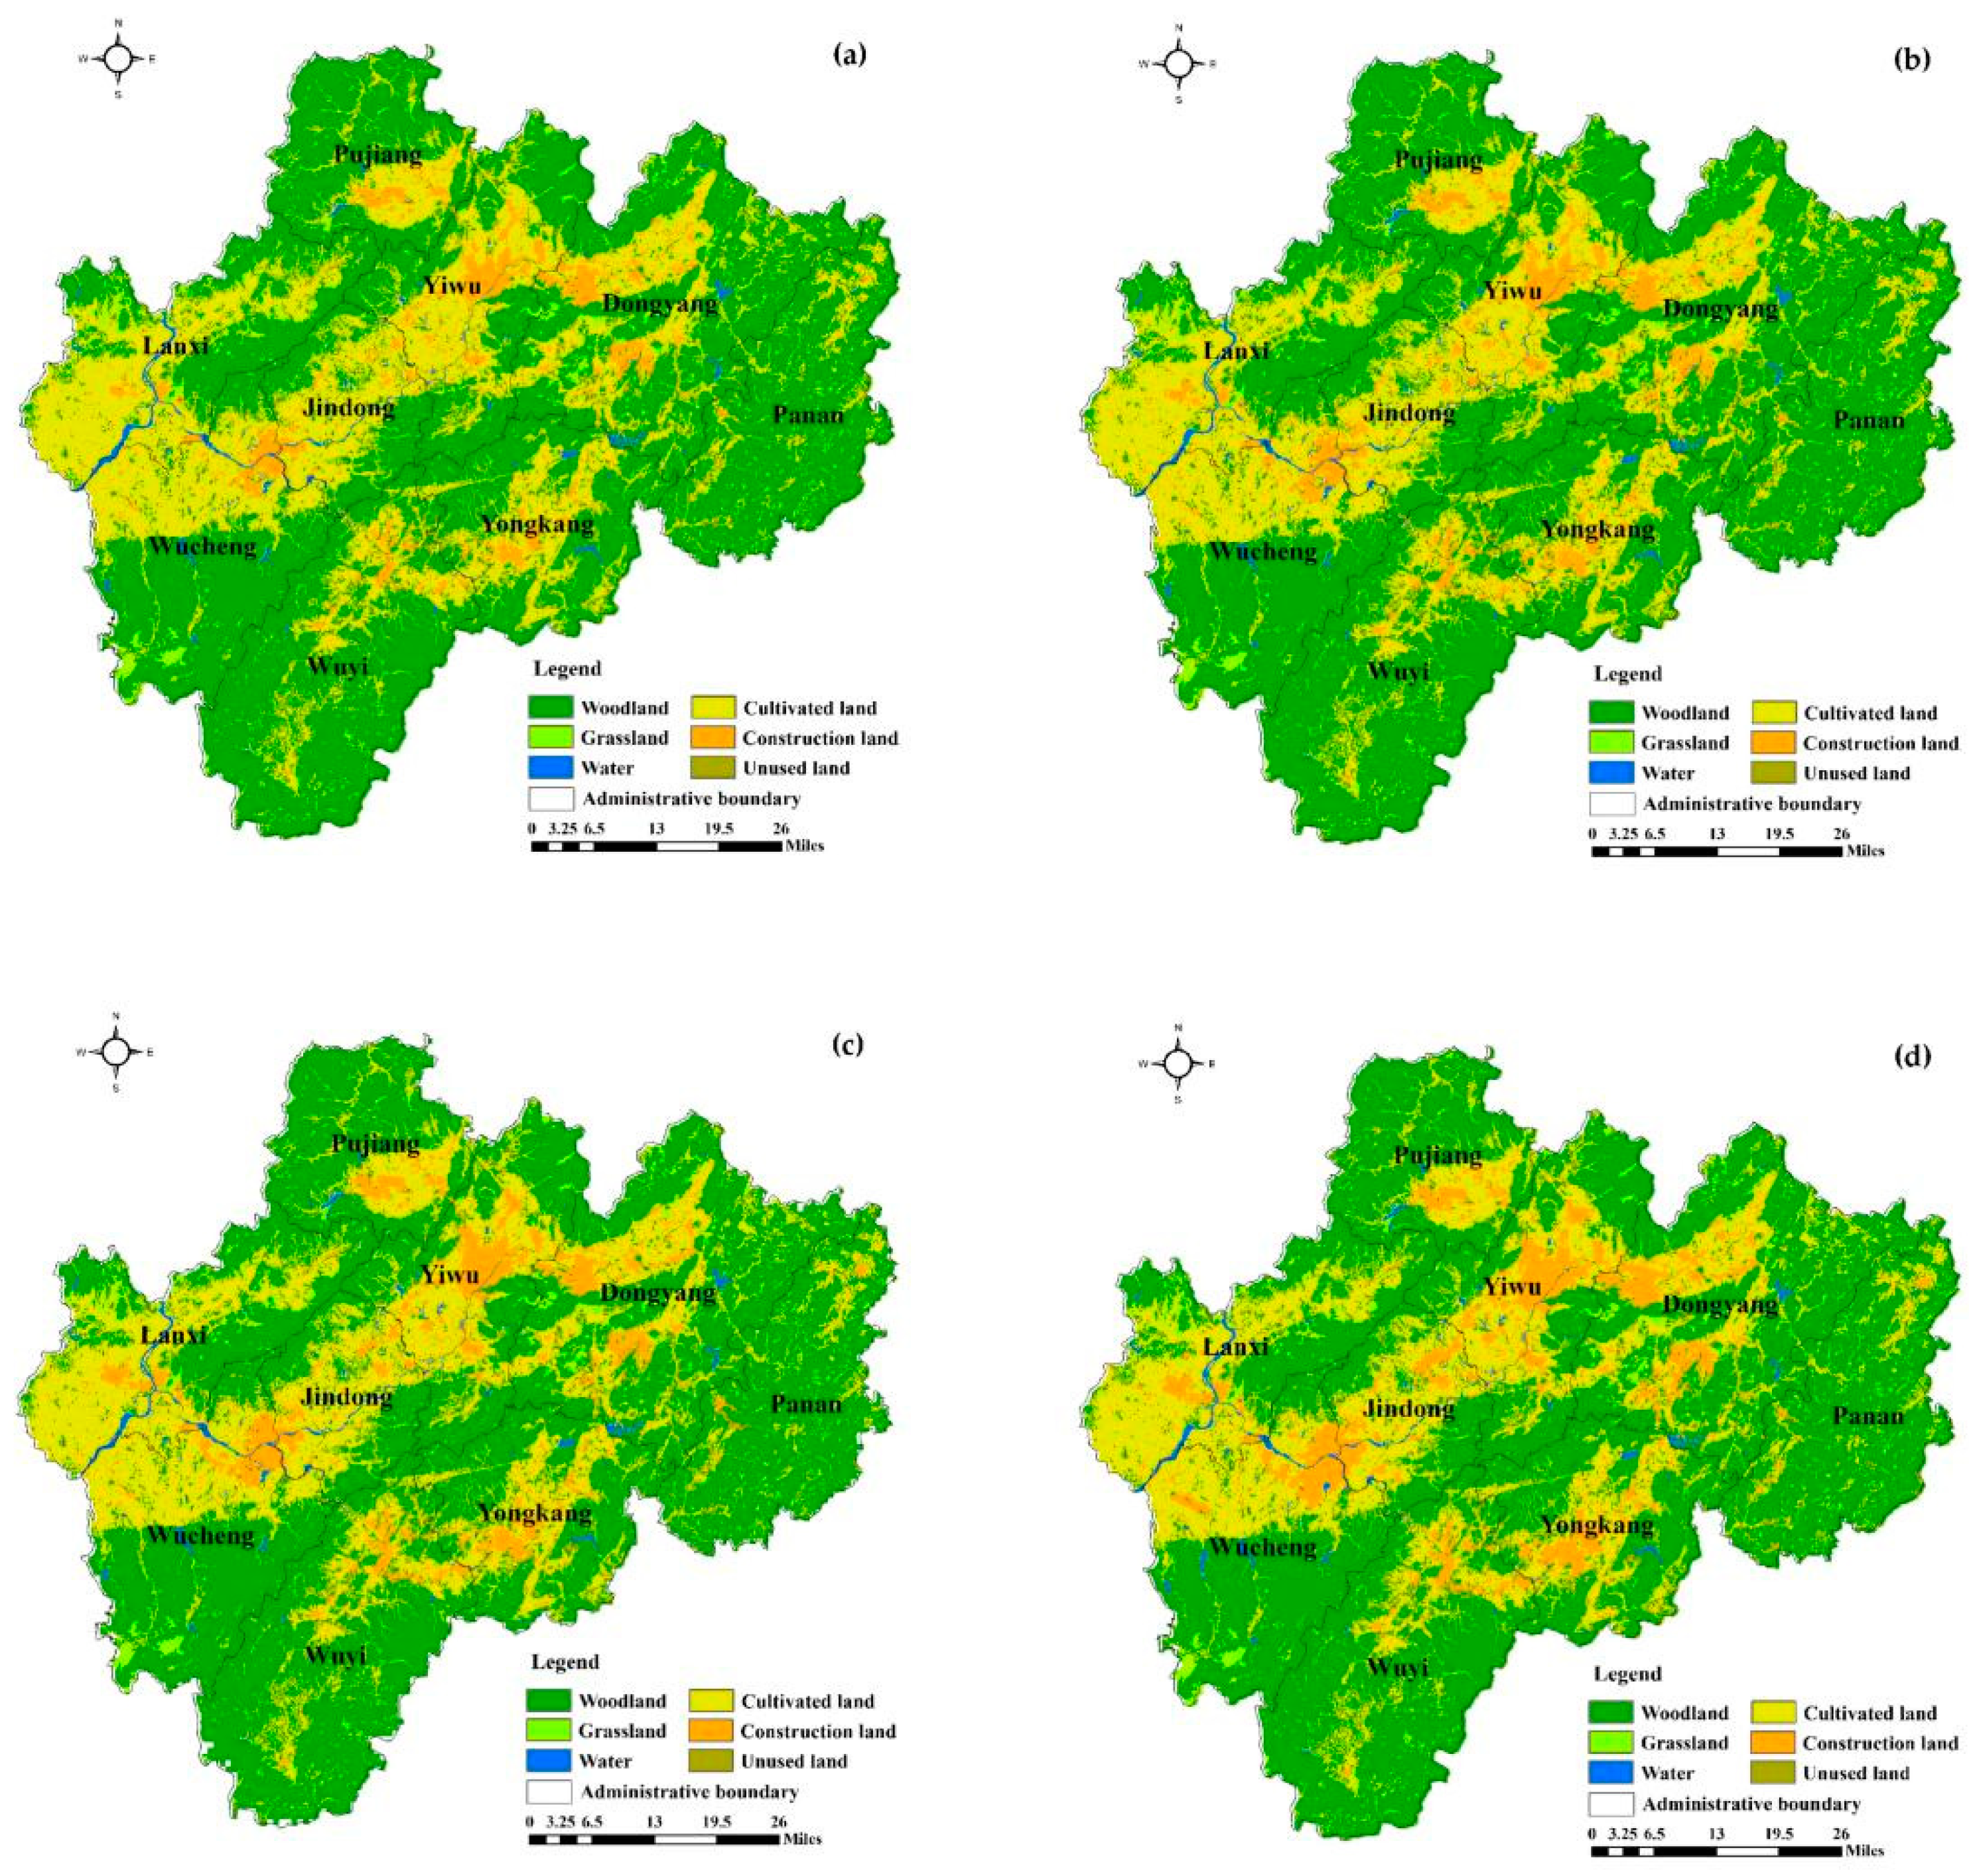
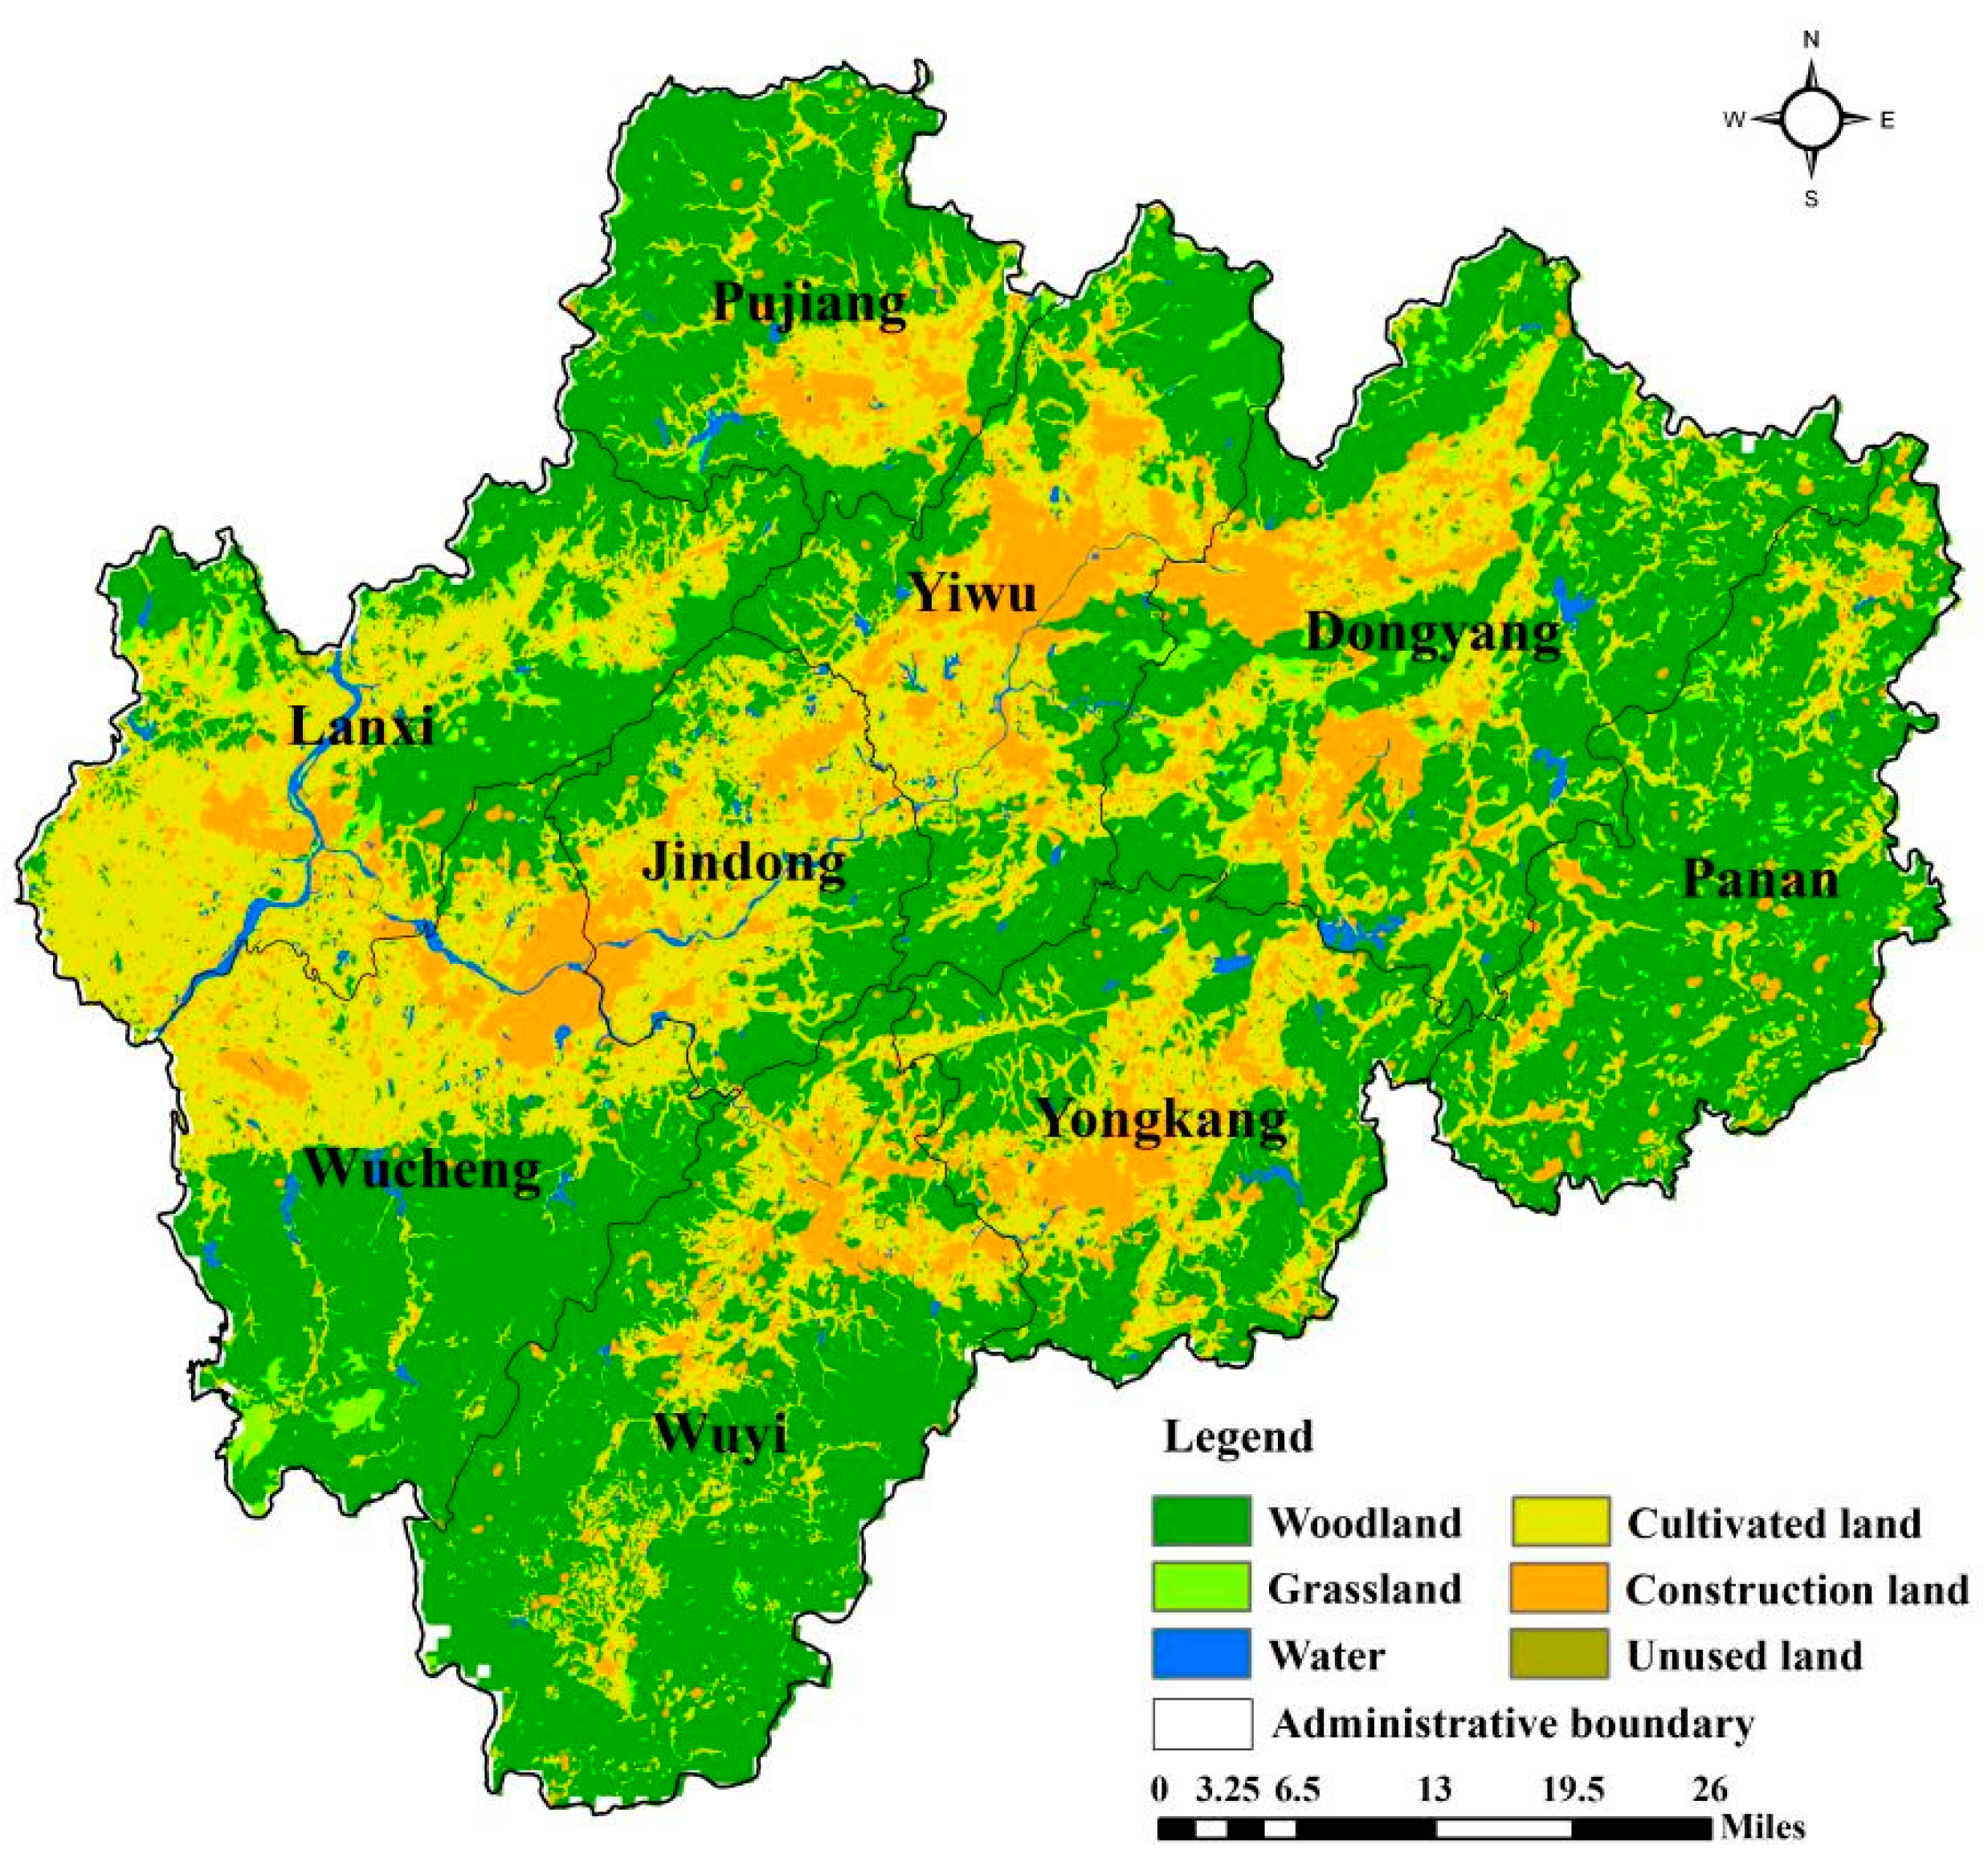
4.1. Spatio-Temporal Patterns of Land Use in Jinhua
4.2. “Carbon Flow” of Land-Use in Jinhua
4.3. Prediction of the Land-Use Spatial Pattern
4.4. Optimization of the Land-Use Spatial Pattern
5. Discussion
6. Conclusions
- (1)
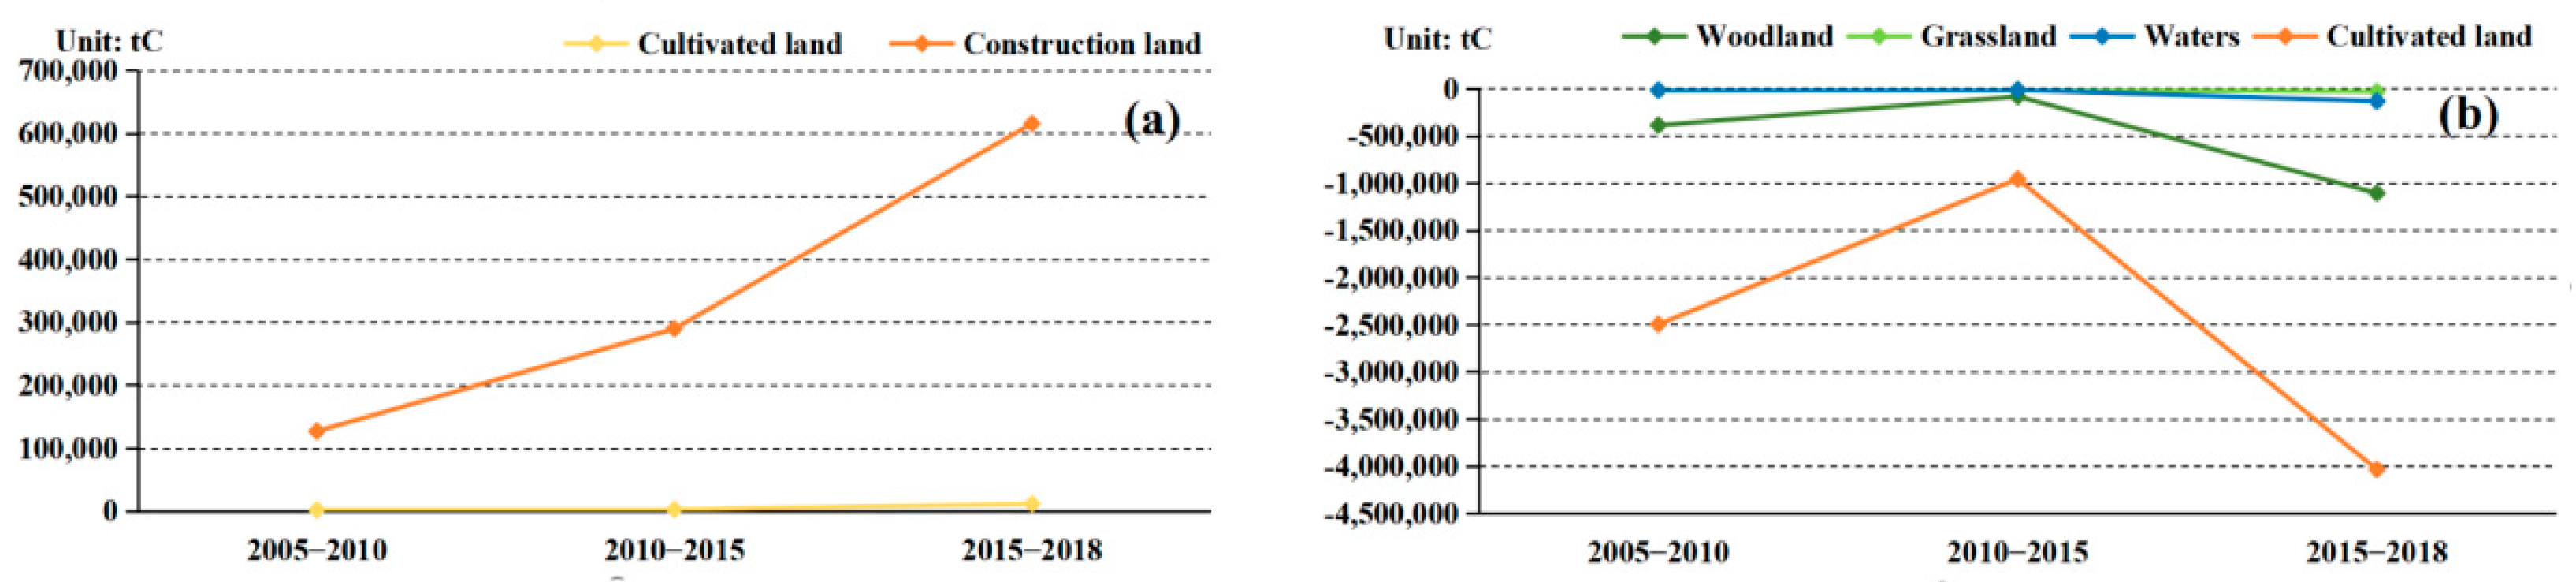
- From 2005 to 2018, the land-use structure of Jinhua changed significantly. On the whole, the acreage of construction land continued to grow. The acreage of woodland and cultivated land areas continued to decrease. The acreage of grassland and water areas first increased and then decreased. Most of the woodland was converted to cultivated land, and most of the cultivated land was converted to construction land. More than 80% of the construction land was formed through transfer from cultivated land. In the process of land-use change, in 2018, the total carbon emissions were 1.9 times greater than in 2005. There was a trend for positive carbon flow to increase, but negative carbon flow was always far greater than positive carbon flow, that is, the carbon metabolism of land use was far from balanced.
- (2)
- During the period from 2010 to 2015, carbon emissions in Jinhua showed negative growth. At this stage, the rate of decrement in woodland and the rate of growth in construction land were the smallest among the three periods. Accordingly, positive carbon flow reached its highest value and negative carbon flow reached its lowest value, indicating that changes in carbon flow due to land-use changes are closely related to the intensity of the evolution of the land-use pattern. In addition, thanks to the adjustment of the energy consumption structure and the treatment of fertilizer and pesticide pollutants in Jinhua after 2010, the average carbon emission intensity of construction land and cultivated land reduced, making the total carbon emissions of this stage somewhat lower than in the previous period.
- (3)
- The land-use prediction results show that on the basis of the law of original land-use evolution in Jinhua, by 2030, the acreage of construction land will have increased by 25,719 ha and the woodland area will have reduced by 53,586 ha. Carbon emissions are expected to increase by 30% compared to 2018. In the low-carbon optimization scenario of land use, the expansion of construction land in 2030 will be restricted, while the area of woodland will increase. Total carbon emissions will be reduced by 19% compared with the predicted results. In terms of the spatial pattern, the additional construction land present in the optimized land-use pattern will be concentrated around the main axis of the Jinhua-Yiwu metropolitan area, consistent with the strategy of focusing on developing the Jinhua-Yiwu metropolitan area. It is helpful to promote land agglomeration development and the efficient allocation of resources. Therefore, this study proposed a macroscopic spatial land-use pattern that contributes to carbon emission reduction with the consideration of regional planning objectives and economic development.
Author Contributions
Funding
Institutional Review Board Statement
Informed Consent Statement
Data Availability Statement
Conflicts of Interest
References
- International Energy Agency. Global Energy & CO2 Status Report: The Latest Trends in Energy and Emissions in 2018; International Energy Agency: Paris, France, 2019. [Google Scholar]
- Political Bureau of the Central Committee of the CPC. The 14th Five-Year Planfor National Economic and Social Development and the Long-Range Objectives through the Year 2035. In Proceedings of the 19th CPC Central Committee, Beijing, China, 26 October 2020. [Google Scholar]
- Lai, L.; Huang, X.J. Carbon Emission Effect of Land Use in China, 1st ed.; Nanjing University Press: Nanjing, China, 2010; pp. 3–65. [Google Scholar]
- Stuiver, M. Atmospheric carbon dioxide and carbon reservoir change. Science 1978, 199, 253–258. [Google Scholar] [CrossRef]
- Feddema, J.J.; Oleson, K.; Bonan, G. How important is land cover change for simulating future climates. Science 2005, 310, 1674–1678. [Google Scholar] [CrossRef] [PubMed] [Green Version]
- Houghton, A.; House, J.I.; Pongratz, J. Carbon emissions from land use and land-cover change. Biogeosciences 2012, 9, 5125–5142. [Google Scholar] [CrossRef] [Green Version]
- Liu, J.Y.; Shao, Q.Q.; Yan, X.D. An overview of the progress and research framework on the effects of land use change upon global climate. Adv. Earth Sci. 2011, 26, 1015–1022. [Google Scholar]
- Zhu, E.Y.; Deng, J.S.; Zhou, M.M. Carbon emissions induced by land-use and land-cover change from 1970 to 2010 in Zhejiang, China. Sci. Total Environ. 2018, 646, 930–939. [Google Scholar] [CrossRef]
- Yang, J.; Xie, B.P.; Zhang, D.G. Spatio-temporal evolution of carbon stocks in the Yellow River Basin based on InVEST and CA-Markov models. Chin. J. Eco-Agric 2011, 29, 1018–1029. [Google Scholar]
- Li, Y.; Huang, X.J.; Zhen, F. Effects of land use patterns on carbon emission in Jiangsu Province. Trans. CSAE 2008, 24 (Suppl. 2), 102–107. [Google Scholar]
- Zhao, X.C.; Zhu, X.; Zhou, Y.Y. Effects of land uses on carbon emissions and their spatial-temporal patterns in Hunan Province. Acta Sci. Circumstantiae 2013, 333, 941–949. [Google Scholar]
- Sun, H.; Liang, H.M.; Chang, X.L. Land Use Patterns on Carbon Emission and Spatial Association in China. Econ. Geogr. 2015, 35, 155–162. [Google Scholar]
- Zhejiang Provincial Statistics Bureau. Statistical Bulletin of the 7th Population Census of Zhejiang Province; Zhejiang Provincial Statistics Bureau: Zhejiang, China, 2021.
- Jinhua Municipal Statistics Bureau. Statistical Yearbook of Jinhua in 2020; Jinhua Municipal Statistics Bureau: Jinhua, China, 2021.
- Liu, J.Y.; Liu, M.L.; Deng, X.Z. The land use and land cover change database and its relative studies in China. J. Geogr. Sci. 2002, 12, 275–282. [Google Scholar]
- Li, K.R. Land Use Change, Net Greenhouse Gas Emissions and Terrestrial Ecosystem Carbon Cycle, 1st ed.; Meteorological Publishing House: Beijing, China, 2000; p. 260. [Google Scholar]
- West, T.O.; Marland, G.A. Synthesis of Carbon Sequestration, Carbon Emissions, and NetCarbon Flux in Agriculture: Comparing Tillage Practices in the United States. Agr. Ecosyst. Environ. 2002, 91, 217–232. [Google Scholar] [CrossRef]
- Piao, S.L.; Fang, J.Y.; Zhu, B. Forest biomass carbon stocks in China over the past 2 decades: Estimation based on integrated inventory and satellite data. J. Geophys. Res. 1984, 110. [Google Scholar] [CrossRef] [Green Version]
- Fang, J.Y.; Guo, Z.D.; Piao, S.L. Estimation of terrestrial vegetation carbon sequestration in China from 1981 to 2000. Sci. China Earth Sci. 2007, 6, 804–812. [Google Scholar]
- Duan, X.N.; Wang, X.K.; Lu, F. State Lab of Urban and Regional Ecology, Research Center for Eco-Environmental Sciences. Acta Ecol. Sin. 2008, 2, 463–469. [Google Scholar]
- Xu, G.Q.; Liu, Z.Y.; Jiang, Z.H. Decomposition Model and Empirical Study of Carbon Emissions for China, 1995–2004. Chin. J. Popul. Resour. Environ. 2006, 16, 158–161. [Google Scholar]
- Xia, C.Y.; Li, Y.; Ye, Y.M. Analyzing urban carbon metabolism based on ecological network utility: A case study of Hangzhou City. Acta Ecol. Sin. 2018, 38, 73–85. [Google Scholar]
- Yang, G.Q.; Liu, Y.L.; Wu, Z.F. Analysis and Simulation of Land-Use Temporal and Spatial Pattern Based on CA-Markov Model. Geomat. Inf. Sci. Wuhan Univ. 2007, 5, 414–418. [Google Scholar]
- Cao, S.; Jin, X.B.; Yang, X.H. Coupled MOP and GeoSOS-FLUS models research on optimization of land use structure and layout in Jintan district. J. Nat. Resour. 2019, 34, 1171–1185. [Google Scholar]
- Liu, X.P.; Xun, L.; Xia, L.A. Future land use simulation model (FLUS) for simulating multiple land use scenarios by coupling human and natural effects. Landsc. Urban. Plan. 2017, 168, 94–116. [Google Scholar] [CrossRef]
- Shi, H.X.; Mu, X.M.; Zhang, Y.L. Effects of Different Land Use Patterns on Carbon Emission in Guangyuan City of Sichuan Province. Bull. Soil Water Conserv. 2012, 32, 102–106. [Google Scholar]
- Su, Y.L.; Zhang, Y.F. Study on Effects of Carbon Emission by Land Use Patterns of Shaanxi Province. J. Soil Water Conserv. 2011, 25, 152–156. [Google Scholar]
- Li, P.; Li, J.T.; Liang, Y.H. Analysis of Land Use/Cover Change and Carbon Effect in Hebi in Recent 30 Years. Ecol. Econ. 2019, 35, 121–128. [Google Scholar]
- Jing, Y.; Zuo, L.L.; Peng, W.F. Spatial-temporal Change Analysis of Carbon Emission from Land Use in Mianyang the Case Study of Mianyang. Abbreviated J. Name 2021, 44, 172–185. [Google Scholar]


| Constraints | Influencing Factors | Weights |
|---|---|---|
| Existing construction land | Population | 0.1672 |
| Water | GDP | 0.1839 |
| Nature reserve | DEM | 0.0712 |
| slope | 0.0661 | |
| Distance to construction land | 0.0831 | |
| Distance to roadway | 0.1387 | |
| Distance to the motorway | 0.1500 | |
| Distance to railway | 0.1397 |
| Optimization-Oriented Driving Factors | Description |
|---|---|
| Jinhua-Yiwu Expressway | To improve the probability of land around the main axis of the Jinhua-Yiwu metropolitan area converting to construction land |
| Hilly area in the central basin | To reduce the probability of the green ecological zone in the central basin area |
| Land-Use Types | CuL | WL | GL | W | CoL | UL |
|---|---|---|---|---|---|---|
| CuL | 3096.3 | 14.9 | 1.0 | 7.0 | 92.8 | 0.0 |
| WL | 20.2 | 6575.5 | 4.8 | 0.6 | 14.3 | 0.1 |
| GL | 0.3 | 1.0 | 212.8 | 0.2 | 0.8 | 0.0 |
| W | 1.7 | 0.3 | 0.0 | 144.1 | 0.6 | 0.0 |
| CoL | 3.2 | 0.8 | 0.0 | 0.2 | 583.3 | 0.0 |
| UL | 0.0 | 0.0 | 0.3 | 0.0 | 0.1 | 3.7 |
| Land-Use Types | CuL | WL | GL | W | CoL | UL |
|---|---|---|---|---|---|---|
| CuL | 3003.6 | 26.5 | 0.9 | 2.2 | 88.3 | 0.0 |
| WL | 23.3 | 6559.3 | 1.7 | 0.7 | 7.5 | 0.1 |
| GL | 0.9 | 2.2 | 215.0 | 0.0 | 0.8 | 0.0 |
| W | 2.4 | 0.9 | 0.0 | 147.5 | 1.2 | 0.0 |
| CoL | 8.9 | 1.5 | 0.1 | 0.3 | 681.2 | 0.0 |
| UL | 0.0 | 0.1 | 0.0 | 0.0 | 0.0 | 3.7 |
| Land-Use Types | CuL | WL | GL | W | CoL | UL |
|---|---|---|---|---|---|---|
| CuL | 2742.5 | 128.4 | 4.4 | 9.2 | 44.6 | 0.0 |
| WL | 124.3 | 6398.1 | 13.7 | 5.1 | 8.8 | 0.4 |
| GL | 4.0 | 16.7 | 198.1 | 0.2 | 0.6 | 0.0 |
| W | 14.0 | 5.0 | 0.2 | 131.1 | 2.5 | 0.0 |
| CoL | 154.3 | 41.9 | 1.2 | 5.1 | 722.5 | 0.2 |
| UL | 0.0 | 0.5 | 0.0 | 0.0 | 0.0 | 3.1 |
| Land-Use Types | 2005–2010 | 2010–2015 | 2015–2018 | |||
|---|---|---|---|---|---|---|
| Variable-Area ( ) | Rate (%) | Variable-Area ( ) | Rate (%) | Variable-Area ( ) | Rate (%) | |
| CuL | −90.4 | −2.8 | −82.8 | −2.6 | −117.2 | −3.8 |
| WL | −23.7 | −0.4 | −1.9 | 0.1 | −163.1 | −2.4 |
| GL | 4.3 | 1.9 | −1.3 | −0.6 | −6.8 | −3.0 |
| W | 5.4 | 3.6 | −1.4 | −0.9 | 1.1 | 0.7 |
| CoL | 104.8 | 17.8 | 87.4 | 12.6 | 145.1 | 18.6 |
| UL | −0.4 | −8.6 | 0.0 | −1.3 | −0.1 | −3.5 |
| Years | CuL | WL | GL | W | CoL | UL | Carbon Source | Carbon Sink | Total |
|---|---|---|---|---|---|---|---|---|---|
| 2005 | 135.0 | −252.0 | −0.5 | −4.1 | 8507.4 | 0.0 | 8642.5 | −256.7 | 8385.8 |
| 2010 | 142.5 | −251.2 | −0.5 | −4.3 | 18,671.0 | 0.0 | 18,813.5 | −255.9 | 18,557.6 |
| 2015 | 125.2 | −251.1 | −0.5 | −4.2 | 17,885.3 | 0.0 | 18,010.5 | −255.8 | 17,754.7 |
| 2018 | 107.0 | −245.0 | −0.5 | −4.3 | 24,227.3 | 0.0 | 24,334.4 | −249.7 | 24,084.6 |
| The Direction of Carbon Flow | 2005–2010 (tC·a−1) | 2010–2015 (tC·a−1) | 2015–2018 (tC·a−1) |
|---|---|---|---|
| Cultivated land to Woodland | 1135.9 | 2204.2 | 10,161.3 |
| Cultivated land to Grassland | 42.2 | 41.8 | 185.5 |
| Cultivated land to Water | 470.6 | 160.8 | 1012.3 |
| Cultivated land to Construction land | −2,497,282.7 | −958,883.8 | −4,034,420.0 |
| Cultivated land to Unused land | 0.2 | 0.5 | 1.2 |
| Woodland to Cultivated land | −1669.8 | −1902.0 | −9512.0 |
| Woodland to Grassland | −168.1 | −60.4 | −591.1 |
| Woodland to Water | −5.6 | −7.2 | −48.2 |
| Woodland to Construction land | −387,023.8 | −82,125.8 | −1,098,230.4 |
| Woodland to Unused land | −4.0 | −2.1 | −18.4 |
| Grassland to Cultivated land | −14.8 | −41.4 | −171.1 |
| Grassland to Woodland | 37.0 | 78.5 | 485.4 |
| Grassland to Water | 4.7 | 0.5 | 4.4 |
| Grassland to Construction land | −20,450.4 | −8776.1 | −31,322.8 |
| Grassland to Unused land | 0.0 | 0.0 | 0.0 |
| Water to Cultivated land | −123.1 | −176.9 | −589.1 |
| Water to Woodland | 3.0 | 8.4 | 51.9 |
| Water to Grassland | −0.1 | −1.1 | −3.9 |
| Water to Construction land | −17,241.0 | −13,067.4 | −133,833.7 |
| Water to Unused land | 0.0 | 0.0 | 0.0 |
| Construction land to Cultivated land | 96,500.0 | 239,242.5 | 484,289.8 |
| Construction land to Woodland | 22,998.5 | 40,784.5 | 96,445.3 |
| Construction land to Grassland | 766.6 | 2183.3 | 6685.1 |
| Construction land to Water | 6330.2 | 7260.2 | 27,728.9 |
| Construction land to Unused land | 0.0 | 48.5 | 117.8 |
| Unused land to Cultivated land | −0.2 | −0.7 | −1.5 |
| Unused land to Woodland | 1.4 | 3.6 | 16.0 |
| Unused land to Grassland | 0.5 | 0.0 | 0.0 |
| Unused land to Water | 0.0 | 0.0 | 0.0 |
| Unused land to Construction land | −3857.0 | −58.9 | −5043.4 |
| Positive carbon flow | 128,290.5 | 292,017.3 | 627,184.8 |
| Negative carbon flow | −2,927,840.4 | −1,065,103.6 | −5,313,785.5 |
| Land-Use Types | Prediction for 2030 | Optimization in 2030 | ||
|---|---|---|---|---|
| Area () | Carbon Emission (MgC) | Area () | Carbon Emission (MgC) | |
| Cultivated land | 3137.1 | 114.6 | 2859.6 | 104.5 |
| Woodland | 6014.6 | −224.9 | 6716.2 | −251.2 |
| Grassland | 256.1 | −0.5 | 208.0 | −0.4 |
| Water | 169.2 | −4.7 | 152.5 | −4.3 |
| Construction land | 1200.4 | 31,433.4 | 982.3 | 25,721.6 |
| Unused land | 3.6 | 0.0 | 3.4 | 0.0 |
Publisher’s Note: MDPI stays neutral with regard to jurisdictional claims in published maps and institutional affiliations. |
© 2021 by the authors. Licensee MDPI, Basel, Switzerland. This article is an open access article distributed under the terms and conditions of the Creative Commons Attribution (CC BY) license (https://creativecommons.org/licenses/by/4.0/).
Share and Cite
Huang, S.; Xi, F.; Chen, Y.; Gao, M.; Pan, X.; Ren, C. Land Use Optimization and Simulation of Low-Carbon-Oriented—A Case Study of Jinhua, China. Land 2021, 10, 1020. https://doi.org/10.3390/land10101020
Huang S, Xi F, Chen Y, Gao M, Pan X, Ren C. Land Use Optimization and Simulation of Low-Carbon-Oriented—A Case Study of Jinhua, China. Land. 2021; 10(10):1020. https://doi.org/10.3390/land10101020
Chicago/Turabian StyleHuang, Shiqi, Furui Xi, Yiming Chen, Ming Gao, Xu Pan, and Ci Ren. 2021. "Land Use Optimization and Simulation of Low-Carbon-Oriented—A Case Study of Jinhua, China" Land 10, no. 10: 1020. https://doi.org/10.3390/land10101020
APA StyleHuang, S., Xi, F., Chen, Y., Gao, M., Pan, X., & Ren, C. (2021). Land Use Optimization and Simulation of Low-Carbon-Oriented—A Case Study of Jinhua, China. Land, 10(10), 1020. https://doi.org/10.3390/land10101020