Article

Identification of Potential Land-Use Conflicts between Agricultural and Ecological Space in an Ecologically Fragile Area of Southeastern China

1
Institute of Applied Remote Sensing and Information Technology, College of Environmental and Resource Sciences, Zhejiang University, Hangzhou 310058, China
2
Key Laboratory of Urban Land Resources Monitoring and Simulation, Ministry of Natural Resources, Shenzhen 518000, China
3
Technology Innovation Center for Land Spatial Eco-restoration in Metropolitan Area, Ministry of Natural Resources, Shanghai 200003, China
*
Author to whom correspondence should be addressed.
Land 2021, 10(10), 1011; https://doi.org/10.3390/land10101011
Submission received: 9 August 2021 / Revised: 23 September 2021 / Accepted: 24 September 2021 / Published: 26 September 2021

Abstract

:
In the context of ensuring national food security, high-intensity agricultural production and construction activities have aggravated the conflicts between agricultural and ecological spaces in ecologically fragile areas, which have become one of the most important factors hindering regional sustainable development. This study took Lin’an District, a typical hilly region of southeastern China, as an example. By constructing a landscape ecological risk evaluation model, land-use conflicts between agricultural and ecological spaces were identified, spatial autocorrelation and topographic gradient characteristics were analyzed, and land-use conflict trade-off mechanisms were proposed. During 2008 and 2018, the degree of land-use conflict in Lin’an District displayed an increasing trend, and the proportion of severe conflicts increased obviously. Slope is the main factor affecting land-use conflicts in a hilly region and shows a negative correlation, mainly because areas with flat terrain are more conducive to human activities. Based on the characteristics of land-use conflicts in Lin’an District, conflict trade-off mechanisms were proposed to provide a theoretical basis and practical support for land-use conflict management. Our study provides scientific evidence for sustainable land-use planning and ecological management in ecologically fragile areas.

1. Introduction

Mountains, water, forests, fields, lakes and grass are communities shared by all life on Earth [1]. This fact emphasizes the inseparable interactions between the agricultural and ecological elements of landscapes [2]. However, In order to guarantee food security, the Chinese government requires that a certain amount of arable land must be maintained [3]. At the same time, in order to guarantee the ecological security of the land, it also requires that areas with important ecological functions be included in the protection [4]. These tensions, if not managed properly, can accentuate land-use conflicts between agricultural space and ecological space, and the conflicts caused by land resource shortages and single-use lands are increasing, especially in ecologically fragile areas. When land-use management in a certain region fails to integrate economic development, food security and ecological protection, imbalances in land use structure and regional landscape patterns emerge. These imbalances manifest as spatial conflicts caused by land users competing for land resources out of different interests [5]. Currently, more than 50 countries have pledged to protect 30% of the planet’s land and sea area by 2030. Therefore, it is significant to study and identify land-use conflicts in agricultural and ecological spaces to coordinate human–land balanced relationships for green, coordinated and sustainable regional development.
Land-use conflict mainly refers to the contradiction between interest groups in the process of land use due to the multiple functional demands of social development or the industry objectives and the resulting functional utilization conflicts [6]. Early studies on land-use conflicts mainly focused on qualitative analysis. The commonly used qualitative analysis methods include the participatory survey method [7,8,9], logical framework method [10,11], game theory analysis method [12,13,14] and other methods. The application of the participatory survey method in domestic outdoor surveys began in the 1990s, which is characterized by a high degree of participation and acceptance by the population, and the use of the participatory survey method can analyze land-use conflicts. The participatory survey method can analyze the emergence and resolution of land use conflicts from internal mechanisms [15]. The logical framework approach is an evaluation method proposed by the United States in the 1970s, which in essence shows the causal links between things, with particular emphasis on the role of indicators of project objectives and the initial participation of stakeholders. The logical framework approach enables the initial measurement and hypothesis testing of land-use conflicts [16]. Game theory focuses on the decision-making behavior of decision makers as “rational people” to maximize their own benefits in the process of land use and thus explains the underlying mechanism of land-use conflicts [17]. Although qualitative analysis methods can help us understand land-use conflict mechanisms and resolution strategies, it is difficult to measure land-use conflicts quantitatively [18].
In recent years, many scholars with different professional backgrounds and research perspectives have conducted extensive research on the identification of land use conflicts, and some quantitative analysis methods have been proposed. Commonly used quantitative analyses include pressure-state-response (PSR) [19,20], statistical regression analysis [21,22], multicriteria evaluation [23,24], and spatial analysis [7,25]. The PSR approach is essentially used to show the linkage between humans and nature, and it is used in the assessment of ecological safety and sustainable use of land to clearly understand the occurrence, development and transformation of things in a complex and changing environment and has basic systemic and integrity characteristics [26]. Statistical regression analysis is used to interpret the structural and quantitative evolution of land use and to make reasonable assumptions about the drivers that may affect changes in the future [27,28]. The multicriteria evaluation method is more flexible than the above methods and mainly focuses on multicriteria decision making. The resolution of land-use conflicts is a long-term and comprehensive process, and the use of this method can play a better role in mitigating land use conflicts [29,30]. The spatial analysis method diagnoses the spatial distribution pattern of land-use conflicts in the region by establishing land-use conflict data, identifying land use conflicts, and displaying land use conflict results on land use-related data through the GIS (geographic information system) function [31,32]. This method can quickly achieve the quantification and precision of land-use conflicts and is more suitable for the research and analysis of land-use conflicts in hilly areas.
Research on land-use conflicts in China started late. The relevant theories still need to be refined, the technical methods are not advanced, and there is a lack of a reliable scientific basis and objective evaluation criteria. In addition, the current research fields are mostly in large areas such as plain cities. Less attention has been given to hilly areas, and the existing studies do not reflect the influence of topographic features of hilly areas on land use conflicts.
Based on the theories of human–land relationships, landscape ecology and ecosystem balance, this study used spatial analysis with GIS, landscape ecological risk assessment and spatial autocorrelation analysis to explore land-use conflicts. Lin’an District, located in Hangzhou in the hilly areas of northern Zhejiang, was taken as a representative example. First, a model for land-use conflict measurement was constructed to identify the land-use conflicts between agricultural space and ecological space. Second, spatial autocorrelation and topographic gradient characteristics were analyzed. Finally, several trade-off mechanisms involved in land-use conflicts were proposed.

2. Study Area and Data Sources
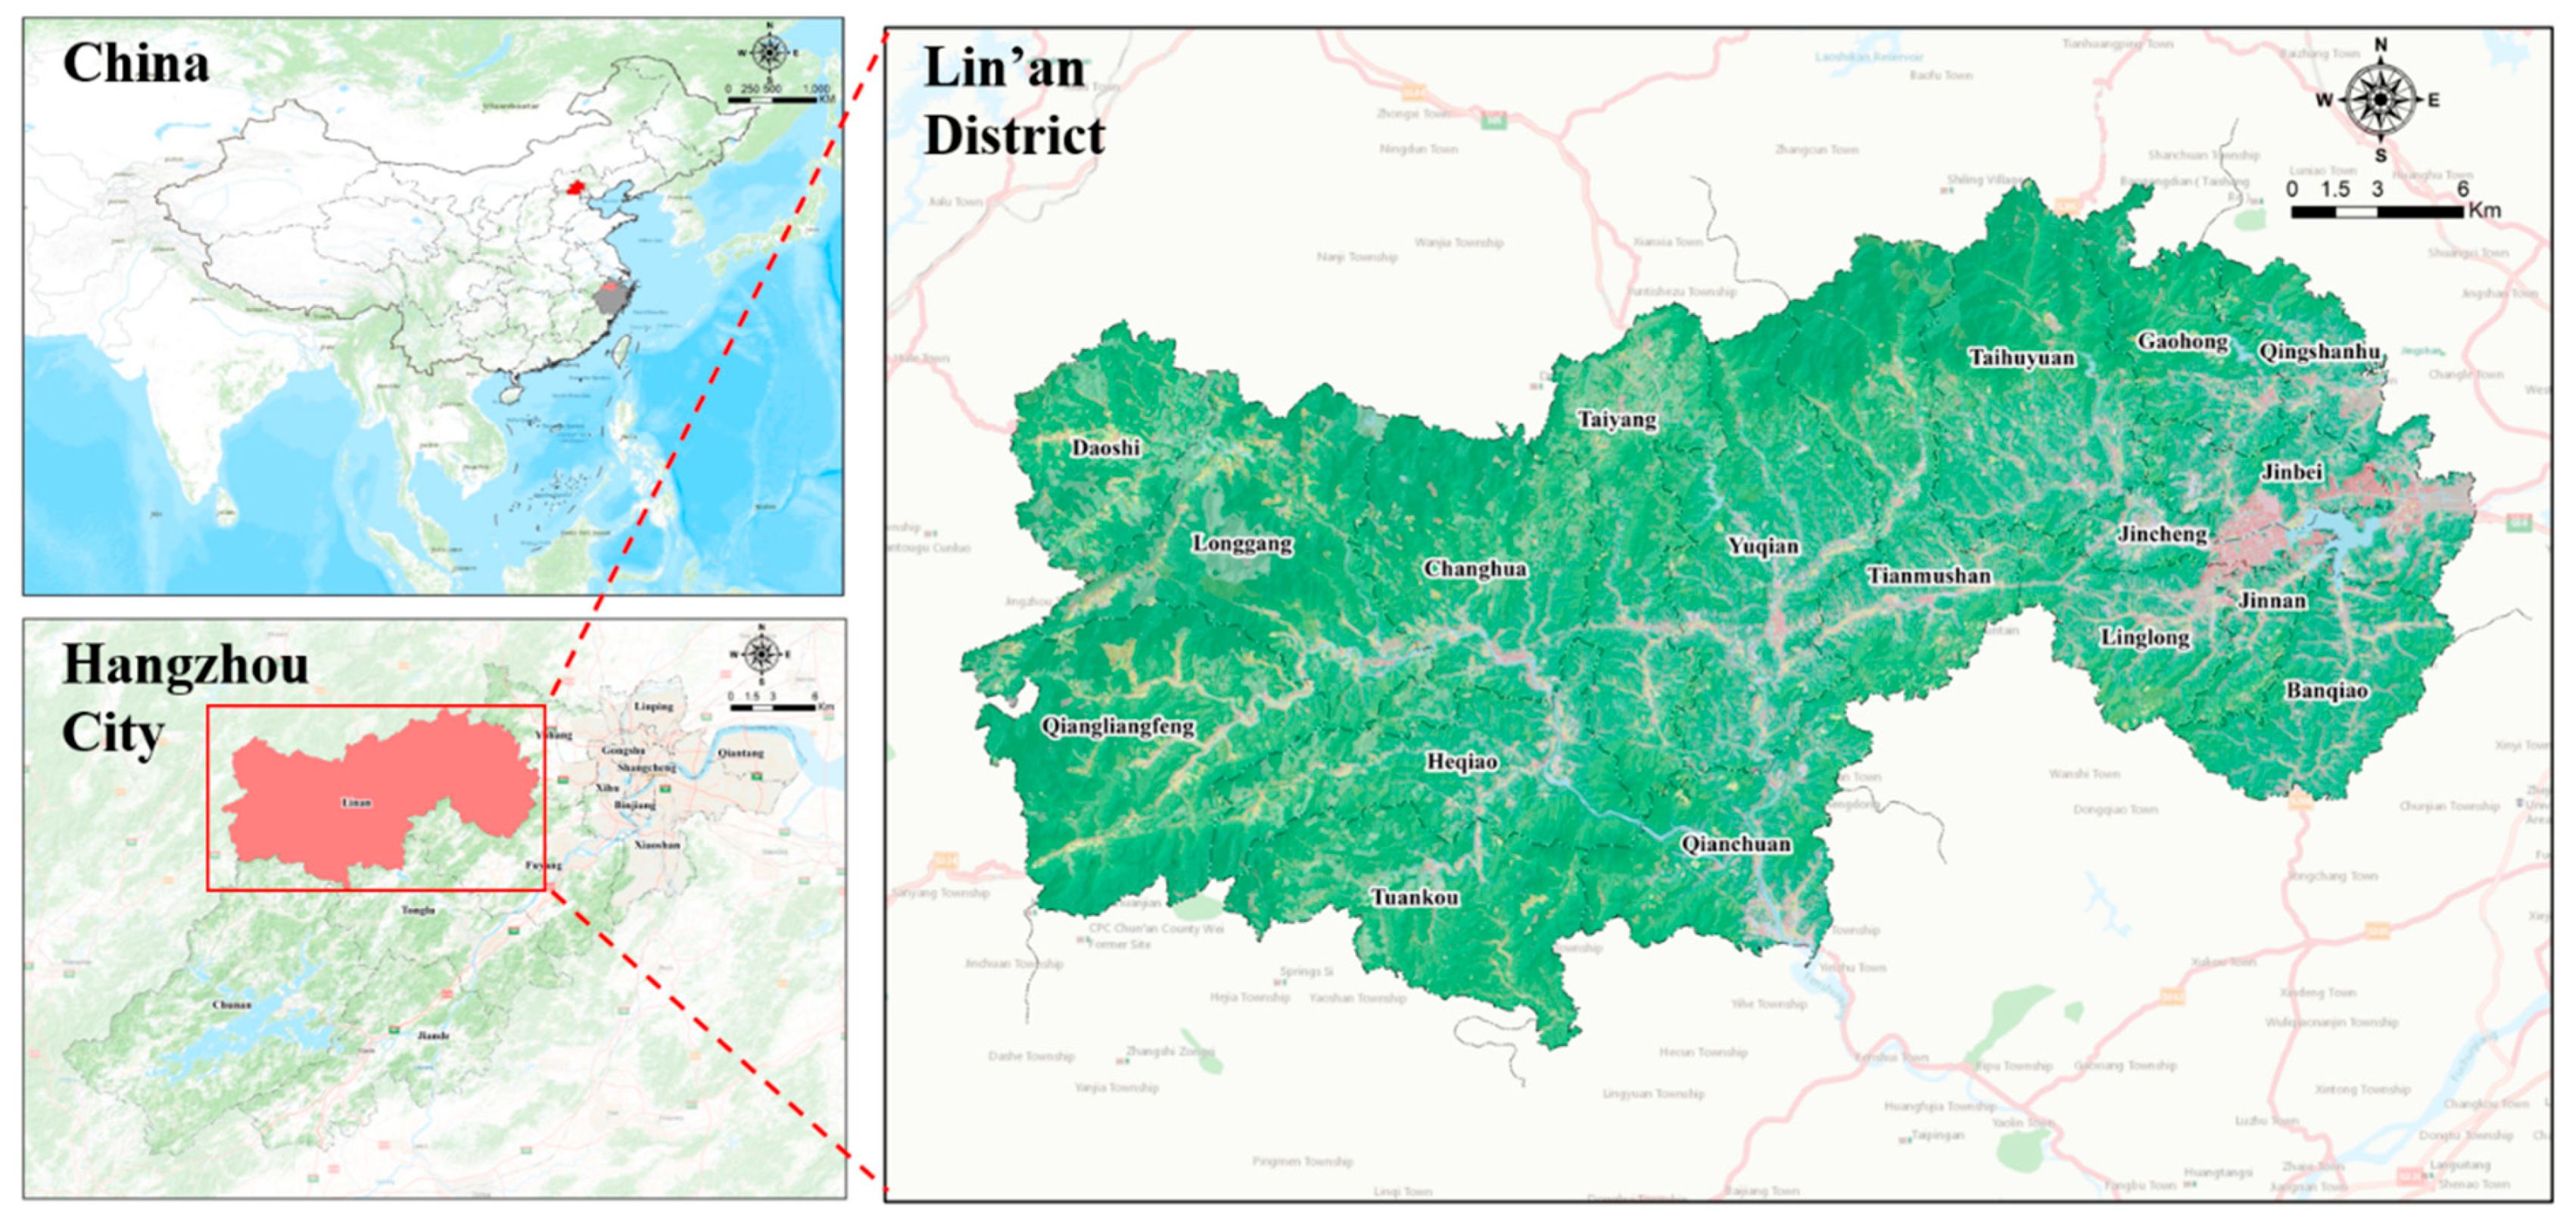
2.1. Study Area

Lin’an District (Figure 1) in Hangzhou city is located in northwestern Zhejiang Province, bordering the main city of Hangzhou in the east and Huangshan in the west. In July 2017, Lin’an was established as a district, making it the youngest district in Hangzhou, with five streets and 13 towns (towns and streets are the smallest units in China’s administrative divisions). The eastern part of Lin’an has been basically integrated into the main city of Hangzhou and is a highly urbanized area. In contrast, the western part is low hilly area with a good ecological environment and rich species diversity. It is approximately 100 km wide from east to the west and 50 km long from north to south. The hilly area accounts for 86% of this district, which is referred to as having ‘nine mountains, half water and half farmland’. The elevation is high in the northwest and low in the southeast. The mountains in the northwestern part of the district are rugged, and the eastern part of the district is characterized by a staggered distribution of hilly and wide valley basins. Lin’an District is located on the southern edge of the subtropical monsoon climate zone and experiences a monsoon climate. Streams and ditches in the district show a crisscrossed pattern. The Changhua Stream, Tianmu Stream and Tiao River are part of the Qiantang River and Yangtze River systems. The agricultural industry in Lin’an District is dominated by Carya cathayensis (Chinese hickory) and Phyllostachys praecox (a cultivated species of bamboo). In 2018, the total household registered population of the whole region was 537,600, the GDP reached 53.963 billion yuan, the output value of the first, second and third largest industries accounted for 8.0%, 44.2% and 47.8%, respectively, and industry was developing well.

2.2. Data Sources and Processing

The data used in this study mainly included natural geographical data, socioeconomic statistical data and land-use data. The natural geographical data included Lin’an District DEM data with a resolution of 30 m × 30 m from the geospatial data cloud that was processed to provide slope data. Socioeconomic statistical data were obtained from the ‘Bulletin of National Economic and Social Development Statistics of Lin’an District in 2018’. Land-use data included land-use change survey data from 2008, 2013 and 2018, cultivated land quality data, nature reserves and other relevant data. Three land-use categories were established based on land-use planning classification standards, namely, agricultural space (cultivated land, garden land and other agricultural land), ecological space (forestland, grassland, water areas and natural reserves) and urban space (construction land).

3. Methods

3.1. Land-Use Conflict Measurement Methods

The spatial conflict caused by human activities is in essence a game of spatial resource occupation by various land users. Spatial conflict is accompanied by the utilization of land resources, resulting in the change of regional spatial pattern and function, which further affects the original physical, chemical and ecological processes and affects the nature conditions [33,34].
Referring to previous studies [35,36], we established a measurement model for land-use conflict based on the conceptual model of ecological risk assessment [33,34,37]. In terms of describing the pressure from human disturbance and deterioration of natural conditions, the ability of the land resources themselves to withstand conflict pressure, and the stability of the land system, three indexes including the land complexity index, land fragility index and land stability index were selected to evaluate the land-use conflict [34,38,39]. Mathematical linear models were used to characterize a comprehensive index of land-use conflict (CCI):
C C I = L C I + L F I L S I
In this formula, CCI refers to the comprehensive index of land use conflict; LCI refers to the land complexity index; LFI refers to the land fragility index; and LSI refers to the land stability index. Since land use spatial conflict is a complex scientific problem, it is difficult to determine the impact of complexity, vulnerability and stability on land-use spatial conflict. Therefore, this study uses equal weight to calculate the comprehensive index of land use spatial conflict without considering its possible nonlinear influence.
(1)
Land complexity index (LCI) [34,39]:
The complexity of land-use systems mainly reflects the external pressures associated with human activities and land development intensity. For the measurement of external pressure, it is mainly considered from the perspective of the comprehensive influence of the space unit and its surrounding area. Fractals are an effective tool for describing the spatial pattern of nature and the spatial complexity of geographical phenomena. Therefore, the area-weighted mean patch fractal dimension (AWMPFD) was used as a spatial index to describe the complexity of land use patches, with a view to reflecting the influence of land-use processes in neighborhoods on current land-use types. In general, the fractal values of natural landscapes that are less disturbed by human activities are high, while the fractal values of man-made landscapes that are highly influenced by human activities are low [40]. The calculation method was as follows (Formula (2)):
L C I = A W M P F D = i = 1 m j = 1 n 2 ln ( 0.25 P i j ) ln a i j × a i j A
In this formula, Pij refers to the perimeter of the jth landscape patch of space type i; aij refers to the area of the jth landscape patch of space type i; A refers to the total area of the spatial unit; m refers to the number of space types; and n refers to the number of landscape patches. To simplify and standardize the calculations, the obtained index values were standardized to 0~1.
(2)
Land fragility index (LFI) [39,41]:
The LFI represents the resistance of landscape patches to external pressures. The role of different landscape types in maintaining biodiversity, and improving overall structure and function varies. This difference is related to the stages in which different landscapes are in the natural succession process. In general, ecosystems in the primary succession stage, with simpler food chain structure and lower biodiversity are more fragile [42]. The fragility of each landscape in the space was used to calculate the LFI. The calculation method was as follows (Formula (3)):
L F I = i = 1 m s = 1 r f i s × a i s A
In this formula, fis refers to the landscape fragility of land use types in space type i; ais refers to the landscape patch area of land-use types in space type i; A refers to the total area of the spatial unit; m refers to the number of space types; and r refers to the number of land-use types.
Land-use types were assigned landscape fragility values [31,43], as shown in Table 1. To simplify and standardize the calculations, the obtained index values were standardized to 0~1.
(3)
Land stability index [31,39] (LSI):
One of the most significant effects of land-use conflicts on regional spatial patterns is the fragmentation of landscape patches, which presents as a changing process from a continuously varying structure to a mosaic of patches that tend to be complex, heterogeneous and discontinuous. The conservation of many biological species requires large areas of natural habitat. With the fragmentation of the landscape and the shrinking area of patches, the environment suitable for living organisms is decreasing, which will directly affect the reproduction, dispersal, migration and conservation of species. Therefore, landscape fragmentation is one of the main reasons for the loss of biodiversity and decline of ecosystem stability.
Patch density (PD), a commonly used landscape index, was used to represent landscape fragmentation and reflect the degree of land stability. A higher PD value indicates a higher degree of landscape fragmentation, poorer land stability, and the more intense the conflict in a unit area [35,44].
Therefore, the LSI can be expressed as the reverse of the PD and was calculated as follows (Formula (4)):
LSI = 1 − PD
The PD was calculated as follows (Formula (5)):
P D   =   n i A
In this formula, ni refers to the number of landscape patches of space type i, and A refers to the total area of the spatial unit. To simplify and standardize the calculations, the index values obtained were standardized to 0~1.
A 500 m × 500 m grid was selected as the measurement unit based on the research scale, the total amount of data, and the landscape patch situation. Based on the results of existing research [44], the conflict values were classified into four grades: stable and controlled [0,0.4], basically controlled (0.4,0.6], basically uncontrolled (0.6,0.8] and severely uncontrolled (0.8,1.0].

3.2. Land-Use Conflict Spatial Analysis Methods

3.2.1. Spatial Autocorrelation Analysis

Spatial autocorrelation analysis reflects the correlation between the values of a variable in a space and the surrounding space and can also be used to determine whether there is autocorrelation between the different spaces. To study the spatial distribution of spatial units with different degrees of land-use conflict, this research used GeoDa 1.14 software to establish spatial weights based on adjacency relationships and used the global spatial autocorrelation index Moran’s I and the local spatial autocorrelation index LISA [45,46,47] to measure the spatial autocorrelation characteristics of land-use conflict in Lin’an District.
(1)
Global spatial autocorrelation index. The global spatial autocorrelation index Moran’s I was calculated as follows (Formula (6)):
M o r a n s   I   =   n i = 1 n j = 1 n W i j × i = 1 n j = 1 n W i j ( x i x ¯ ) ( x j x ¯ ) i = 1 n ( x i x ¯ ) 2
In this formula, n refers to the total number of sample points of variable x; xi and xj refer to the values of variable x at spatial locations i and j, respectively;   x ¯ refers to the average values of n location attribute values; and Wij refers to the elements of the binary spatial weight matrix W in general cross-product statistics, which reflect the location similarity of spatial units.
Moran’s I reflects the degree of similarity in the comprehensive index of land use conflict in units around a space. Its value range is [–1,1]; values of (0,1] indicate positive spatial autocorrelation, 0 indicates no spatial autocorrelation, and values of [–1,0) indicate negative spatial autocorrelation [48]. Based on this analysis, the Monte Carlo simulation method was used to calculate the Z value and the P value for further testing.
(2)
Local spatial autocorrelation index. The local spatial autocorrelation index LISA was calculated as follows (Formula (7)):
L I S A   =   n ( x i x ¯ ) i ( x i x ¯ ) 2 j W i j ( x i x ¯ )
When the LISA index value is positive, the similarity values around a unit are clustered in space; when the LISA index value is negative, non-similar values around the unit are clustered in space.

3.2.2. Terrain Gradient-Based Analysis

Topographic factors have a key influence on a land-use pattern. Lin’an District is a typical hilly area with large topographic undulations, scarce arable land resources, and tense human–land relations. The characteristics of land use conflicts vary significantly with changes in topographic features. Therefore, the slope factor was chosen to explore the topographic gradient characteristics of land-use conflicts in Lin’an District.
The reclassification module of ArcGIS was used to classify the slope index to quantitatively explore the land-use conflict characteristics in Lin’an District. With reference to the current classification standards and the actual surface morphology of the study area, the slope reclassification of Lin’an District was divided into three categories, namely, low slope [0°, 6°], medium slope (6°, 25°] and high slope (25°, 90°]. After that, the spatial distribution of the land-use conflict degree in 2008, 2013 and 2018 were overlaid with the slope classification to explore the characteristics of land-use conflicts under different slope conditions in Lin’an District.

4. Results

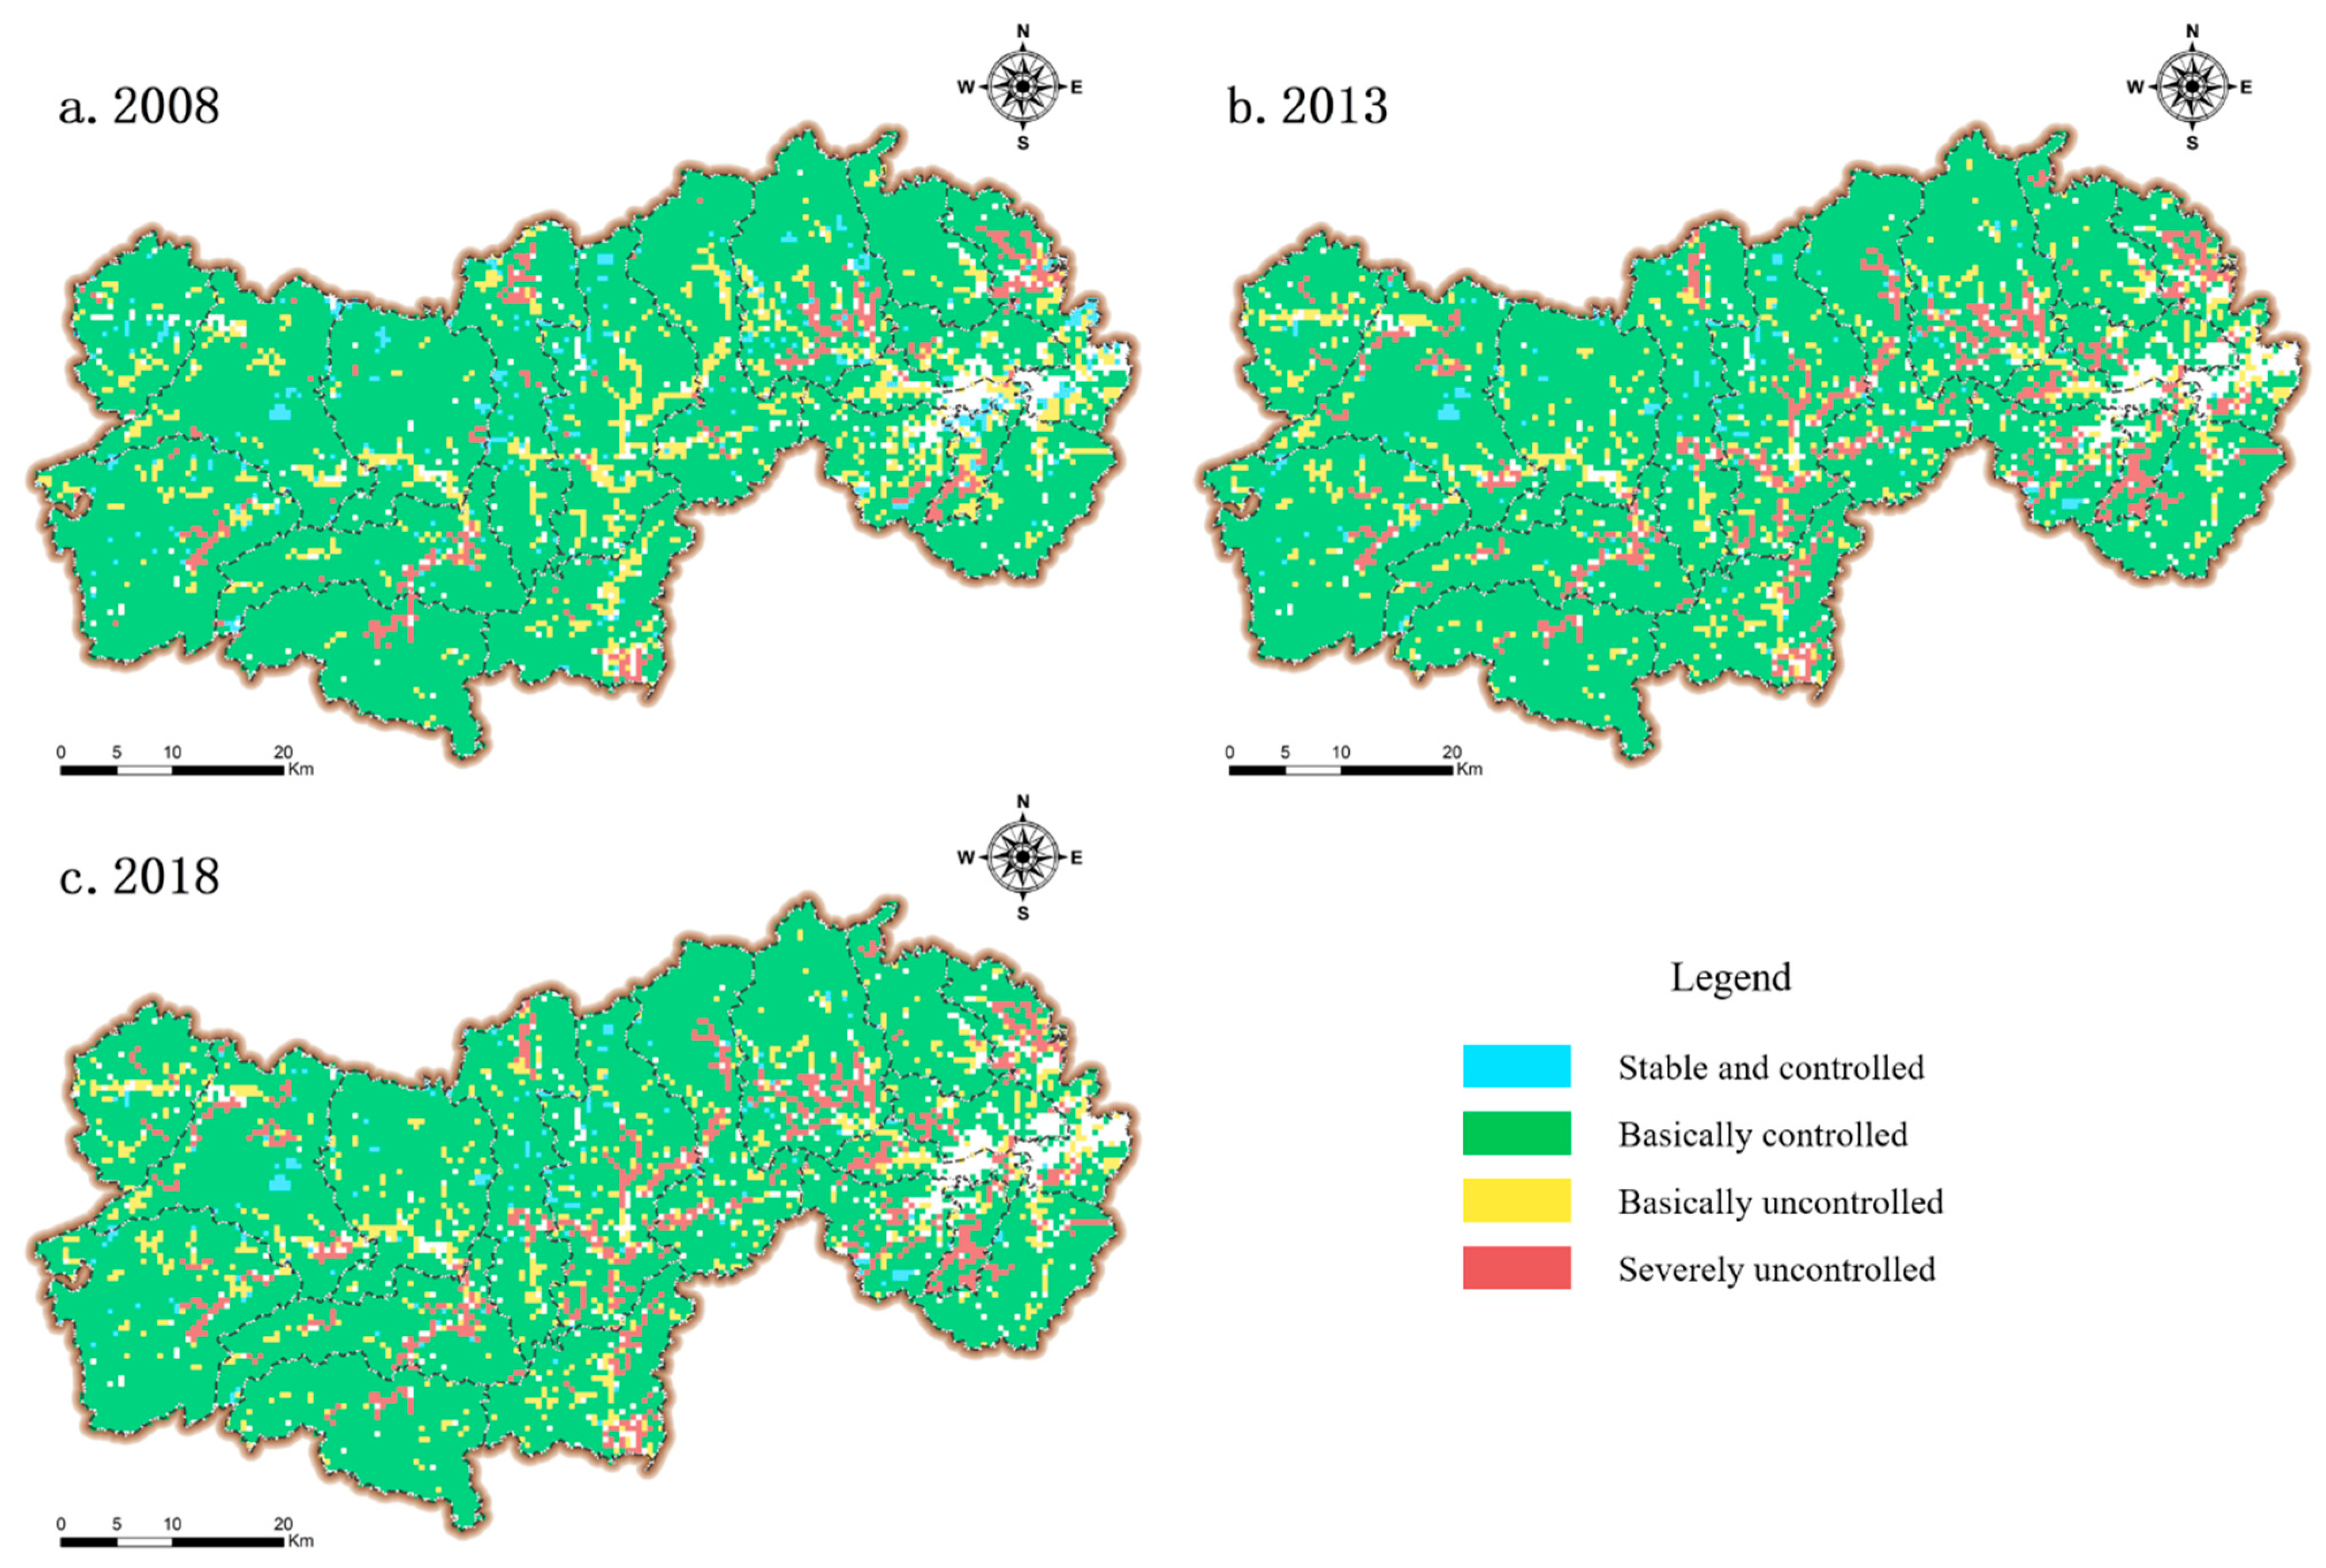
4.1. Changes in Potential Land-Use Conflicts

The quantitative results (Table 2) showed that the potential land-use conflicts between agricultural space and ecological space in Lin’an District showed an increasing trend during the study period. Specifically, the proportion of spatial units with controlled grades in 2008–2018 was 86.19~88.33%, which accounted for nearly 90% of the total units of agricultural and ecological spaces in Lin’an District. The proportion of spatial units with stable and controlled grades fluctuated, showing a trend of first decreasing and then increasing; the proportion increased by 0.47% during 2013 and 2018, but that increase was far lower than the decline during 2008 and 2013 (0.83%). The proportion of basically controlled spatial units continued to decline during 2008 and 2018. The proportion of basically uncontrolled spatial units increased over time, and the increase in 2013–2018 was 2.14 times that in 2008–2013. The proportion of severely uncontrolled spatial units also continuously increased, from 3.23% in 2008 to 4.24% in 2018.
The spatial distribution (Figure 2) clearly shows the expansion trend of uncontrolled (basically uncontrolled and severely uncontrolled) spatial units, and the distribution area of controlled spatial units continuously decreased over the study period. The distribution of stable and controlled spatial units in 2008–2018 was scattered throughout the Towns and Streets. The basically controlled spatial units were the most widely distributed, and their distribution area decreased during 2008 and 2018. The land-use types inside these spatial units mainly included forestland. In 2008, Yuqian town was the center of the zonal distribution of basically uncontrolled spatial units, and cultivated land was the main land-use type in these spatial units. Between 2013 and 2018, these spatial units were increasingly widely distributed and scattered. In 2008, the severely uncontrolled spatial units were mainly distributed in Qingshanhu Street, Jinnan Street, Qianchuan town, Qingliangfeng town and so on. With the passage of time, these spatial units gradually spread to the surrounding areas. By 2018, some spatial units gradually changed from basically uncontrolled to severely uncontrolled. The main areas of this change included Tianmushan town, Yuqian town and Longgang town.

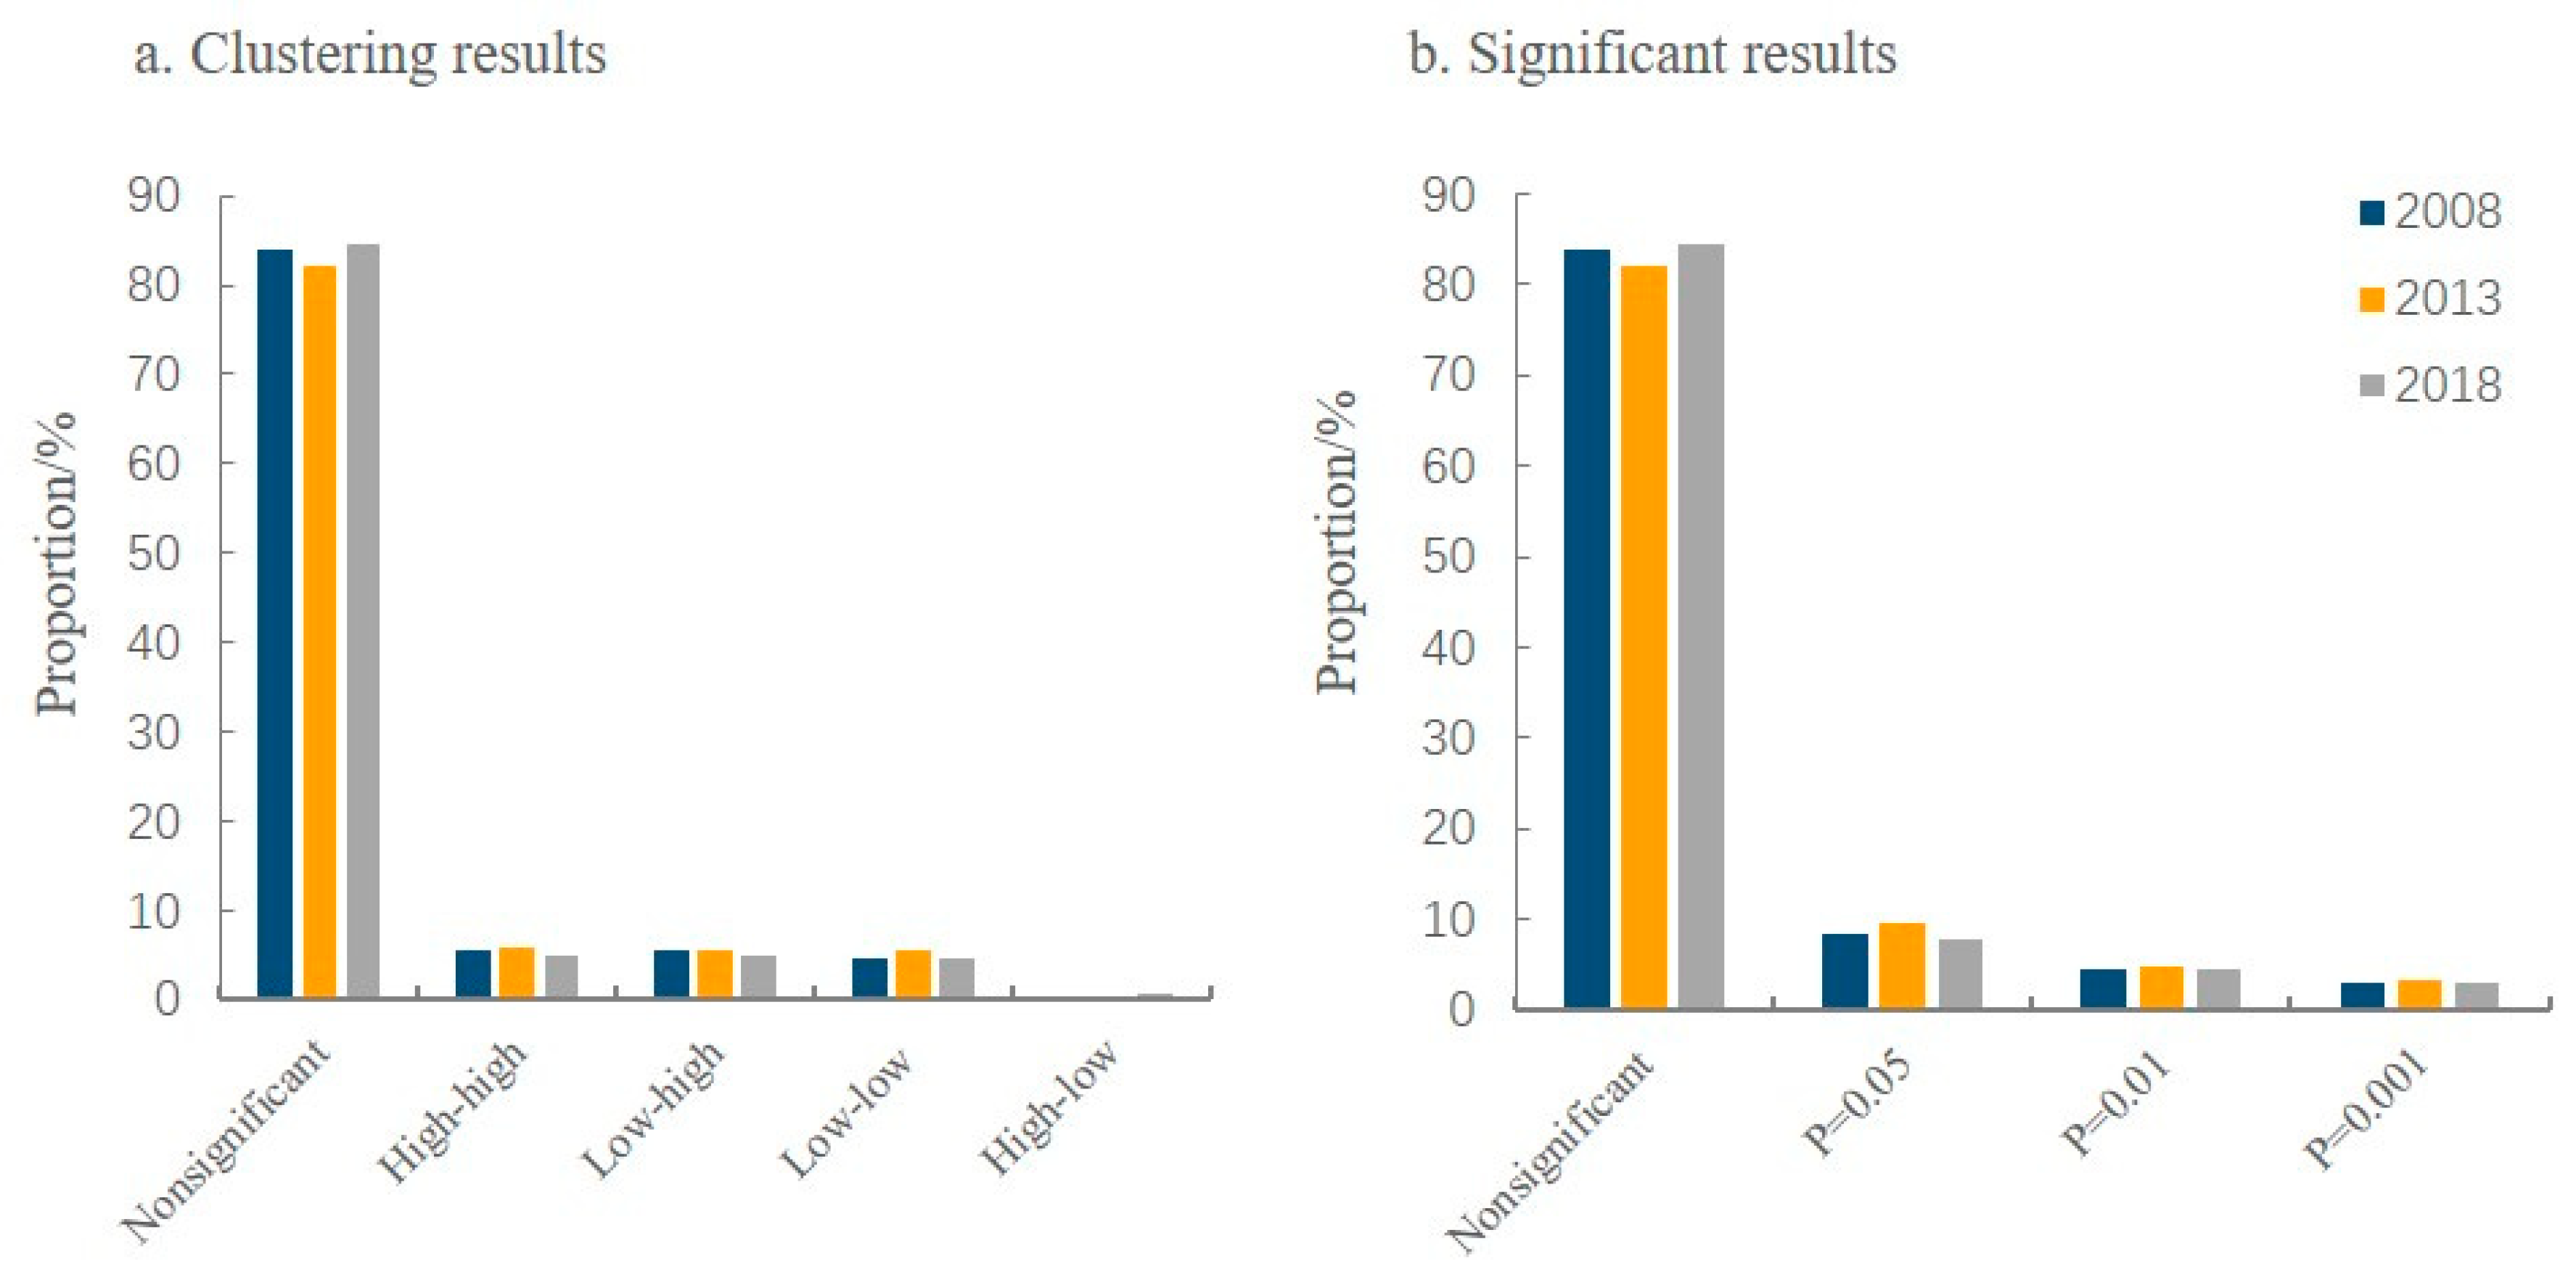
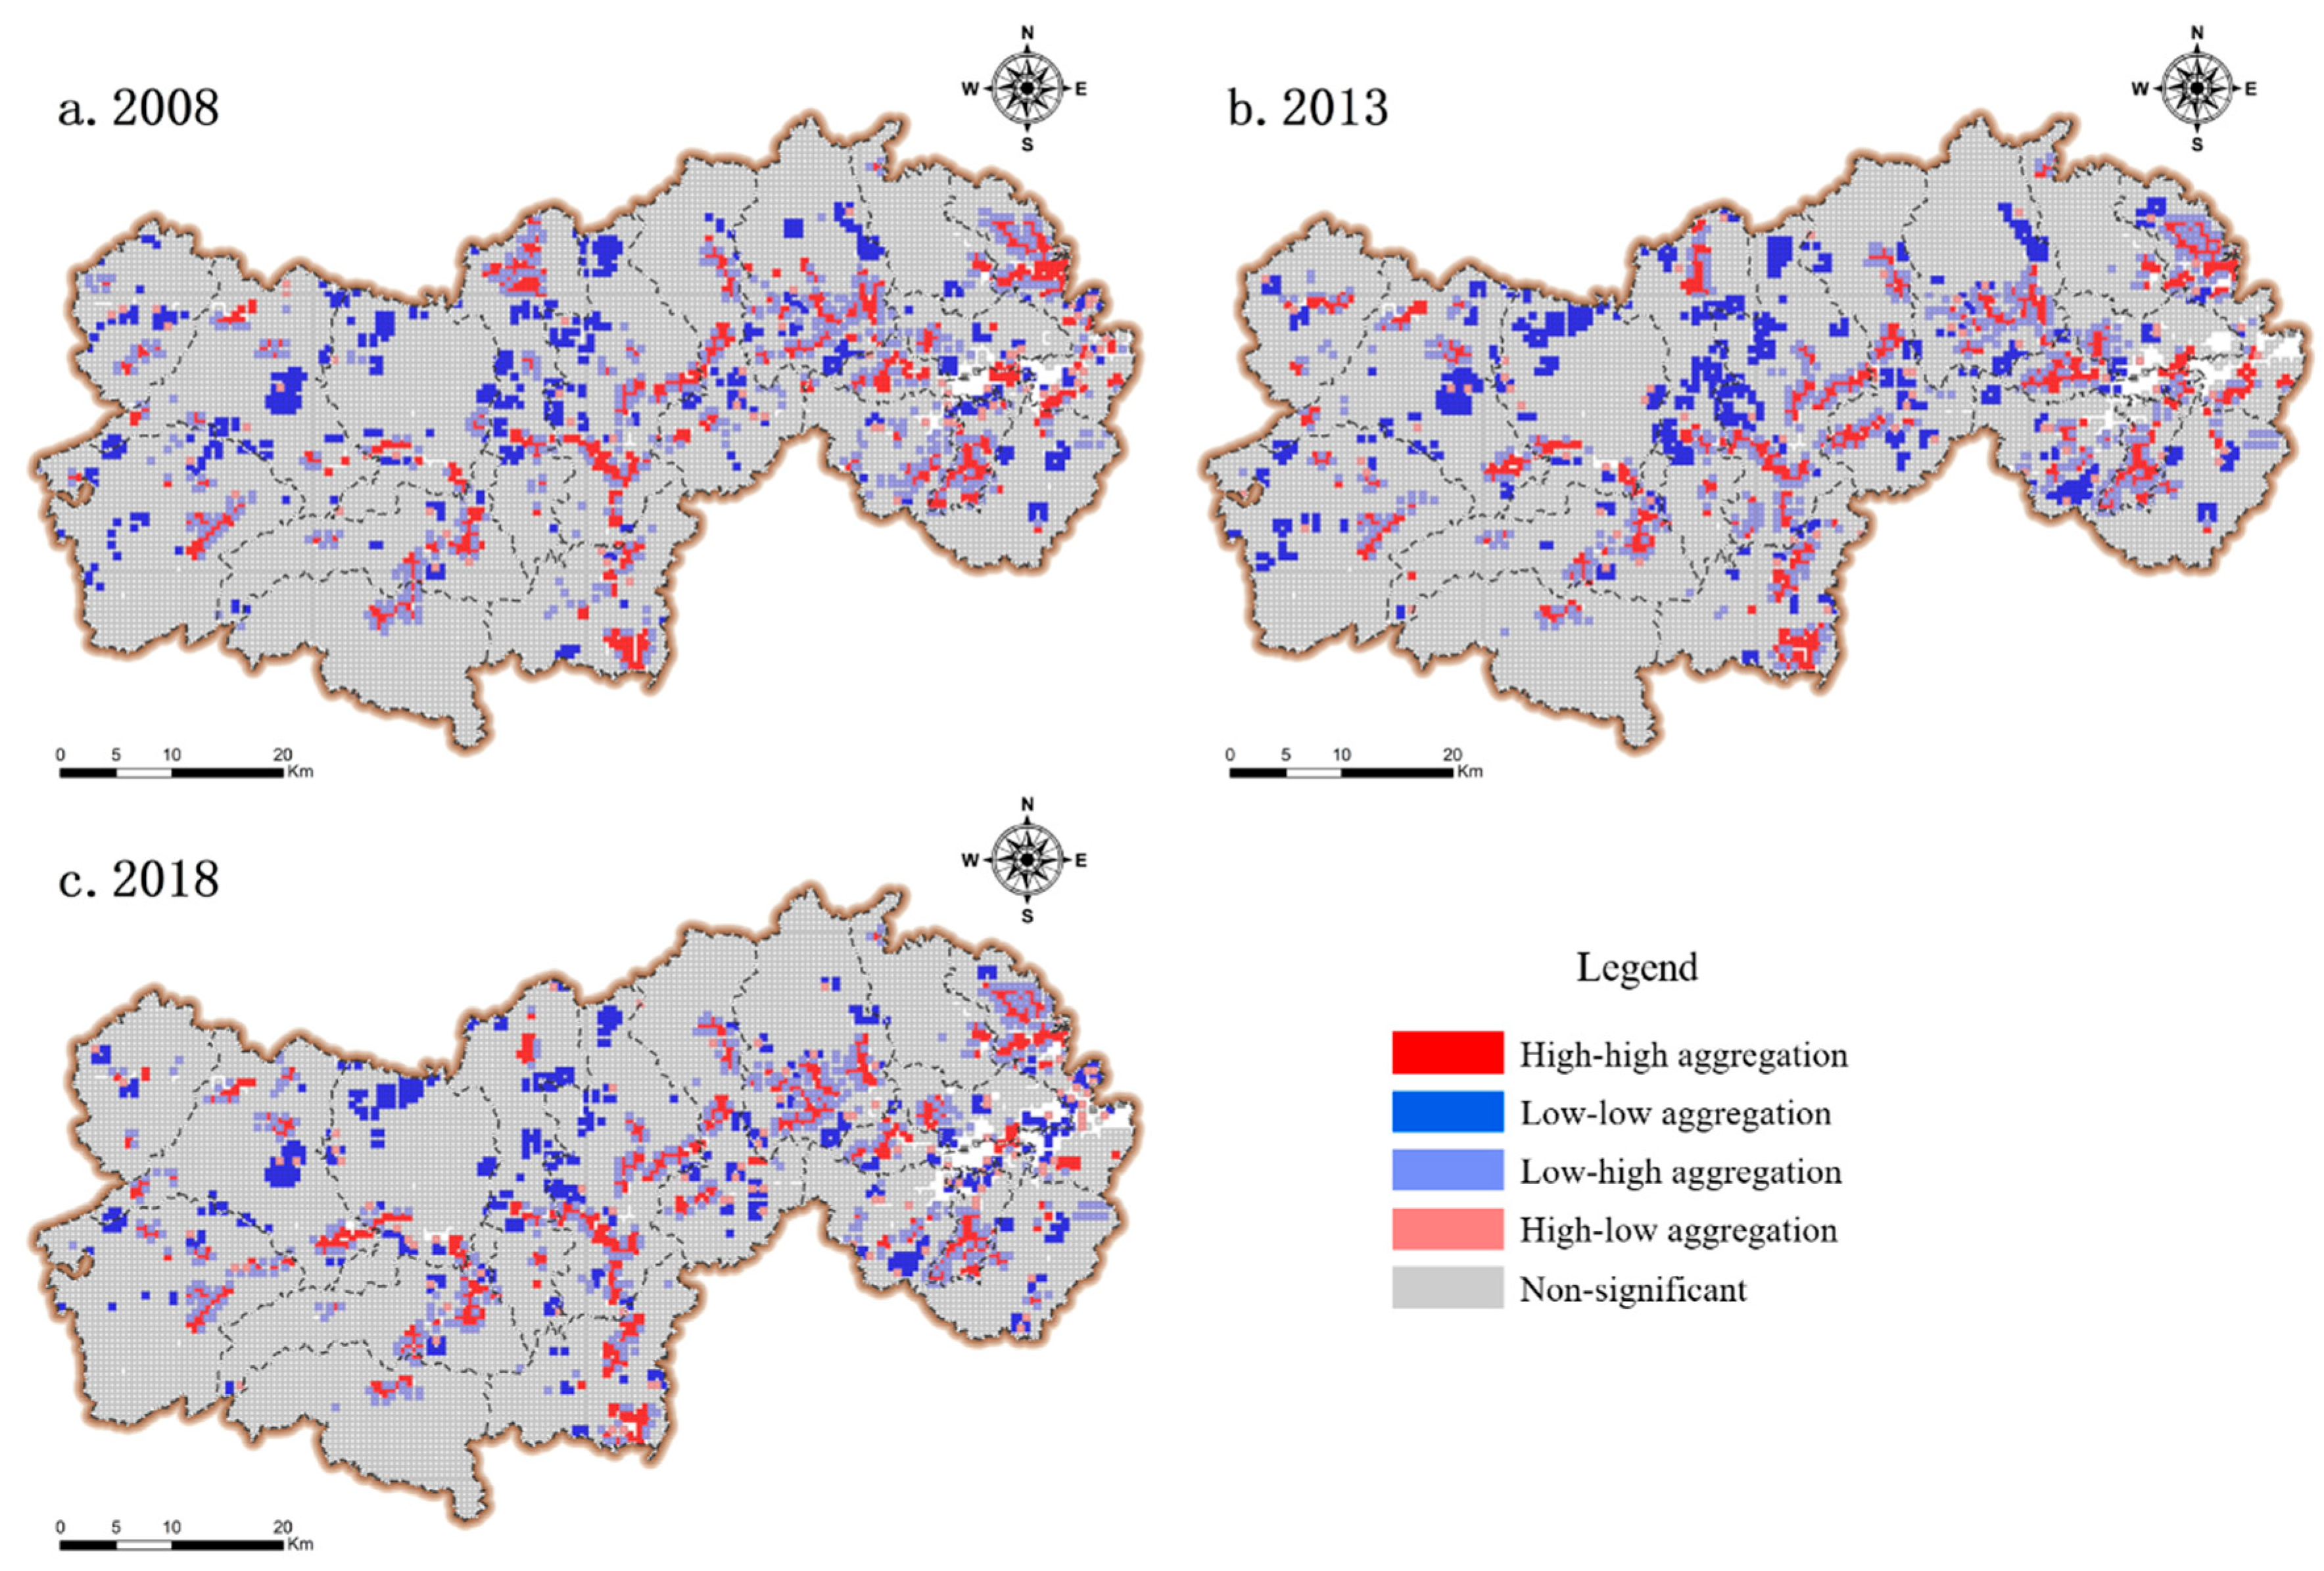
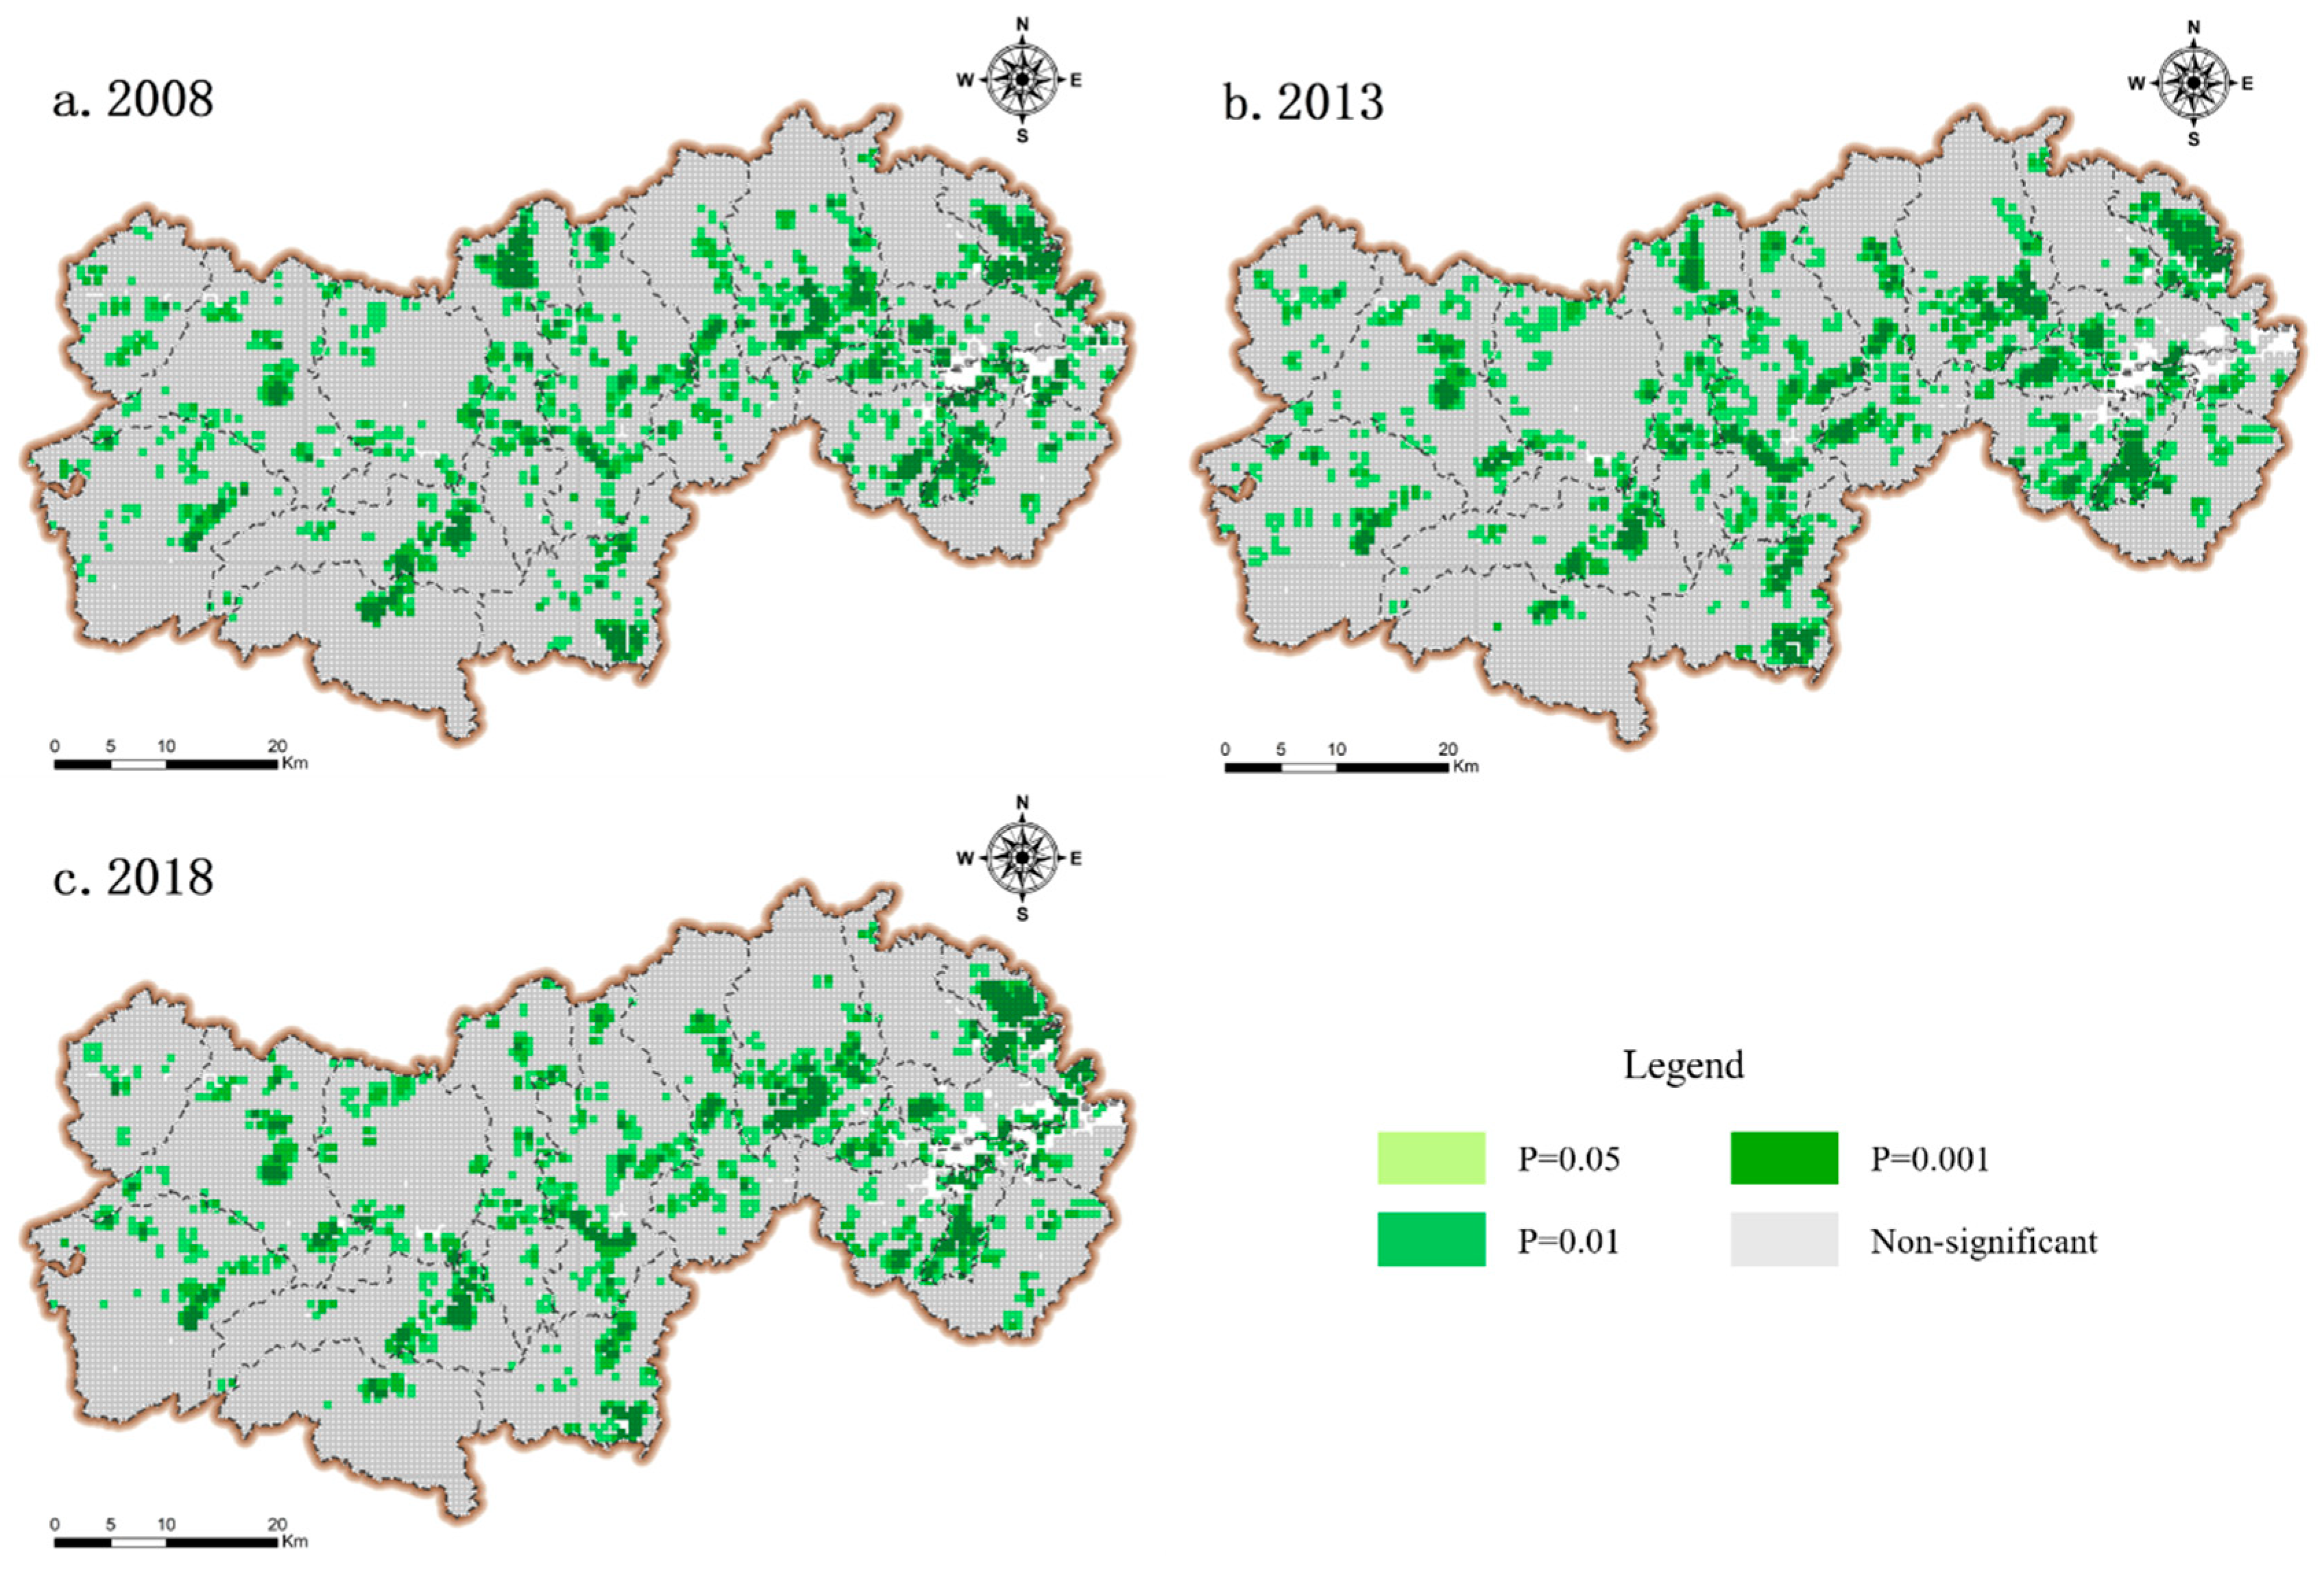
4.2. Spatial Pattern Analysis of Potential Land-Use Conflict

Table 3 shows that the Moran’s I values for land use conflicts in Lin’an District in 2008, 2013 and 2018 were 0.238, 0.253 and 0.232, respectively, indicating that the comprehensive index of land-use conflict in Lin’an District showed significant and positive global spatial autocorrelation.
To reveal the spatial relationships among local spatial units in Lin’an District, this research further calculated the local spatial autocorrelation index LISA and obtained clustering and significance results for land-use conflict. In the quantitative clustering results (Figure 3), except for the non-significant spatial units, the spatial units were dominated by high-high aggregation, which accounted for 5.54%, 5.92% and 5.04% of the units in 2008, 2013 and 2018, respectively. The spatial units with low-low aggregation changed significantly, increasing from 4.59% in 2008 to 5.70% in 2013 and then decreasing to 4.65% in 2018. Over the 10 years, the proportion of spatial units with low-high aggregation remained between 4.93% and 5.67%. The proportions of spatial units with the above three clustering grades were similar; all of them were approximately 5% and increased first and then decreased. The proportion of spatial units with high-low aggregation was the smallest, but it continued to increase, reaching its highest proportion of 0.81% by 2018. The proportion of nonsignificant spatial units was the highest; it remained higher than 80% during the period 2008–2018 and showed a trend of first decreasing and then increasing. The above results show that the spatial unit clustering of land-use conflict was the most significant in 2013.
The distribution areas of high-high aggregation, low-low aggregation and low-high aggregation spatial units in the clustering results were relatively similar (Figure 4). The high-high aggregation spatial units were mainly distributed zonally. In addition, there were obvious aggregation areas in the eastern region. The cultivated land, garden land and water areas were interlaced in these spatial units, and the land-use types were more complex. The low-low aggregation spatial units were scattered, and the streets of each town had low-low aggregation spatial units. Their distribution in Sun town was the most obvious; this area was mainly grassland, the surrounding land-use type was uniform, and the conflict level was low. The low-high and high-low aggregation spatial units were distributed on the periphery of the high-high and low-low aggregation spatial units, respectively, and the latter had a smaller area of distribution. The non-significant spatial units were the most widely distributed and had a continuous distribution; these units were mainly forests.
The spatial units with p = 0.001 in the significance results (Figure 5) have obvious clustering areas, mainly in the eastern part, Qianchuan town, Heqiao town, Longgang town and Qingliangfeng town. The spatial units with p = 0.01 and p = 0.05 were distributed sequentially at their periphery, with the latter having the largest distribution area except for the non-significant spatial units. The distribution characteristics of the non-significant spatial units were consistent with the clustering results.

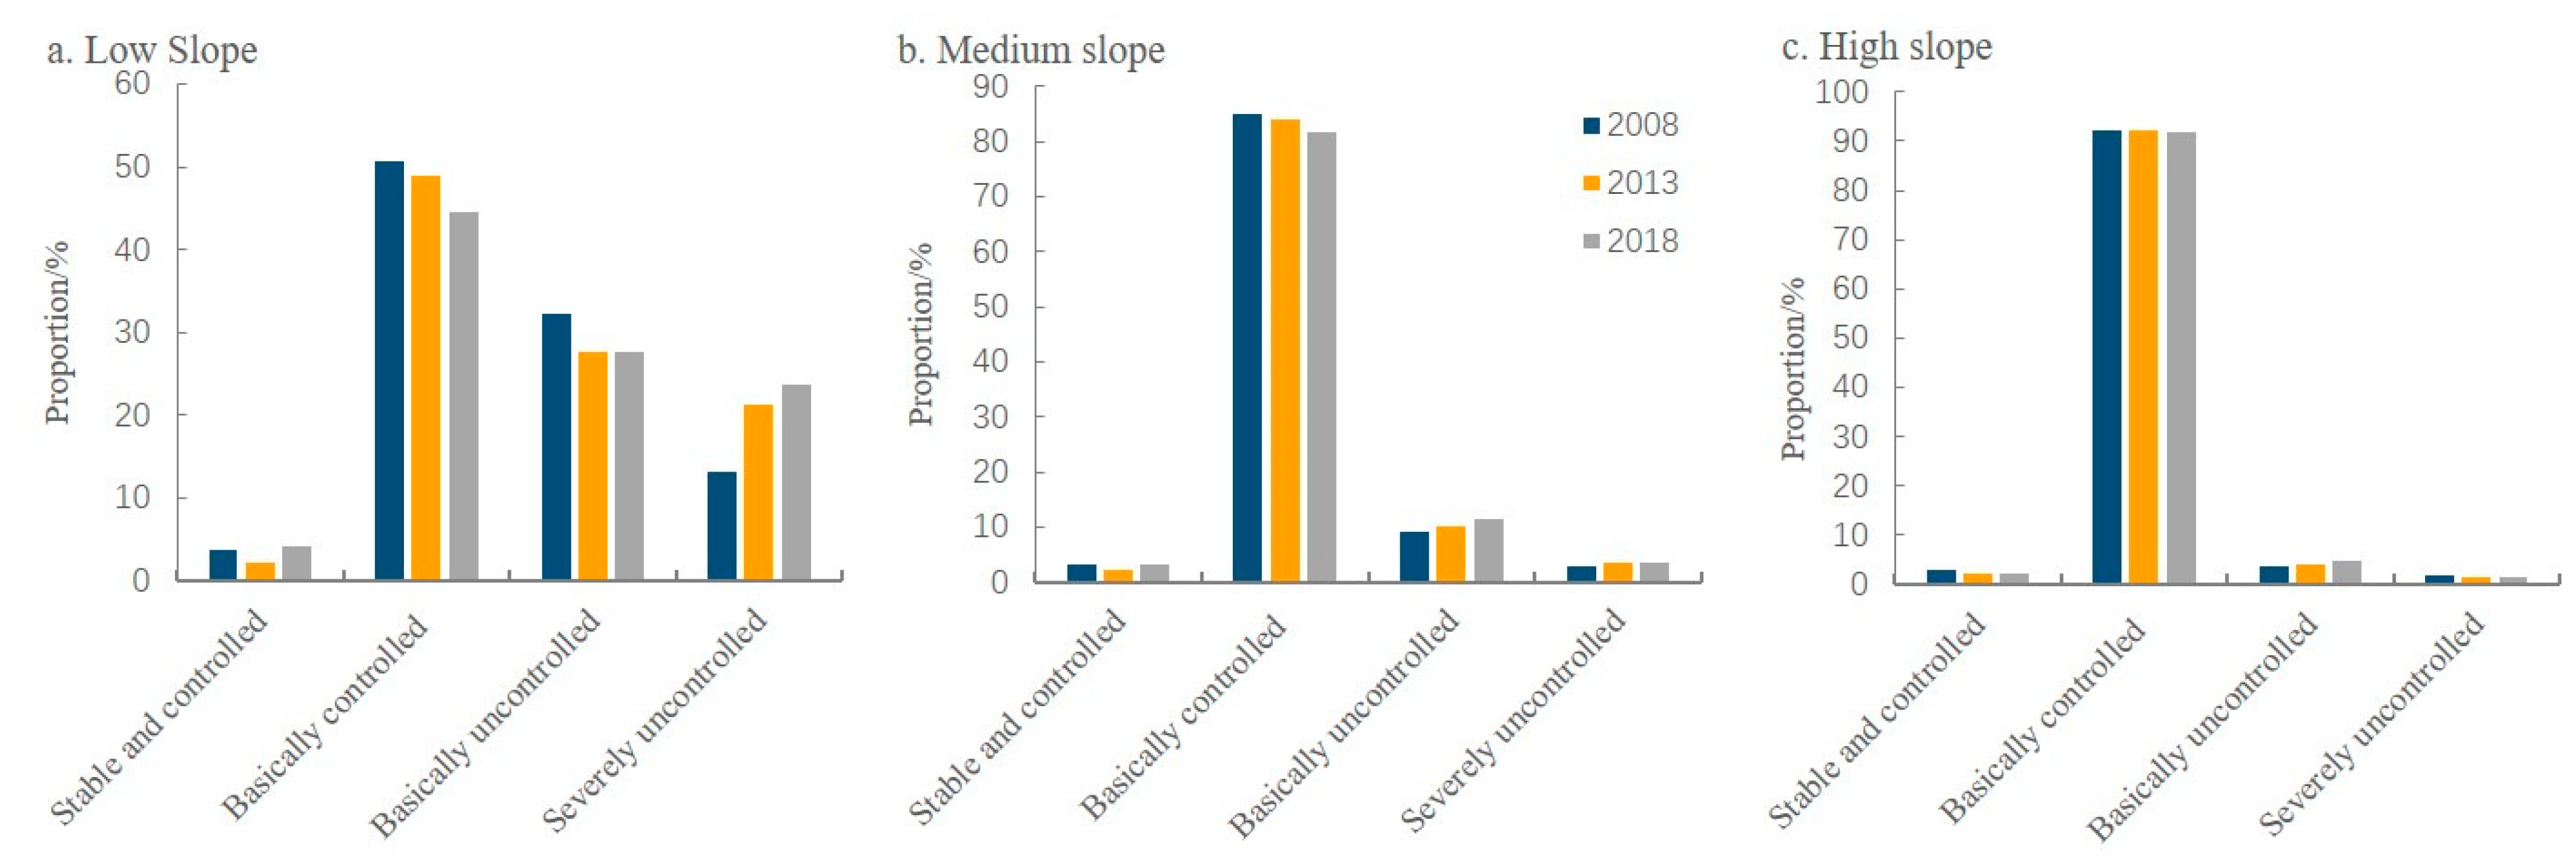
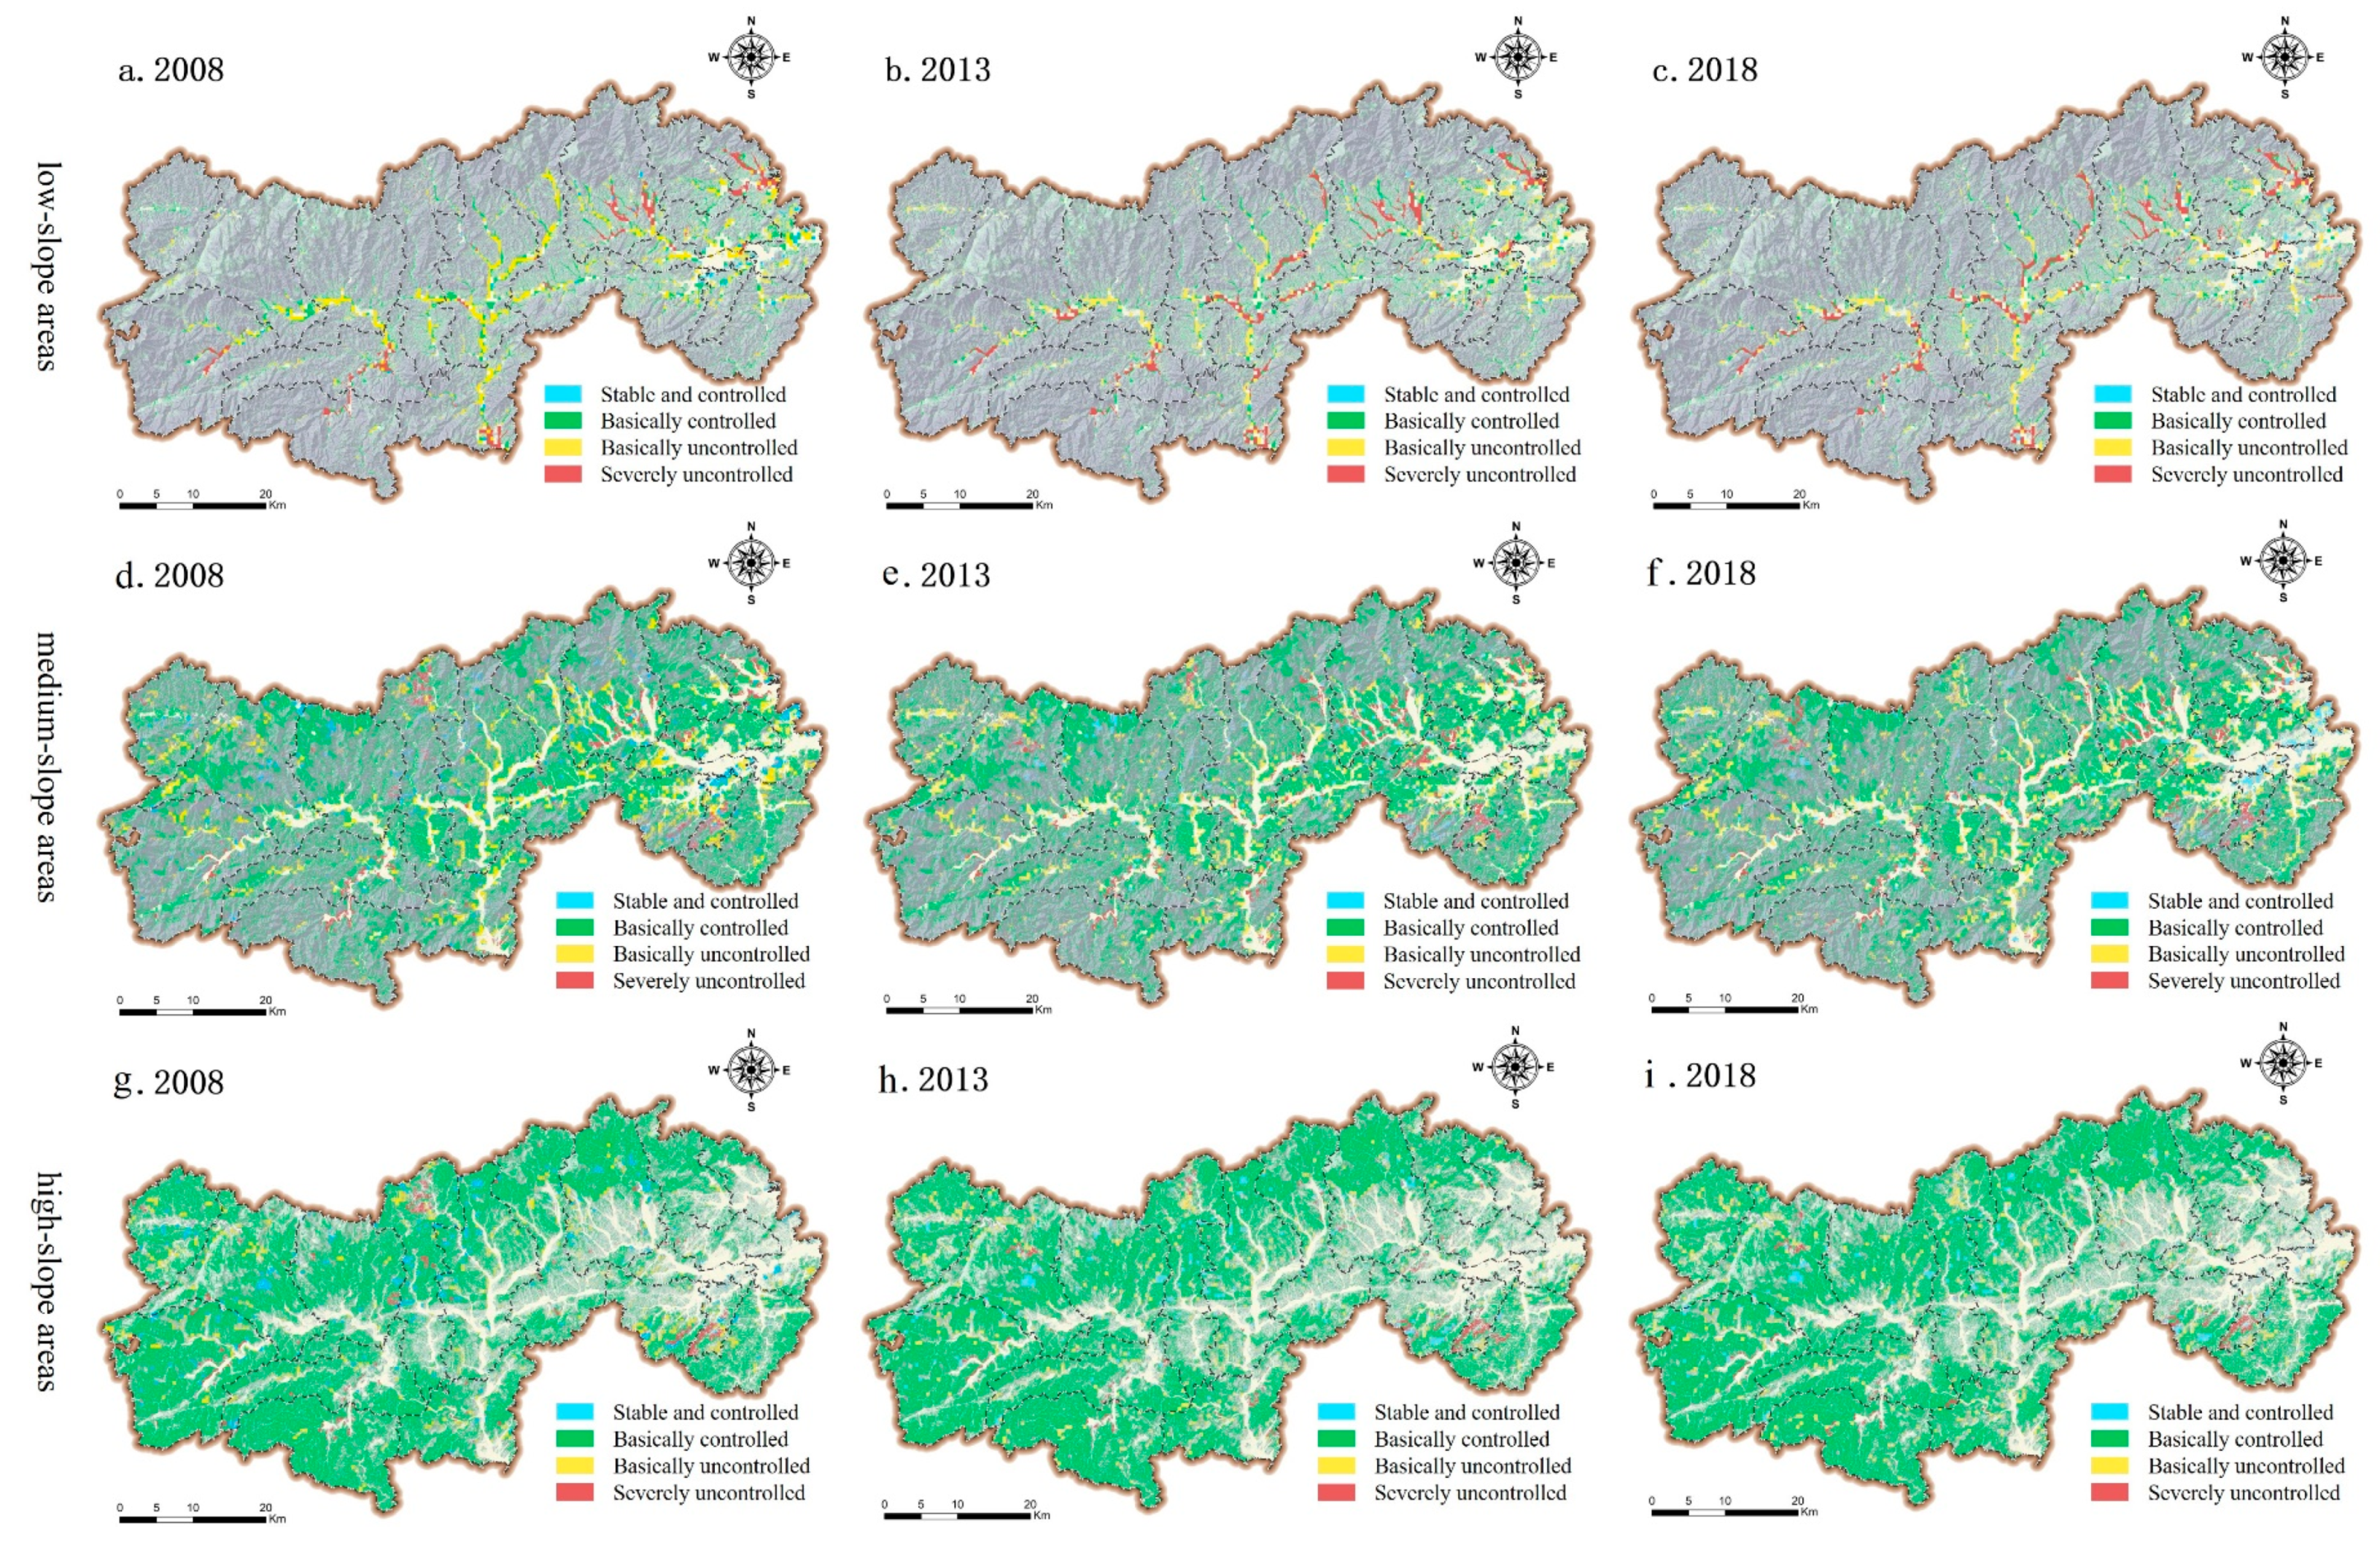
4.3. Topographic Gradient Feature of Potential Land-Use Conflict

To study the spatial-temporal differentiation of land-use conflict between agricultural space and ecological space under different topographic gradient conditions in Lin’an District, the slope factor was selected to analyze the topographic gradient characteristics of the areas with different conflict degrees.
The land-use conflict degree in the low-slope areas was the highest over the ten years (Figure 6). Controlled spatial units did not show an obvious advantage, and the proportion of uncontrolled spatial units increased over the 10 years. In 2018, more than half of the total low-slope area had an uncontrolled grade of land-use conflict. The degree of land-use conflict in the medium-slope area from 2008–2018 was low, but it showed an increasing trend. The proportion of basically controlled spatial units was maintained at higher than 80%, but it showed a downward trend because of the expansion of uncontrolled spatial units and was reduced by 3.12% in total. The degree of land-use conflict in the high-slope area was the lowest over the 10 years. The proportion of controlled spatial units remained between 93.85% and 94.88%, and the severely uncontrolled spatial units gradually became basically controlled spatial units, indicating that they became better controlled. The proportion of severely uncontrolled spatial units decreased continuously by 0.35% from 1.64% in 2008.

5. Discussion

5.1. Characteristics of Land-Use Conflict

It is important to carry out land-use conflict research to realize the coordinated development of regional agricultural space and ecological space, ease the pressure on land resources and human–land conflicts, establish a harmonious human–land relationship between production and ecology, and give full play to regional resource advantages for scientific development.
In this paper, a land-use conflict measurement model [35] was constructed to identify the land use conflict between agricultural space and ecological space taking Lin’an District in Hangzhou City, a hilly area in northern Zhejiang Province, as an example. The study found that although the conflict between agricultural space and ecological space in Lin’an District was generally controlled, there were also areas in which the conflict was uncontrolled due to the complex shape and high fragmentation of the patches [49]. The rapid development of the economy has resulted in the continuous expansion of agricultural land such as cultivated land and the occupation of ecological land such as forestland and grassland [50]. On the one hand, the increase in the output of agricultural production has led to the continuous expansion of agricultural land such as arable land and garden land, while large areas of ecological land such as water surface, woodland and pasture were occupied. On the other hand, as arable land with high slopes is not suitable for agricultural production, the arable land was abandoned and evolved into ecological land naturally, resulting in the phenomenon of the compound use of agricultural space and ecological space is more common in Lin’an. These changes have led to increasing degrees of conflict, the gradual expansion of uncontrolled areas, and the massive extrusion of controlled areas. Therefore, management measures should be implemented in time to prevent further deterioration and to ensure the overall balance and sustainable development of agriculture and ecology in Lin’an District.The main land types of agricultural space include arable land, garden land and other agricultural land, which are closely related to human activities and are, therefore, subject to more human activities, with increasing landscape fragmentation and consequent declines in land stability; therefore, their land-use conflicts are also higher [51]. Lin’an District has adopted strict ecological protection policies, delineating ecological red lines and focusing on protecting land with high ecological benefits such as water areas, and these protection policies have played an important role in promoting regional development. These conservation policies have played an important role in promoting the sustainable and healthy development of the region and alleviating the regional land-use conflicts.
The degree of land-use conflict (Figure 7) in Lin’an District is closely related to economic development, land use and other related factors [52]. As the process of urban–rural integration progressed, adjacent town streets showed high similarity in these aspects, and these similarities resulted in spatial autocorrelation in land-use conflict. The spatial aggregation effect of land use conflict in Lin’an District in 2013 was the most obvious. The overall spatial pattern was relatively stable over the 10 years, with no major changes. The spatial autocorrelation in the eastern region and in towns such as Qianchuan town and Heqiao town was significant due to the complexity of the land-use types.

5.2. Differences in Land-Use Conflict Gradients

To study the spatial and temporal land-use conflicts between agricultural and ecological spaces under different gradient conditions in Lin’an District, this paper selected the slope factor to analyze the topographic gradient characteristics of the conflicts.
The performance of uncontrolled conflicts was the most obvious in the low-slope area of Lin’an District, and the distribution of spatial units with basic controllable conflict levels in the areas with medium- and high- slopes had an absolute advantage.
The main land-use conflict categories in the low-slope area from 2008 to 2018 were arable land and water and were distributed in a band with Yu Qian town as the center. The uncontrolled conflict units in this area were more aggregated and gradually expanded to squeeze the controllable grade with the passage of time, and the degree of land-use conflict was increasingly intensified. This was due to the flat terrain, fertile soil and abundant water in the low- slope area of Lin’an District, which is suitable for human production activities. The increased intensity of land use makes the land structure ratio increasingly imbalanced, and the land use conflict is more serious [53].
The main land types of land-use conflicts in the medium-slope region from 2008 to 2018 were mainly forestland, and the spatial units of the basic controllable conflict levels were the most widely distributed and fragmented. The spatial units of the uncontrollable grade were also scattered, mainly distributed at the junction of the medium-slope and low-slope areas, and showed a gradual expansion trend. This is because the production conditions in the medium-slope areas are inferior to those in the low-slope areas, their land-use conflicts are more moderate, and the proportion of land-use structure is more reasonable [54].
High-slope areas had forestland and grassland as the main land types from 2008 to 2018, which were concentrated in the central and western areas. Spatial units with basic controllable conflict levels occupied the majority of the distribution and had a high degree of contiguity. The spatial units with severe uncontrollable conflict grades were scattered, and the distribution area gradually decreased; only in Jinan Street in 2018 was there a more obvious performance. This is due to the steep terrain and inconvenient transportation in the high-slope area, which is not suitable for production activities; in addition, the current land risk in the high-slope area is low, and the scale and pattern of the regional landscape are well protected [55].

5.3. Trade-off Mechanisms in Land-Use Conflict

Under the current territorial spatial planning system in China, the Lin’an District Government manages the territorial space mainly by preparing territorial spatial planning and delineating “three zones and three lines”. The “three zones” refer to ecological, agricultural and urban function spaces, and the “three lines” refer to the “three control lines” of ecological protection red line, permanent basic agricultural land and urban development boundary. It provides for special protection of arable land and strict control of conversion of arable land to other agricultural land such as forest, grassland and garden land. Land with important ecological functions or ecologically sensitive land should be designated ecological protection red line in accordance with the law and implement strict protection. Under the planning constraints, spatial conflicts between ecology and agriculture often do not occur in strictly controlled areas, but in the transition zone between ecology and agriculture or in the multi-appropriate areas for ecological and agricultural use. Based on the identification and analysis of land-use conflicts between agricultural space and ecological space in Lin’an District, the trade-off mechanisms for land-use conflict were identified as follows:
(1)
Optimizing land-use structure and improving land-use efficiency
To realize the sustainable development of its society, Lin’an District should strengthen environmental protections on the basis of ensuring the supply of production land. In addition, the district should continuously improve the efficiency of land resource utilization by adjusting the land resource utilization structure and implementing land recycling to realize a ‘win-win’ situation for production development and ecological protection.
Lin’an District should actively optimize its ecological structure on the basis of ensuring food security; return cultivated land with low production efficiency to forestland, grasslands and lakes; carry out afforestation and greening; increase landscape connectivity; reduce patch fragmentation; improve land stability; and enhance the quality of the natural environment and the suitability of the regional landscape ecology [56]. In areas with advantageous production conditions, Lin’an District should make effective use of the surrounding production resources. The government should actively promote regional agricultural restructuring and the reasonable cultivation of woodlands, grasslands and other ecological areas to ensure ecological security; cultivate agricultural lands appropriately for the actual local situation; build economic garden belts such as vegetable and fruit gardens; improve connectivity with existing agricultural lands; increase land-use efficiency; and slow the increase in land-use conflicts.
(2)
Coordinating land resource allocation and promoting coordinated regional development
Lin’an District should coordinate its resource elements, rationally allocate its land resources, optimize the structural proportion and spatial layout of the land, construct a balanced and unified spatial planning system, persist in ‘drawing a blueprint to the end’, continuously promote the integration of land resources, strengthen the optimal allocation of land resources, and achieve an efficient supply of land resources [57]. The terrain in Lin’an District is mainly hilly, and land-use conflict varied obviously with the difference of topography and geomorphology. According to the different characteristics of land-use conflicts, allocating land resources according to local conditions is of great significance to rational land development and utilization and can have substantive effects on promoting coordinated development in the region.
(3)
Clearing classification protection and implementing differential use control
Lin’an District should further refine and classify agricultural and ecological spaces based on the importance of their land functions and the policy protection level. This further classification could form a classification control system to determine the ‘red line’ for permanent basic farmland protection and the ‘bottom line’ for ecological protection, establish a classification-based spatial protection system, and improve the quality and stability of natural and agricultural ecosystems [58]. At the same time, strengthening the top-level design of controls on national territory use, refining the rules for the control of the differential uses of agricultural space and ecological space, and planning for and taking into account the functional attributes of different land resources as a whole are conducive to adapting to the existing management system and its daily regulatory needs as well as to promoting regional economic development.
(4)
Realizing multiple land values and improving the structural layout of industry
Land has multiple functional values, such as agricultural production and ecological services [59]. In the process of land development and utilization, the one-sided value of a certain function of land should not be evaluated alone; rather, multiple values of land should be considered together to maximize the benefit of land resources. Lin’an District has abundant resources, such as natural ecosystems and technological industries. It should make rational use of its resource advantages and follow the patterns of social development to perfect the land structure layout of primary, secondary and tertiary industries. The district should also actively carry out scientific and technological innovations, reduce industry dependence on land, improve land-use efficiency, and increase the land output rate and income of enterprises. Continuing to promote scientific and technological innovation, strengthening the development of industrial science and technology as well as the environment, and increasing the yield per mu through the cultivation of new scientific and technological industries will reduce land-use conflicts.
(5)
Adhering to people-oriented concepts and strengthening public messaging and guidance
The process of land resource allocation in Lin’an District should adhere to people-oriented concepts and comprehensively consider the production, ecological and other functions of land resources [60]. Through this process, the total interests of all land-use stakeholders can be maximized and the global optimum can be achieved. At the same time, policy makers should establish a benign interaction mechanism, strengthen information transmission and guidance, and strive to coordinate the interests of all parties. By allowing full participation of the majority of stakeholders and incorporating public feedback into the revision and improvement of the policy system in a timely manner, land-use conflicts can be effectively mitigated.
For its theoretical framework, this research applied the theory of conflict identification and evaluation to the process of land use management and constructed a theoretical framework for research on conflicts between agricultural space and ecological space. In practical applications, hilly areas are usually selected as research areas at the county scale. However, the identification of land-use conflict in agricultural space and ecological space involves many aspects of production and ecology, and there are some limitations to constructing conflict identification models by using the landscape ecological risk assessment method alone.
However, this paper does not take into account the theory of ecology-production-economy compound zones. This theory classifies human activities and land-use types by defining the types and restrictions of human activities and then defines two types of regional zones: urban tourism economic zones and urban production economic zones. Urban tourism economic zones are distributed in areas with convenient transportation and lifestyle amenities, and the tourist landscape is mainly a human-based landscape. Urban production economic zones are mainly paddy fields, which provide ecological value for cities and towns to some extent. The theory of ecology-production complex areas may provide a new interpretation of the current conflicts in the urban ecological agricultural environment. In the future, we should broaden the methods used in this study, further verify and refine the model, and generate results that are more scientific.

6. Conclusions

Taking Lin’an District in Hangzhou City in the hilly areas of northern Zhejiang Province as an example, this research constructed a measurement model for land-use conflict by using the landscape ecological risk assessment model method. The land-use conflicts between agricultural space and ecological space were identified and analyzed, and trade-off mechanisms for land-use conflict were proposed. The main conclusions are as follows:
Land-use conflicts are a direct driver of the changing land-use structure of agricultural and ecological spaces in Lin’an District. The degree of land-use conflict in Lin’an District from 2008 to 2018 was generally dominated by controlled conflict. However, with continuous urbanization, the degree of land-use conflict showed an increasing trend, the expansion trend of uncontrolled spatial units was clear, and the distribution area of controlled spatial units decreased continuously.
The comprehensive index of land-use conflict showed significant and positive global spatial autocorrelation and clear spatial aggregation effects at the 99.9% confidence level. Except for the non-significant spatial units, the other spatial units were mainly highly aggregated (p = 0.05), and the spatial unit clustering and significance for land-use conflict were the most prominent in 2013.
The characteristics of land-use conflict were obviously different among areas with different topographies. The conflict levels in the low-, medium- and high-slope areas were all dominated by basic controllability. The slope was negatively correlated with the degree of land-use conflict, with uncontrolled conflict being most evident on low slopes and the distribution of basically controllable spatial units being absolutely dominant on medium and high slopes.
To characterize land-use conflict in Lin’an District, this research proposed specific trade-off mechanisms of land-use conflict from five perspectives. These mechanisms provide a theoretical basis and practical support for the control of conflicts between agricultural space and ecological space.

Author Contributions

Conceptualization, J.Z. and M.G.; methodology, J.Z., and M.G.; software, Y.C.; formal analysis, J.Z.; writing-original draft preparation, J.Z.; writing-review and editing, Y.C., C.Z.; B.H.; and M.G.; writing-review and editing, Y.C., C.Z, and M.G. All authors have read and agreed to the published version of the manuscript.

Funding

This work was financially supported by the Project Supported by the Open Fund of Key Laboratory of Urban Land Resources Monitoring and Simulation, Ministry of Natural Resources (KF-2020-05-073), the Project Supported by the Open Fund of Technology Innovation Center for Land Spatial Eco-restoration a Metropolitan Area, Ministry of Natural Resources (CXZX202010), supported by the Fundamental Research Funds for the Central Universities (2021QN81014).

Conflicts of Interest

The authors declare no conflict of interest.

References

  1. Wang, X.; He, J.; Wang, B.; Zhang, X. Thoughts and practice of ecological protection and restoration of mountains, rivers, forests, farmlands, lakes and grasslands. J. Landsc. Res. 2020, 3, 5–8. [Google Scholar]
  2. Wen, D. A preliminary discussion on agroecosystems and agro-landscapes. Rural. Eco-Environ. 1990, 3, 52–55. [Google Scholar]
  3. Yu, Z.; Hu, X. Research on the relation of food security and cultivated land’s quantity and quality in China. Geogr. Geo-Inf. Sci. 2003, 19, 45–49. [Google Scholar]
  4. Lin, Y.; Fan, J.; Wen, Q.; Liu, S.; Li, B. Primary exploration of ecological theories and technologies for delineation of ecological redline zones. Acta Ecol. Sin. 2016, 36, 1244–1252. [Google Scholar]
  5. Yi, D.; Zhao, X.; Guo, X.; Han, Y.; Jiang, Y.; Lai, X.; Huang, X. Study on the spatial characteristics and intensity factors of “three-line conflict” in Jiangxi province. J. Nat. Resour. 2020, 35, 2428. [Google Scholar]
  6. Gao, W. Research on Tourist Island Landscape Function Conflict Trade—Focus on Dongshan Island in Fujian Province. Master’s Thesis, Huaqiao University, Quanzhou, China, 2016. [Google Scholar]
  7. Brown, G.; Raymond, C.M. Methods for identifying land use conflict potential using participatory mapping. Landsc. Urban Plan. 2014, 122, 196–208. [Google Scholar] [CrossRef]
  8. Henderson, S.R. Managing land-use conflict around urban centres: Australian poultry farmer attitudes towards relocation. Appl. Geogr. 2005, 25, 97–119. [Google Scholar] [CrossRef]
  9. Sadomba, W.Z. Retrospective community mapping: A tool for community education. PLA NOTES 1996, 9–13. Available online: https://pubs.iied.org/sites/default/files/pdfs/migrate/G01610.pdf (accessed on 23 September 2021).
  10. Zhang, Q. Research on the Implementation Plan Model of Public-Private Partnership Project Based on Logical Framework Approach. Master’s Thesis, Chongqing University, Chongqing, China, 2017. [Google Scholar]
  11. Shao, X.; Hu, Y. Conflict and balance between farmland ownership and income rights: A theoretical analysis framework for realizing farmers’ land property rights. Macroecon. Res. 2016, 12, 3–13. [Google Scholar]
  12. Sekeris, P.; Luca, D.G. Land inequality and conflict intensity. Public Choice 2011, 150, 119–135. [Google Scholar]
  13. Becker, N.; Easter, K.W. Water diversion from the Great Lakes: Is a cooperative approach possible? Int. J. Water Resour. Dev. 1997, 13, 53–66. [Google Scholar] [CrossRef]
  14. Dunk, A.; Grêt-Regamey, A.; Dalang, T.; Hersperger, A.M. Defining a typology of peri-urban land-use conflicts–A case study from Switzerland. Landsc. Urban Plan. 2011, 101, 149–156. [Google Scholar] [CrossRef]
  15. Orr, A.; Mwale, B. Adapting to adjustment: Smallholder livelihood strategies in Southern Malawi. World Dev. 2001, 29, 1325–1343. [Google Scholar] [CrossRef]
  16. Jiang, C.; Li, H. Study on post-evaluation of engineering supervision based on logical framework approach. J. Hefei Univ. Technol. Nat. Sci. 2008, 31, 248–252. [Google Scholar]
  17. Yu, B. Land Use Conflicts in the Urban Fringe: A Theoretical Framework and Case Studies. Ph.D. Thesis, Chinese Academy of Sciences, Beijing, China, 2006. [Google Scholar]
  18. Jiang, S.; Meng, J.; Zhu, L. Spatial and temporal analyses of potential land use conflict under the constraints of water resources in the middle reaches of the Heihe River. Land Use Policy 2020, 97, 104773. [Google Scholar] [CrossRef]
  19. Amman, H.M.; Duraiappah, A.K. Modeling instrumental rationality, land tenure and conflict resolution. Comput. Econ. 2001, 18, 251–257. [Google Scholar] [CrossRef]
  20. Duraiappah, A.K. Land Tenure, Land Use, Environment Degradation and Conflict Resolution: A PASIR Analysis for the Narok District, Kenya; IIED: London, UK, 2000. [Google Scholar]
  21. Deininger, K.; Castagnini, R. Incidence and impact of land conflict in Uganda. J. Econ. Behav. Organ. 2006, 60, 321–345. [Google Scholar] [CrossRef] [Green Version]
  22. Zeng, F.; Wei, Y. Study on the influencing factors of ecological conflict of urban land use in China—Take Guiyang as example. Reform. Strategy 2016, 9, 107–113. [Google Scholar]
  23. Lu, C.; Ittersum, M.; Rabbinge, R. A scenario exploration of strategic land use options for the Loess Plateau in northern China. Agric. Syst. 2004, 79, 145–170. [Google Scholar] [CrossRef]
  24. Kächele, H.; Dabbert, S. An economic approach for a better understanding of conflicts between farmers and nature conservationists—An application of the decision support system MODAM to the Lower Odra Valley National Park. Agric. Syst. 2002, 74, 241–255. [Google Scholar] [CrossRef]
  25. Torre, A.; Melot, R.; Magsi, H.; Bossuet, L.; Cadoret, A.; Caron, A.; Kolokouris, O. Identifying and measuring land-use and proximity conflicts: Methods and identification. SpringerPlus 2014, 3, 1–26. [Google Scholar] [CrossRef]
  26. Yang, Y.; Zhu, L. Theories and diagnostic methods of land use conflicts. Asian Agric. Res. 2013, 5, 63–70. [Google Scholar]
  27. Guan, D.; Chen, T.; He, X.; Luo, X.; Luo, L.; Deng, H. Spatial conflict type identification and its driving mechanism of land use in the three gorges reservoir area(Chongqing section). J. Chongqing Jiaotong Univ. (Nat. Sci.) 2019, 38, 65–71. [Google Scholar]
  28. Zheng, L.; Song, Z.; Yang, J. Study on the relief mechanism of land use conflict in mine-grain mixed zone from the perspective of social-ecological system. China Min. Mag. 2018, 27, 13–18, 32. [Google Scholar]
  29. Feng, C.; Cao, M.; Xie, T. Optimization of land use structure in Tongling city based on different ecological conservation scales. Geogr. Res. 2014, 33, 2217–2227. [Google Scholar]
  30. Yang, X. The Strategy Analysis of Profit Conflict and Planning Regulation in the Progress of Redevelopment of Urban Land. Master’s Thesis, Suzhou University of Science and Technology, Suzhou, China, 2014. [Google Scholar]
  31. Zhou, D.; Xu, J.; Wang, L. Land use spatial conflicts and complexity: A case study of the urban agglomeration around HangZhou Bay, China. Geogr. Res. 2015, 34, 1630–1642. [Google Scholar]
  32. Ran, N.; Jin, X.; Fan, Y.; Xiang, X.; Liu, J.; Zhou, Y. Three Lines delineation based on land use conflict identification and coordination in Jintan district, Changzhou. Resour. Sci. 2018, 40, 284–298. [Google Scholar]
  33. Lin, G.; Jiang, D.; Fu, J.; Cao, C.; Zhang, D. Spatial conflict of production-living-ecological space and sustainable-development scenario simulation in Yangtze River delta agglomerations. Sustainability 2020, 12, 2175. [Google Scholar] [CrossRef] [Green Version]
  34. Zhou, D.; Lin, Z.; Lim, S.H. Spatial characteristics and risk factor identification for land use spatial conflicts in a rapid urbanization region in China. Environ. Monit. Assess. 2019, 191, 1–22. [Google Scholar] [CrossRef] [PubMed]
  35. Pei, B.; Pan, T. Land use system dynamic modeling: Literature review and future research direction in China. Prog. Geogr. 2010, 29, 1060–1066. [Google Scholar]
  36. Liao, W.; Dai, W.; Chen, J.; Huang, W.; Jiang, F.; Hu, Q. Spatial conflict between ecological-production-living spaces on Pingtan Island during rapid urbanization. Resour. Sci. 2017, 39, 1823. [Google Scholar]
  37. Peng, J.; Zhou, G.; Tang, C.; He, Y. The analysis of spatial conflict measurement in fast urbanization region based on ecological security: A case study of Changsha-Zhuzhou-Xiangtan urban agglomeration. J. Nat. Resour. 2012, 27, 1507–1517. [Google Scholar]
  38. Ma, W.; Jiang, G.; Chen, Y.; Qu, Y.; Zhou, T.; Li, W. How feasible is regional integration for reconciling land use conflicts across the urban–rural interface? Evidence from Beijing-Tianjin-Hebei metropolitan region in China. Land Use Policy 2020, 92, 104433. [Google Scholar] [CrossRef]
  39. Jiang, S.; Meng, J.; Zhu, L.; Cheng, H. Spatial-temporal pattern of land use conflict in China and its multilevel driving mechanisms. Sci. Total. Environ. 2021, 801, 149697. [Google Scholar] [CrossRef]
  40. Song, Z.; Yu, L.; Li, T. A study on the generalised space of urban–rural integration in Beijing suburbs during the present day. Urban Stud. 2015, 52, 2581–2598. [Google Scholar] [CrossRef]
  41. Sun, P.; Xu, Y.; Wang, S. Terrain gradient effect analysis of land use change in poverty area around Beijing and Tianjin. Trans. Chin. Soc. Agric. Eng. 2014, 30, 277–288. [Google Scholar]
  42. Pimm, S.L. The complexity and stability of ecosystems. Nature 1984, 307, 321–326. [Google Scholar] [CrossRef]
  43. Fan, J.; Wang, Y.; Zhou, Z.; You, N.; Meng, J. Dynamic ecological risk assessment and management of land use in the middle reaches of the Heihe River based on landscape patterns and spatial statistics. Sustainability 2016, 8, 536. [Google Scholar] [CrossRef] [Green Version]
  44. Zhou, G.; Peng, J. The evolution characteristics and influence effect of spatial conflict: A case study of Changsha-Zhuzhou-Xiangtan urban agglomeration. Prog. Geogr. 2012, 31, 717–723. [Google Scholar]
  45. Li, W.; Zhu, C.; Wang, H.; Xu, B. Multi-scale spatial autocorrelation analysis of cultivated land quality in Zhejiang province. Trans. Chin. Soc. Agric. Eng. 2016, 32, 239–245. [Google Scholar]
  46. Liu, Y.; Li, Y.; Yi, X.; Cheng, X. Spatial evolution of land use intensity and landscape pattern response of the typical basins in Guizhou Province, China. Ying Yong Sheng Tai Xue Bao J. Appl. Ecol. 2017, 28, 3691–3702. [Google Scholar]
  47. Cressie, N.; Kang, E.L. Hot enough for you? A spatial exploratory and inferential analysis of North American climate-change projections. Math. Geosci. 2016, 48, 107–121. [Google Scholar] [CrossRef] [Green Version]
  48. Xie, H. Spatial characteristic analysis of land use eco-risk based on landscape structure: A case study in the Xingguo County, Jiangxi Province. China Environ. Sci. 2011, 31, 688–695. [Google Scholar]
  49. Dai, Z. Land Use Characteristics and Conflict Evaluation of Ecological-Production-Living Space in Hilly and Mountainous Areas. Master’s Thesis, Southwest University, Chongqing, China, 2019. [Google Scholar]
  50. Liu, J. Study on the Evolution and Formation Mechanism ofLand Use Conflict in Institutional Ecological Space—Take the Southern Mountain Area of Jinan City as an Example. Master’s Thesis, Shandong Jianzhu University, Jinan, China, 2018. [Google Scholar]
  51. Chen, L.; Fu, B. Analysis of impact of Human activity on landscape structiure in yellow river delta-a case study of dongying region. Acta Ecol. Sin. 1996, 16, 337–344. [Google Scholar]
  52. Yang, Y.; Zhu, L. The theory and diagnostic methods of land use conflicts. Resour. Sci. 2012, 34, 1134–1141. [Google Scholar]
  53. Li, J.; Lü, Z.; Shi, X.; Li, Z. Spatiotemporal variations analysis for land use in Fen River Basin based on terrain gradient. Trans. Chin. Soc. Agric. Eng. 2016, 32, 230–236. [Google Scholar]
  54. Zhao, Y.; Cao, J.; Zhang, X.; He, G. Topographic gradient effect and spatial pattern of land use in Baota District. Arid. Land Geogr. 2020, 43, 1307–1315. [Google Scholar]
  55. Yang, B.; Wang, Z.; Yao, X.; Zhang, L. Terrain gradient effect and spatial structure characteristics of land use in mountain areas of northwestern hubei province. Resour. Environ. Yangtze Basin 2019, 28, 313–321. [Google Scholar]
  56. Cui, S.; Liu, Q.; Wang, J. Scale effect of landscape pattern index and its response to land use change in the coastal development zone: A case study of Dafeng city in Jiangsu province. Geogr. Geo-Inf. Sci. 2016, 32, 87–93. [Google Scholar]
  57. The Communist Party of China Central Committee and the State Council. A Guideline on Establishing a National Territory Spatial Planning System and Supervision of Its Implementation; People’s Publishing House: Beijing, China, 2019. [Google Scholar]
  58. Wei, X.; Kai, X.; Wang, Y.; Yu, H. Discussions on the methods of “three zones and three lines” implementation at the spatial levels of city and county based on “double evaluations”. City Plann. Rev. 2019, 43, 10–20. [Google Scholar]
  59. Zhen, L.; Cao, S.; Wei, Y.; Xie, G.; Li, F.; Yang, L. Land use functions: Conceptual framework and application for China. Resour. Sci. 2009, 31, 544–551. [Google Scholar]
  60. Yang, Y.; Liu, Y.; Zhu, L. Theories and methods on trade-offs of land-use conflicts. Areal Res. Dev. 2013, 31, 171–176. [Google Scholar]
Figure 1. Geographic location of Lin’an District.
Land 10 01011 g001
Figure 2. The degrees of land-use conflict between agricultural and ecological spaces in Lin’an District, 2008–2018. (a) 2008. (b) 2013. (c) 2018.
Land 10 01011 g002
Figure 3. Changes in the local spatial autocorrelation of land-use conflict in Lin’an District, 2008–2018. (a) Clustering results. (b) Significant results.
Land 10 01011 g003
Figure 4. Local spatial autocorrelation of potential land-use conflict in Lin’an District, 2008–2018. (a) 2008. (b) 2013. (c) 2018.
Land 10 01011 g004
Figure 5. Significant results for local spatial autocorrelation of potential land-use conflict in Lin’an District. (a) 2008. (b) 2013. (c) 2018.
Land 10 01011 g005
Figure 6. Changes in the degree of land-use conflict in areas with different slopes in Lin’an District, 2008–2018. (a) Low slope. (b) Medium slope. (c) High slope.
Land 10 01011 g006
Figure 7. Spatial distribution of potential land-use conflict between agricultural and ecological spaces in low-, medium- and high-slope areas. (a) 2008 low-slope areas. (b) 2013 low-slope areas. (c) 2018 low-slope areas. (d) 2008 medium-slope areas. (e) 2013 medium-slope areas. (f) 2018 medium-slope areas. (g) 2008 high-slope areas. (h) 2013 high-slope areas. (i) 2018 high-slope areas.
Land 10 01011 g007
Table 1. Assessment of the landscape fragility of agricultural spaces and ecological spaces in Lin’an District.
Space TypeLand-Use TypeLandscape Fragility Value
Agricultural spaceCultivated land3
Garden land5
Other agricultural land1
Ecological spaceForestland2
Grassland4
Water area6
Nature Reserve7
Table 2. Changes in the degree of land-use conflict between agricultural and ecological spaces in Lin’an District, 2008–2018.
Conflict GradeConflict ValueNumber of Spatial UnitsPercentage of Spatial UnitsChange Rate
2008201320182008201320182008–20132013–2018
Stable and controlled0~0.43682683223.092.262.73−0.830.47
Basically controlled0.4~0.610,16310,060984385.2484.8483.46−0.4−1.38
Basically uncontrolled0.6~0.81006104311298.448.809.570.360.77
Severely uncontrolled0.8~1.03854875003.234.104.240.870.14
Total11,92211,85811,794100.00100.00100.000.000.00
Table 3. Changes in the global spatial autocorrelation of land-use conflict in Lin’an District, 2008–2018.
ValueVariance Value
2008201320182008–20132013–2018
Moran’s I0.2380.2530.2320.015−0.021
Z51.79252.97048.6801.178−4.290
P0.0010.0010.0010.0000.000
Publisher’s Note: MDPI stays neutral with regard to jurisdictional claims in published maps and institutional affiliations.

