
Comparison on Land-Use/Land-Cover Indices in Explaining Land Surface Temperature Variations in the City of Beijing, China


Abstract
:1. Introduction
2. Materials and Methods
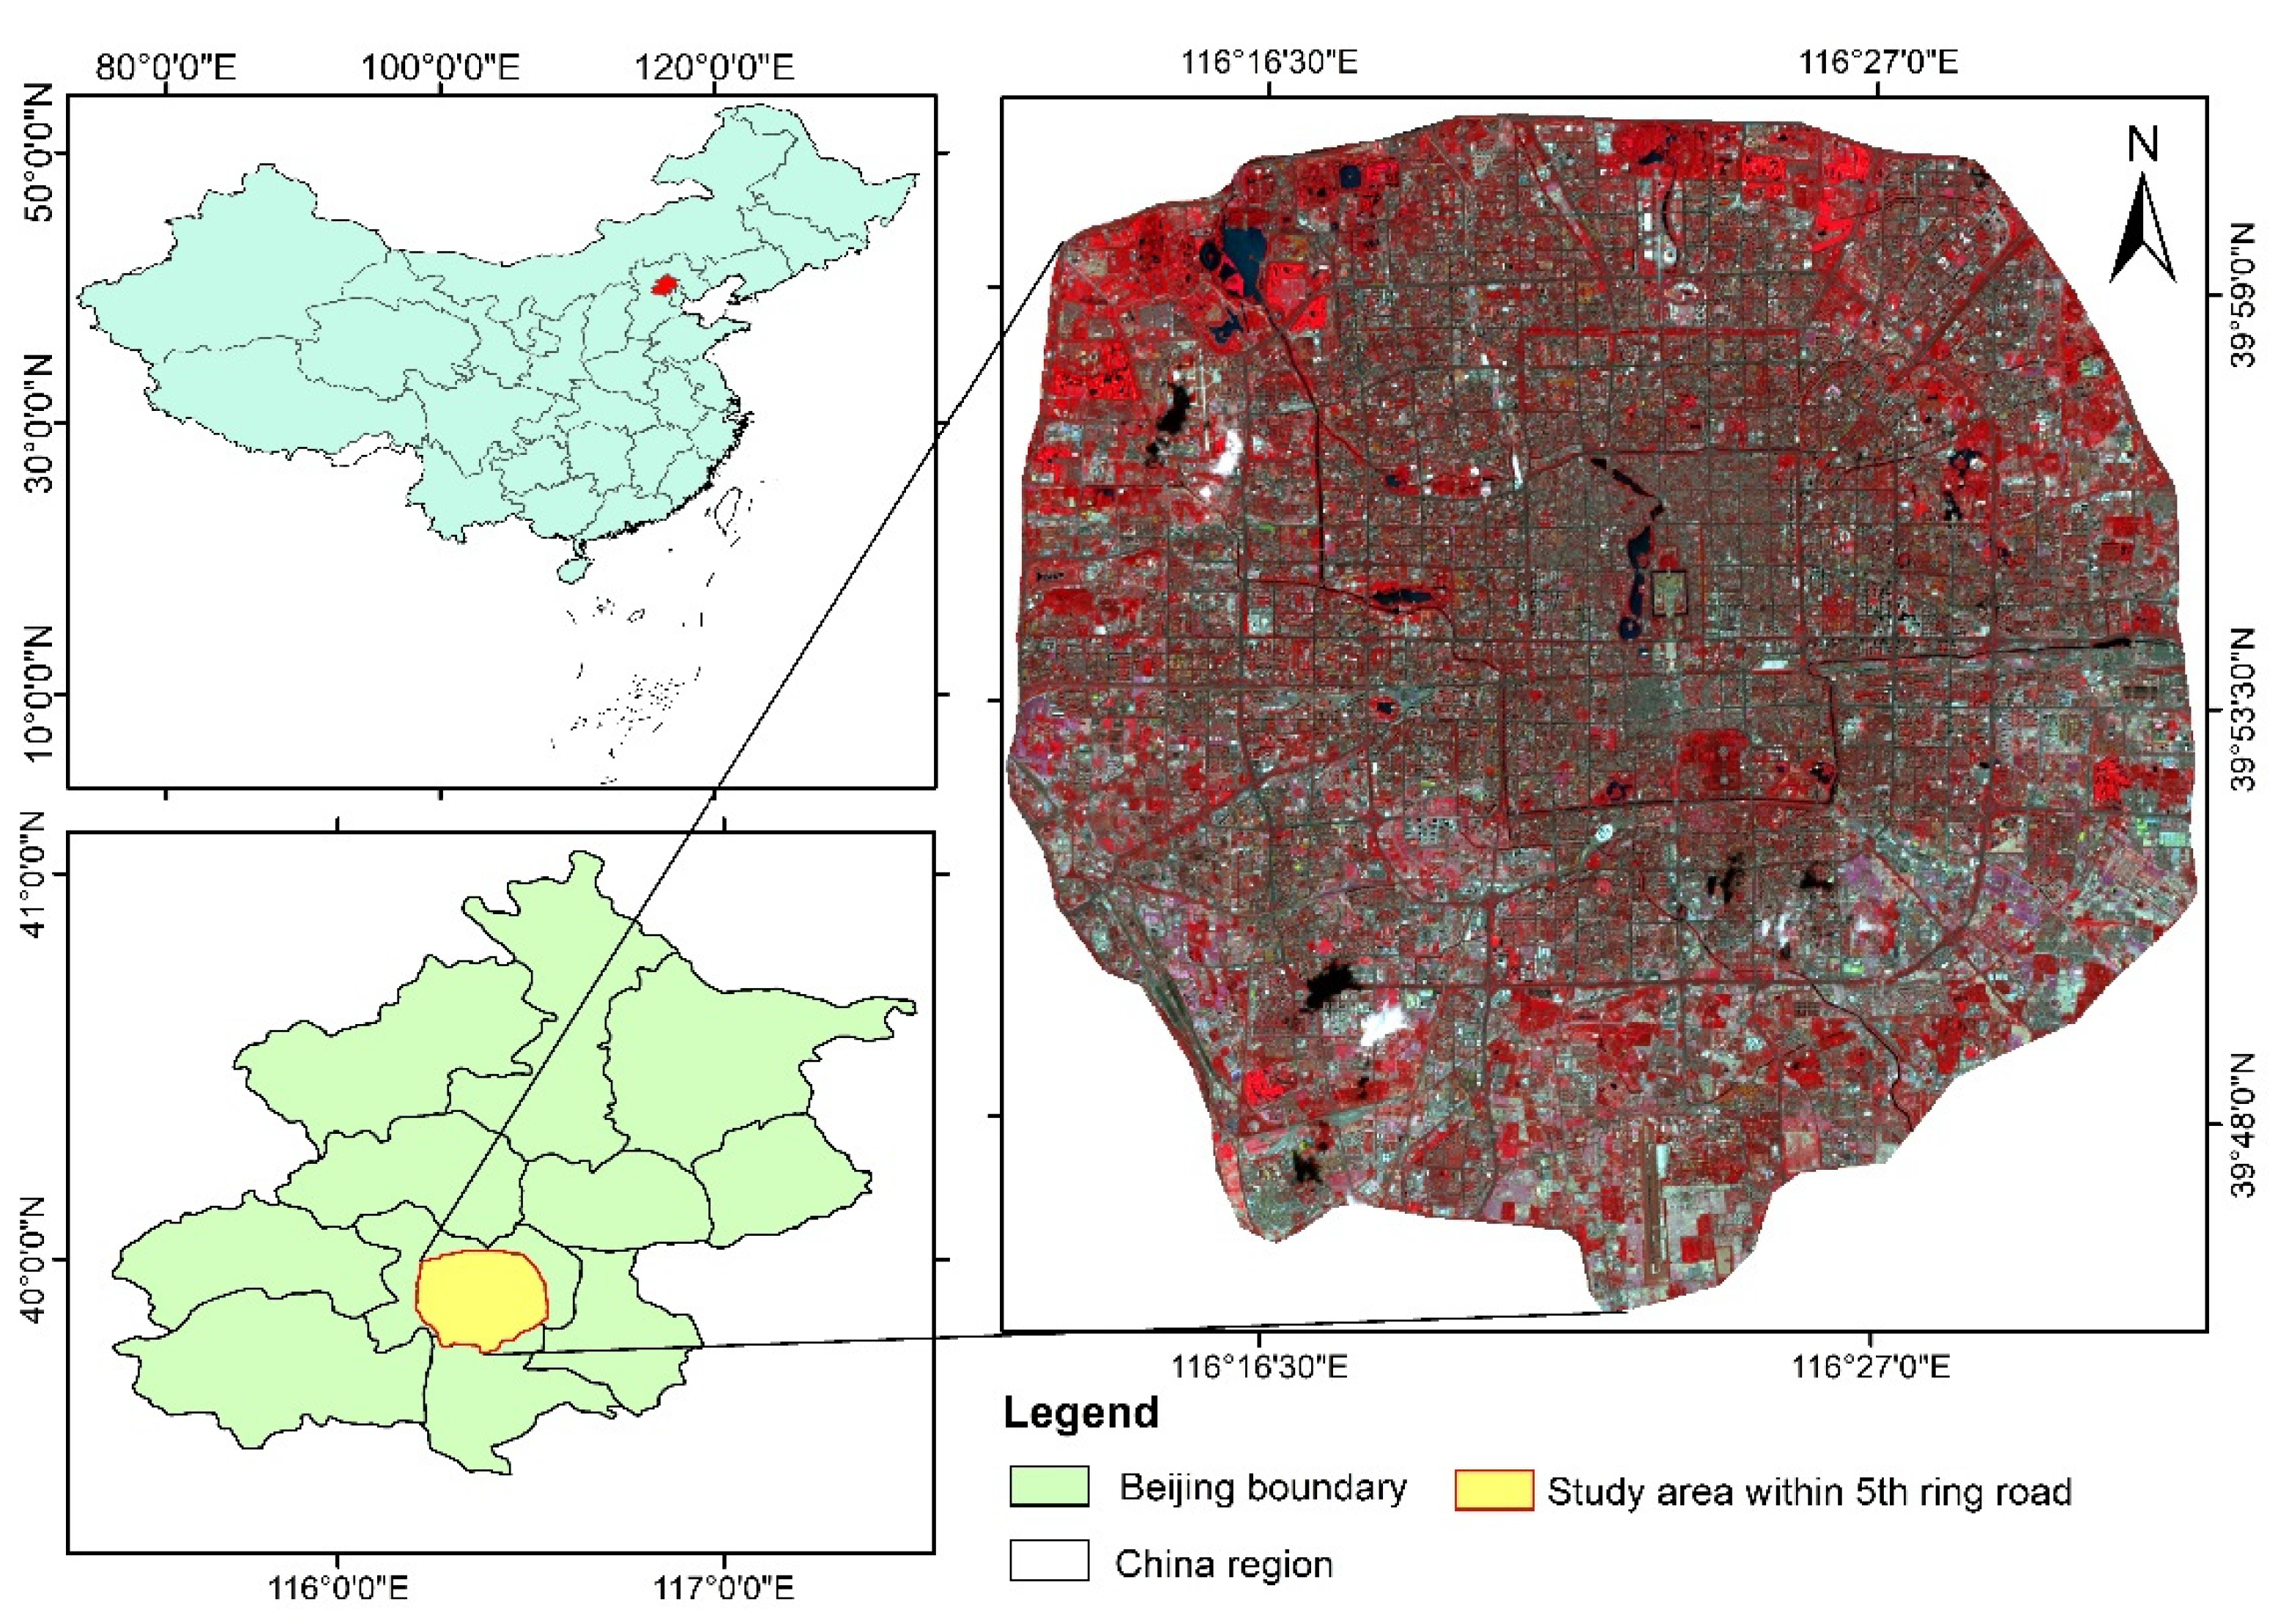
2.1. Study Area
2.2. Remote Sensing Data
2.3. LULC Classification and Accuracy Assessment
2.4. Land Surface Temperature (LST) Retrieval
2.4.1. Brightness Temperature (TB)
2.4.2. Land Surface Emissivity (LSE)
2.4.3. NDVI Threshold
2.5. Urban LULC Indices Retrieval
2.6. Comparison of LULC, LULC Indices, and LST along the Transects
2.7. Statistical Analysis
2.8. Assessing Temperature Mitigation of Land Cover
3. Results
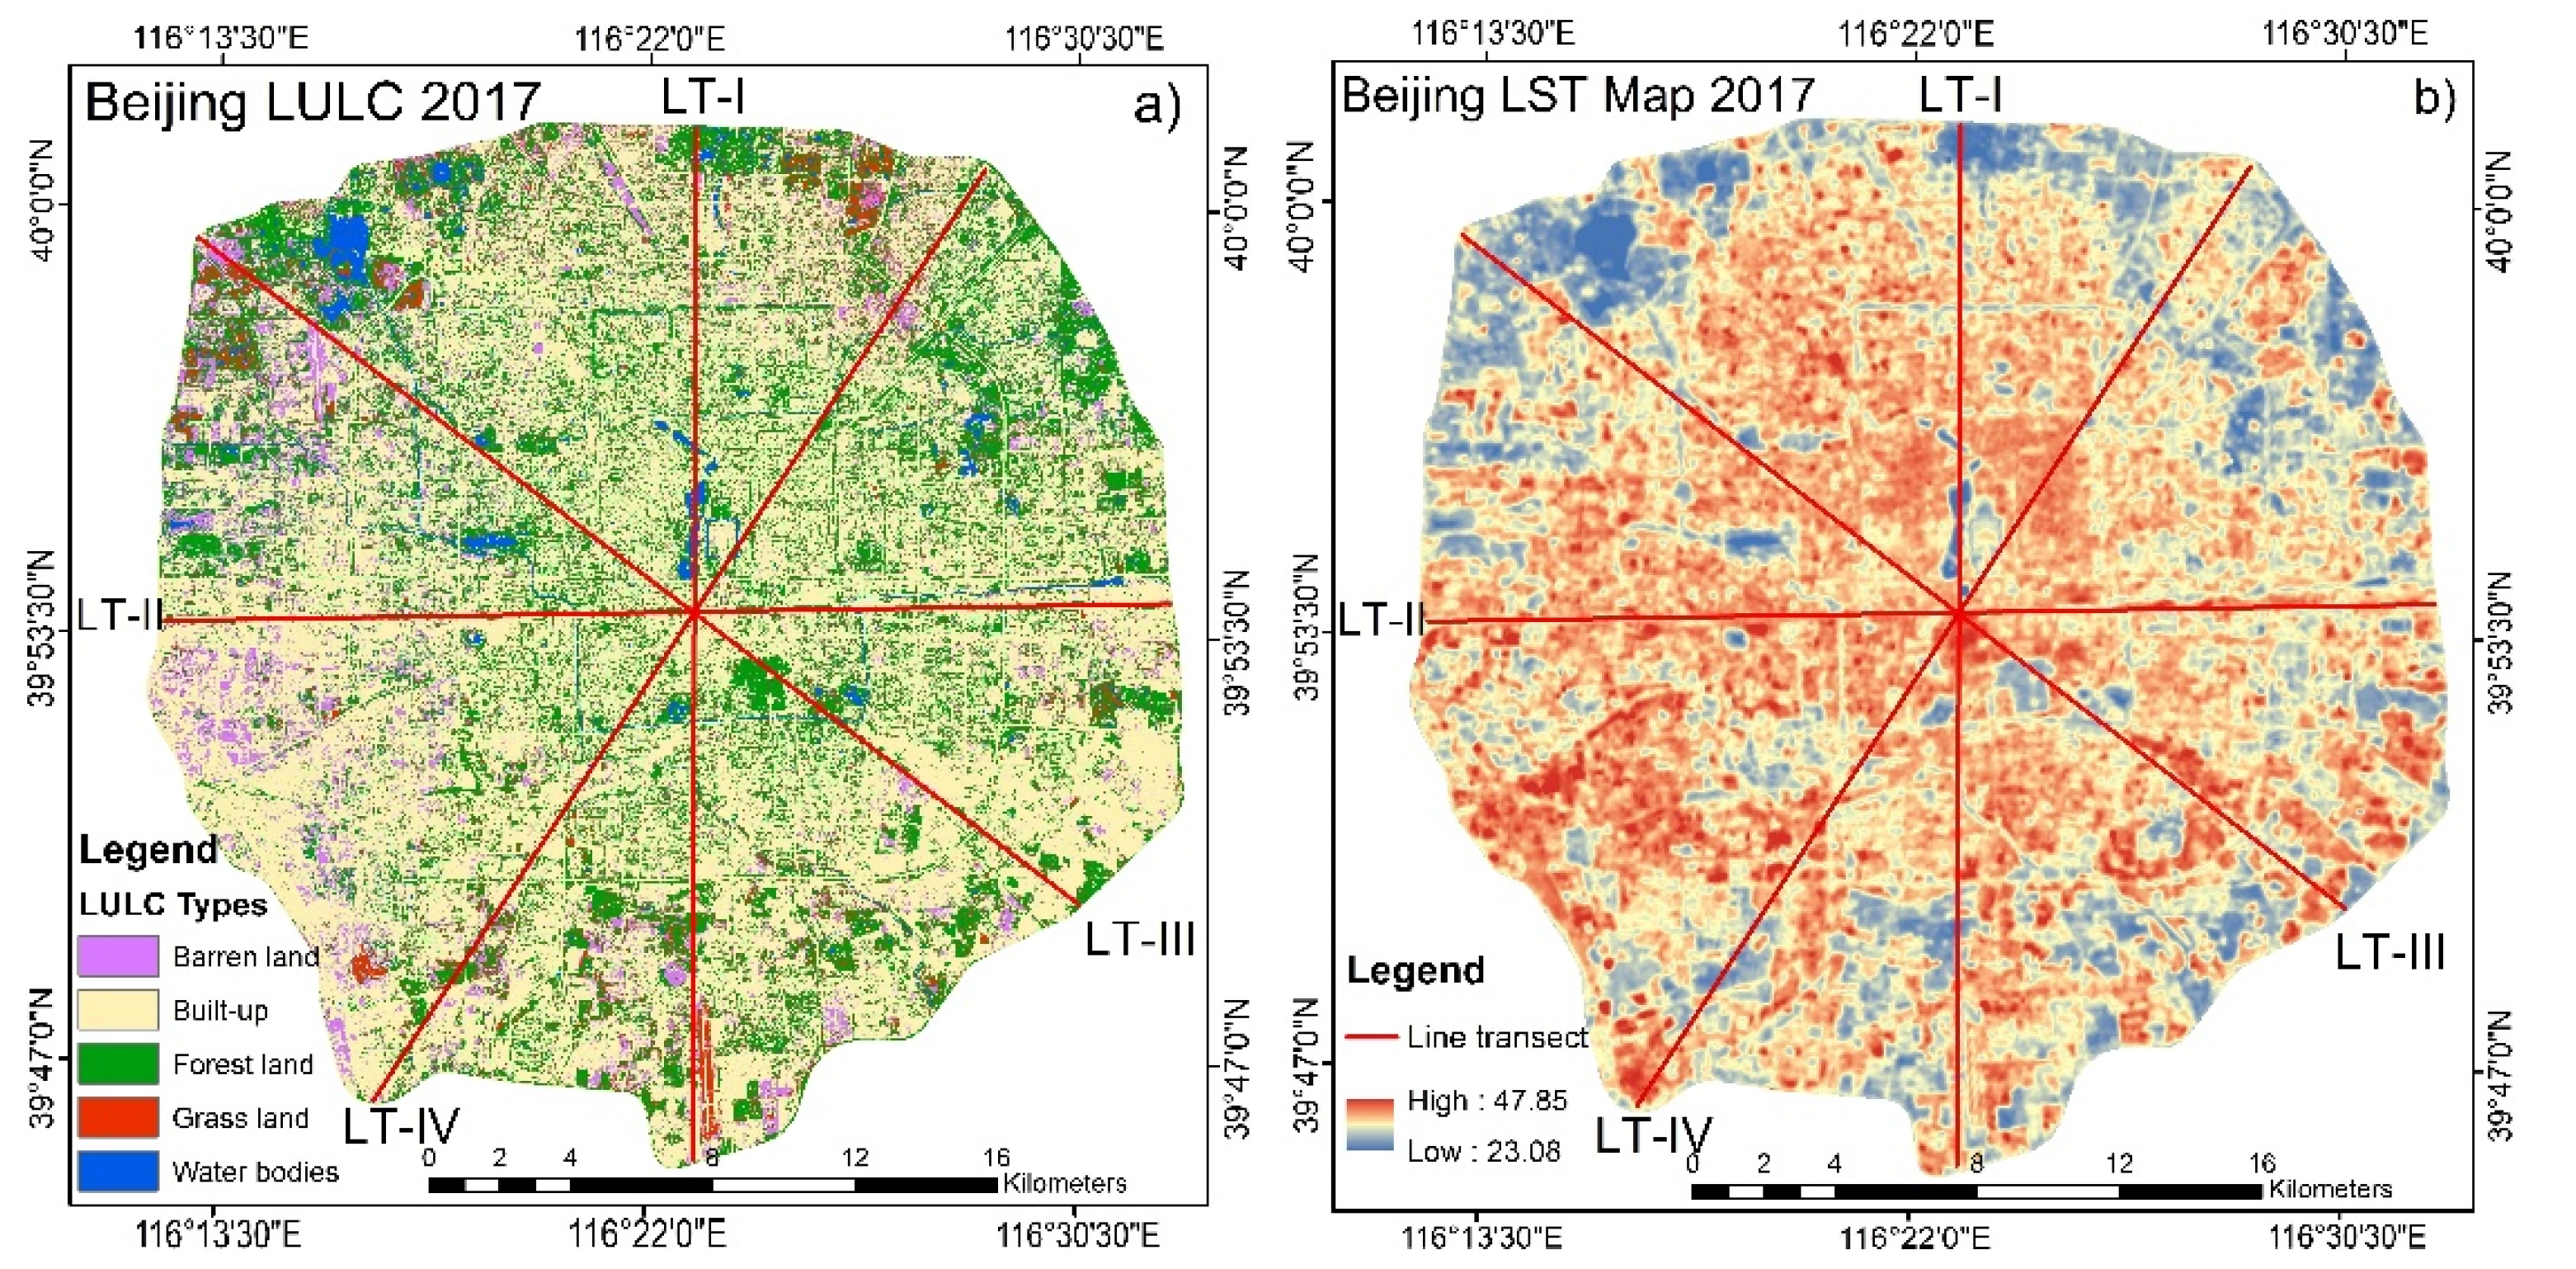
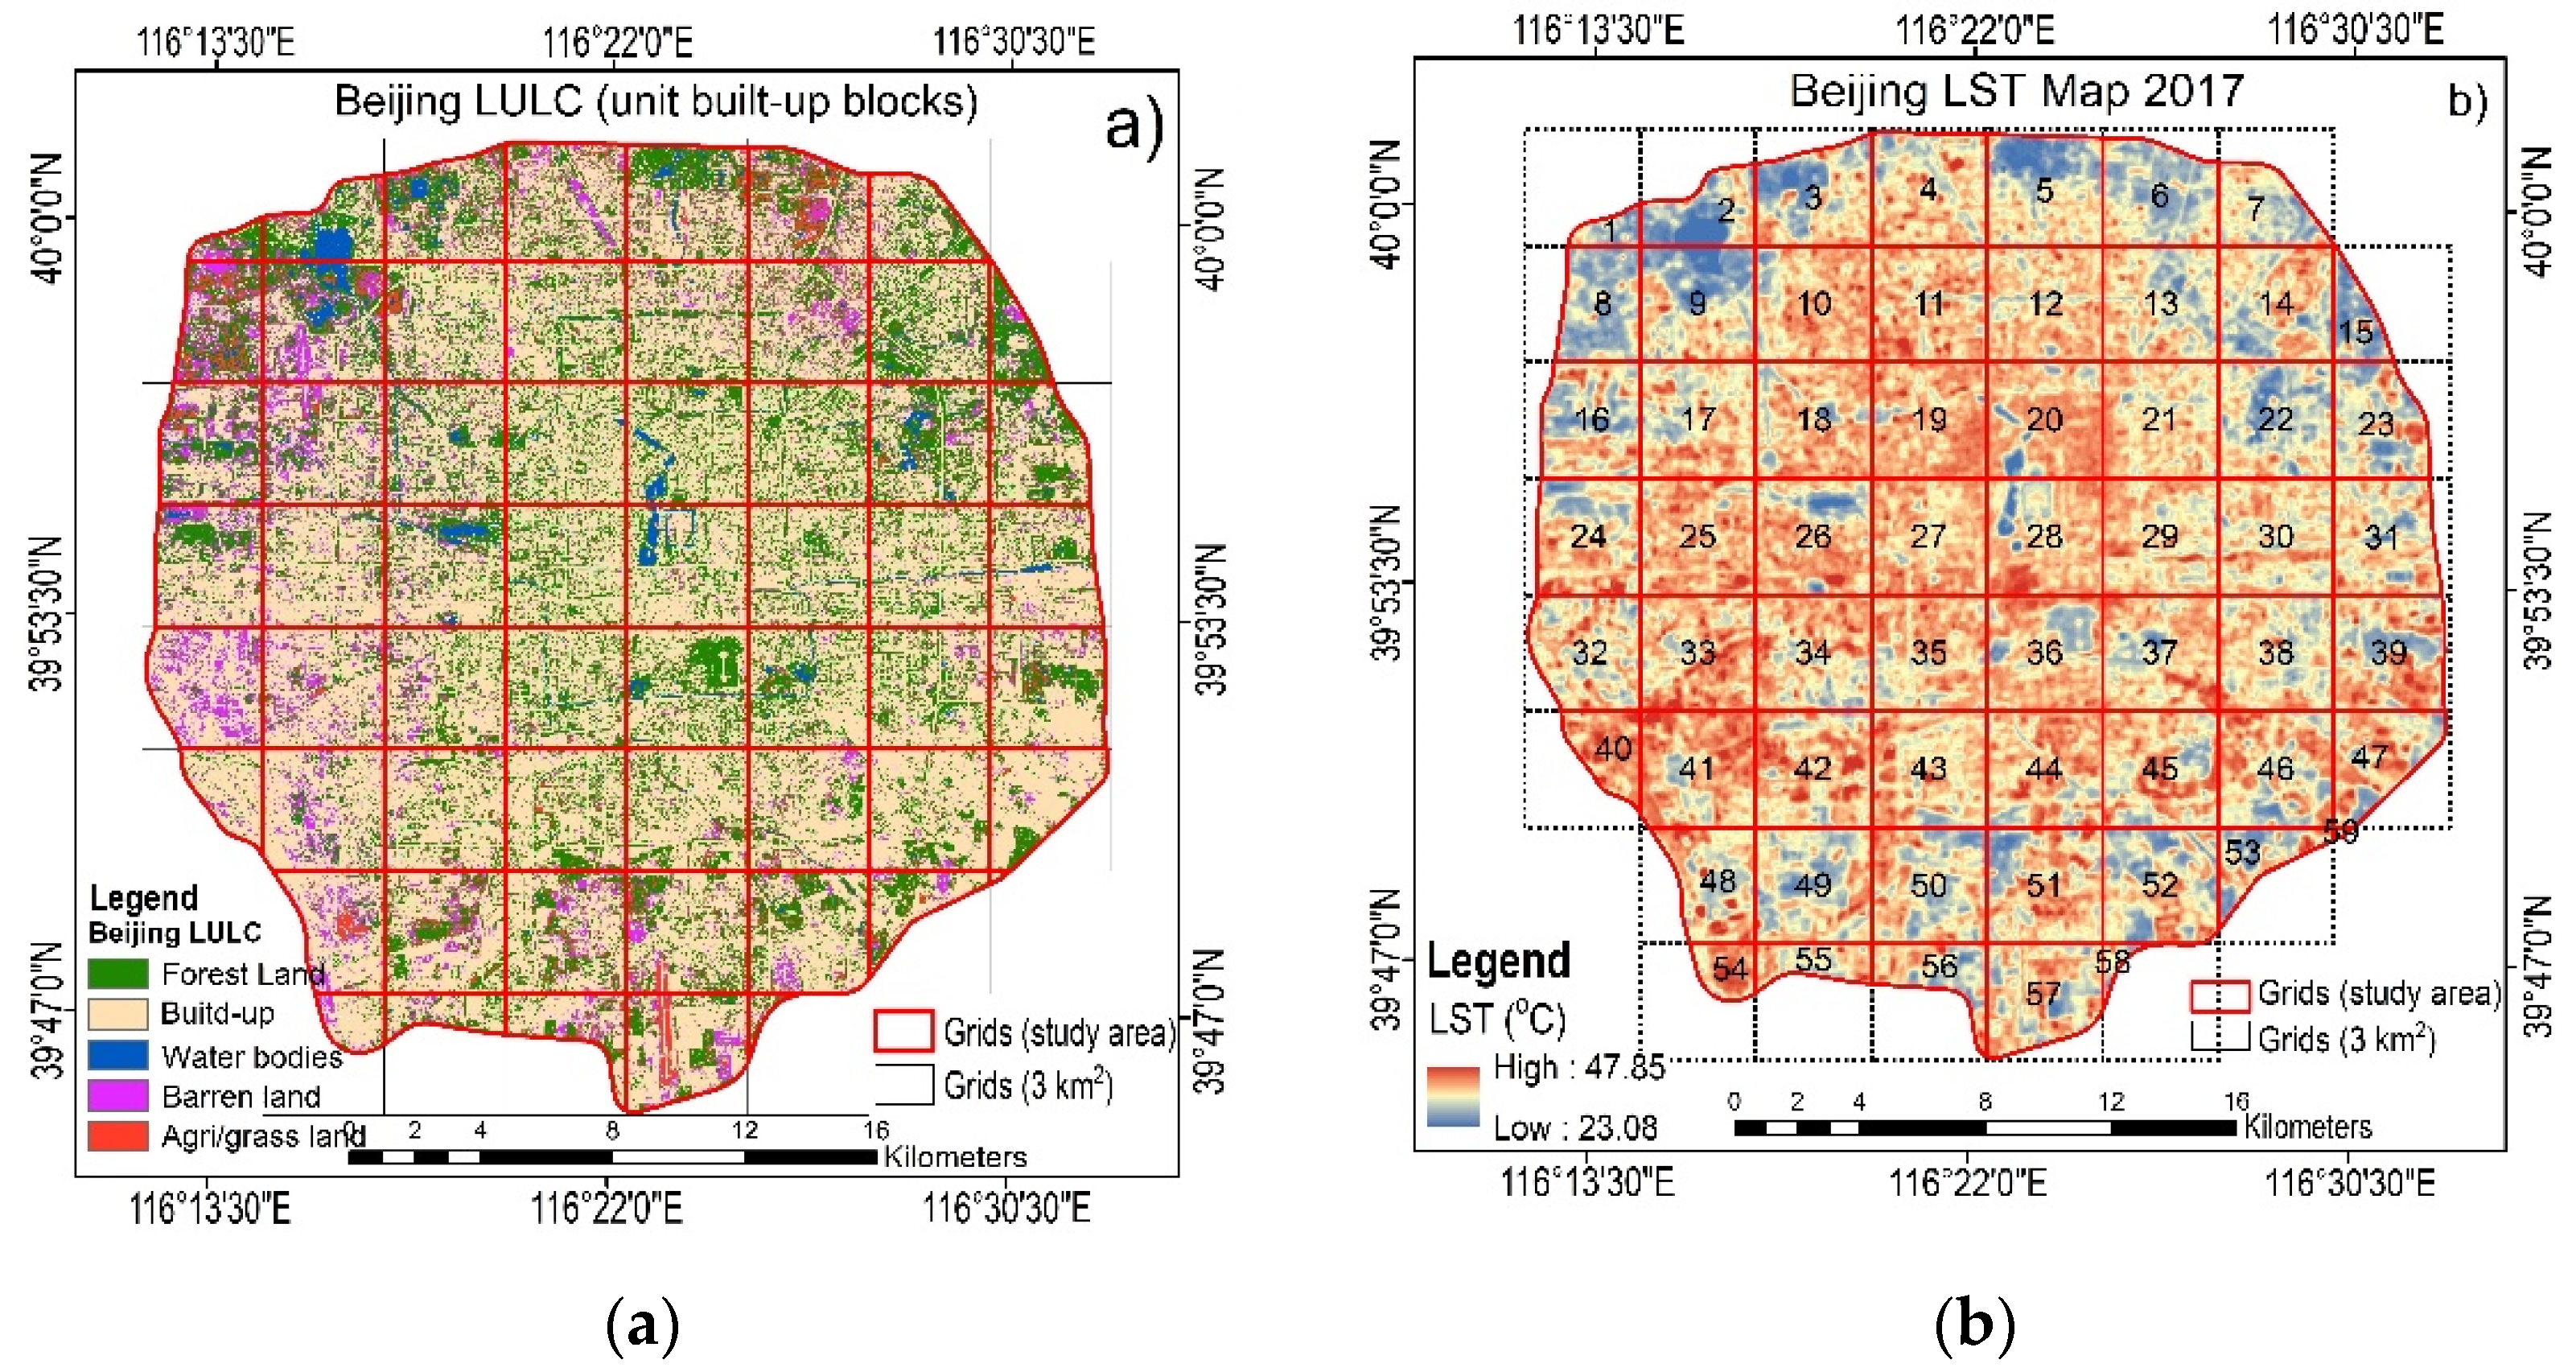
3.1. Analysis of LULC Types and LST
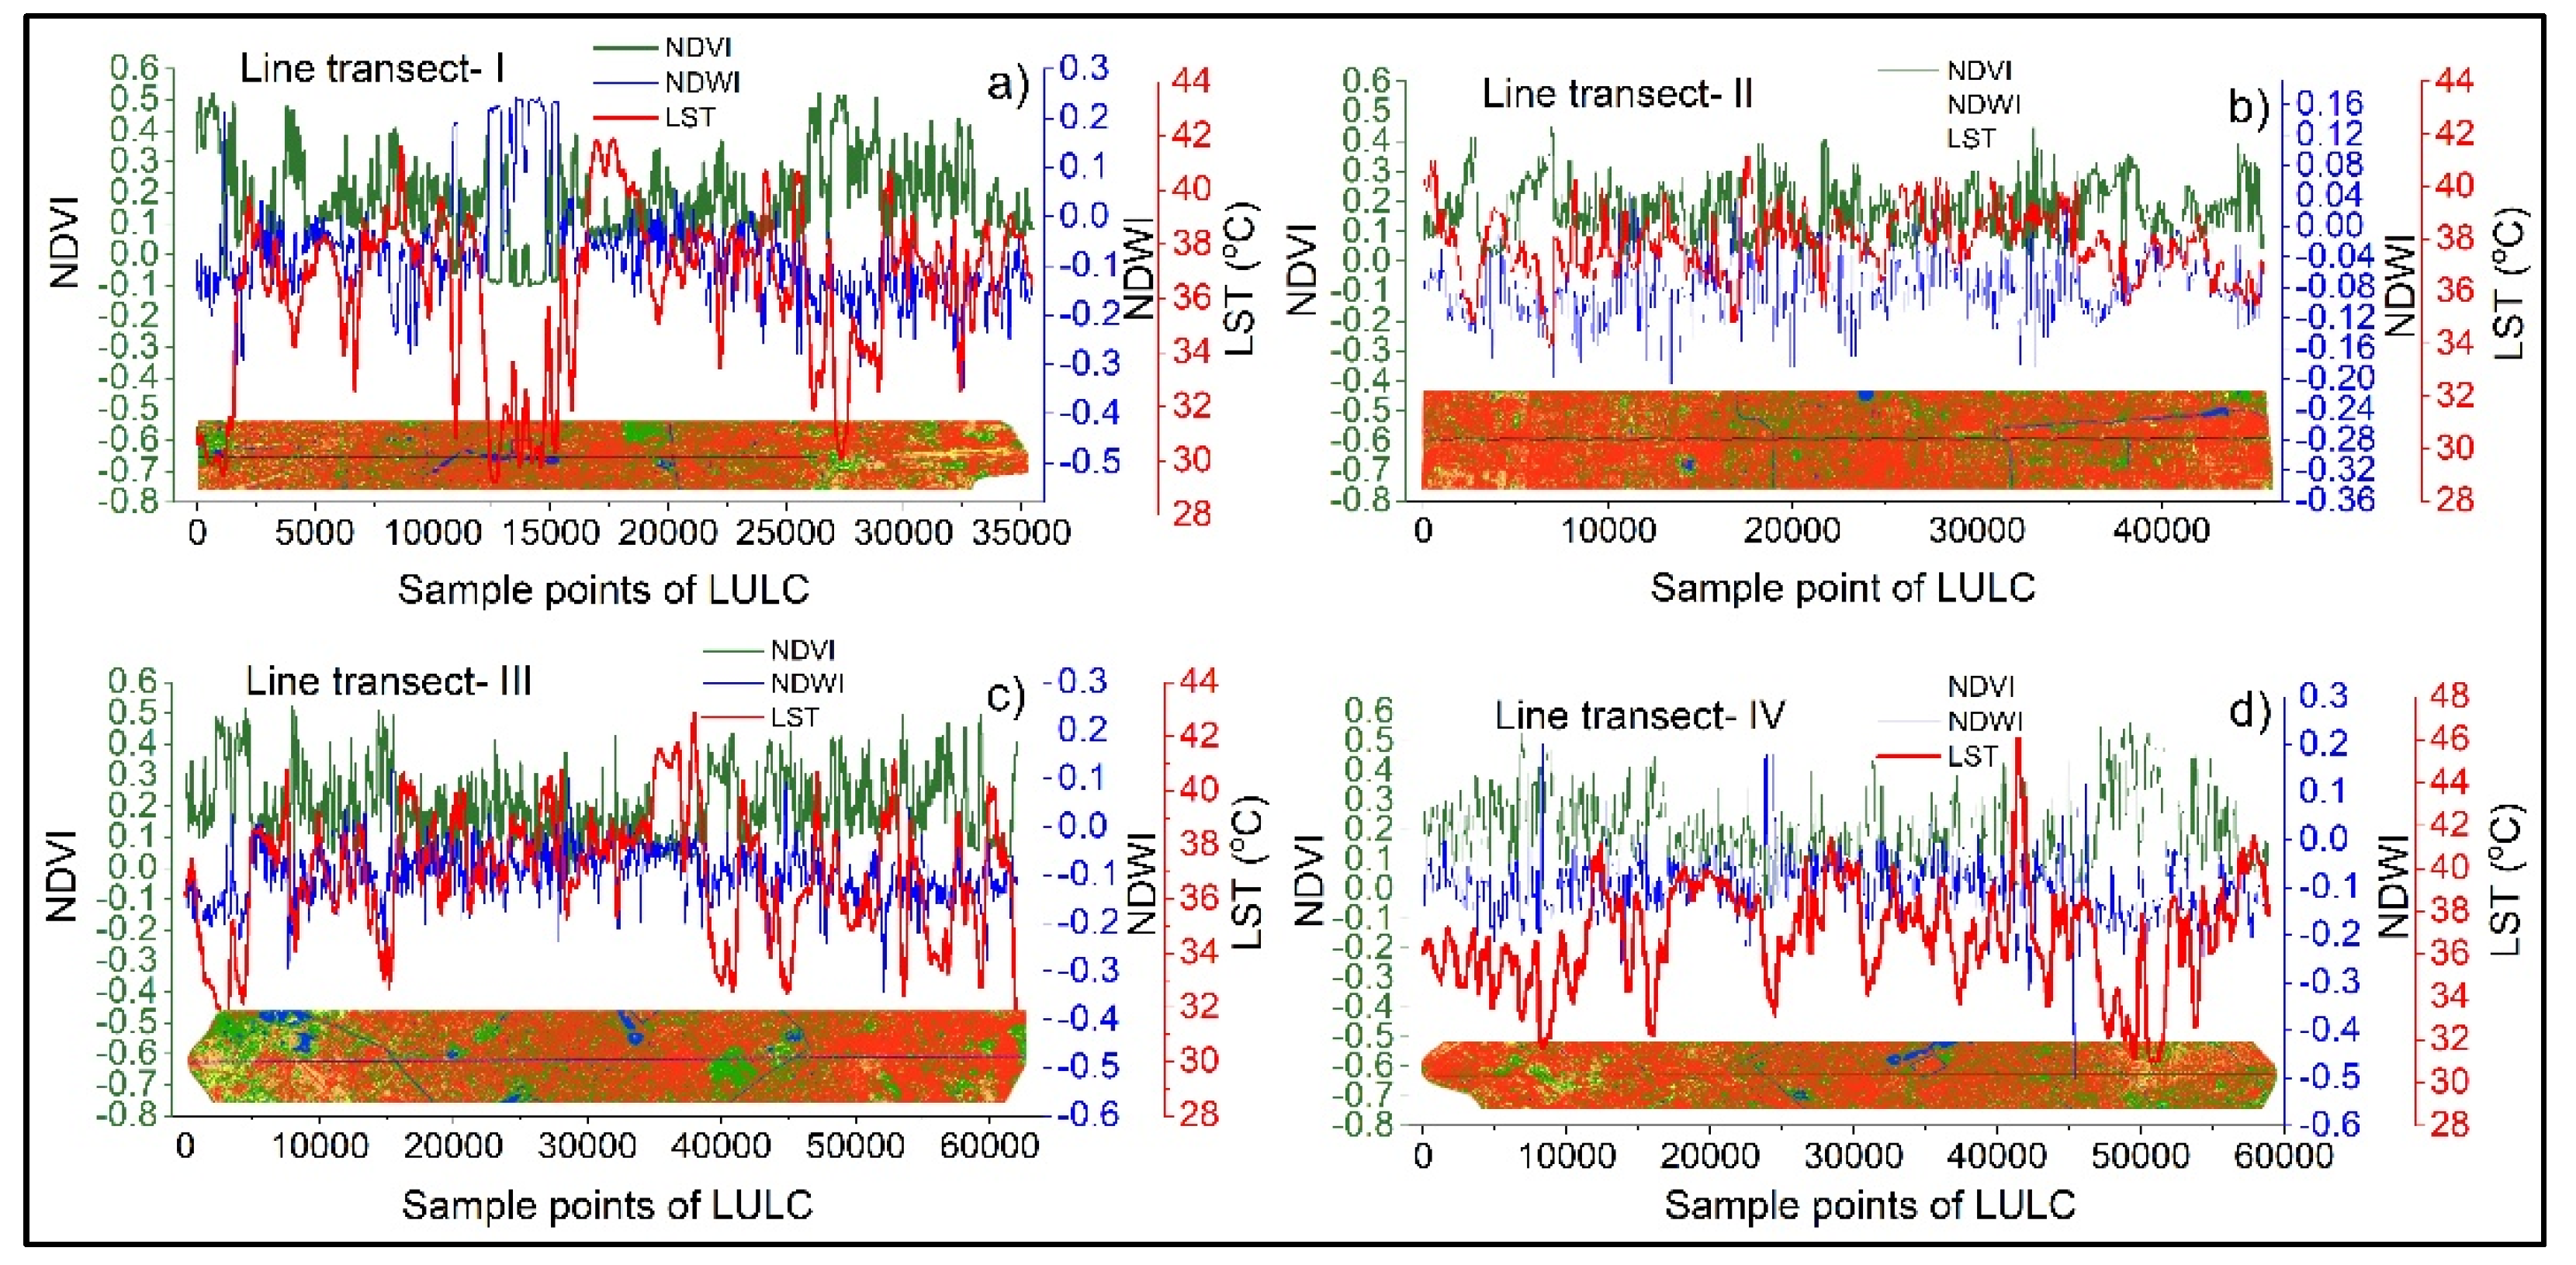
3.2. Gradients of LULC Types, NDVI, NDWI, and LST Profile along Transects
3.3. Comparison of LULC Indices and LST in Transects
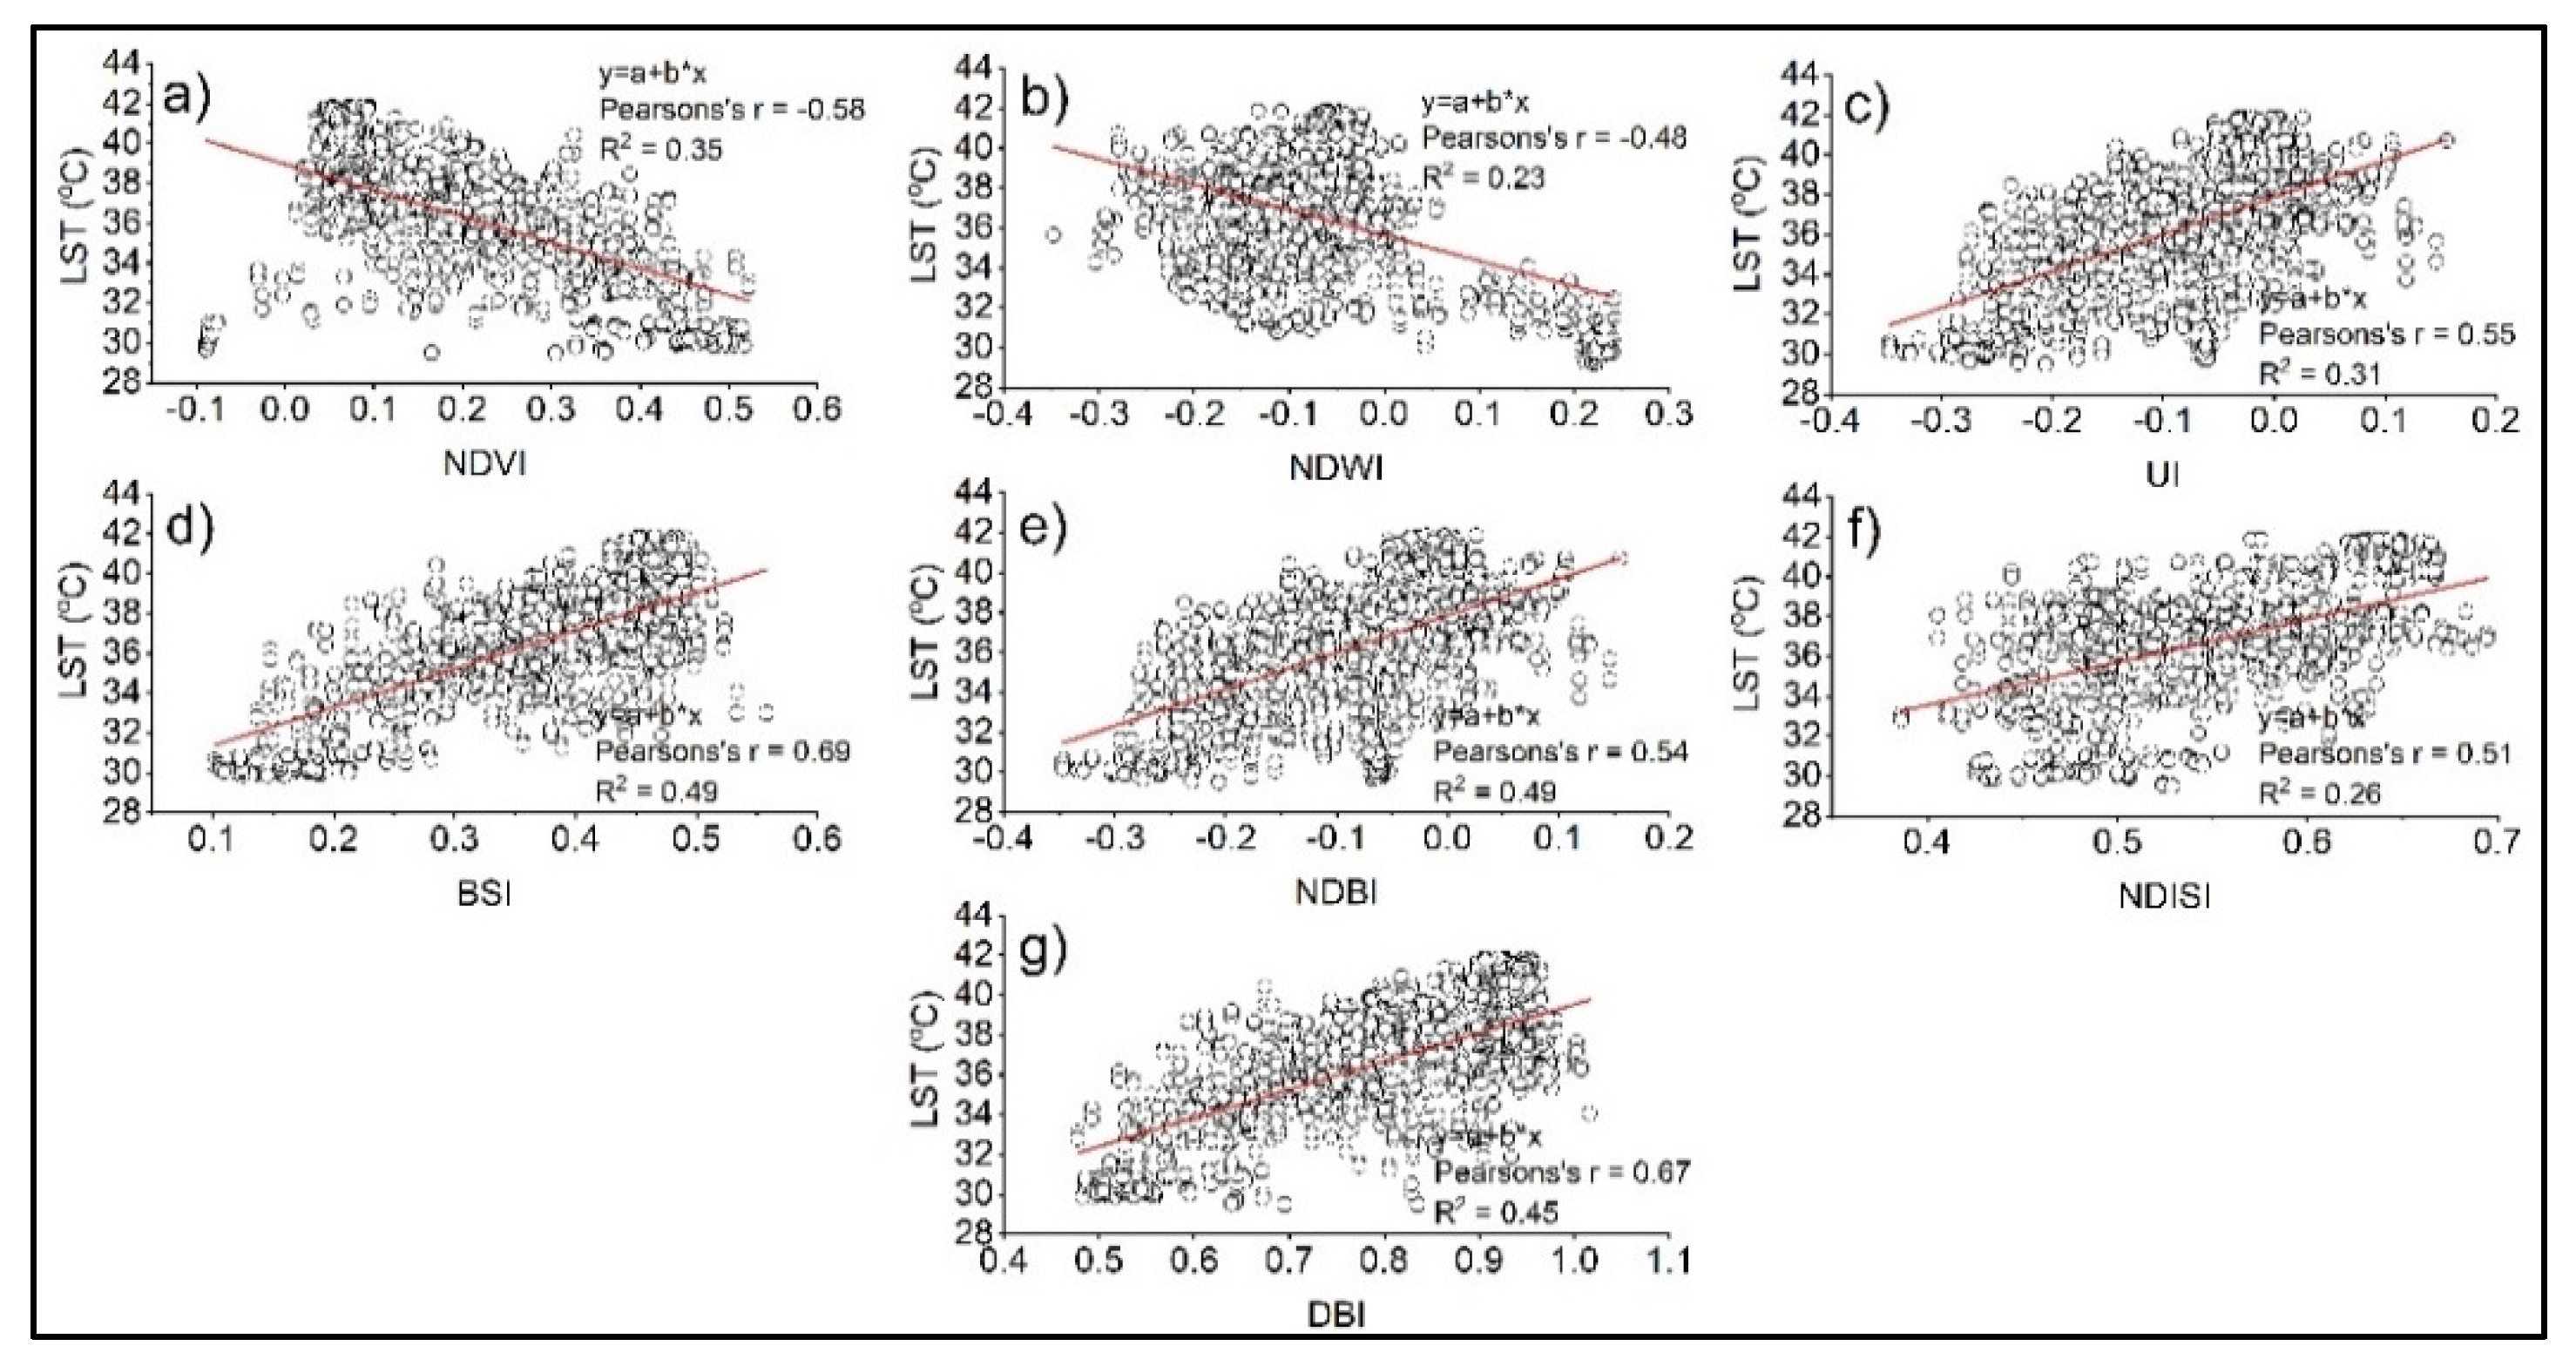
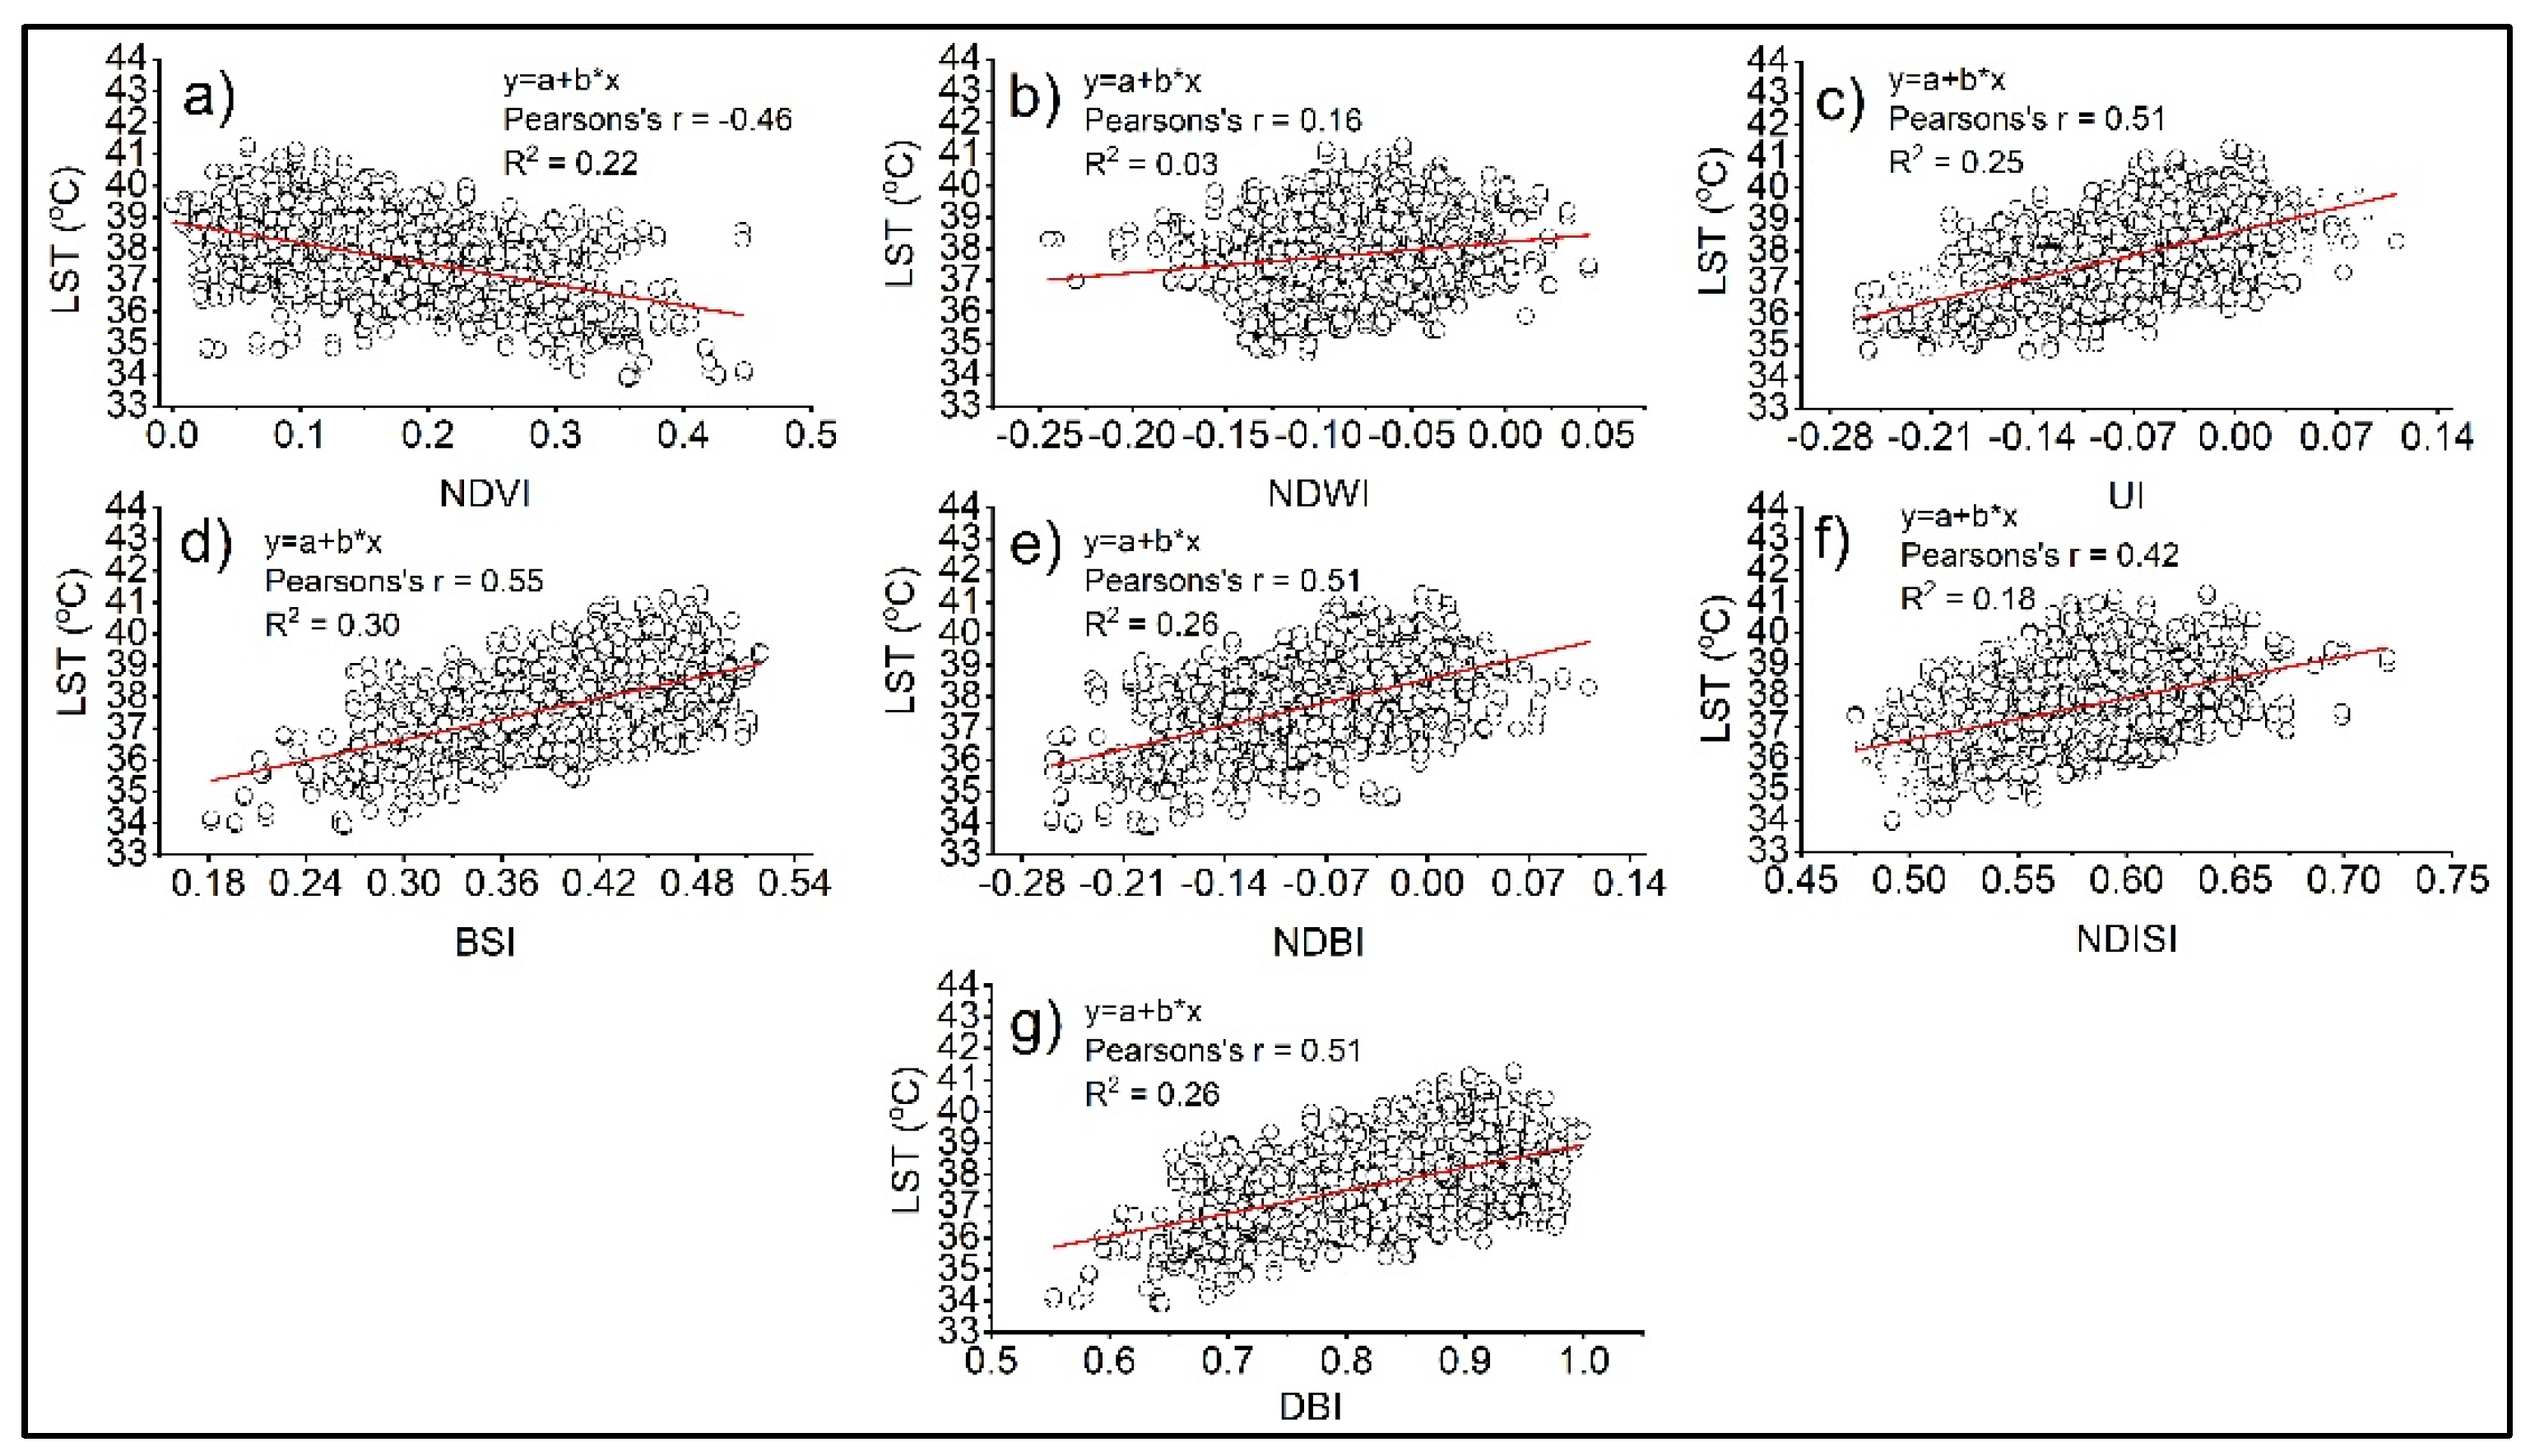
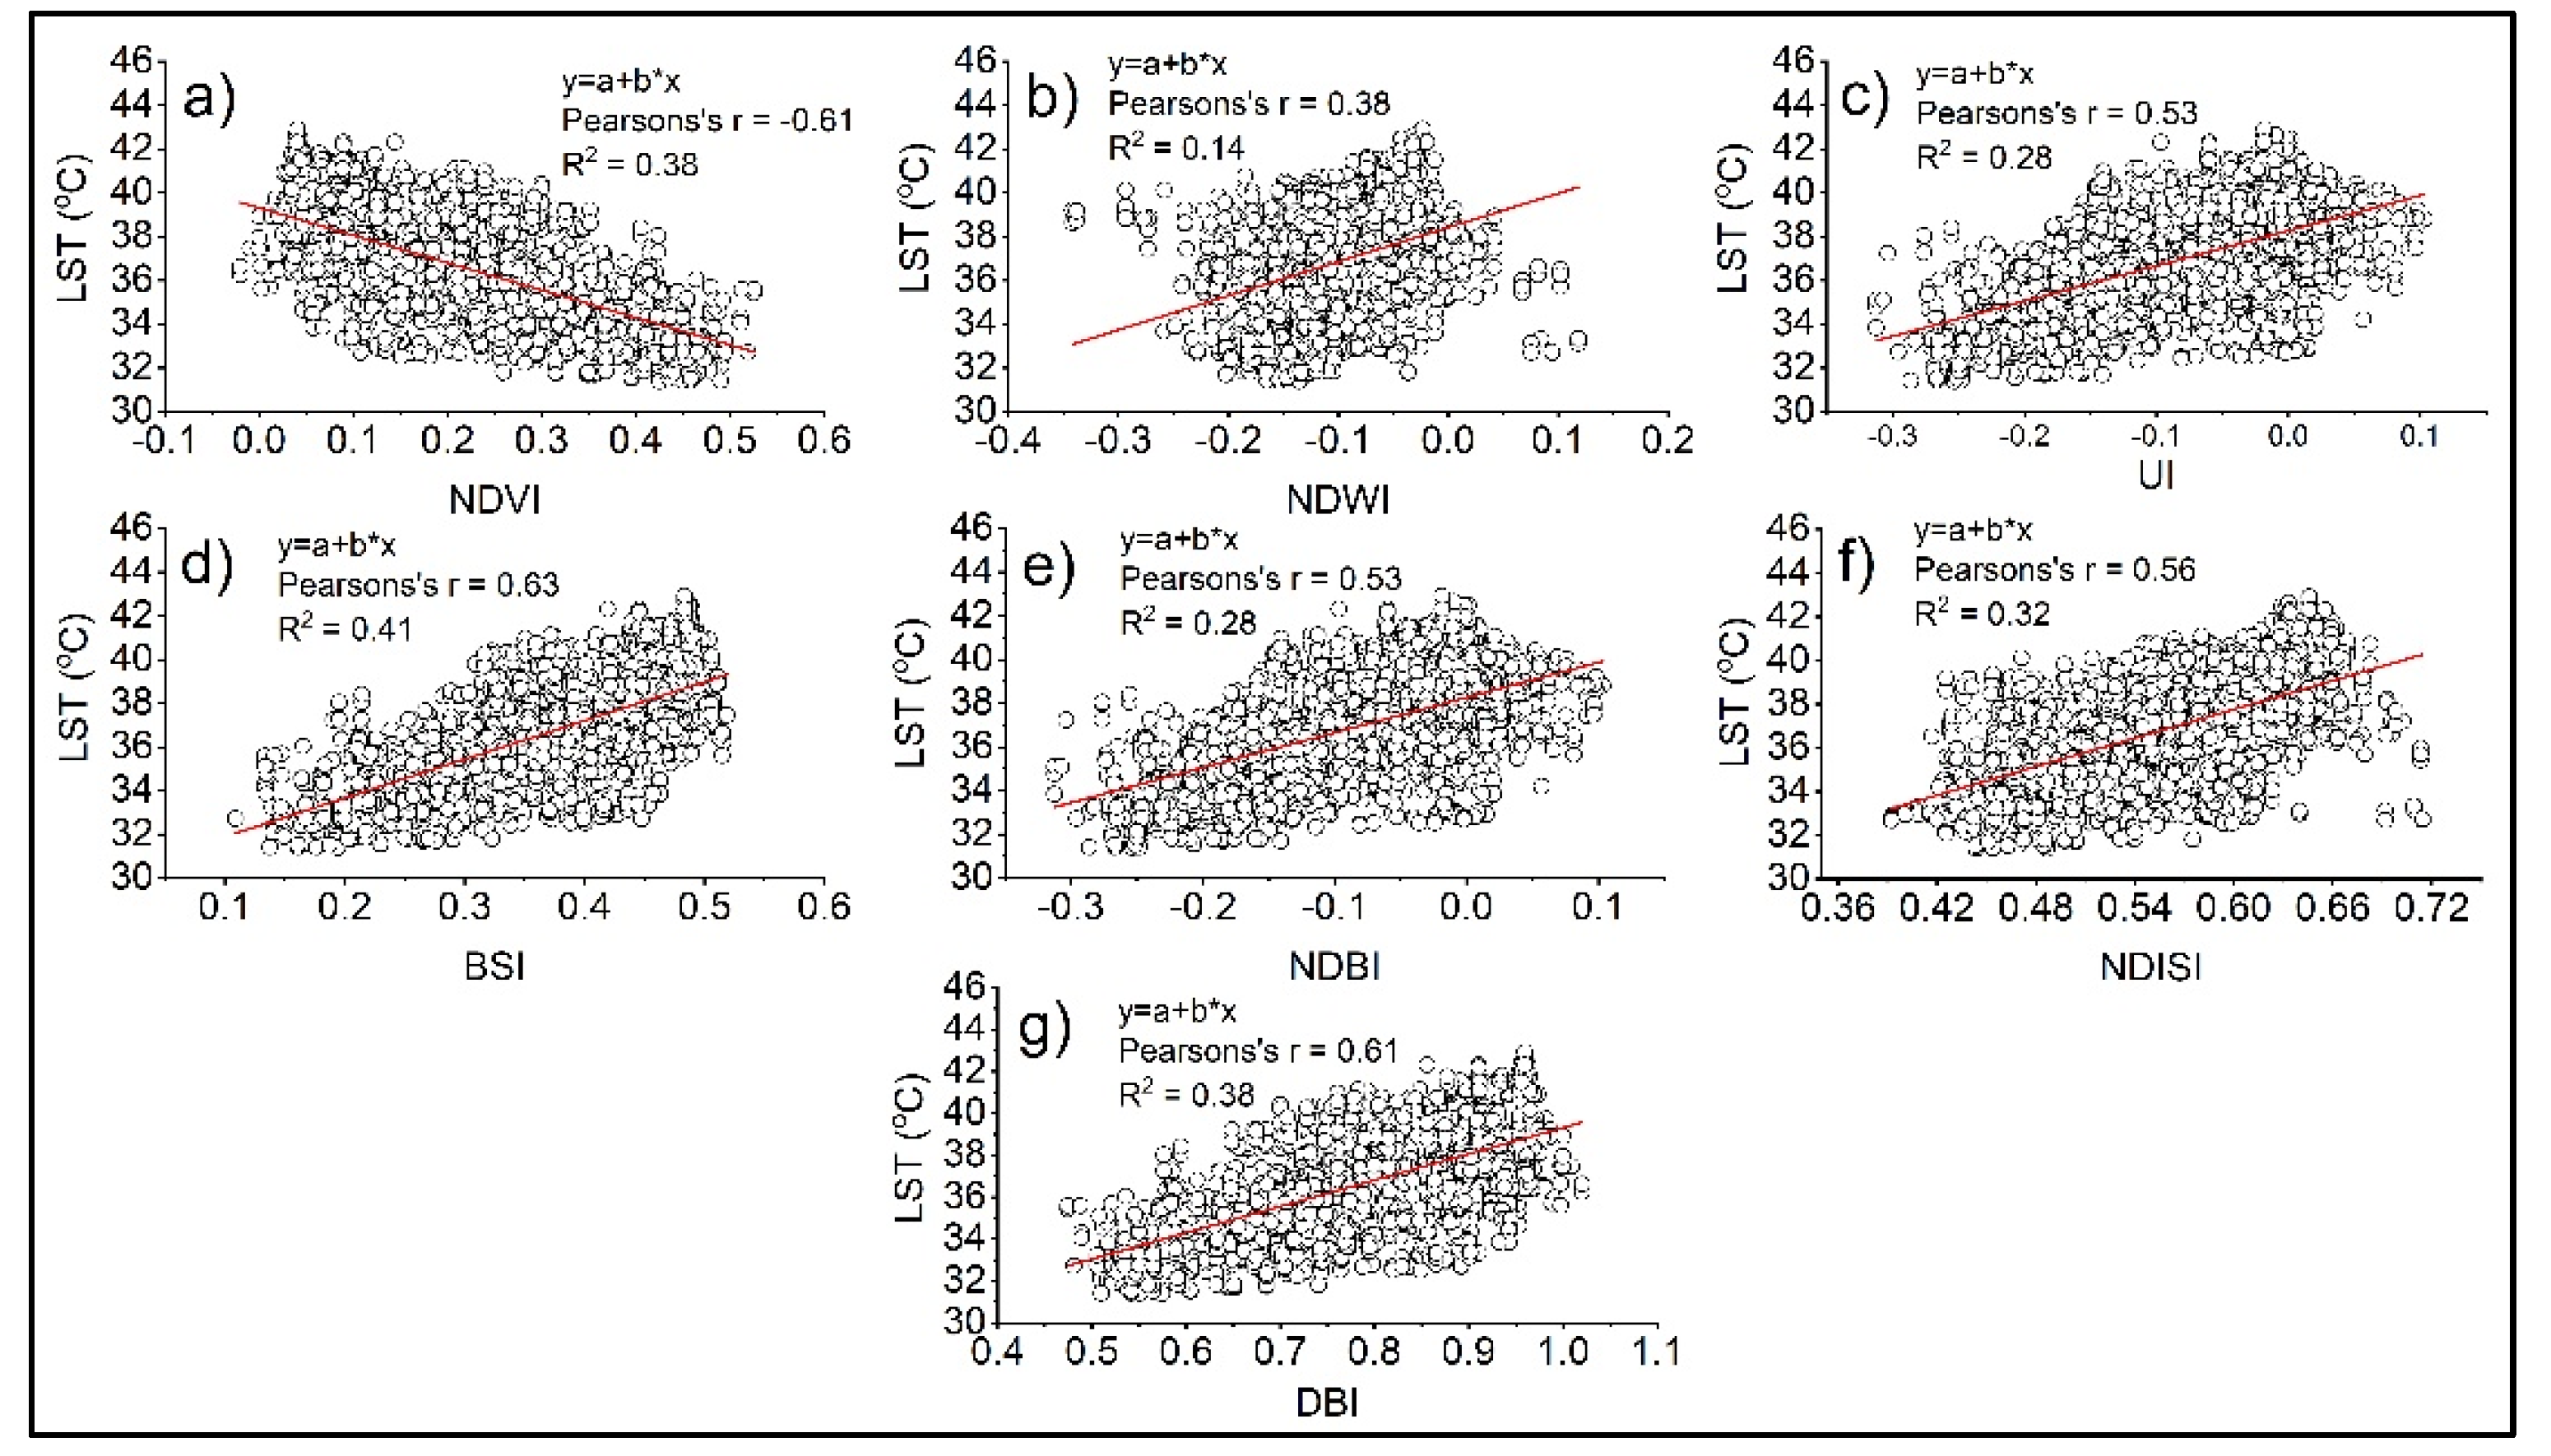
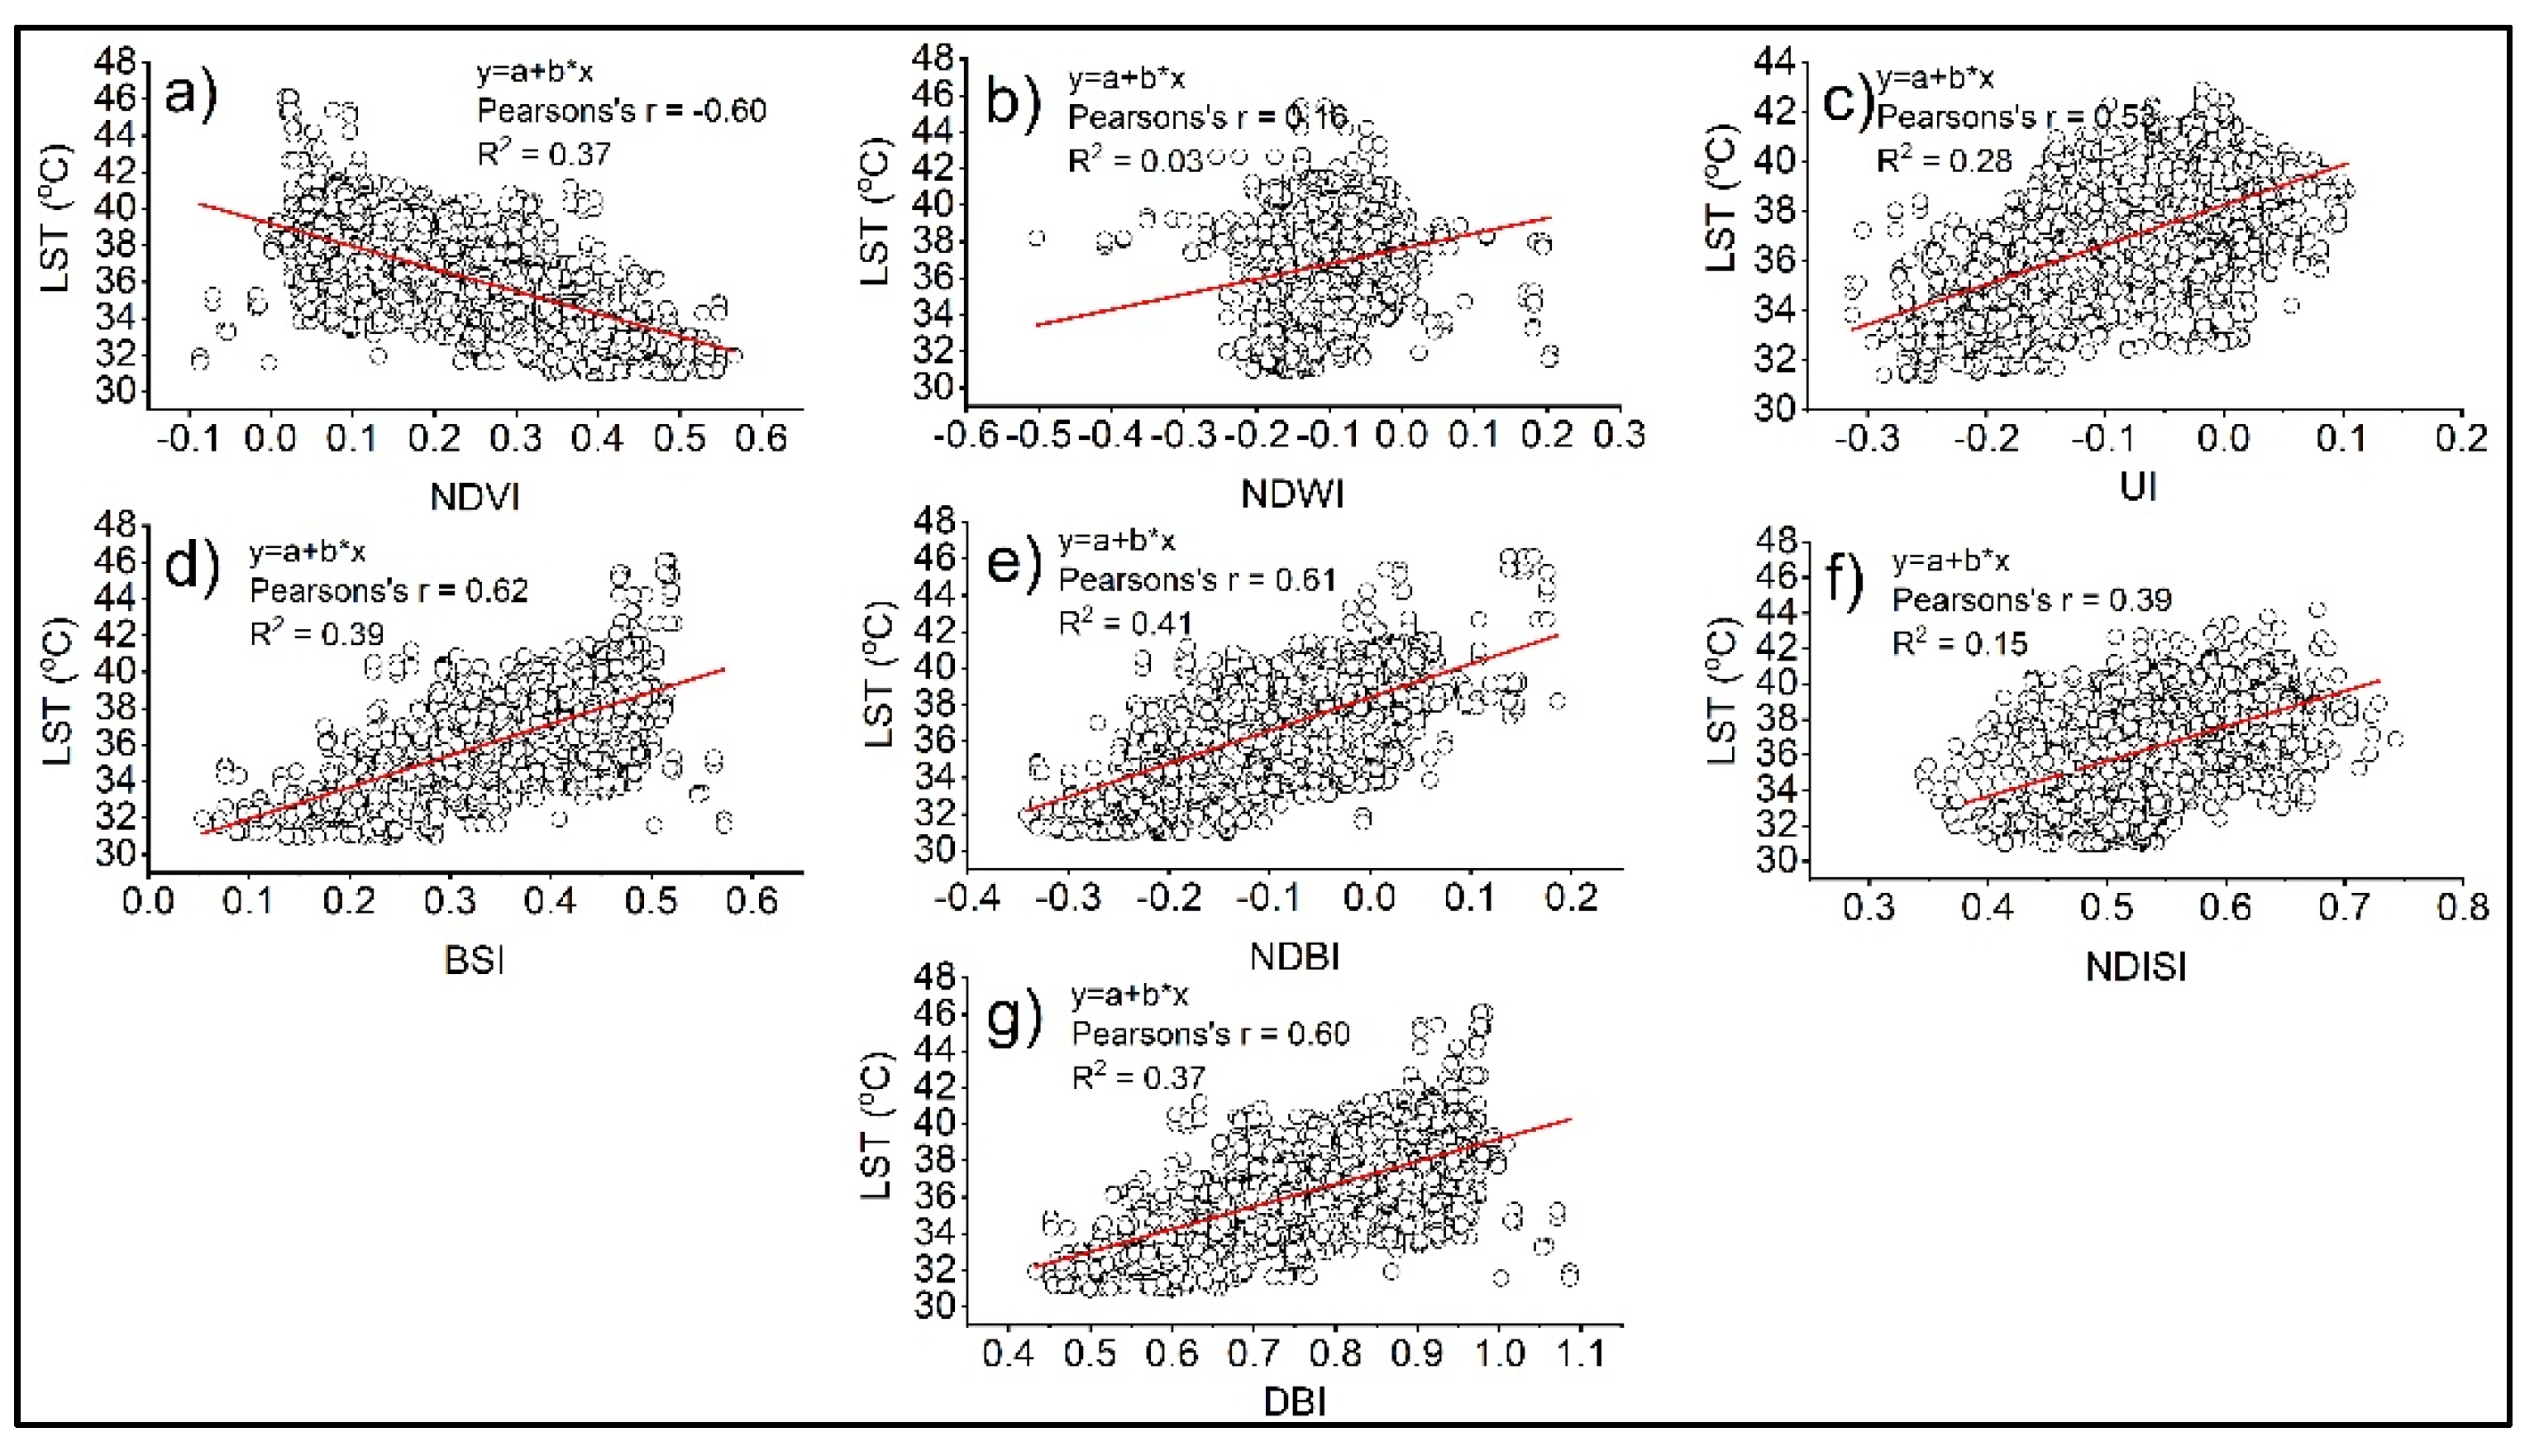
3.4. Regression Analysis of LULC Indices and LST
3.5. Stepwise Regression Analysis among LULC Indices and LST
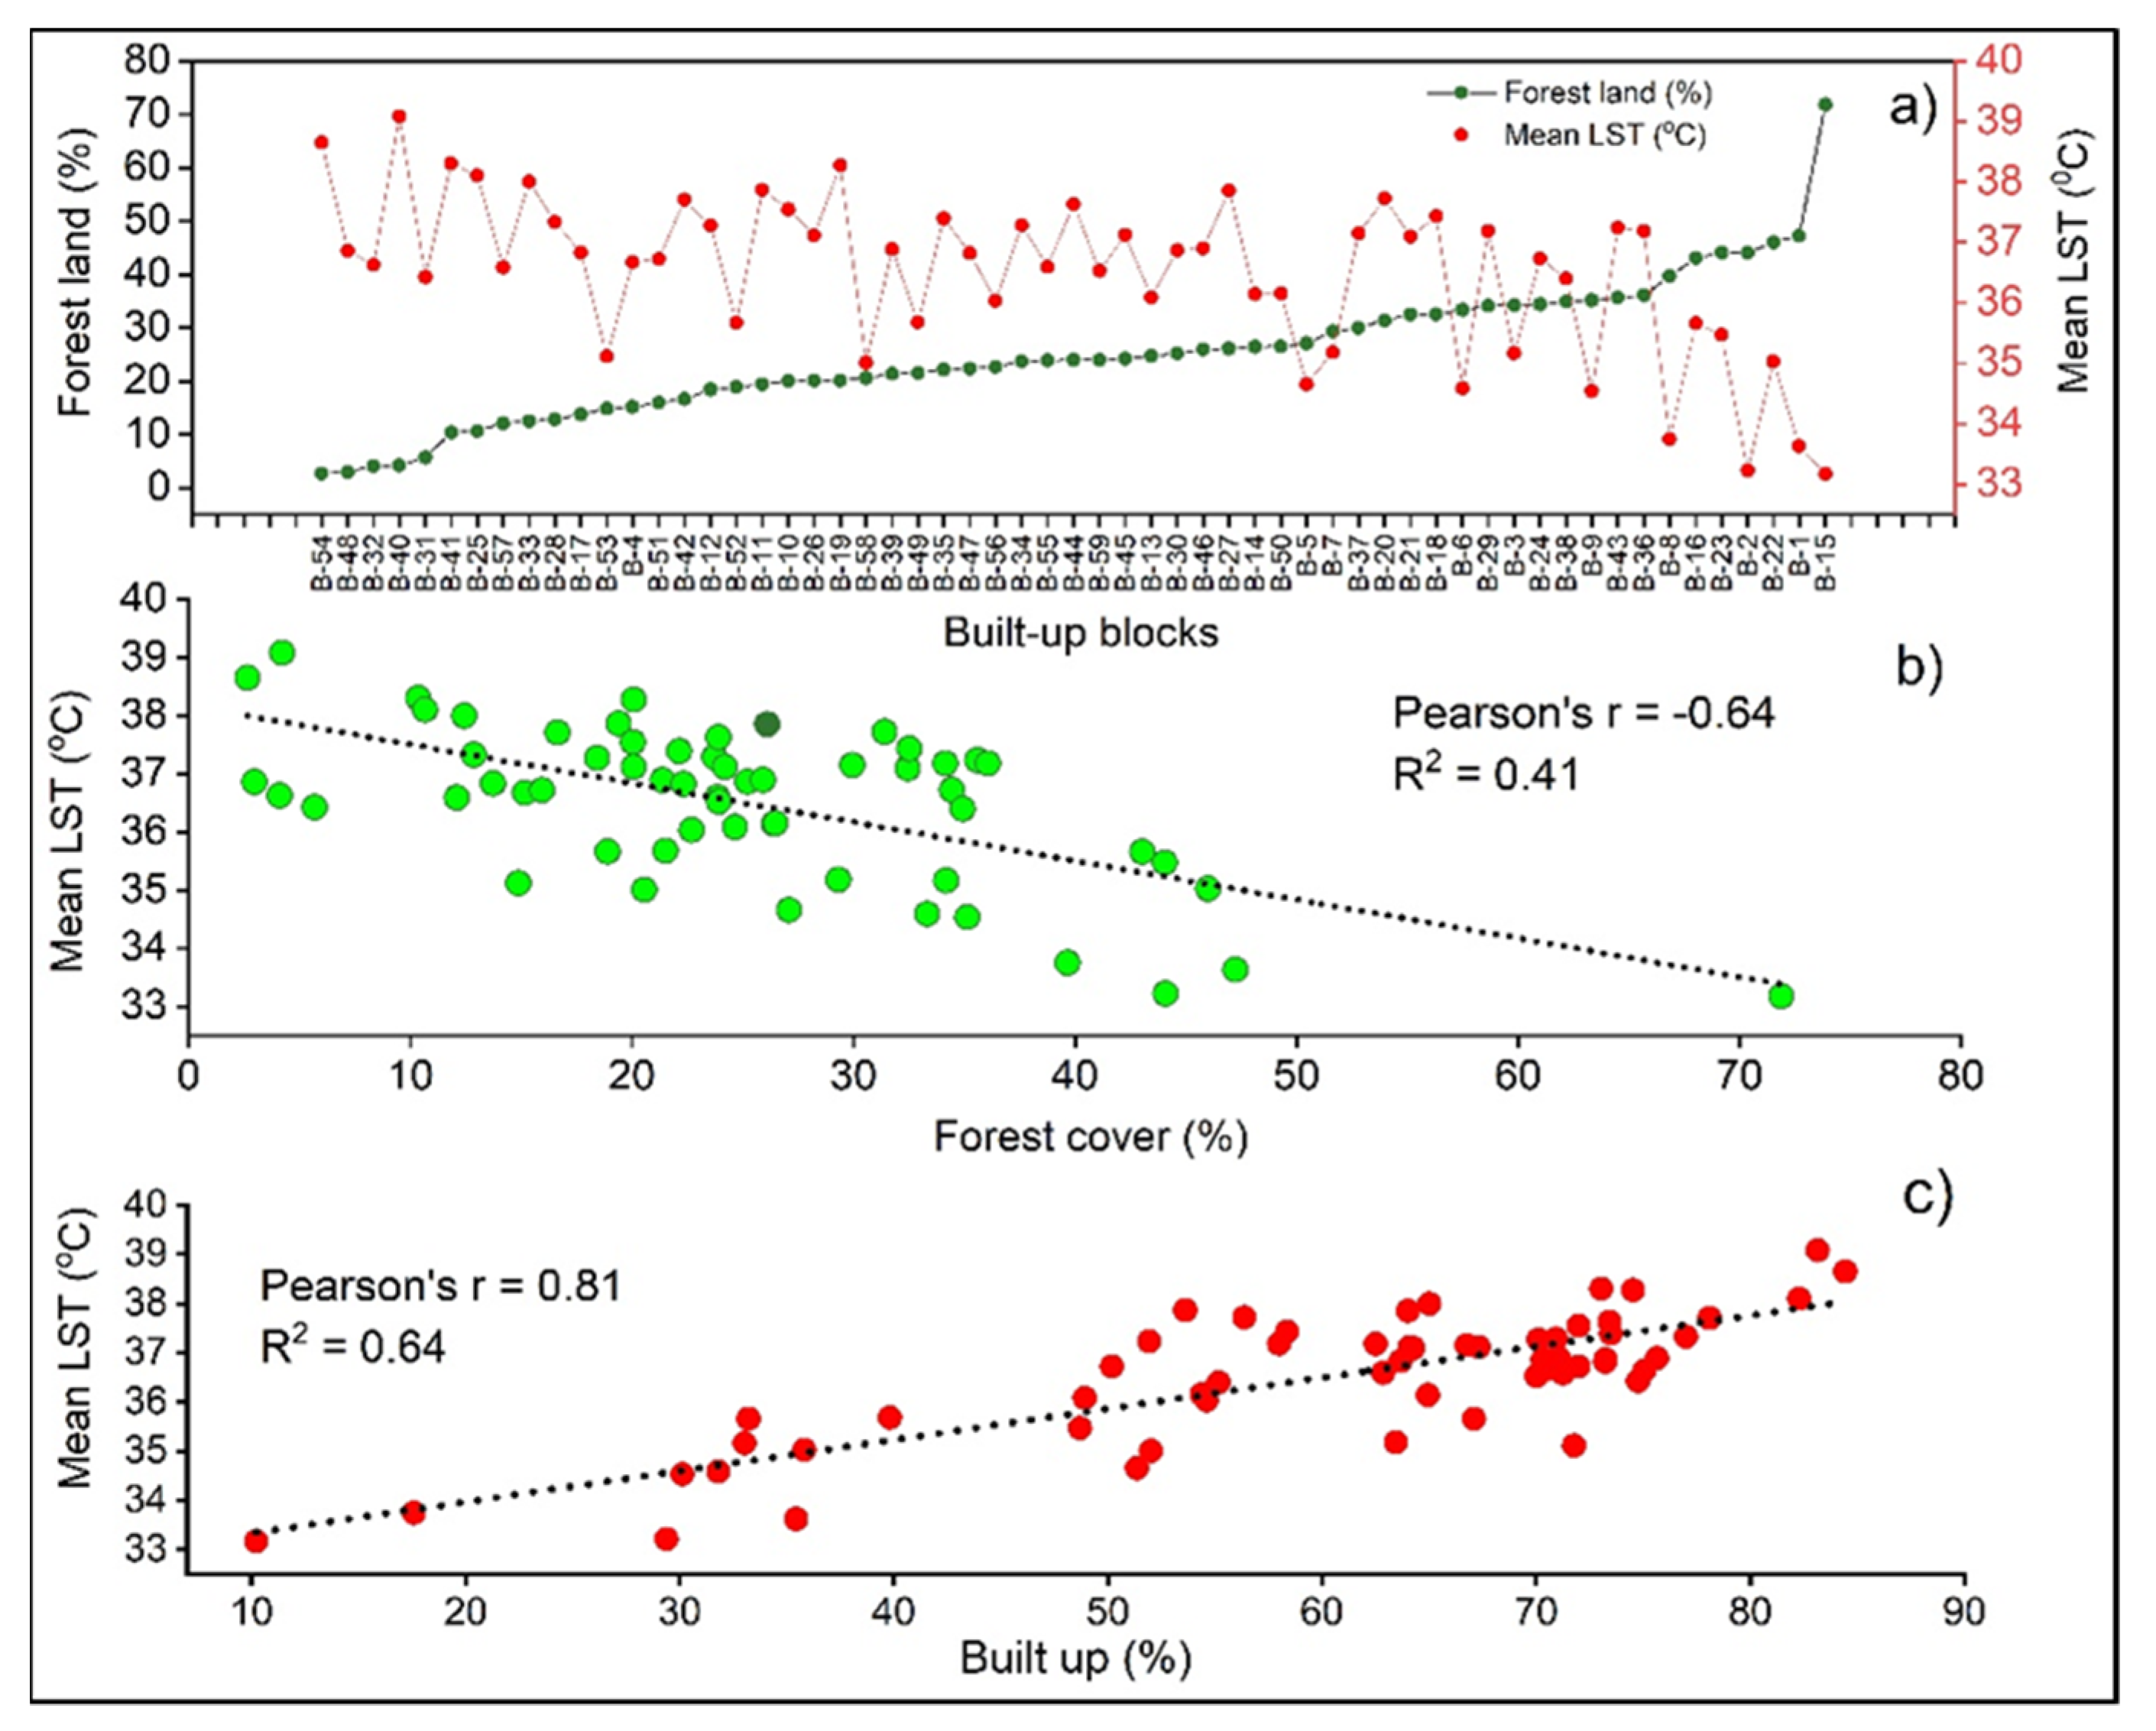
3.6. Impact of Green Landscape on LST at the Built-Up Blocks Level
4. Discussion
4.1. The Impact of LULC Types on LST
4.2. Contribution of LULC Indices to LST
4.3. Relationship of Green Space to LST and Its Implications
5. Conclusions
Limitations
Author Contributions
Funding
Acknowledgments
Conflicts of Interest
References
- Zhan, W.; Chen, Y.; Zhou, J.; Wang, J.; Liu, W.; Voogt, J.; Zhu, X.; Quan, J.; Li, J. Disaggregation of remotely sensed land surface temperature: Literature survey, taxonomy, issues, and caveats. Remote Sens. Environ. 2013, 131, 119–139. [Google Scholar] [CrossRef]
- Jain, M.; Dimri, A.; Niyogi, D. Land-Air Interactions over Urban-Rural Transects Using Satellite Observations: Analysis over Delhi, India from 1991–2016. Remote Sens. 2017, 9, 1283. [Google Scholar] [CrossRef] [Green Version]
- United Nation. World Urbanization Prospects 2018; UN: New York, NY, USA, 2019; ISBN 9789211483185. [Google Scholar]
- Dickinson, R.E. Land-atmosphere interaction. Rev. Geophys. 1995, 33, 917–922. [Google Scholar] [CrossRef]
- Estoque, R.C.; Murayama, Y.; Myint, S.W. Effects of landscape composition and pattern on land surface temperature: An urban heat island study in the megacities of Southeast Asia. Sci. Total Environ. 2017, 577, 349–359. [Google Scholar] [CrossRef] [PubMed]
- Yu, X.; Guo, X.; Wu, Z. Land Surface Temperature Retrieval from Landsat 8 TIRS—Comparison between Radiative Transfer Equation-Based Method, Split Window Algorithm and Single Channel Method. Remote Sens. 2014, 6, 9829–9852. [Google Scholar] [CrossRef] [Green Version]
- Li, X.; Zhou, W.; Ouyang, Z.; Xu, W.; Zheng, H. Spatial pattern of greenspace affects land surface temperature: Evidence from the heavily urbanized Beijing metropolitan area, China. Landsc. Ecol. 2012, 27, 887–898. [Google Scholar] [CrossRef]
- Barreira, E.; Almeida, R.M.S.F.; Simões, L.M.; Anhas, F. The Importance of Moisture Content to the Emissivity of Ceramic Bricks. Proceedings 2019, 27, 4. [Google Scholar] [CrossRef] [Green Version]
- Rozenstein, O.; Qin, Z.; Derimian, Y.; Karnieli, A. Derivation of land surface temperature for landsat-8 TIRS using a split window algorithm. Sensors 2014, 14, 5768–5780. [Google Scholar] [CrossRef]
- Yu, Y.; Tarpley, D.; Privette, J.L.; Flynn, L.E.; Xu, H.; Chen, M.; Vinnikov, K.Y.; Sun, D.; Tian, Y. Validation of GOES-R satellite land surface temperature algorithm using SURFRAD ground measurements and statistical estimates of error properties. IEEE Trans. Geosci. Remote Sens. 2012, 50, 704–713. [Google Scholar] [CrossRef]
- Brunsell, N.A.; Gillies, R.R. Scale issues in land—Atmosphere interactions: Implications for remote sensing of the surface energy balance. Agric. For. Meteorol. 2003, 117, 203–221. [Google Scholar] [CrossRef]
- Burchard-Levine, V.; Nieto, H.; Riaño, D.; Migliavacca, M.; El-Madany, T.S.; Guzinski, R.; Carrara, A.; Martín, M.P. The effect of pixel heterogeneity for remote sensing based retrievals of evapotranspiration in a semi-arid tree-grass ecosystem. Remote Sens. Environ. 2021, 260. [Google Scholar] [CrossRef]
- Lagouarde, J.P.; Irvine, M.; Dupont, S. Atmospheric turbulence induced errors on measurements of surface temperature from space. Remote Sens. Environ. 2015, 168, 40–53. [Google Scholar] [CrossRef]
- Foley, J.A.; DeFries, R.; Asner, G.P.; Barford, C.; Bonan, G.; Carpenter, S.R.; Chapin, F.S.; Coe, M.T.; Daily, G.C.; Gibbs, H.K.; et al. Global consequences of land use. Science 2005, 309, 570. [Google Scholar] [CrossRef] [PubMed] [Green Version]
- Wu, H.; Ye, L.P.; Shi, W.Z.; Clarke, K.C. Assessing the effects of land use spatial structure on urban heatislands using HJ-1B remote sensing imagery in Wuhan, China. Int. J. Appl. Earth Obs. Geoinf. 2014, 32, 67–78. [Google Scholar] [CrossRef]
- Cai, G.; Du, M.; Xue, Y. Monitoring of urban heat island effect in Beijing combining ASTER and TM data. Int. J. Remote Sens. 2011, 32, 1213–1232. [Google Scholar] [CrossRef]
- Zhang, X.; Estoque, R.C.; Murayama, Y. An urban heat island study in Nanchang City, China based on land surface temperature and social-ecological variables. Sustain. Cities Soc. 2017, 32, 557–568. [Google Scholar] [CrossRef]
- Rehman, A.U.; Ullah, S.; Liu, Q.; Khan, M.S. Comparing different space-borne sensors and methods for the retrieval of land surface temperature. Earth Sci. Inform. 2021, 14, 985–995. [Google Scholar] [CrossRef]
- Khan, M.S.; Ullah, S.; Sun, T.; Rehman, A.U.; Chen, L. Land-use/land-cover changes and its contribution to urban heat Island: A case study of Islamabad, Pakistan. Sustainability 2020, 12, 3861. [Google Scholar] [CrossRef]
- Chen, X.; Zhao, H.; Li, P.; Yin, Z. Remote sensing image-based analysis of the relationship between urban heat island and land use/cover changes. Remote. Sens. Environ. 2006, 104, 133–146. [Google Scholar] [CrossRef]
- Zhang, F.; Tiyip, T.; Kung, H.; Johnson, V.C. Dynamics of land surface temperature (LST) in response to land use and land cover (LULC) changes in the Weigan and Kuqa river. Arab. J. Geosci. 2016, 9, 1–14. [Google Scholar] [CrossRef]
- Sharma, R.; Joshi, P.K. Mapping environmental impacts of rapid urbanization in the National Capital Region of India using remote sensing inputs. Urban Clim. 2016, 15, 70–82. [Google Scholar] [CrossRef]
- Sun, Q.; Wu, Z.; Tan, J. The relationship between land surface temperature and land use/land cover in Guangzhou, China. Environ. Earth Sci. 2012, 65, 1687–1694. [Google Scholar] [CrossRef]
- Song, J.; Du, S.; Feng, X.; Guo, L. The relationships between landscape compositions and land surface temperature: Quantifying their resolution sensitivity with spatial regression models. Landsc. Urban Plan. 2014, 123, 145–157. [Google Scholar] [CrossRef]
- Deng, Y.; Wang, S.; Bai, X.; Tian, Y.; Wu, L.; Xiao, J.; Chen, F.; Qian, Q. Relationship among land surface temperature and LUCC, NDVI in typical karst area. Sci. Rep. 2018, 8, 641. [Google Scholar] [CrossRef] [PubMed]
- Li, J.; Song, C.; Cao, L.; Zhu, F.; Meng, X.; Wu, J. Impacts of landscape structure on surface urban heat islands: A case study of Shanghai, China. Remote Sens. Environ. 2011, 115, 3249–3263. [Google Scholar] [CrossRef]
- Ghosh, A.; Joshi, P.K. Hyperspectral imagery for disaggregation of land surface temperature with selected regression algorithms over different land use land cover scenes. ISPRS J. Photogramm. Remote Sens. 2014, 96, 76–93. [Google Scholar] [CrossRef]
- Xi, Y.; Thinh, N.X.; LI, C. Preliminary comparative assessment of various spectral indices for built-up land derived from Landsat-8 OLI and Sentinel-2A MSI imageries. Eur. J. Remote Sens. 2019, 52, 240–252. [Google Scholar] [CrossRef] [Green Version]
- Sun, Z.; Wang, C.; Guo, H.; Shang, R. A modified normalized difference impervious surface index (MNDISI) for automatic urban mapping from landsat imagery. Remote Sens. 2017, 9, 942. [Google Scholar] [CrossRef] [Green Version]
- Kumar, D.; Shekhar, S. Statistical analysis of land surface temperature-vegetation indexes relationship through thermal remote sensing. Ecotoxicol. Environ. Saf. 2015, 121, 39–44. [Google Scholar] [CrossRef]
- Petropoulos, G.P.; Griffiths, H.M.; Kalivas, D.P. Quantifying spatial and temporal vegetation recovery dynamics following a wildfire event in a Mediterranean landscape using EO data and GIS. Appl. Geogr. 2014, 50, 120–131. [Google Scholar] [CrossRef] [Green Version]
- Naeem, S.; Cao, C.; Qazi, W.A.; Zamani, M.; Wei, C.; Acharya, B.K.; Rehman, A.U. Studying the association between green space characteristics and land surface temperature for sustainable urban environments: An analysis of Beijing and Islamabad. ISPRS Int. J. Geo-Inf. 2018, 7, 38. [Google Scholar] [CrossRef] [Green Version]
- García-Santos, V.; Cuxart, J.; Martínez-Villagrasa, D.; Jiménez, M.A.; Simó, G. Comparison of three methods for estimating land surface temperature from Landsat 8-TIRS Sensor data. Remote Sens. 2018, 10, 1450. [Google Scholar] [CrossRef] [Green Version]
- Wang, Y.; Hu, B.K.H.; Myint, S.W.; Feng, C.; Chow, W.T.L.; Passy, P.F. Science of the Total Environment Patterns of land change and their potential impacts on land surface temperature change in Yangon, Myanmar. Sci. Total Environ. 2018, 643, 738–750. [Google Scholar] [CrossRef]
- Pelletier, C.; Valero, S.; Inglada, J.; Champion, N.; Dedieu, G. Remote Sensing of Environment Assessing the robustness of Random Forests to map land cover with high resolution satellite image time series over large areas. Remote Sens. Environ. 2016, 187, 156–168. [Google Scholar] [CrossRef]
- Stehman, S. Estimating the Kappa Coefficient and its Variance under Stratified Random Sampling. Photogramm. Eng. Remote Sens. 1996, 62, 401–407. [Google Scholar]
- Sobrino, J.A.; Jiménez-muñoz, J.C. Remote Sensing of Environment Minimum con fi guration of thermal infrared bands for land surface temperature and emissivity estimation in the context of potential future missions. Remote Sens. Environ. 2014, 148, 158–167. [Google Scholar] [CrossRef]
- Tucker, C.J. Red and photographic infrared linear combinations for monitoring vegetation. Remote Sens. Environ. 1979, 8, 127–150. [Google Scholar] [CrossRef] [Green Version]
- McFeeters, S.K. The use of the Normalized Difference Water Index (NDWI) in the delineation of open water features. Int. J. Remote Sens. 1996, 17, 1425–1432. [Google Scholar] [CrossRef]
- Zha, Y.; Gao, J.; Ni, S. Use of normalized difference built-up index in automatically mapping urban areas from TM imagery. Int. J. Remote Sens. 2003, 24, 583–594. [Google Scholar] [CrossRef]
- Kawamura, M. Relation between social and environmental conditions in Colombo Sri Lanka and the urban index estimated by satellite remote sensing data. Int. Arch. Photogramm. Remote Sens. 1996, 7, 321–326. [Google Scholar]
- Rasul, A.; Balzter, H.; Ibrahim, G.R.F.; Hameed, H.M.; Wheeler, J.; Adamu, B.; Ibrahim, S.; Najmaddin, P.M. Applying built-up and bare-soil indices from Landsat 8 to cities in dry climates. Land 2018, 7, 81. [Google Scholar] [CrossRef] [Green Version]
- Xu, H. Modification of normalised difference water index (NDWI) to enhance open water features in remotely sensed imagery. Int. J. Remote Sens. 2006, 27, 3025–3033. [Google Scholar] [CrossRef]
- Xu, H. Analysis of impervious surface and its impact on Urban heat environment using the normalized difference impervious surface index (NDISI). Photogramm. Eng. Remote Sens. 2010, 76, 557–565. [Google Scholar] [CrossRef]
- Liu, H.; Weng, Q. Enhancing temporal resolution of satellite imagery for public health studies: A case study of West Nile Virus outbreak in Los Angeles in 2007. Remote Sens. Environ. 2012, 117, 57–71. [Google Scholar] [CrossRef]
- Gao, B.-C. Naval Research Laboratory, 4555 Overlook Ave. Remote Sens. Env. 1996, 7212, 257–266. [Google Scholar] [CrossRef]
- Liu, Y.; Peng, J.; Wang, Y. Diversification of land surface temperature change under urban landscape renewal: A case study in the main city of Shenzhen, China. Remote Sens. 2017, 9, 919. [Google Scholar] [CrossRef] [Green Version]
- Li, Z.L.; Tang, B.H.; Wu, H.; Ren, H.; Yan, G.; Wan, Z.; Trigo, I.F.; Sobrino, J.A. Satellite-derived land surface temperature: Current status and perspectives. Remote Sens. Environ. 2013, 131, 14–37. [Google Scholar] [CrossRef] [Green Version]
- Chen, Y.C.; Chiu, H.W.; Su, Y.F.; Wu, Y.C.; Cheng, K.S. Does urbanization increase diurnal land surface temperature variation? Evidence and implications. Landsc. Urban Plan. 2017, 157, 247–258. [Google Scholar] [CrossRef]
- Ullah, S.; Dees, M.; Datta, P.; Adler, P.; Schardt, M.; Koch, B. Potential of Modern Photogrammetry Versus Airborne Laser Scanning for Estimating Forest Variables in a Mountain Environment. Remote Sens. 2019, 11, 661. [Google Scholar] [CrossRef] [Green Version]
- Ferreira, L.S.; Duarte, D.H.S. Exploring the relationship between urban form, land surface temperature and vegetation indices in a subtropical megacity. Urban Clim. 2019, 27, 105–123. [Google Scholar] [CrossRef]
- Yin, J.; Wu, X.; Shen, M.; Zhang, X.; Zhu, C.; Xiang, H.; Shi, C.; Guo, Z.; Li, C. Impact of urban greenspace spatial pattern on land surface temperature: A case study in Beijing metropolitan area, China. Landsc. Ecol. 2019, 34, 2949–2961. [Google Scholar] [CrossRef]
- Zhang, Y.; Odeh, I.O.A.; Han, C. Bi-temporal characterization of land surface temperature in relation to impervious surface area, NDVI and NDBI, using a sub-pixel image analysis. Int. J. Appl. Earth Obs. Geoinf. 2009, 11, 256–264. [Google Scholar] [CrossRef]
- Ali, J.M.; Marsh, S.H.; Smith, M.J. A comparison between London and Baghdad surface urban heat islands and possible engineering mitigation solutions. Sustain. Cities Soc. 2017, 29, 159–168. [Google Scholar] [CrossRef] [Green Version]
- Kumar, K.S.; Bhaskar, P.U.; Padmakumari, K. Estimation of Land Surface Temperature to Study Urban Heat Island Effect Using Landsat Etm+ Image. Int. J. Eng. Sci. Technol. 2012, 4, 771–778. [Google Scholar]
- Li, H.; Liu, Q. Comparison of NDBI and NDVI as indicators of surface urban heat island effect in MODIS imagery. Int. Conf. Earth Obs. Data Process. Anal. 2008, 7285, 728503. [Google Scholar] [CrossRef]
- Kikon, N.; Singh, P.; Singh, S.K.; Vyas, A. Assessment of urban heat islands (UHI) of Noida City, India using multi-temporal satellite data. Sustain. Cities Soc. 2016, 22, 19–28. [Google Scholar] [CrossRef]
- Liu, K.; Su, H.; Zhang, L.; Yang, H.; Zhang, R.; Li, X. Analysis of the urban heat Island effect in shijiazhuang, China using satellite and airborne data. Remote Sens. 2015, 7, 4804–4833. [Google Scholar] [CrossRef] [Green Version]


| Satellites Scene | Spatial Resolution (m) | Date | Time |
|---|---|---|---|
| GF-2 | |||
| L1A0002412174 | 4 June 2017 | ||
| L1A0002417896 | 9 June 2017 | ||
| L1A0002529896 | 7 August 2017 | ||
| L1A0002404757 | 4 × 4 | 4 June 2017 | 11:37:47 |
| L1A0002404758 | 4 June 2017 | ||
| L1A0002417593 | 9 June 2017 | ||
| L1A0002417596 | 9 June 2017 | ||
| Landsat-8 ETM | 30 × 30 | 10 July 2017 | 02:53:19 |
| Thermal Infrared | 100 × 100 |
| Index Equation | Bands Wavelength (μm) | Reference |
|---|---|---|
| NIR = B5 (0.85–0.88) RED = B4 (0.64–0.67) | [38] | |
| NIR = B5 (0.85–0.88) SWIR1 = B6 (1.57–1.65) | [39] | |
| SWIR1 = B6 (1.57–1.65) NIR = B5 (0.85–0.88) | [40] | |
| SWIR2 = B7 (2.11–2.29) NIR = B5 (0.85–0.88) | [41] | |
| Blue = B2 (0.45–0.51) TIR1 = B10 (10.6–11.19) | [42] | |
| SWIRI = B6 (1.57–1.65) Green = B3 (0.53–0.59) | [43] | |
| [43,44] | ||
| LULC Types | Forest Land | Built-Up Area | Water Bodies | Barren Land | Grassland | Length/km |
|---|---|---|---|---|---|---|
| LST (LT-I) | 30.69 | 37.58 | 30.1 | 36.16 | 35.14 | 29 |
| LULC (LT-I) | (24.4%) | (58.2%) | (7.8%) | (6.2%) | (3.3%) | (100%) |
| LST (LT II) | 34.58 | 38.13 | 34.88 | 37.09 | 36.68 | 28 |
| LULC (LT II) | (18.8%) | (68.2%) | (0.5%) | (2.5%) | (10%) | (100%) |
| LST (LT III) | 34.6 | 37.9 | 32.35 | 36.42 | 33.82 | 31.1 |
| LULC (LT III) | (20.3%) | (62%) | (0.9%) | (9.8%) | (7%) | (100%) |
| LST (LT IV) | 34.67 | 37.59 | 34.1 | 36.76 | 33.52 | 31.4 |
| LULC (LT IV) | (17%) | (73.7%) | (1.1%) | (3.8%) | (4.4%) | (100%) |
| Average LST | 33.64 | 37.8 | 32.85 | 36.61 | 34.79 |
| LULC Types | LST Difference (°C) |
|---|---|
| Between forest land and built-up | 4.16 |
| Between forest land and barren land | 2.97 |
| Between water bodies and built up | 4.59 |
| Between barren land and grass/Agri land | 1.8 |
| Between barren land and built-up | 1.19 |
| Between water bodies and forest land | 0.79 |
| LULC Indices | Intercept | Pearson’s r | R2 |
|---|---|---|---|
| Line transect I | |||
| NDVI | 38.97 ± 0.03 | −0.58 | 0.35 |
| NDWI | 35.63 ± 0.02 | −0.48 | 0.23 |
| NDBI | 37.85 ± 0.01 | 0.54 | 0.31 |
| DBI | 25.29 ± 0.07 | 0.67 | 0.45 |
| UI | 37.87 ± 0.017 | 0.55 | 0.29 |
| DBSI | 29.26 ± 0.11 | 0.72 | 0.49 |
| NDISI | 24.91 ± 0.14 | 0.51 | 0.31 |
| Line transect II | |||
| NDVI | 38.84 ± 0.01 | −0.46 | 0.22 |
| NDWI | 38.21 ± 0.14 | 0.16 | 0.02 |
| NDBI | 38.56 ± 0.00 | 0.51 | 0.26 |
| DBI | 31.69 ± 0.05 | 0.51 | 0.26 |
| UI | 38.61 ± 0.09 | 0.52 | 0.25 |
| DBSI | 33.35 ± 0.07 | 0.55 | 0.3 |
| NDISI | 29.89 ± 0.09 | 0.42 | 0.18 |
| Line transect III | |||
| NDVI | 39.31 ± 0.01 | −0.61 | 0.38 |
| NDWI | 38.41 ± 0.01 | −0.38 | 0.14 |
| NDBI | 38.26 ± 0.10 | 0.53 | 0.28 |
| DBI | 26.77 ± 0.06 | 0.61 | 0.38 |
| UI | 38.26 ± 0.10 | 0.53 | 0.28 |
| DBSI | 26.78 ± 0.06 | 0.61 | 0.38 |
| NDISI | 24.63 ± 0.07 | 0.61 | 0.38 |
| Line transect IV | |||
| NDVI | 39.20 ± 0.02 | −0.6 | 0.37 |
| NDWI | 37.51 ± 0.16 | 0.2 | 0.03 |
| NDBI | 38.41 ± 0.01 | 0.61 | 0.37 |
| DBI | 26.85 ± 0.06 | 0.6 | 0.37 |
| UI | 38.41 ± 0.01 | 0.61 | 0.37 |
| DBSI | 30.20 ± 0.09 | 0.62 | 0.39 |
| NDISI | 25.73 ± 0.14 | 0.49 | 0.24 |
| Various Indices | Co−Efficient | R2 | Adjusted R2 |
|---|---|---|---|
| Line transect I | |||
| Intercept | 37.1 | 0.28 | 0.28 |
| NDVI | −11.09 | ||
| NDWI | −15.36 | ||
| Intercept | 45.47 | 0.26 | 0.26 |
| BSI | 8.27 | ||
| UI | 25.66 | ||
| DBI | −14.47 | ||
| NDISI | 3.27 | ||
| Line transect II | |||
| Intercept | 38.62 | 0.24 | 0.24 |
| NDVI | −8.08 | ||
| NDWI | −5.86 | ||
| Intercept | 37.45 | 0.31 | 0.31 |
| NDBI | 20.85 | ||
| BSI | −12.84 | ||
| NDISI | 12.03 | ||
| Line transect III | |||
| Intercept | 38.85 | 0.39 | 0.39 |
| NDVI | −13.92 | ||
| NDWI | −6.59 | ||
| Intercept | 29 | 0.41 | 41 |
| BSI | 16.31 | ||
| NDISI | 2.87 | ||
| Line transect IV | |||
| Intercept | 38.85 | 0.39 | 0.39 |
| NDVI | −13.92 | ||
| NDWI | −6.59 | ||
| Intercept | 29 | 0.4 | 0.4 |
| BSI | 16.31 | ||
| NDISI | 2.87 |
| Various Indices | Co-Efficient | R2 | Adjusted R2 |
|---|---|---|---|
| Line transect I | |||
| Intercept | 31.77 | 0.34 | 0.34 |
| NDVI | −6.34 | ||
| NDWI | −17.57 | ||
| BSI | 10.98 | ||
| Line transect II | |||
| Intercept | 25.53 | 0.32 | 0.32 |
| NDWI | −13.38 | ||
| BSI | 9.91 | ||
| NDISI | 12.21 | ||
| Line transect III | |||
| Intercept | 22.05 | 0.44 | 0.44 |
| NDWI | −13.56 | ||
| BSI | 16.64 | ||
| NDISI | 12.73 | ||
| Line transect IV | |||
| Intercept | 24.98 | 0.41 | 0.41 |
| NDVI | 6.16 | ||
| NDWI | −4.48 | ||
| BSI | 26.89 |
Publisher’s Note: MDPI stays neutral with regard to jurisdictional claims in published maps and institutional affiliations. |
© 2021 by the authors. Licensee MDPI, Basel, Switzerland. This article is an open access article distributed under the terms and conditions of the Creative Commons Attribution (CC BY) license (https://creativecommons.org/licenses/by/4.0/).
Share and Cite
Khan, M.S.; Ullah, S.; Chen, L. Comparison on Land-Use/Land-Cover Indices in Explaining Land Surface Temperature Variations in the City of Beijing, China. Land 2021, 10, 1018. https://doi.org/10.3390/land10101018
Khan MS, Ullah S, Chen L. Comparison on Land-Use/Land-Cover Indices in Explaining Land Surface Temperature Variations in the City of Beijing, China. Land. 2021; 10(10):1018. https://doi.org/10.3390/land10101018
Chicago/Turabian StyleKhan, Muhammad Sadiq, Sami Ullah, and Liding Chen. 2021. "Comparison on Land-Use/Land-Cover Indices in Explaining Land Surface Temperature Variations in the City of Beijing, China" Land 10, no. 10: 1018. https://doi.org/10.3390/land10101018
APA StyleKhan, M. S., Ullah, S., & Chen, L. (2021). Comparison on Land-Use/Land-Cover Indices in Explaining Land Surface Temperature Variations in the City of Beijing, China. Land, 10(10), 1018. https://doi.org/10.3390/land10101018