Soil Tillage and Crop Growth Effects on Surface and Subsurface Runoff, Loss of Soil, Phosphorus and Nitrogen in a Cold Climate


Abstract
1. Introduction
2. Materials and Methods
2.1. Site Description and Experimental Design
2.2. Treatments and Agricultural Management
2.3. Measurements
2.4. Analyses of Water Samples
2.5. Statistical Analysis
3. Results and Discussion
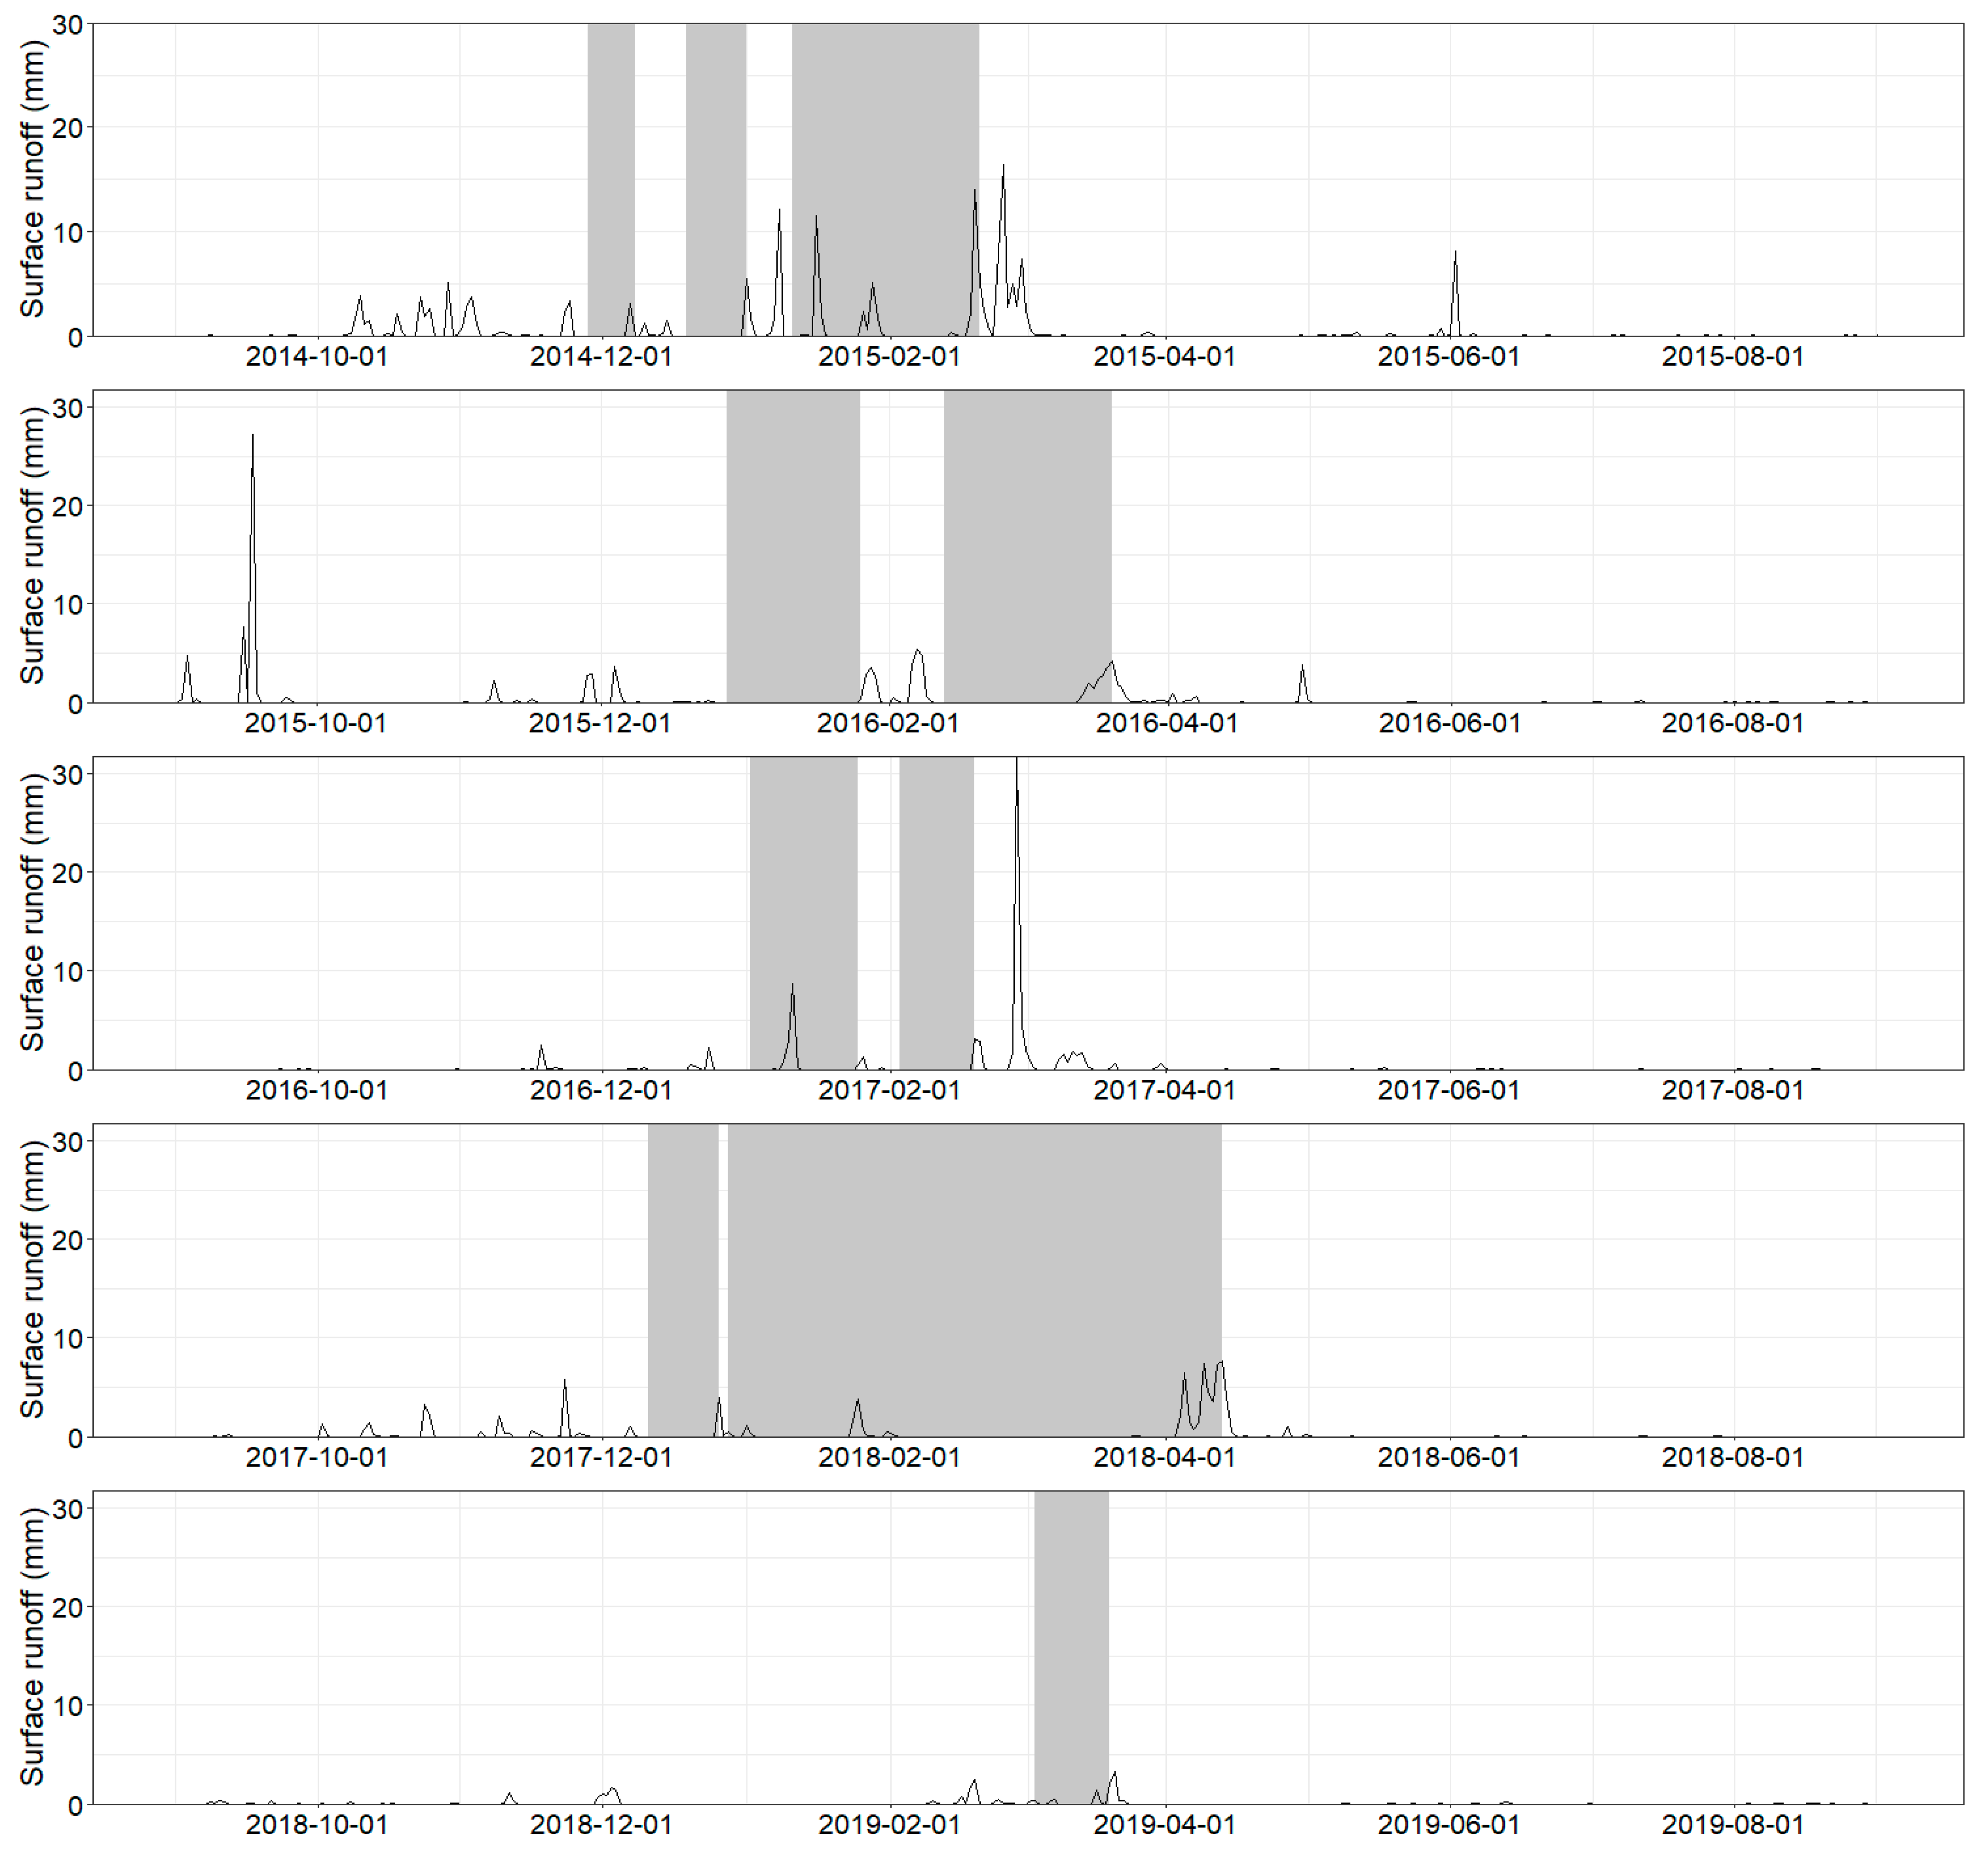
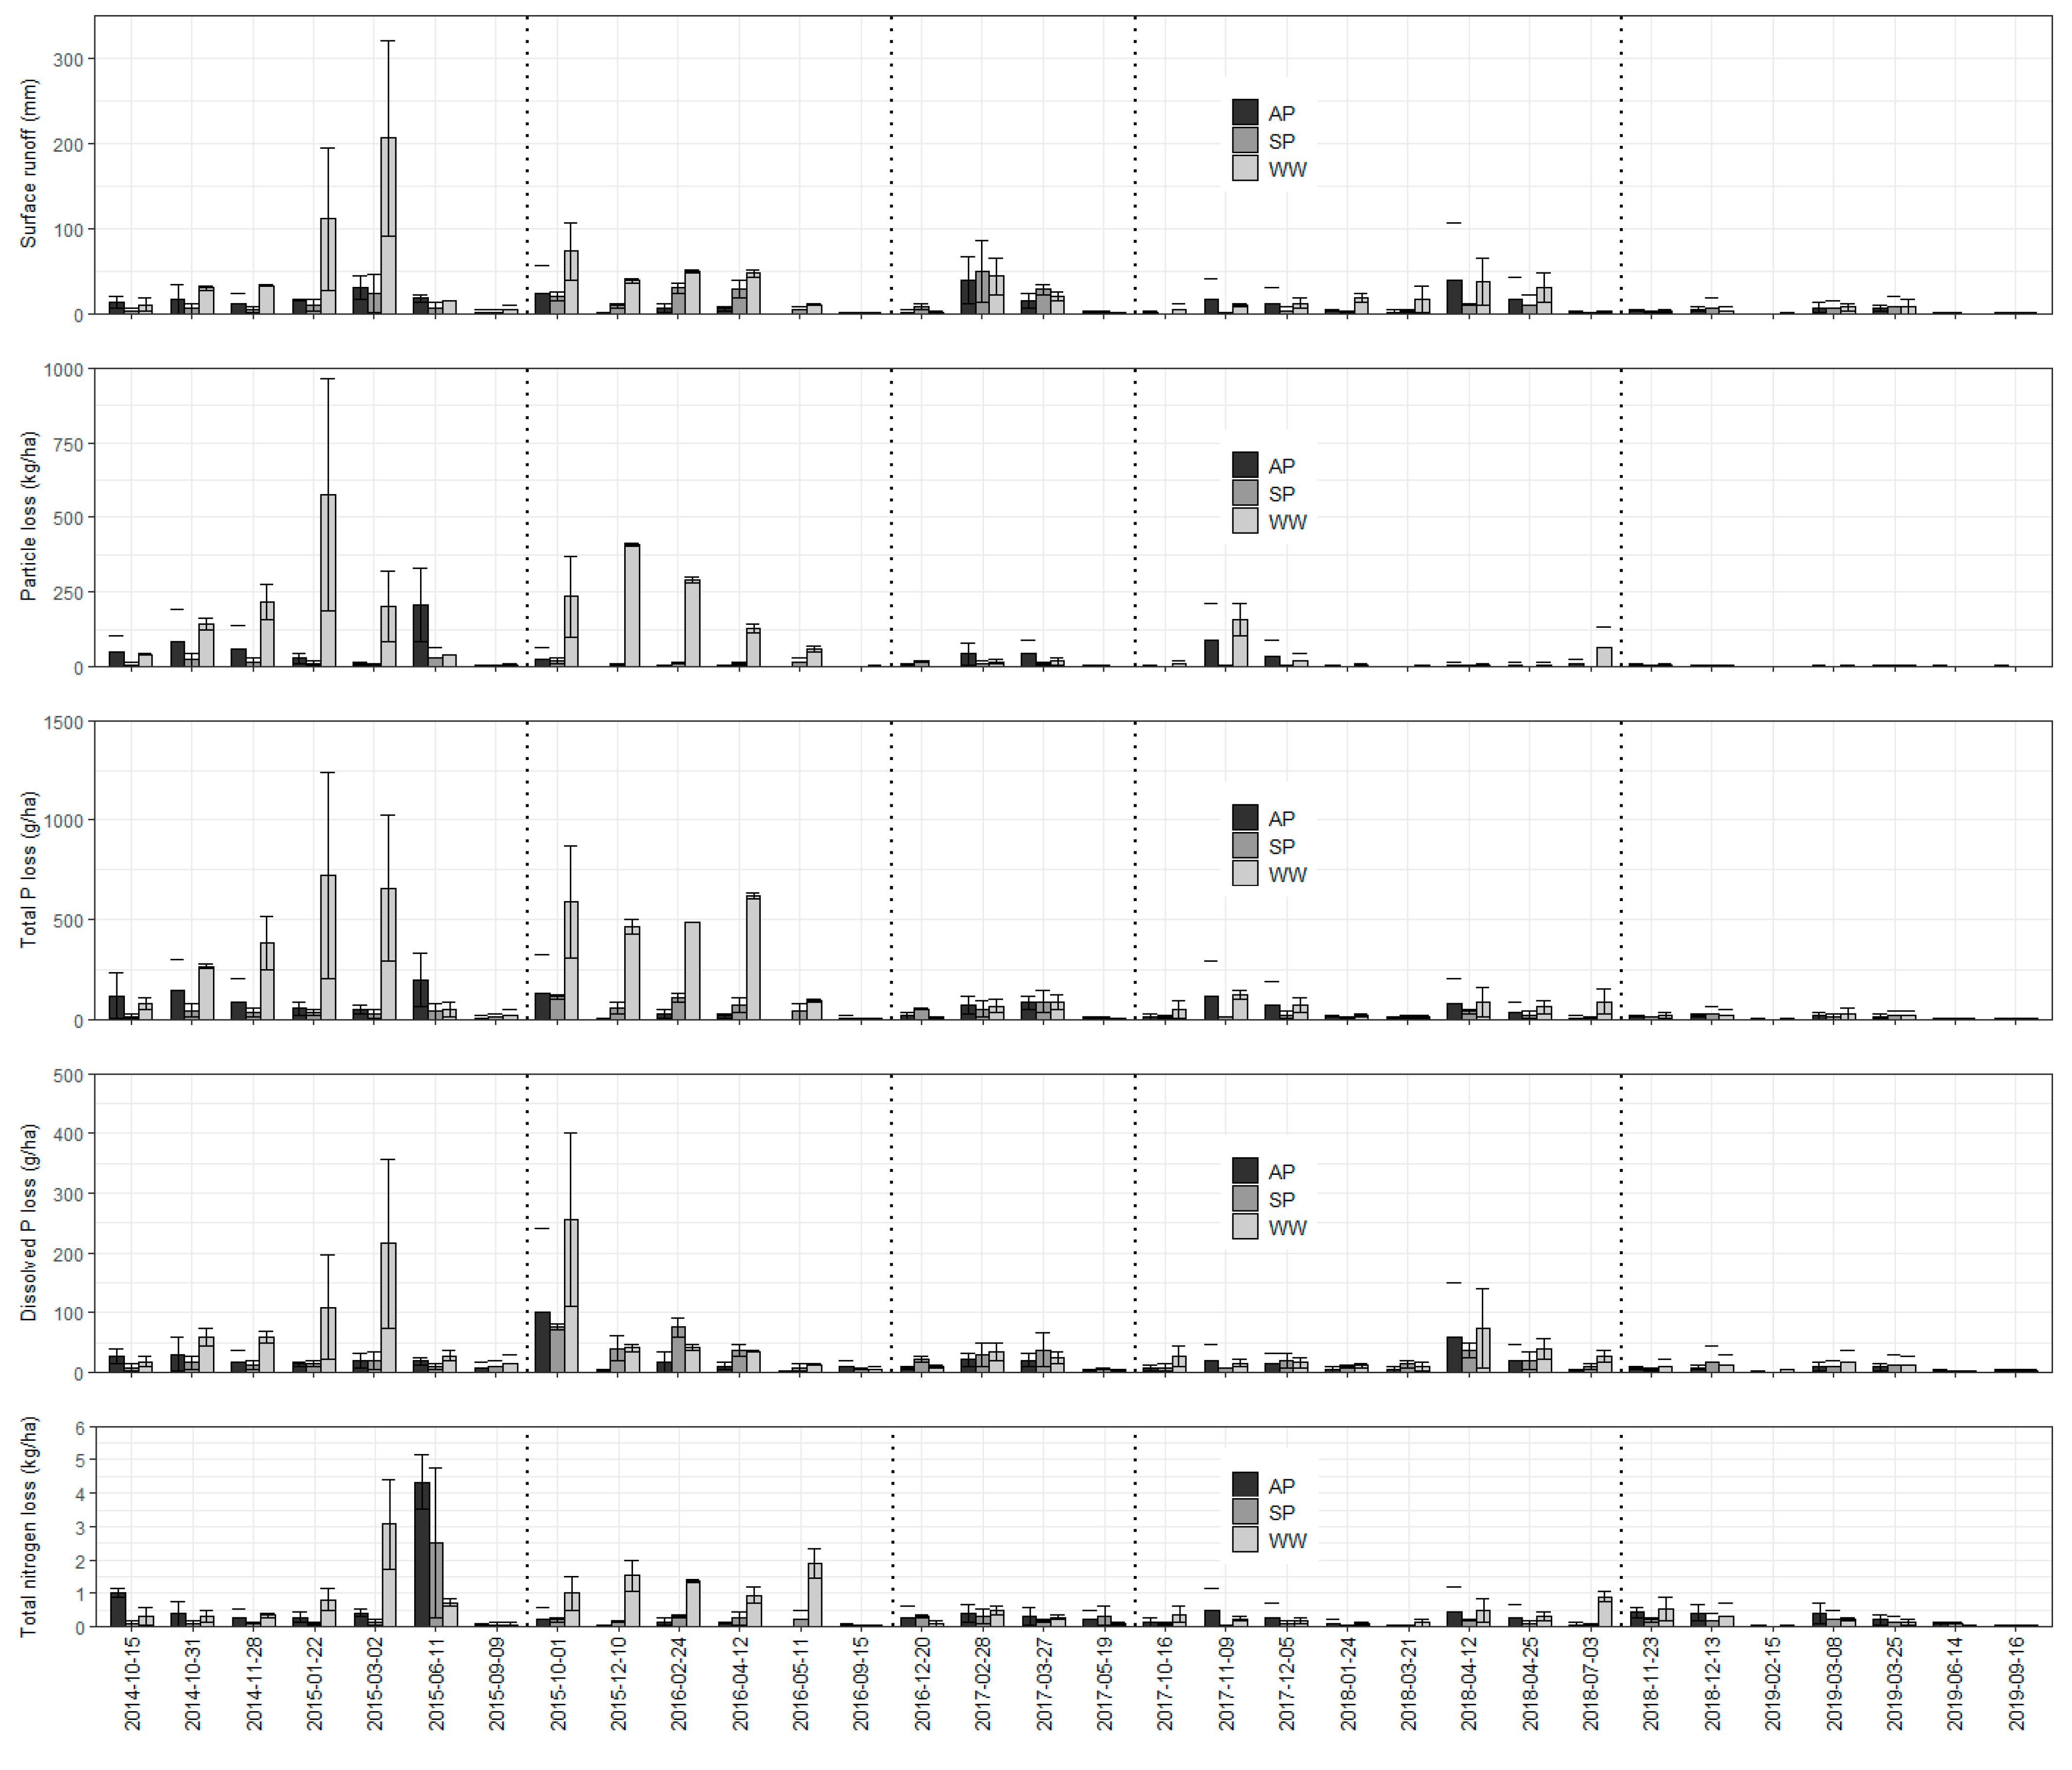
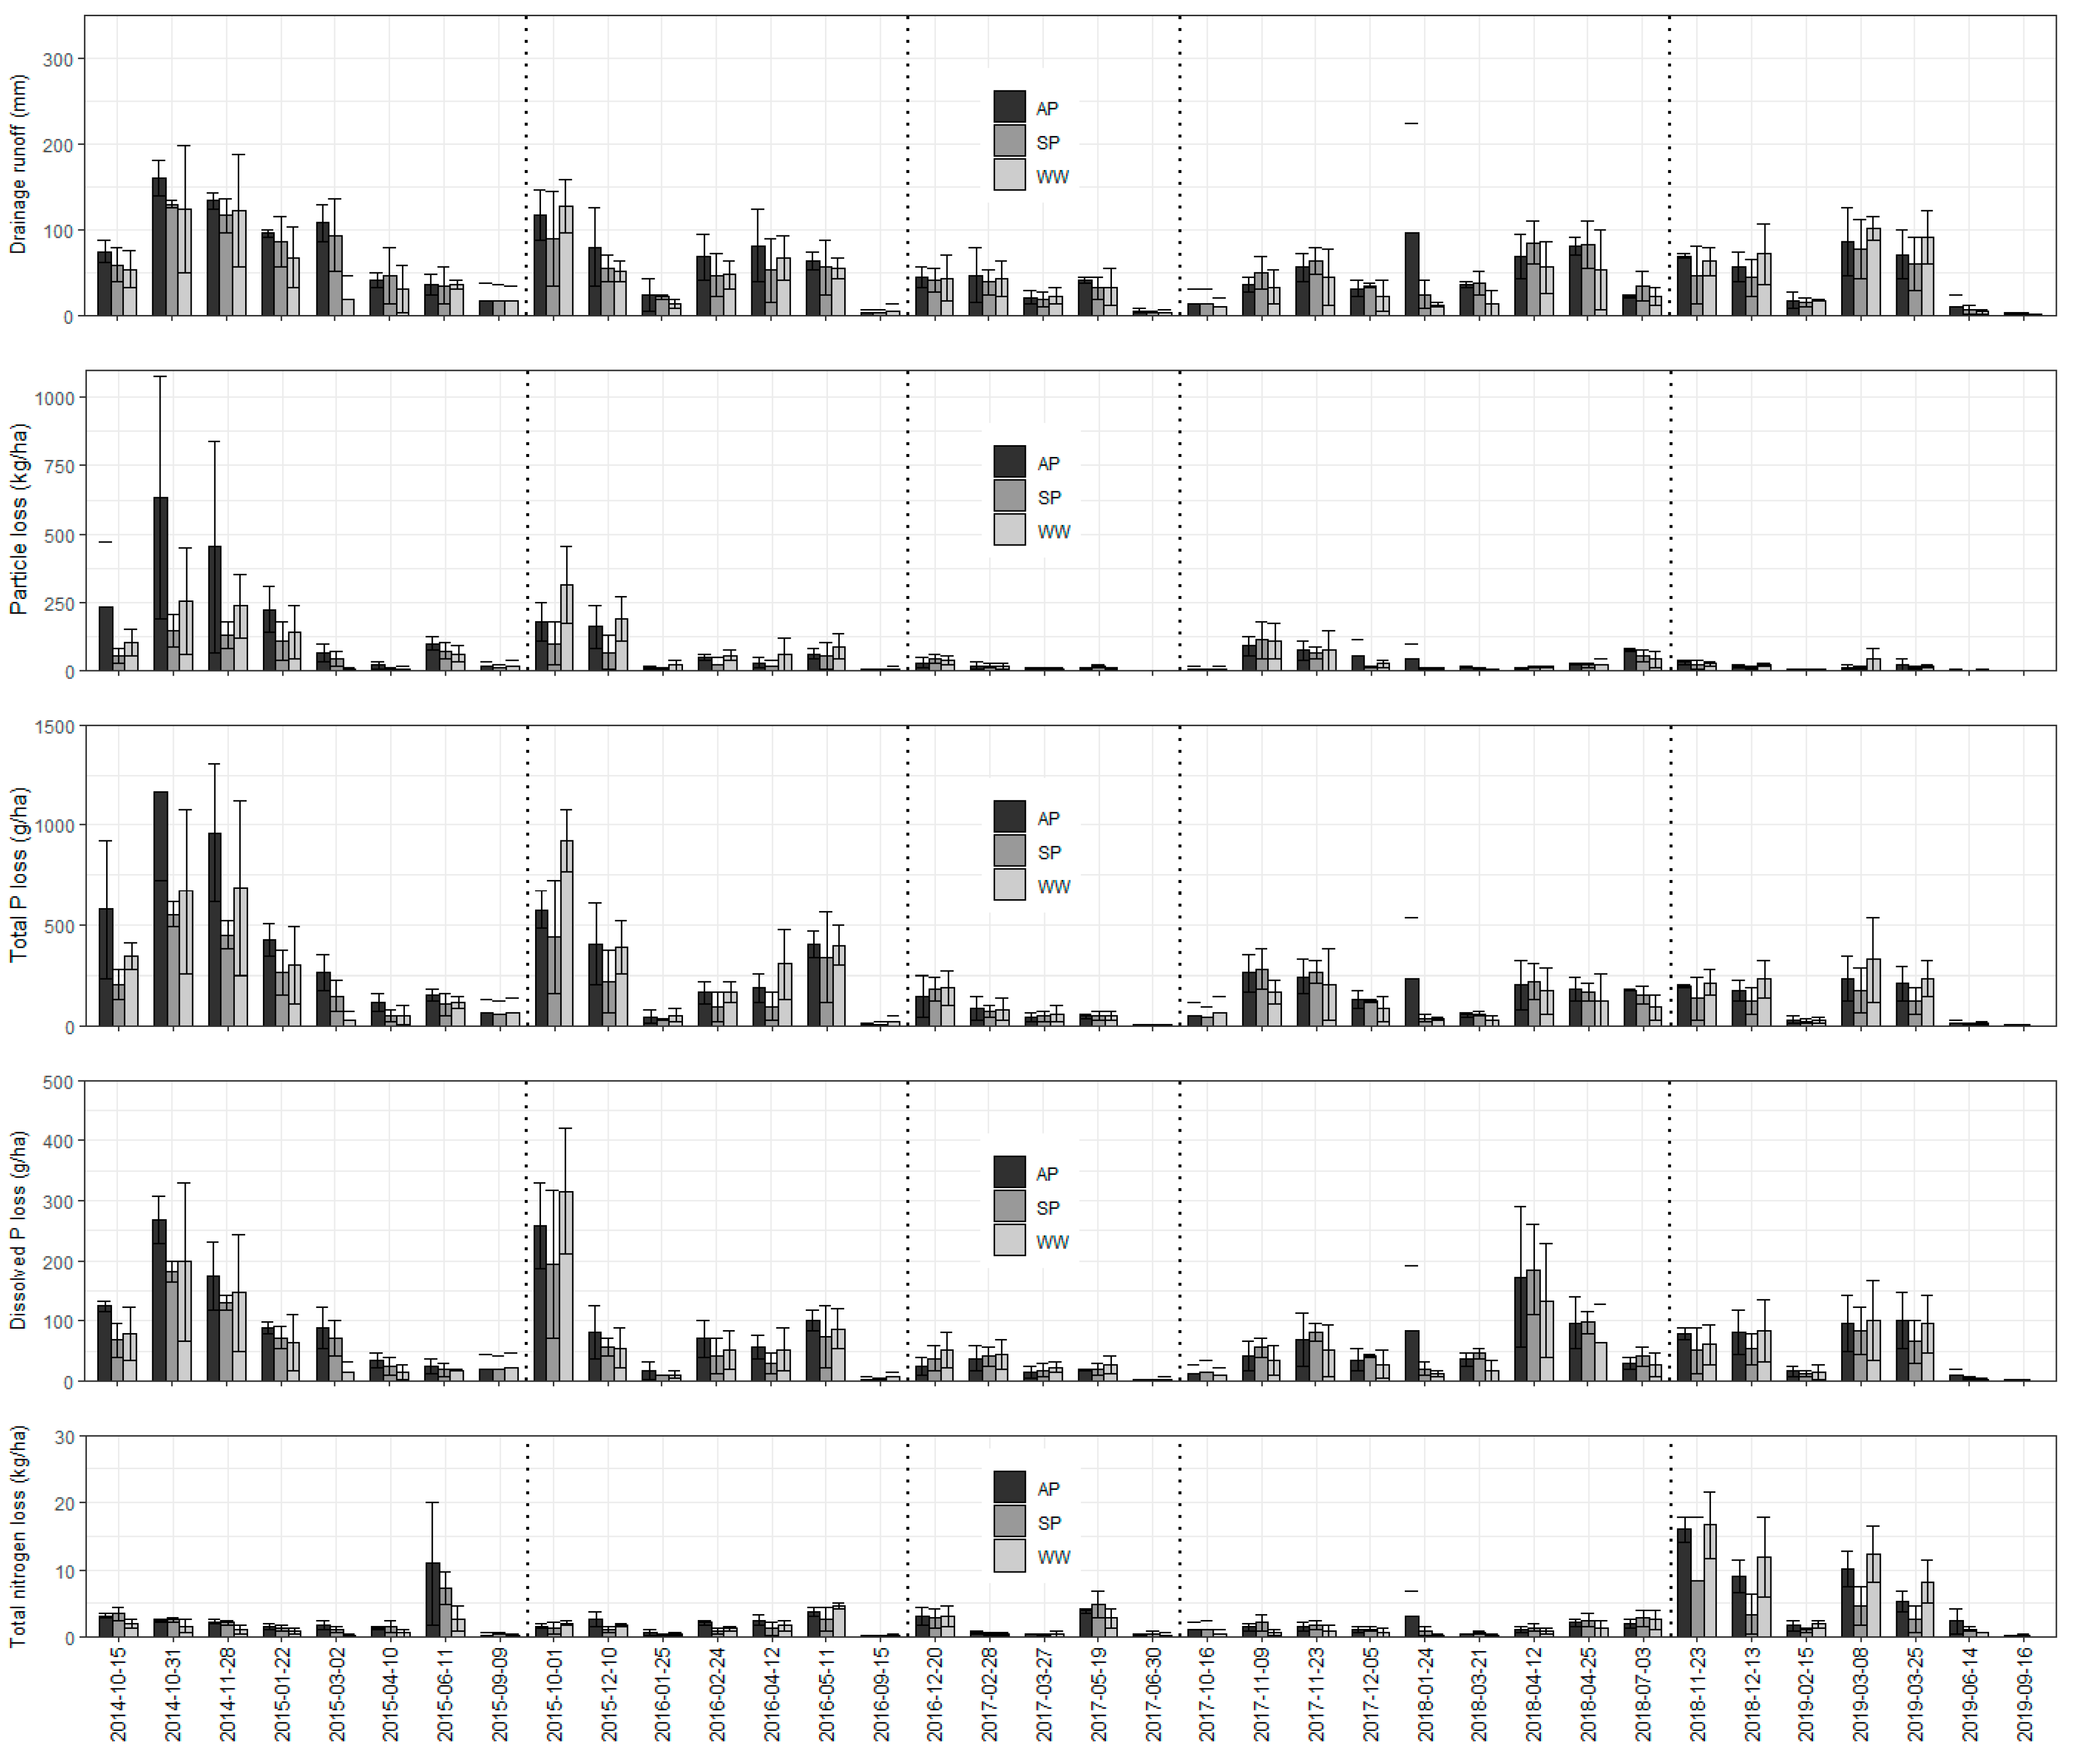
3.1. Surface and Subsurface Runoff
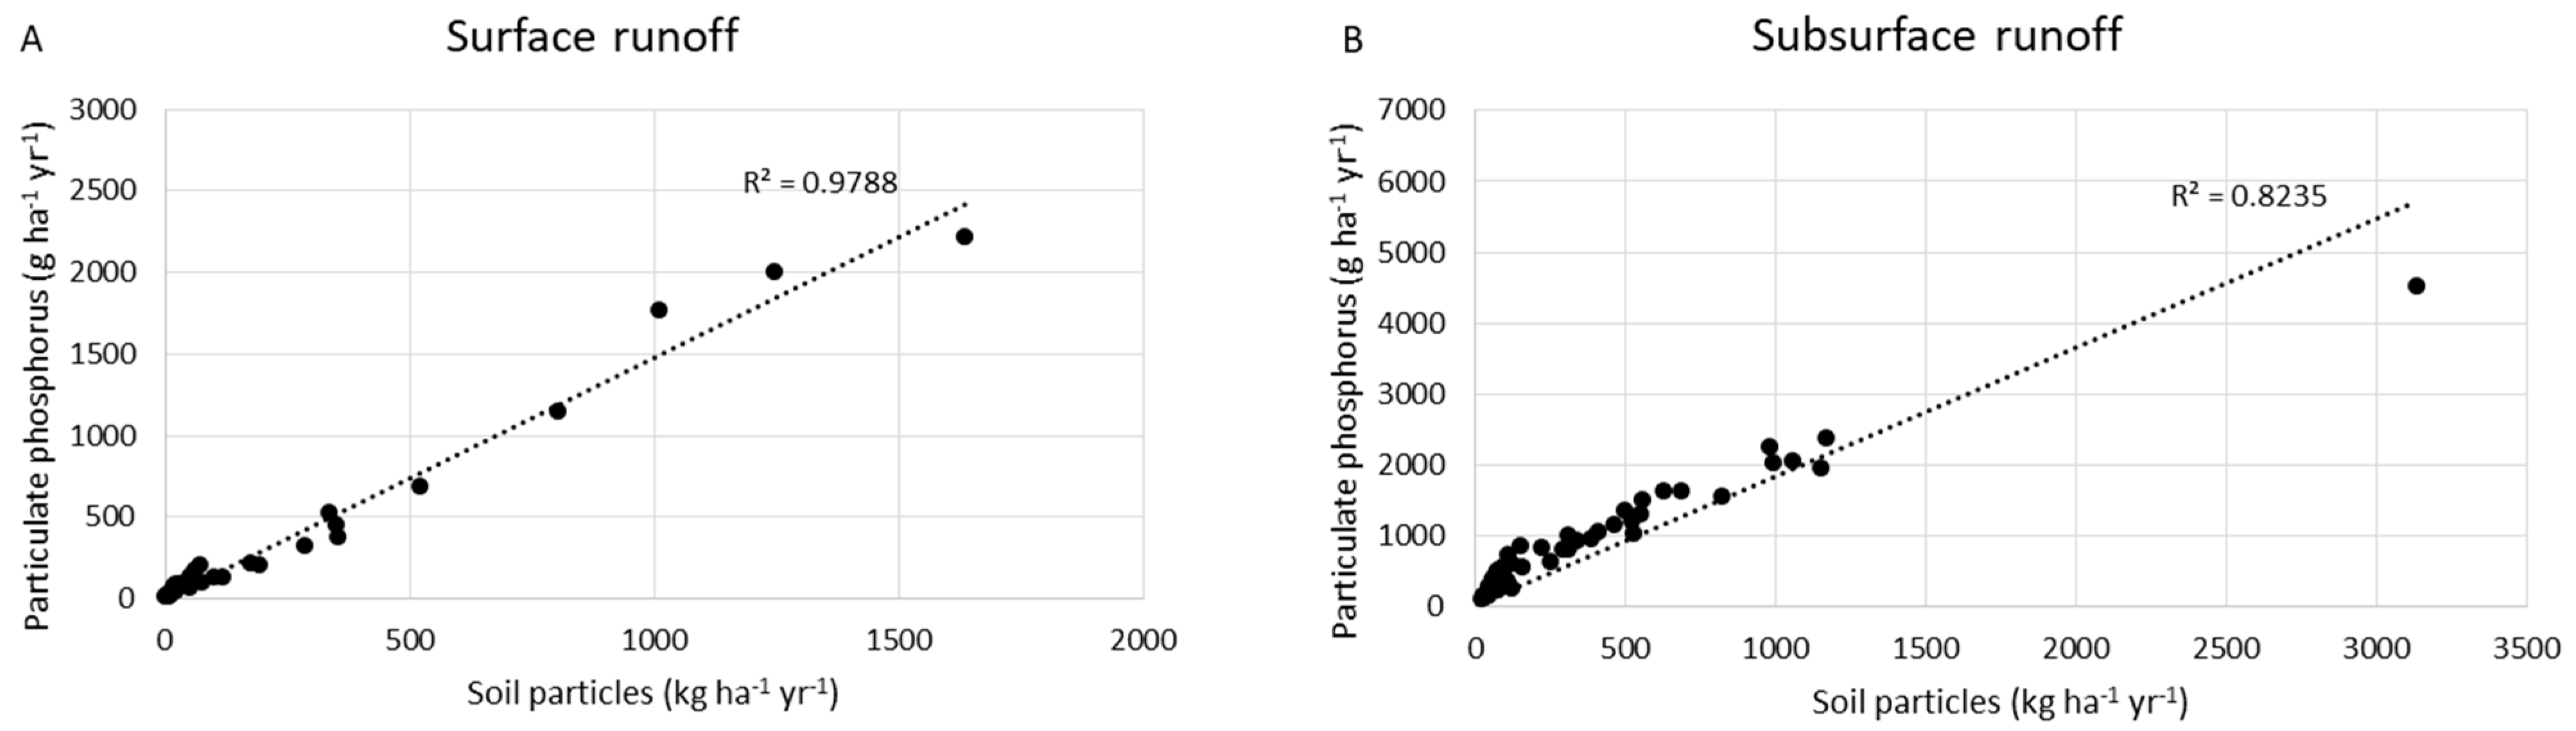
3.2. Loss of Soil Particles
3.3. Loss of Total Phosphorus
3.4. Loss of Total Nitrogen
4. Conclusions
Author Contributions
Funding
Institutional Review Board Statement
Informed Consent Statement
Data Availability Statement
Acknowledgments
Conflicts of Interest
References
- Wischmeier, W.H.; Smith, D.D. Predicting Rainfall Erosion Losses: A Guide to Conservation Planning. Science, US Department of Agriculture Handbook; U.S. Department of Agriculture: Washington, DC, USA, 1978; No. 537.
- Ulén, B.; Aronsson, H.; Bechmann, M.; Krogstad, T.; Øygarden, L.; Stenberg, M. Soil tillage methods to control phosphorus loss and potential side-effects: A Scandinavian review. Soil Use Manag. 2010, 26, 94–107. [Google Scholar] [CrossRef]
- Koskiaho, J.; Kivisaari, S.; Vermeulen, S.; Kauppila, R.; Kallio, K.; Puustinen, M. Reduced tillage: Influence on erosion and nutrient losses in a clayey field in southern Finland. Agric. Food Sci. Finl. 2002, 11, 37–50. [Google Scholar] [CrossRef]
- Turtola, E.; Alakukku, L.; Uusitalo, R.; Kaseva, A. Surface runoff, subsurface drainflow and soil erosion as affected by tillage in a clayey Finnish soil. Agric. Food Sci. Finl. 2007, 16, 332–351. [Google Scholar] [CrossRef]
- Skøien, S.E.; Børresen, T.; Bechmann, M. Effect of tillage methods on soil erosion in Norway. Acta Agric. Scand. Sect. B Soil Plant 2012, 62, 191–198. [Google Scholar] [CrossRef]
- Riley, H.; Børresen, T.; Ekeberg, E.; Rydberg, T. Trends in reduced tillage research and practice in Scandinivia. In Conservation Tillage in Temperate Agroecosystems; Carter, R.M., Ed.; Lewis Publichers: Boka Raton, FL, USA, 1994; Chapter 2; pp. 40–43. [Google Scholar]
- Riley, H.; Pommeresche, R.; Eltun, R.; Hansen, S.; Korsaeth, A. Soil structure, organic matter and earthworm activity in a comparison of cropping systems with contrasting tillage, rotations, fertilizer levels and manure use. Agric. Ecosyst. Environ. 2008, 124, 275–284. [Google Scholar] [CrossRef]
- Bechmann, M. Effect of tillage on sediment and phosphorus losses from a field and a catchment in southeastern Norway. Special Issue on Soil in erosion in Nordic countries. Acta Agric. Scand. Sect. B Plant Soil 2012, 62, 206–216. [Google Scholar]
- Hansen, E.M.; Djurhuus, J. Yield and N uptake as affected by soil tillage and catch crop. Soil Tillage Res. 1997, 42, 241–252. [Google Scholar] [CrossRef]
- Stenberg, M.; Ulén, B.; Söderström, M.; Roland, B.; Delin, K.; Helander, C.-A. Tile drain losses of nitrogen and phosphorus from fields under integrated and organic crop rotations. A four-year study on a clay soil in southwest Sweden. Sci. Total Environ. 2012, 434, 79–89. [Google Scholar] [CrossRef]
- Øygarden, L.; Børresen, T. Best management practice in Norway to keep good water quality of syrface waters in rural areas. In Prediction and Reduction of Diffuse Pollution, Solid Emission and Extreme Flows from Rural Areas—Case study of Small Agricultural Catchment; Banasik, K., Øygarden, L., Hejduk, L., Eds.; Wydawnictwo SGGW: Warszawe, Poland, 2011; pp. 181–202. [Google Scholar]
- Uusitalo, R.; Lemola, R.; Turtola, E. Surface and Subsurface Phosphorus Discharge from a Clay Soil in a Nine-Year Study Comparing No-Till and Plowing. J. Environ. Qual. 2018, 47, 1478–1486. [Google Scholar] [CrossRef]
- Uusitalo, R.; Turtola, E.; Lemola, R. Phosphorus losses form a sub-drained clayey soil as affected by cultivation practices. Agric. Food Sci. Finl. 2007, 16, 352–365. [Google Scholar] [CrossRef]
- Stahli, M.; Nyberg, L.; Mellander, P.-E.; Jansson, P.-E.; Bishop, K.H. Soil frost effects on 5 soil water and runoff dynamics along a boreal transect: 2. Simulations. Hydrol. Process. 2001, 15, 927–941. [Google Scholar] [CrossRef]
- Al-Houri, Z.M.; Barber, M.E.; Yonge, D.R.; Ullman, J.L.; Beutel, M.W. Impact of frozen soil in the performance of infiltration treatment facilities. Cold Reg. Sci. Technol. 2009, 59, 51–57. [Google Scholar] [CrossRef]
- Starkloff, T. Winter Hydrology and Soil Erosion Processes in an Agricultural Catchment in Norway; Wageningen University: Wageningen, The Netherlands, 2017. [Google Scholar] [CrossRef]
- Hanssen-Bauer, I.; Førland, E.J.; Haddeland, I.; Hisdal, H.; Mayer, S.; Nesje, A.; Nilsen, J.E.Ø.; Sandven, S.; Sandø, A.B.; Sorteberg, A.; et al. Klima i Norge 2100—Kunnskapsgrunnlag for Klimatilpasning, Oppdatert i 2015. (In English: Climate in Norway 2100—Knowledge Base for Climate Adaptation, Updated in 2015); Report 2/2015; Norwegian Centre for Climate Services: Oslo, Norway, 2015; p. 203. Available online: https://klimaservicesenter.files.wordpress.com/2015/02/klimainorge2100_hoyoppl.pdf (accessed on 22 December 2020).
- Klik, A.; Eitzinger, J. Impact of climate change on soil erosion and the efficiency of soil conservation practices in Austria. J. Agric. Sci. 2010, 1–13. [Google Scholar] [CrossRef]
- Wihrén, L. Nordic agriculture under climate change: A systematic review of challenges, opportunities and adaptation strategies for crop production. Land Use Policy 2018, 77, 63–74. [Google Scholar]
- Norwegian Meteorological Institute. 2020. Available online: www.met.no (accessed on 22 December 2020).
- NS-EN ISO 15681-2:2018. Available online: https://www.standard.no/no/Nettbutikk/produktkatalogen/Produktpresentasjon/?ProductID=1026473 (accessed on 22 December 2020).
- Uhlen, G. Nutrient leaching and surface runoff in field lysimeters on a cultivated soil. Nutrient balances. Nor. J. Agric. Sci. 1989, 3, 33–46. [Google Scholar]
- Rittenburg, R.A.; Squires, A.L.; Boli, J.; Brooks, E.S.; Easton, Z.M.; Steenhuis, T.S. Agricultural BMP Effectiveness and Dominant Hydrological Flow Paths: Concepts and a Review. J. Am. Water Resour. Assoc. 2015, 51, 305–329. [Google Scholar] [CrossRef]
- Riley, H. Grain yields and soil properties on loam soil after three decades with conservation tillage in southeast Norway. Acta Agric. Scand. Sect. B Soil Plant Sci. 2014, 64, 185–202. [Google Scholar] [CrossRef]
- Ulén, B. Nutrient losses by surface run-off from soils with winter cover crops and spring ploughed soils in the south of Sweden. Soil Tillage Res. 1997, 44, 165–177. [Google Scholar] [CrossRef]
- Lundekvam, H.; Skøien, S. Soil erosion in Norway. An overview of measurements from soil loss plots. Soil Use Manag. 1998, 14, 84–89. [Google Scholar] [CrossRef]
- Morgan, R.P.C. Soil Erosion and Conservation. Geogr. J. 2005, 162, 304. [Google Scholar] [CrossRef]
- Kinderiene, I.; Karcauskiene, D. Effects of different crop rotations on soil erosion and nutrient losses under natural rainfall conditions in Western Lithuania. Acta Agric. Scand. Sect. B Soil Plant Sci. 2012, 62. [Google Scholar] [CrossRef]
- Sharpley, A.N. The Enrichment of Soil Phosphorus in Runoff Sediments. J. Environ. Qual. 1980, 9, 521–526. [Google Scholar] [CrossRef]
- Svanbäck, A.; Ulén, B.; Etana, A.; Bergström, L.; Kleinman, P.; Mattsson, L. Influence of soil phosphorus and manure on phosphorus leaching in Swedish topsoils. Nutr. Cycl. Agroecosyst. 2013, 96, 133–147. [Google Scholar] [CrossRef]
- Hoffman, A.R.; Polecitski, A.S.; Penn, M.R.; Busch, D.L. Long-term variation in agricultural edge-of-field phosphorus transport during snowmelt, rain, and mixed runoff events. J. Environ. Qual. 2019, 48, 931–940. [Google Scholar] [CrossRef] [PubMed]
- Randall, G.W.; Goss, M.J. Nitrate Losses to Surface Water Through Subsurface, Tile Drainage. In Nitrogen in the Environment: Sources, Problems and Management; Scientific World Journal: London, UK, 2001; pp. 95–122. [Google Scholar] [CrossRef]
- Bechmann, M.; Blicher-Mathiesen, G.; Kyllmar, K.; Iital, A.; Lagzdins, A.; Salo, T. Nitrogen application, balances and the effect on nitrogen concentrations in runoff from small catchments in the Nordic-Baltic countries. Agric. Ecosyst. Environ. 2014, 198, 104–113. [Google Scholar] [CrossRef]
- Salo, T.; Turtola, E. Nitrogen balance as an indicator of nitrogen leaching in Finland. Agric. Ecosyst. Environ. 2006, 113, 98–107. [Google Scholar] [CrossRef]
- Rankinen, K.; Salo, T.; Granlund, K.; Rita, H. Simulated nitrogen leaching, nitrogen mass field balances and their correlation on four farms in south-western Finland during the period 2000–2005. Agric. Food Sci. Finl. 2007, 16, 387–406. [Google Scholar] [CrossRef]


| Plot No. | Loss on Ignition | pH | Total Phosphorus | P-AL | Water Extractable Phosphorus |
|---|---|---|---|---|---|
| % | mg kg−1 | mg kg−1 | mg kg−1 | ||
| 1 | 5.2 | 6.4 | 1300 | 336 | 6.6 |
| 2 | 4.8 | 6.4 | 1100 | 204 | 5.2 |
| 3 | 5.0 | 6.4 | 1100 | 194 | 4.1 |
| 4 | 5.1 | 6.5 | 1000 | 184 | 3.8 |
| 5 | 5.2 | 6.3 | 1000 | 140 | 3.3 |
| 6 | 5.4 | 6.3 | 1100 | 162 | 4.0 |
| 7 | 6.3 | 6.2 | 1200 | 192 | 4.6 |
| 8 | 5.7 | 6.4 | 1100 | 188 | 4.0 |
| 9 | 5.8 | 6.3 | 900 | 136 | 3.5 |
| Treatment | Autumn Ploughing (AP) * | Autumn Ploughing with Winter Wheat (WW) ** | Spring Ploughing (SP) * | |||
|---|---|---|---|---|---|---|
| Year | Tillage | Sowing | Tillage | Sowing | Tillage | Sowing |
| 2014/2015 | 2 September 2014 | 15 May 2015 | 2 September 2014 | 10 September 2014 | 9 May 2015 | 15 May 2015 |
| 2015/2016 | 13 October 2015 | 11 May 2016 | 12 September 2015 | 4 October 2015 | 28 April 2016 | 11 May 2016 |
| 2016/2017 | 10 October 2015 | 6 May 2017 | 6 September 2016 | 10 September 2016 | 4 May 2016 | 6 May 2017 |
| 2017/2018 | 16 October 2017 | 15 May 2018 | 22 September 2017 | 26 September 2017 | 13 May 2018 | 15 May 2018 |
| 2018/2019 | 17 October 2018 | 8 May 2019 | 3 September 2018 | 5 September 2018 | 26 April 2019 | 8 May 2018 |
| Treatment | Autumn Ploughing and Spring Oats (AP) | Autumn Ploughing and Winter Wheat (WW) | Spring Ploughing and Spring Barley (SP) | ||||||
|---|---|---|---|---|---|---|---|---|---|
| Year | Fertilizer | Yield | Fertilizer | Yield | Fertilizer | Yield | |||
| kg ha−1 | Tons ha−1 | kg ha−1 | Tons ha−1 | kg ha−1 | Tons ha−1 | ||||
| N | P | Dry Weight | N | P | Dry Weight | N | P | Dry Weight | |
| 2014/2015 | 110 | 8 | 3.7 | 130 | 5 | 7.3 | 110 | 8 | 2.6 |
| 2015/2016 | 110 | 7 | 5.2 | 110 | 4 | 4.7 | 110 | 7 | 6.0 |
| 2016/2017 | 110 | 7 | 5.1 | 160 | 6 | 7.4 | 110 | 7 | 4.9 |
| 2017/2018 | 110 | 7 | 2.1 | 210 | 7 | 1.9 | 110 | 7 | 2.0 |
| 2018/2019 | 110 | 7 | * | 180 | 7 | * | 110 | 7 | * |
| Normal | Monthly Average Precipitation (mm) | Normal | Monthly Air Temperature (°C) | |||||||||
|---|---|---|---|---|---|---|---|---|---|---|---|---|
| Years | 1981–2010 | 14/15 | 15/16 | 16/17 | 17/18 | 18/19 | 1981–2010 | 14/15 | 15/16 | 16/17 | 17/18 | 18/19 |
| September | 74 | 35 * | 169 | 30 | 70 | 77 | 10.1 | 10.8 * | 10.8 | 13.7 | 11 | 11.2 |
| October | 87 | 158 * | 10 | 24 | 100 | 51 | 5.4 | 8.3 * | 5.6 | 4.5 | 5.8 | 5.6 |
| November | 79 | 87 * | 62 | 61 | 94 | 88 | 0.6 | 3.4 * | 2.5 | −0.2 | −0.1 | 2.4 |
| December | 59 | 56 | 54 | 29 | 56 | 73 | −3.6 | −3.7 | 1.0 | −0.7 | −3 | −3.4 |
| January | 53 | 104 | 47 | 49 | 80 | 23 | −4.4 | −1.4 | −8.8 | −2.7 | −2.9 | −7.5 |
| February | 38 | 29 | 52 | 60 | 21 | 63 | −4.1 | −1.1 | −2.9 | −2.7 | −5.5 | −1.1 |
| March | 45 | 47 | 56 | 67 | 11 | 87 | −0.6 | 1.9 | 1.4 | 1.5 | −5.1 | 0.8 |
| April | 43 | 13 | 101 | 34 | 52 | 13 | 4.4 | 5.1 | 4.4 | 3.6 | 4.2 | 6.4 |
| May | 50 | 119 | 31 | 59 | 26 | 81 | 10.2 | 7.8 | 11.2 | 10.4 | 14.7 | 8.9 |
| June | 78 | 61 | 37 | 64 | 47 | 65 | 13.7 | 12.8 | 15.2 | 13.8 | 16.3 | 14.3 |
| July | 81 | 75 | 79 | 46 | 30 | 34 | 15.9 | 14.8 | 15.9 | 15 | 20.4 | 16.0 |
| August | 92 | 52 | 126 | 79 | 42 | 91 | 14.8 | 14.7 | 14.1 | 14.1 | 14.8 | 15.6 |
| Annual | 780 | 836 | 823 | 600 | 627 | 745 | 5.2 | 6.2 | 5.9 | 5.9 | 5.9 | 5.8 |
| Runoff | |||
|---|---|---|---|
| Year | Surface (mm) | Subsurface (mm) | Total (mm) |
| 14/15 | 171 | 557 (77%) | 728 |
| 15/16 | 112 | 414 (79%) | 525 |
| 16/17 | 80 | 146 (64%) | 227 |
| 17/18 | 85 | 384 (82%) | 468 |
| 18/19 | 26 | 304 (92%) | 330 |
| Year | Tillage | Surface Runoff (mm) | Subsurface Runoff (mm) | Soil Particles (kg ha−1) | Total-Phosphorus (g ha−1) | Dissolved Reactive Phosphorus (g ha−1) | Total-Nitrogen (kg ha−1) | ||||
|---|---|---|---|---|---|---|---|---|---|---|---|
| s | d | s | d | s | d | s | D | ||||
| 2014/2015 | AP | 108 a | 651 a | 437 ab | 1726 b | 661 ab | 3670 b * | 126 a | 800 a | 6.7 a | 23.4 b |
| WW | 407 b | 454 a | 1220 b | 808 b | 2174 b | 2205 ab * | 488 b | 533 a | 5.6 a | 9.1 a | |
| SP | 55 a | 565 a | 88 a | 557 a | 204 a | 1790 a * | 81 a | 564 a | 3.0 a | 19.5 ab | |
| 2015/2016 | AP | 41 a | 474 a | 32 a | 517 b | 221 a | 1932 b * | 160 a | 629 a | 0.7 a | 14.2 a |
| WW | 231 b | 405 a | 1128 b | 768 b | 2311 b | 2412 ab * | 422 b | 626 a | 6.9 b | 12.6 a | |
| SP | 99 ab | 361 a | 64 a | 290 a | 443 a | 1355 a * | 265 ab | 447 a | 1.3 ab | 8.2 a | |
| 2016/2017 | AP | 59 a | 161 a | 92 a | 62 b | 192 a | 338 b * | 54 a | 99 a | 1.2 a | 8.4 a |
| WW | 67 a | 146 a | 37 a | 71 b | 201 a | 386 ab * | 93 a | 147 a | 1.1 a | 7.0 a | |
| SP | 89 a | 133 a | 39 a | 84 a | 210 a | 366 a * | 96 a | 115 a | 1.2a | 8.8 a | |
| 2017/2018 | AP | 93 a | 453 a | 116 a | 395 b | 361 a | 1595 b * | 137 a | 588 a | 1.9 ab | 14.8 a |
| WW | 138 a | 277 a | 276 b | 304 b | 553 b | 1042 ab * | 224 a | 384 a | 2.8 b | 8.3 a | |
| SP | 31 a | 438 a | 7 a | 294 a | 157 a | 1404 a * | 129 a | 596 a | 0.7 a | 15.4 a | |
| 2018/2019 | AP | 26 a | 312 a | 16 a | 82 b | 88 a | 867 b * | 41 a | 383 a | 1.6 a | 44.6 b |
| WW | 27 a | 350 a | 12 a | 113 b | 109 a | 1054 ab * | 58 a | 359 a | 1.3 a | 51.7 b | |
| SP | 27 a | 254 a | 10 a | 56 a | 84 a | 603 a * | 49 a | 271 a | 0.8 a | 21.4 a | |
| All years | AP | 61 a | 410 b | 117 a | 557 b | 268 a | 1680 b * | 100 a | 500 a | 2.0 a | 21.1 b |
| 2014–2019 | WW | 151 b | 323 a | 436 b | 412 b | 887 b | 1408 ab * | 225 b | 401 a | 3.1 b | 17.7 a |
| SP | 55 a | 350 ab | 39 a | 256 a | 194 a | 1103 a * | 107 a | 398 a | 1.4 a | 14.6 a | |
Publisher’s Note: MDPI stays neutral with regard to jurisdictional claims in published maps and institutional affiliations. |
© 2021 by the authors. Licensee MDPI, Basel, Switzerland. This article is an open access article distributed under the terms and conditions of the Creative Commons Attribution (CC BY) license (http://creativecommons.org/licenses/by/4.0/).
Share and Cite
Bechmann, M.E.; Bøe, F. Soil Tillage and Crop Growth Effects on Surface and Subsurface Runoff, Loss of Soil, Phosphorus and Nitrogen in a Cold Climate. Land 2021, 10, 77. https://doi.org/10.3390/land10010077
Bechmann ME, Bøe F. Soil Tillage and Crop Growth Effects on Surface and Subsurface Runoff, Loss of Soil, Phosphorus and Nitrogen in a Cold Climate. Land. 2021; 10(1):77. https://doi.org/10.3390/land10010077
Chicago/Turabian StyleBechmann, Marianne E., and Frederik Bøe. 2021. "Soil Tillage and Crop Growth Effects on Surface and Subsurface Runoff, Loss of Soil, Phosphorus and Nitrogen in a Cold Climate" Land 10, no. 1: 77. https://doi.org/10.3390/land10010077
APA StyleBechmann, M. E., & Bøe, F. (2021). Soil Tillage and Crop Growth Effects on Surface and Subsurface Runoff, Loss of Soil, Phosphorus and Nitrogen in a Cold Climate. Land, 10(1), 77. https://doi.org/10.3390/land10010077