Influence of the Changes in Land-Use and Land Cover on Temperature over Northern and North-Eastern India


Abstract
:1. Introduction
2. Materials and Methods
3. Results
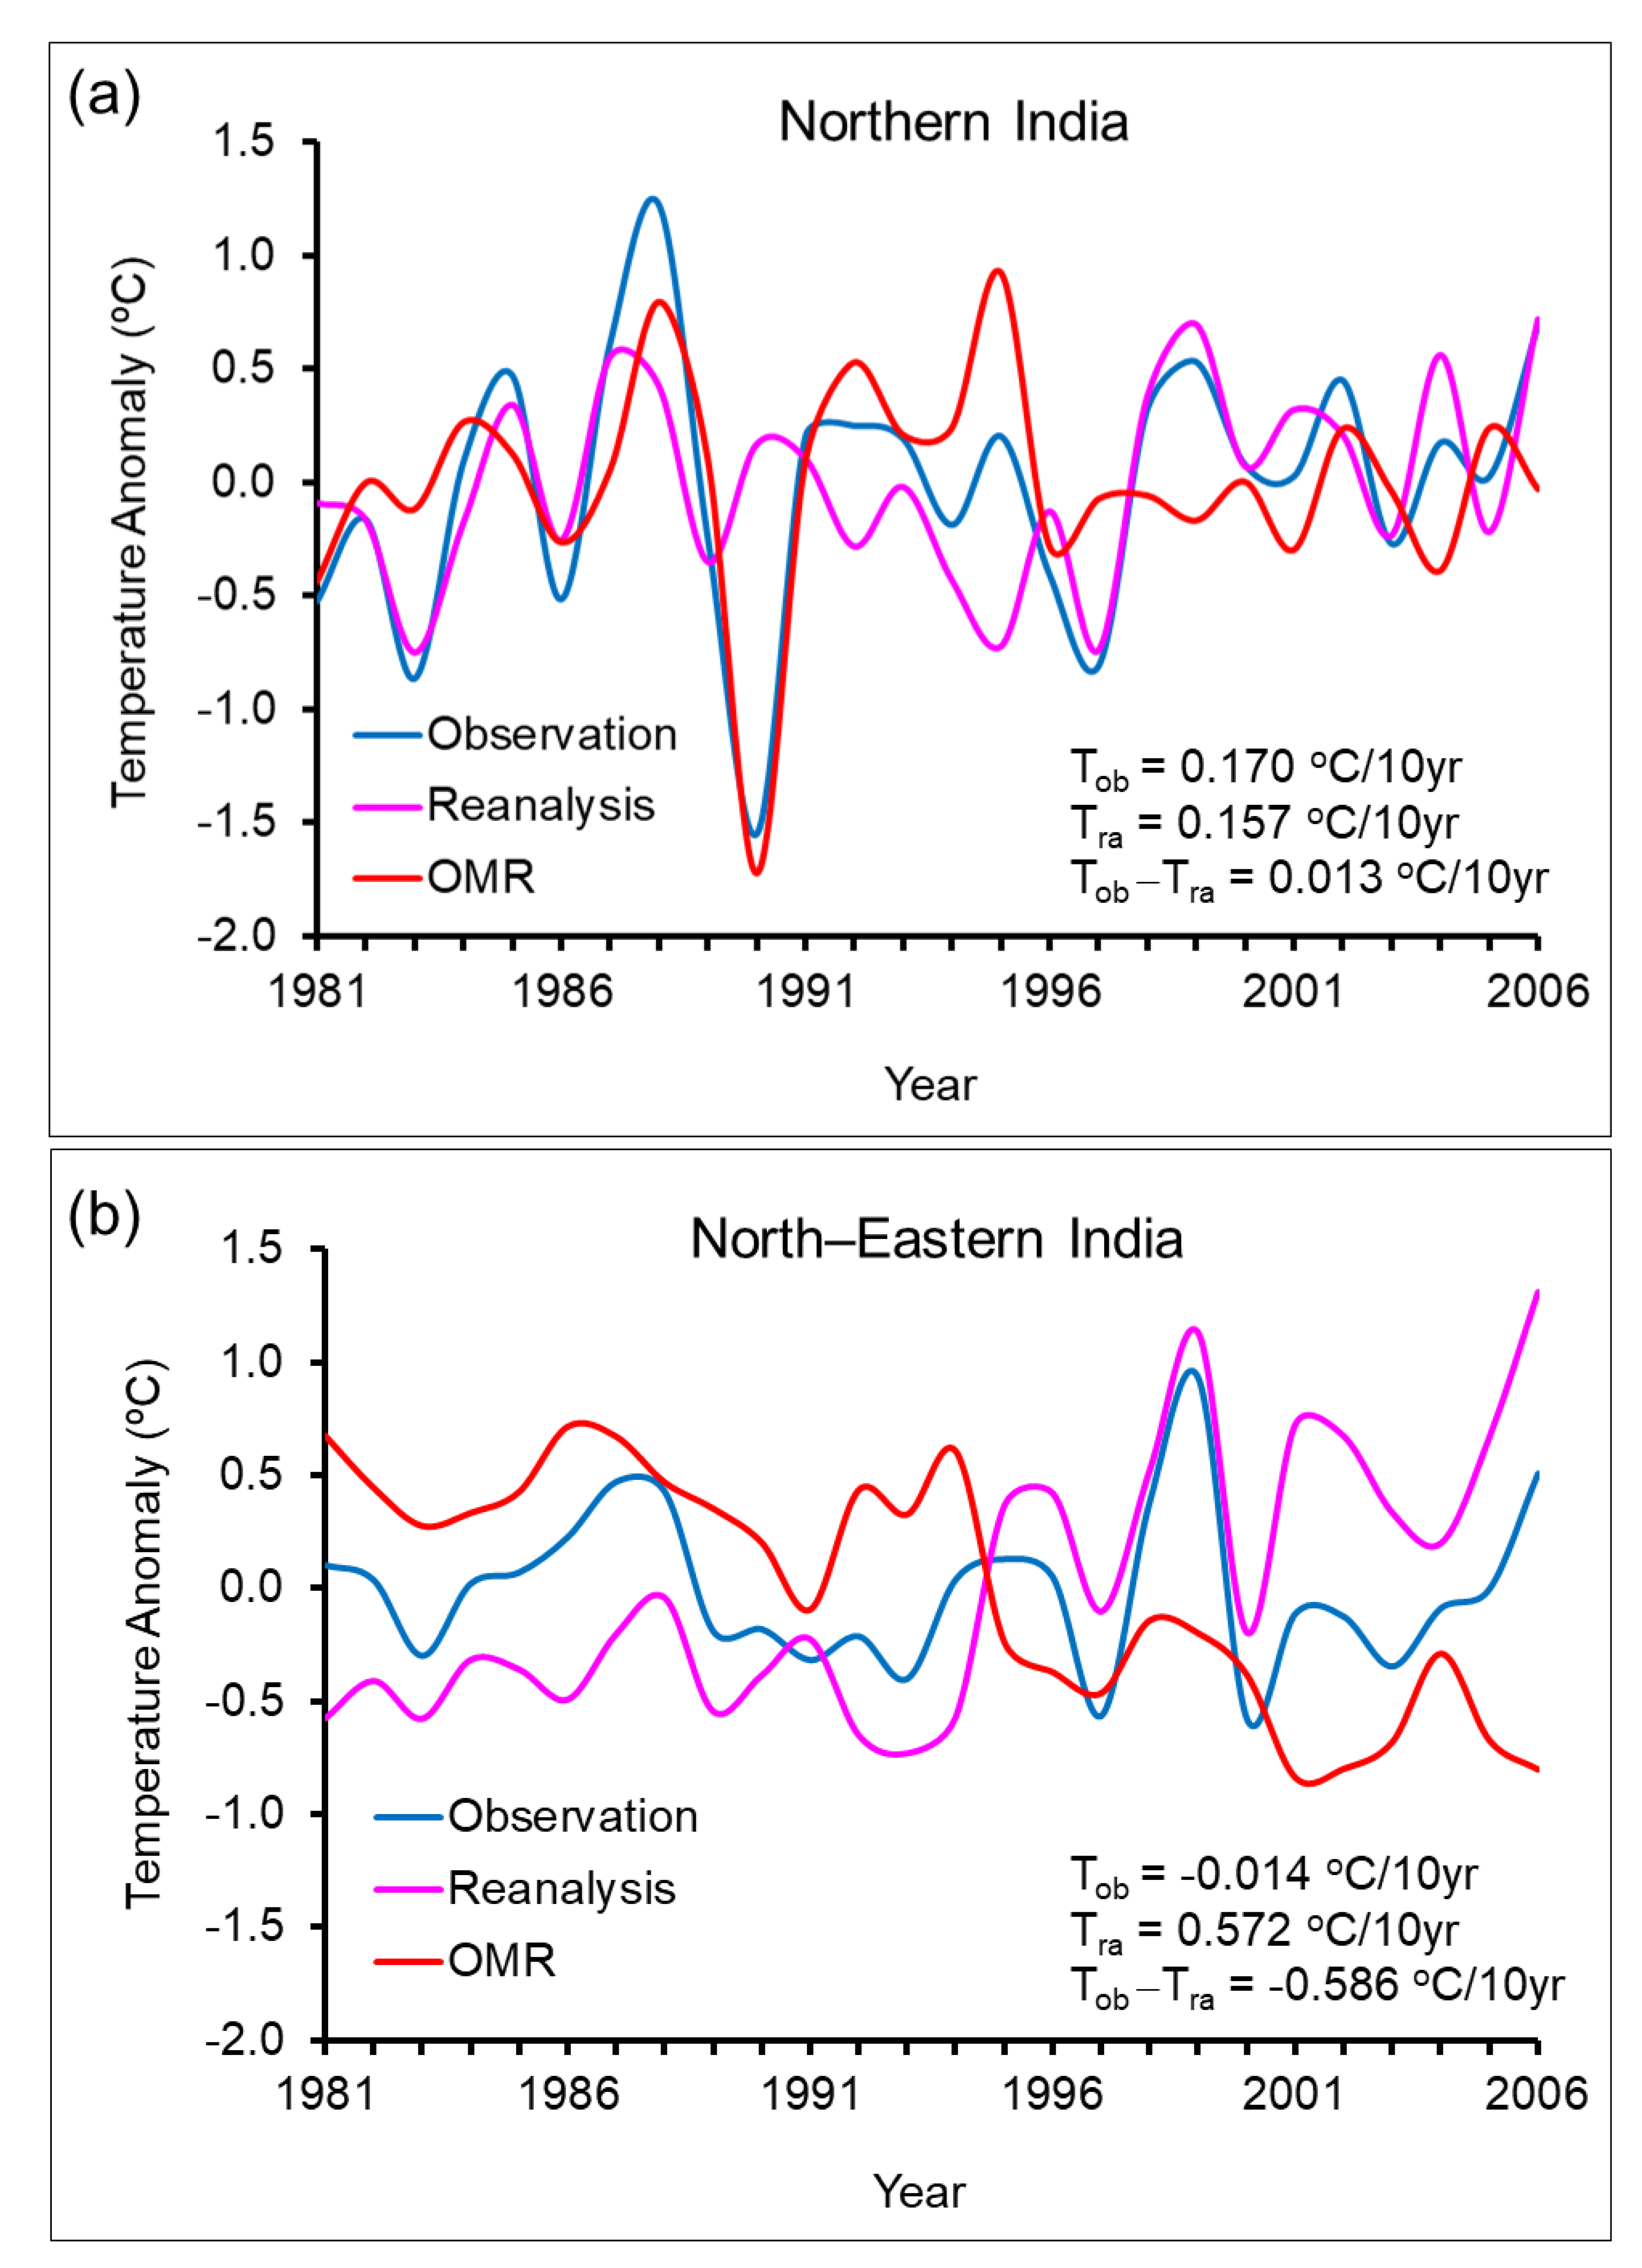
3.1. Temperature Trends and Contribution from LULC Change
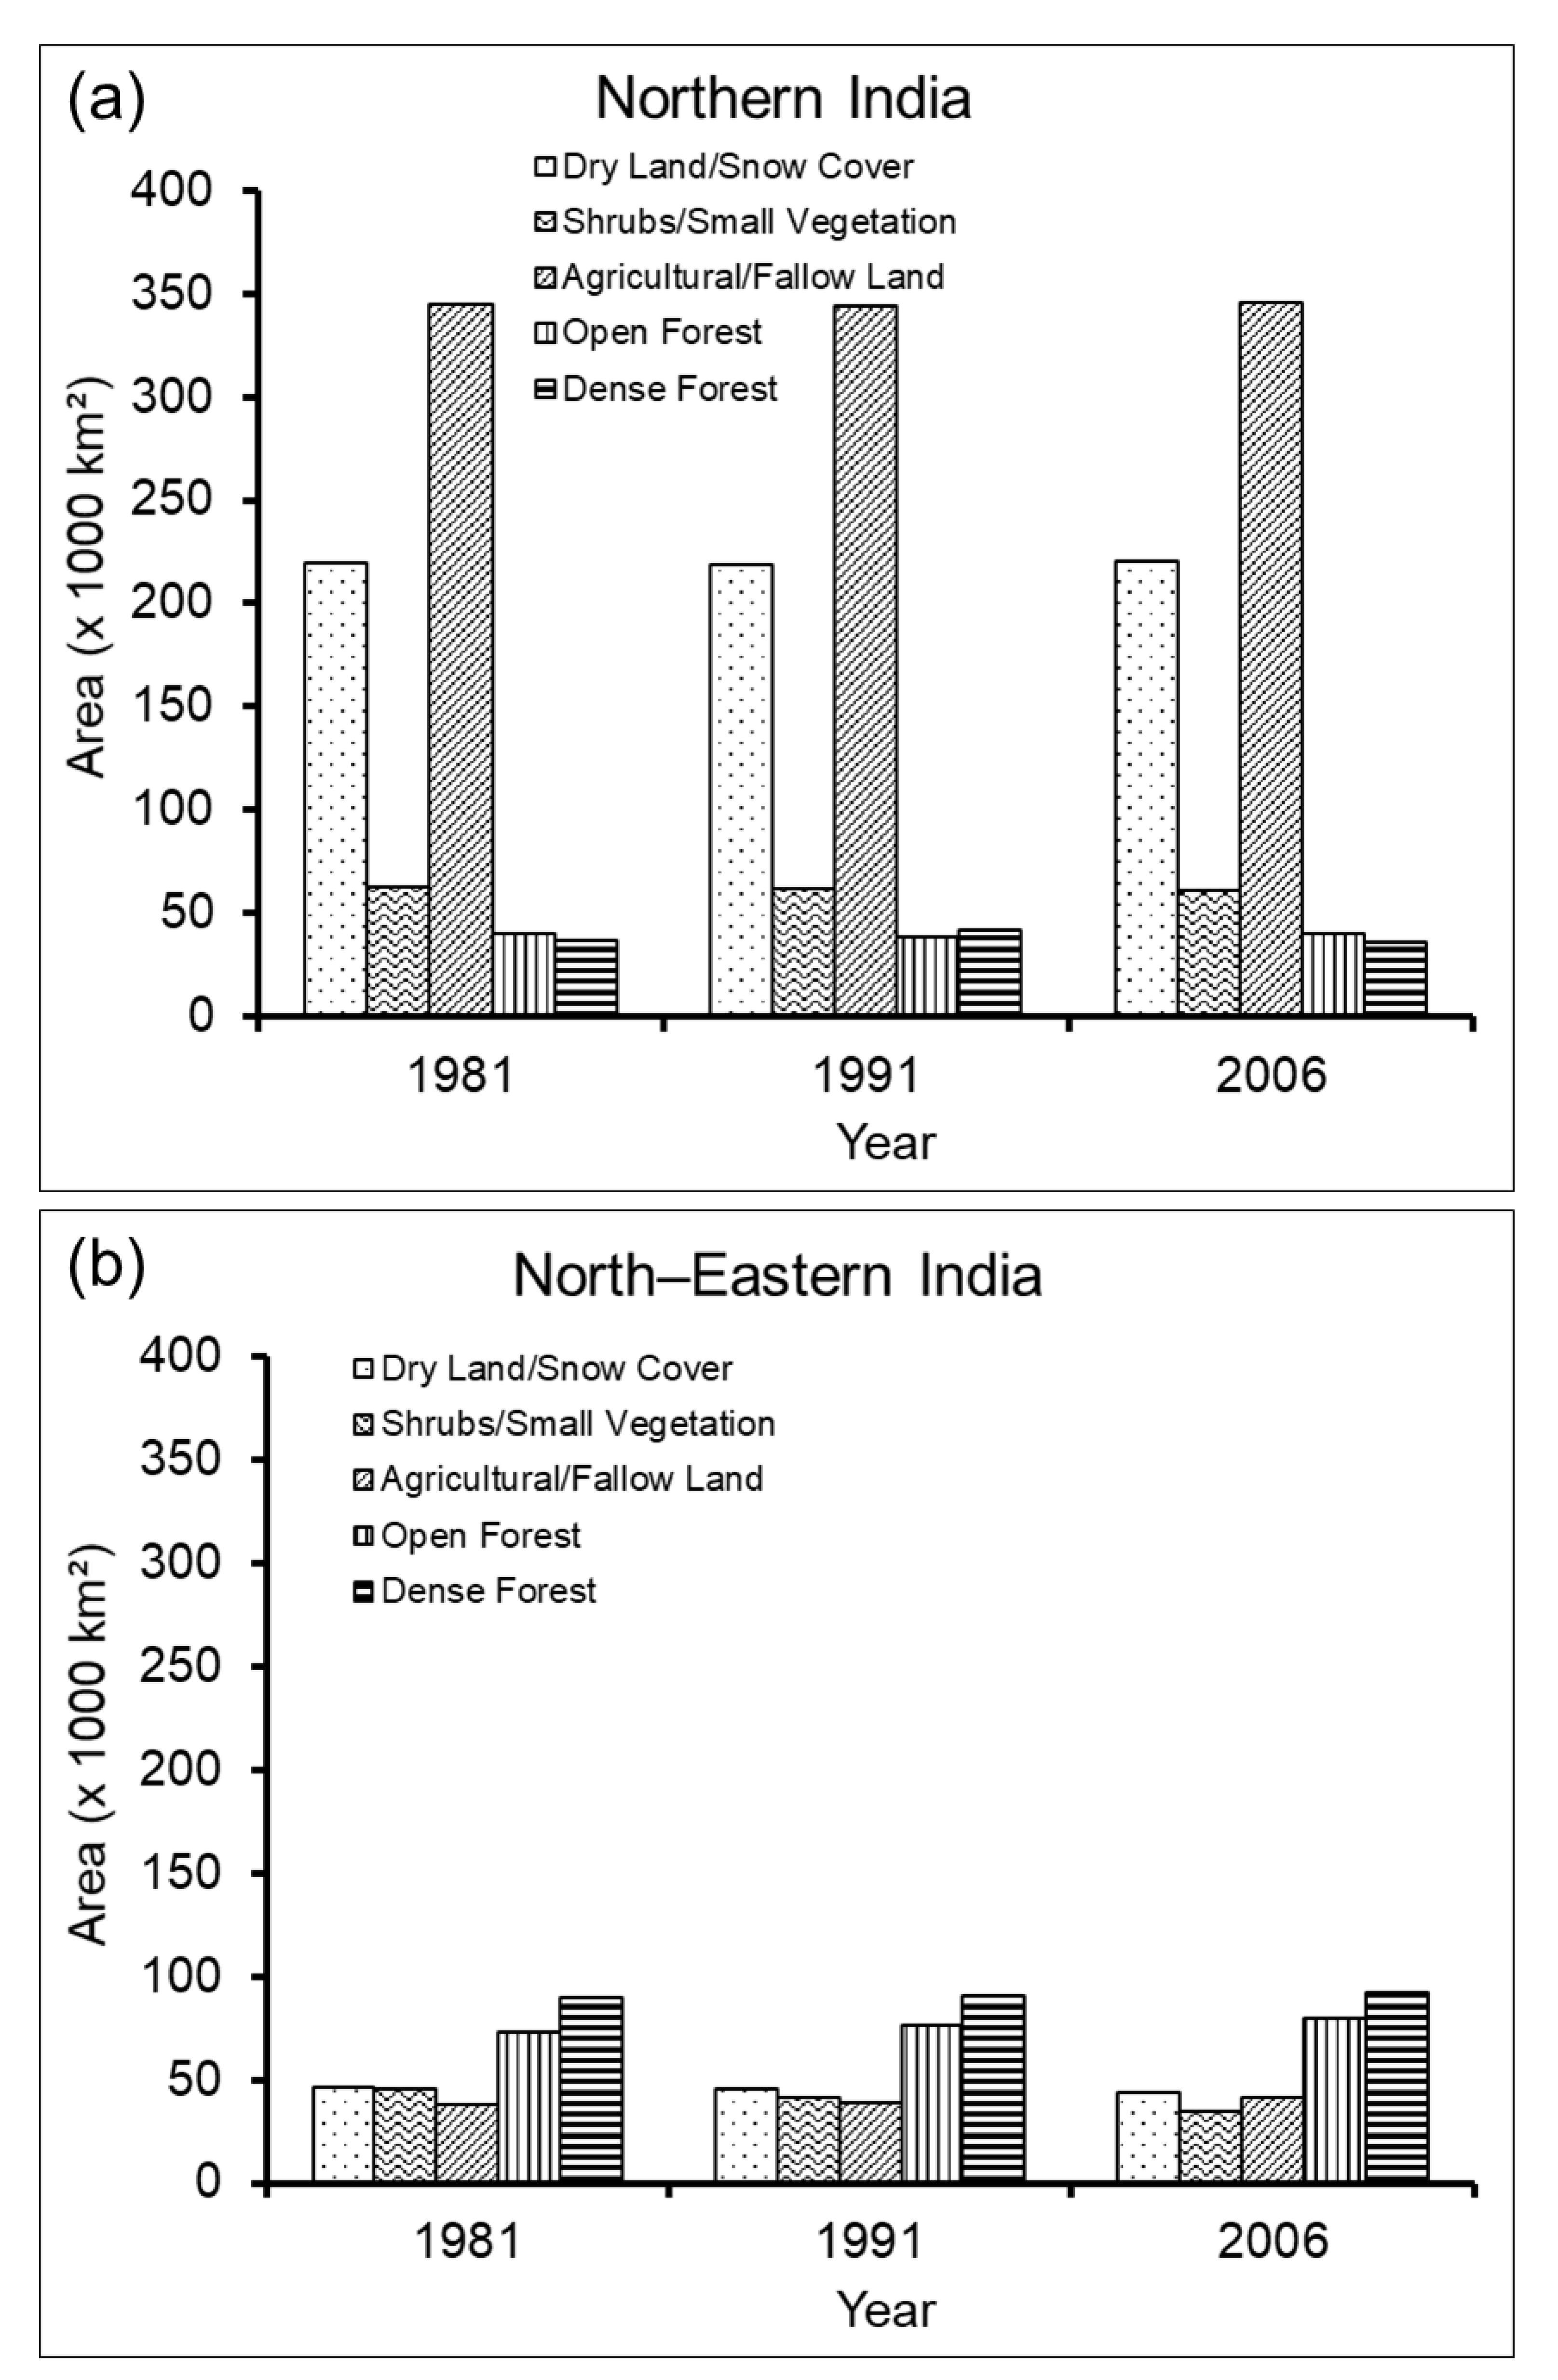
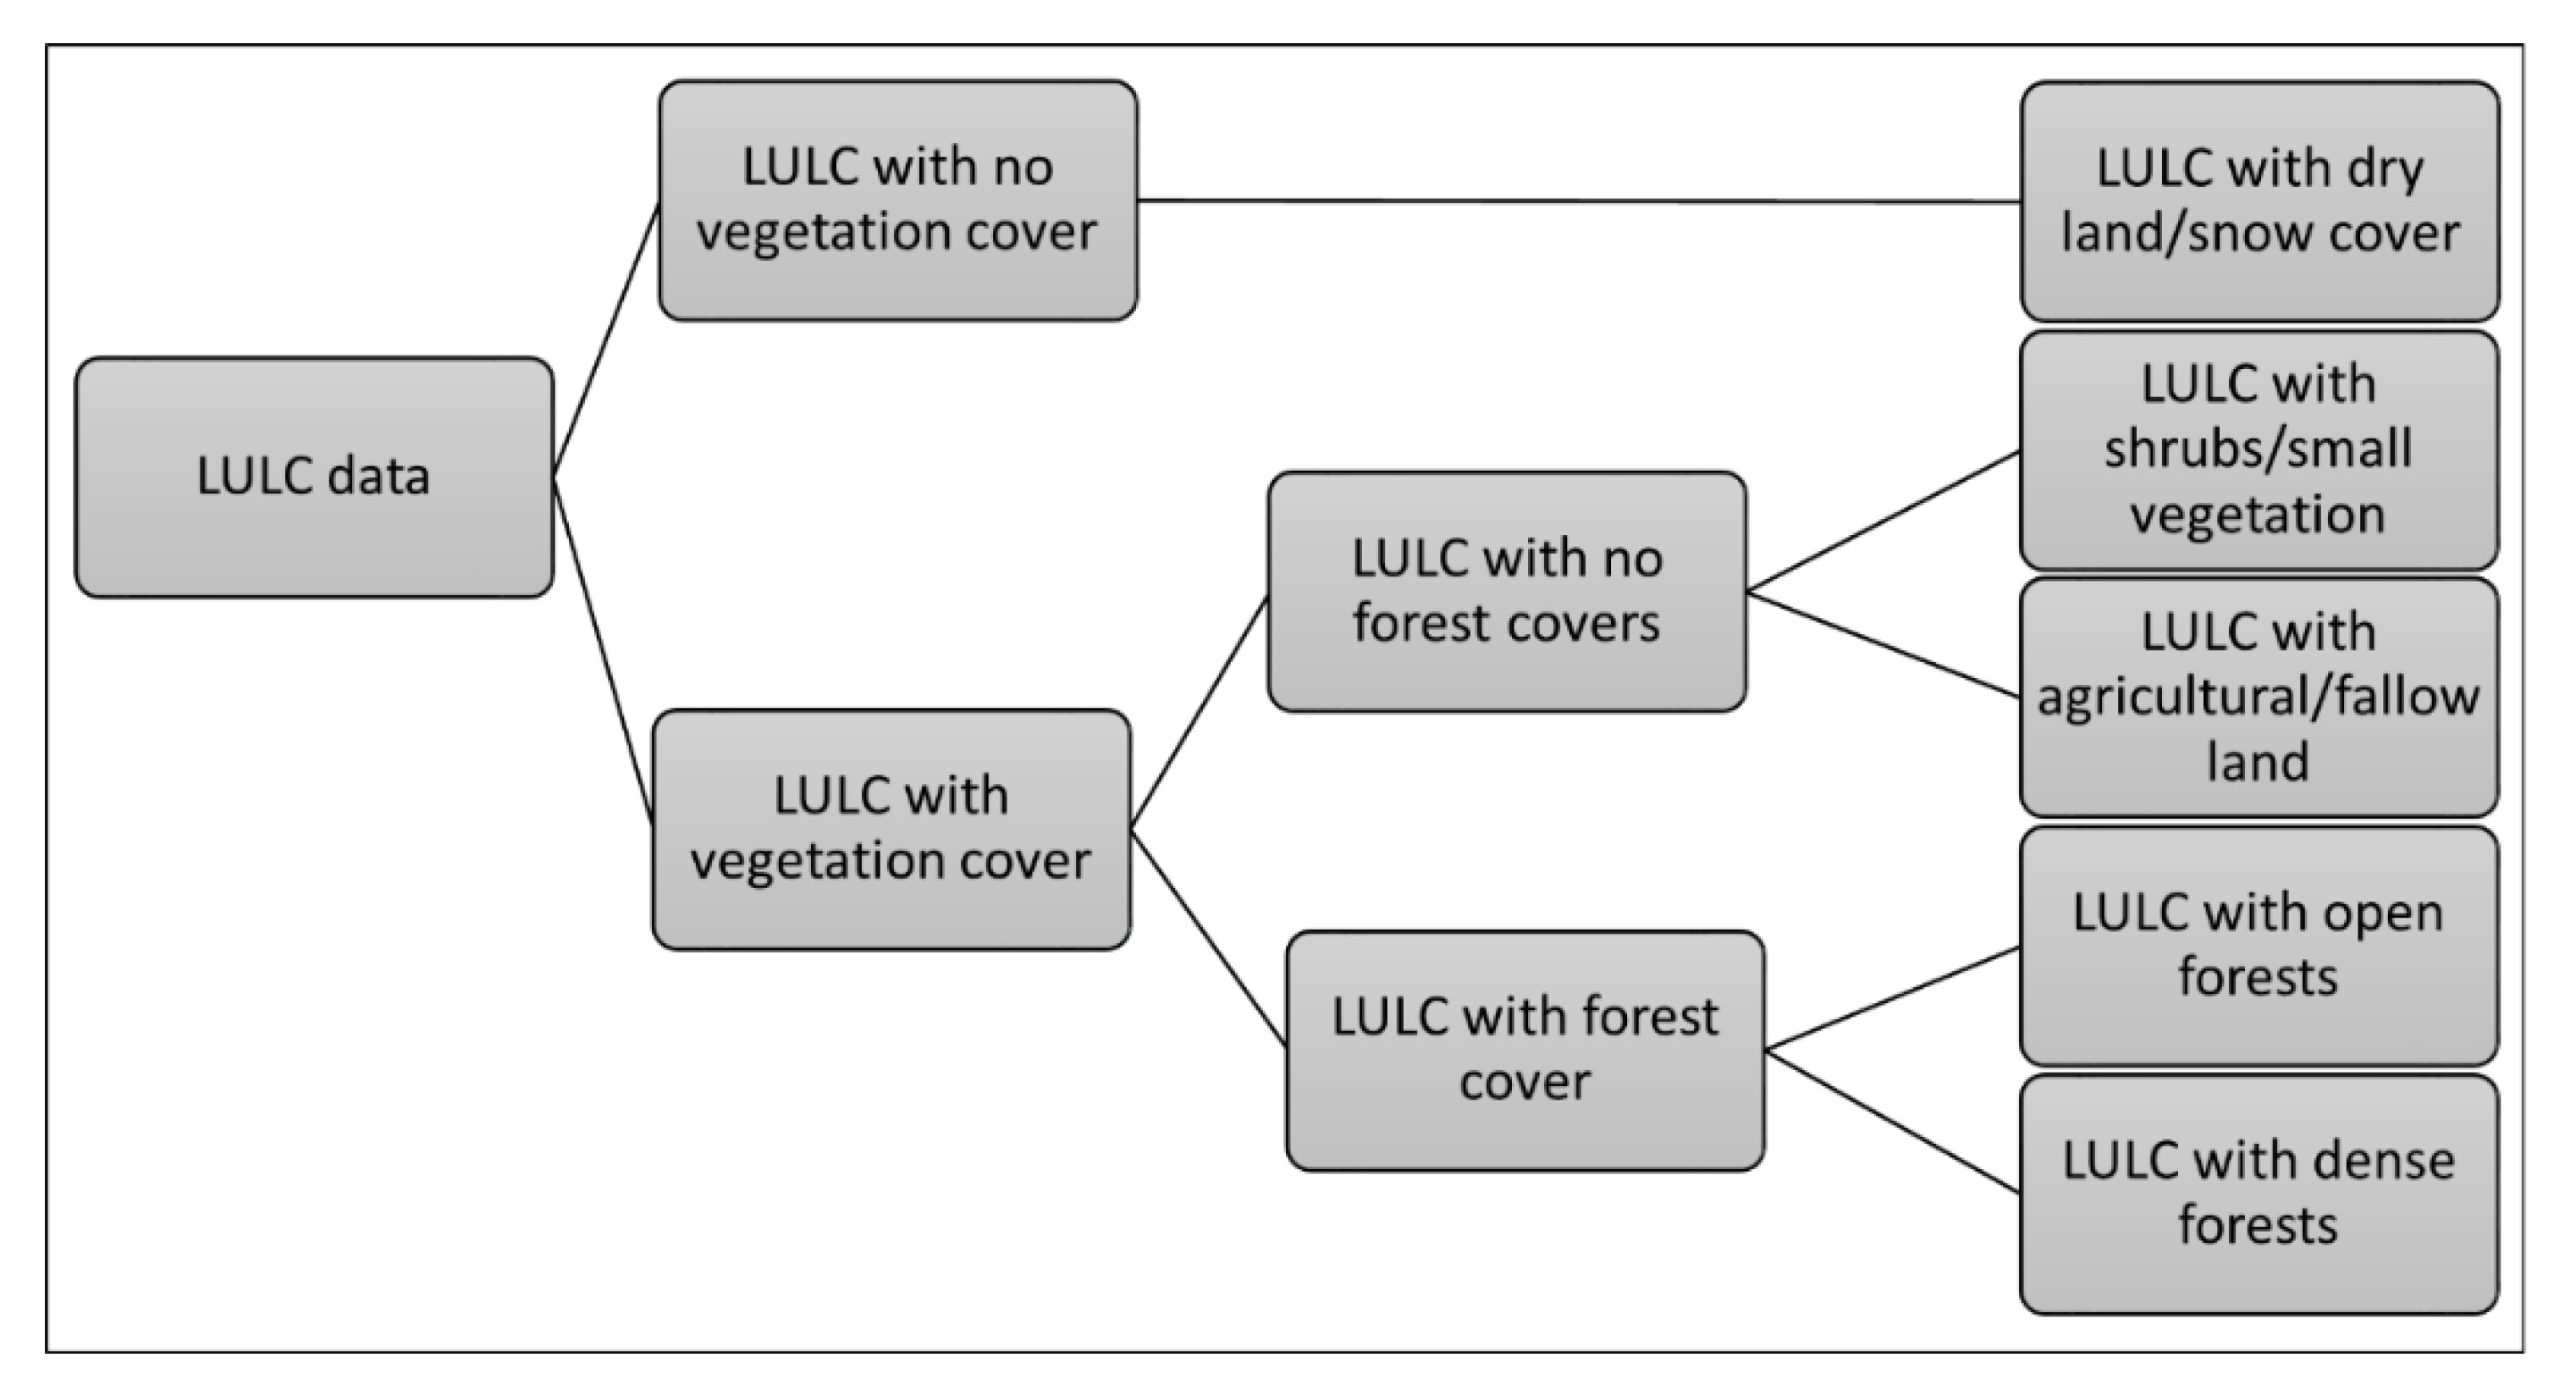
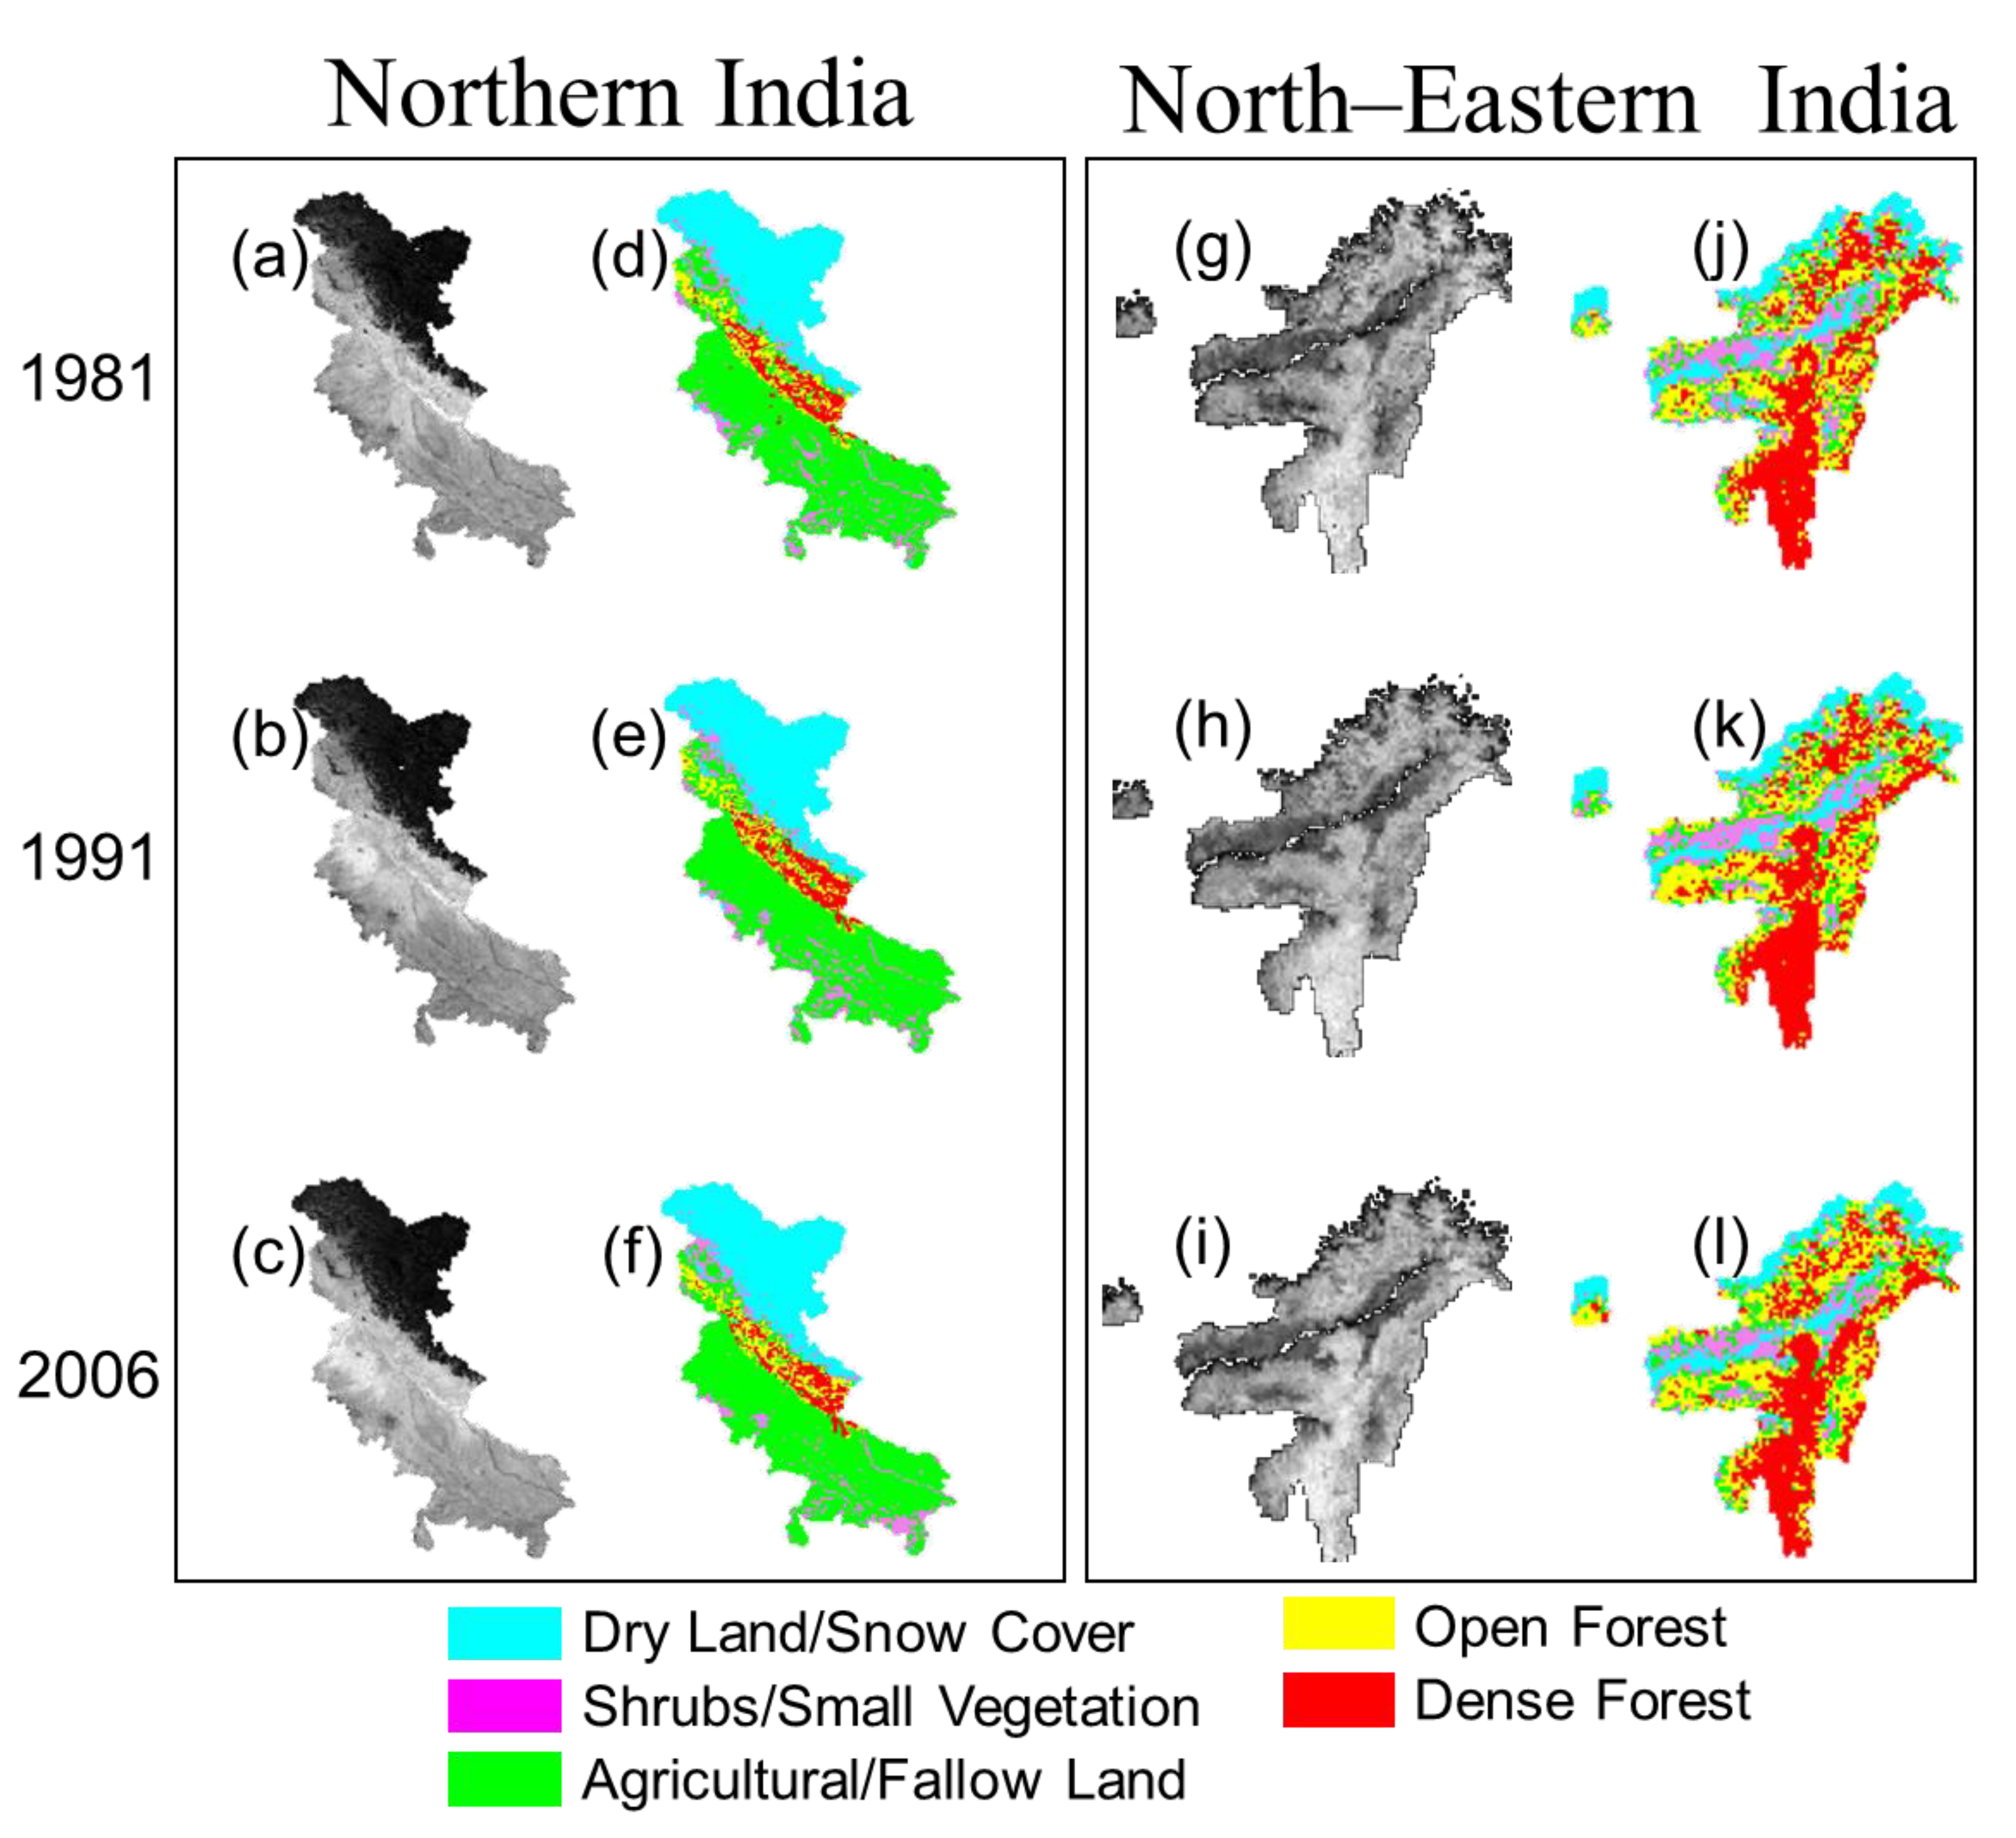
3.2. LULC Map
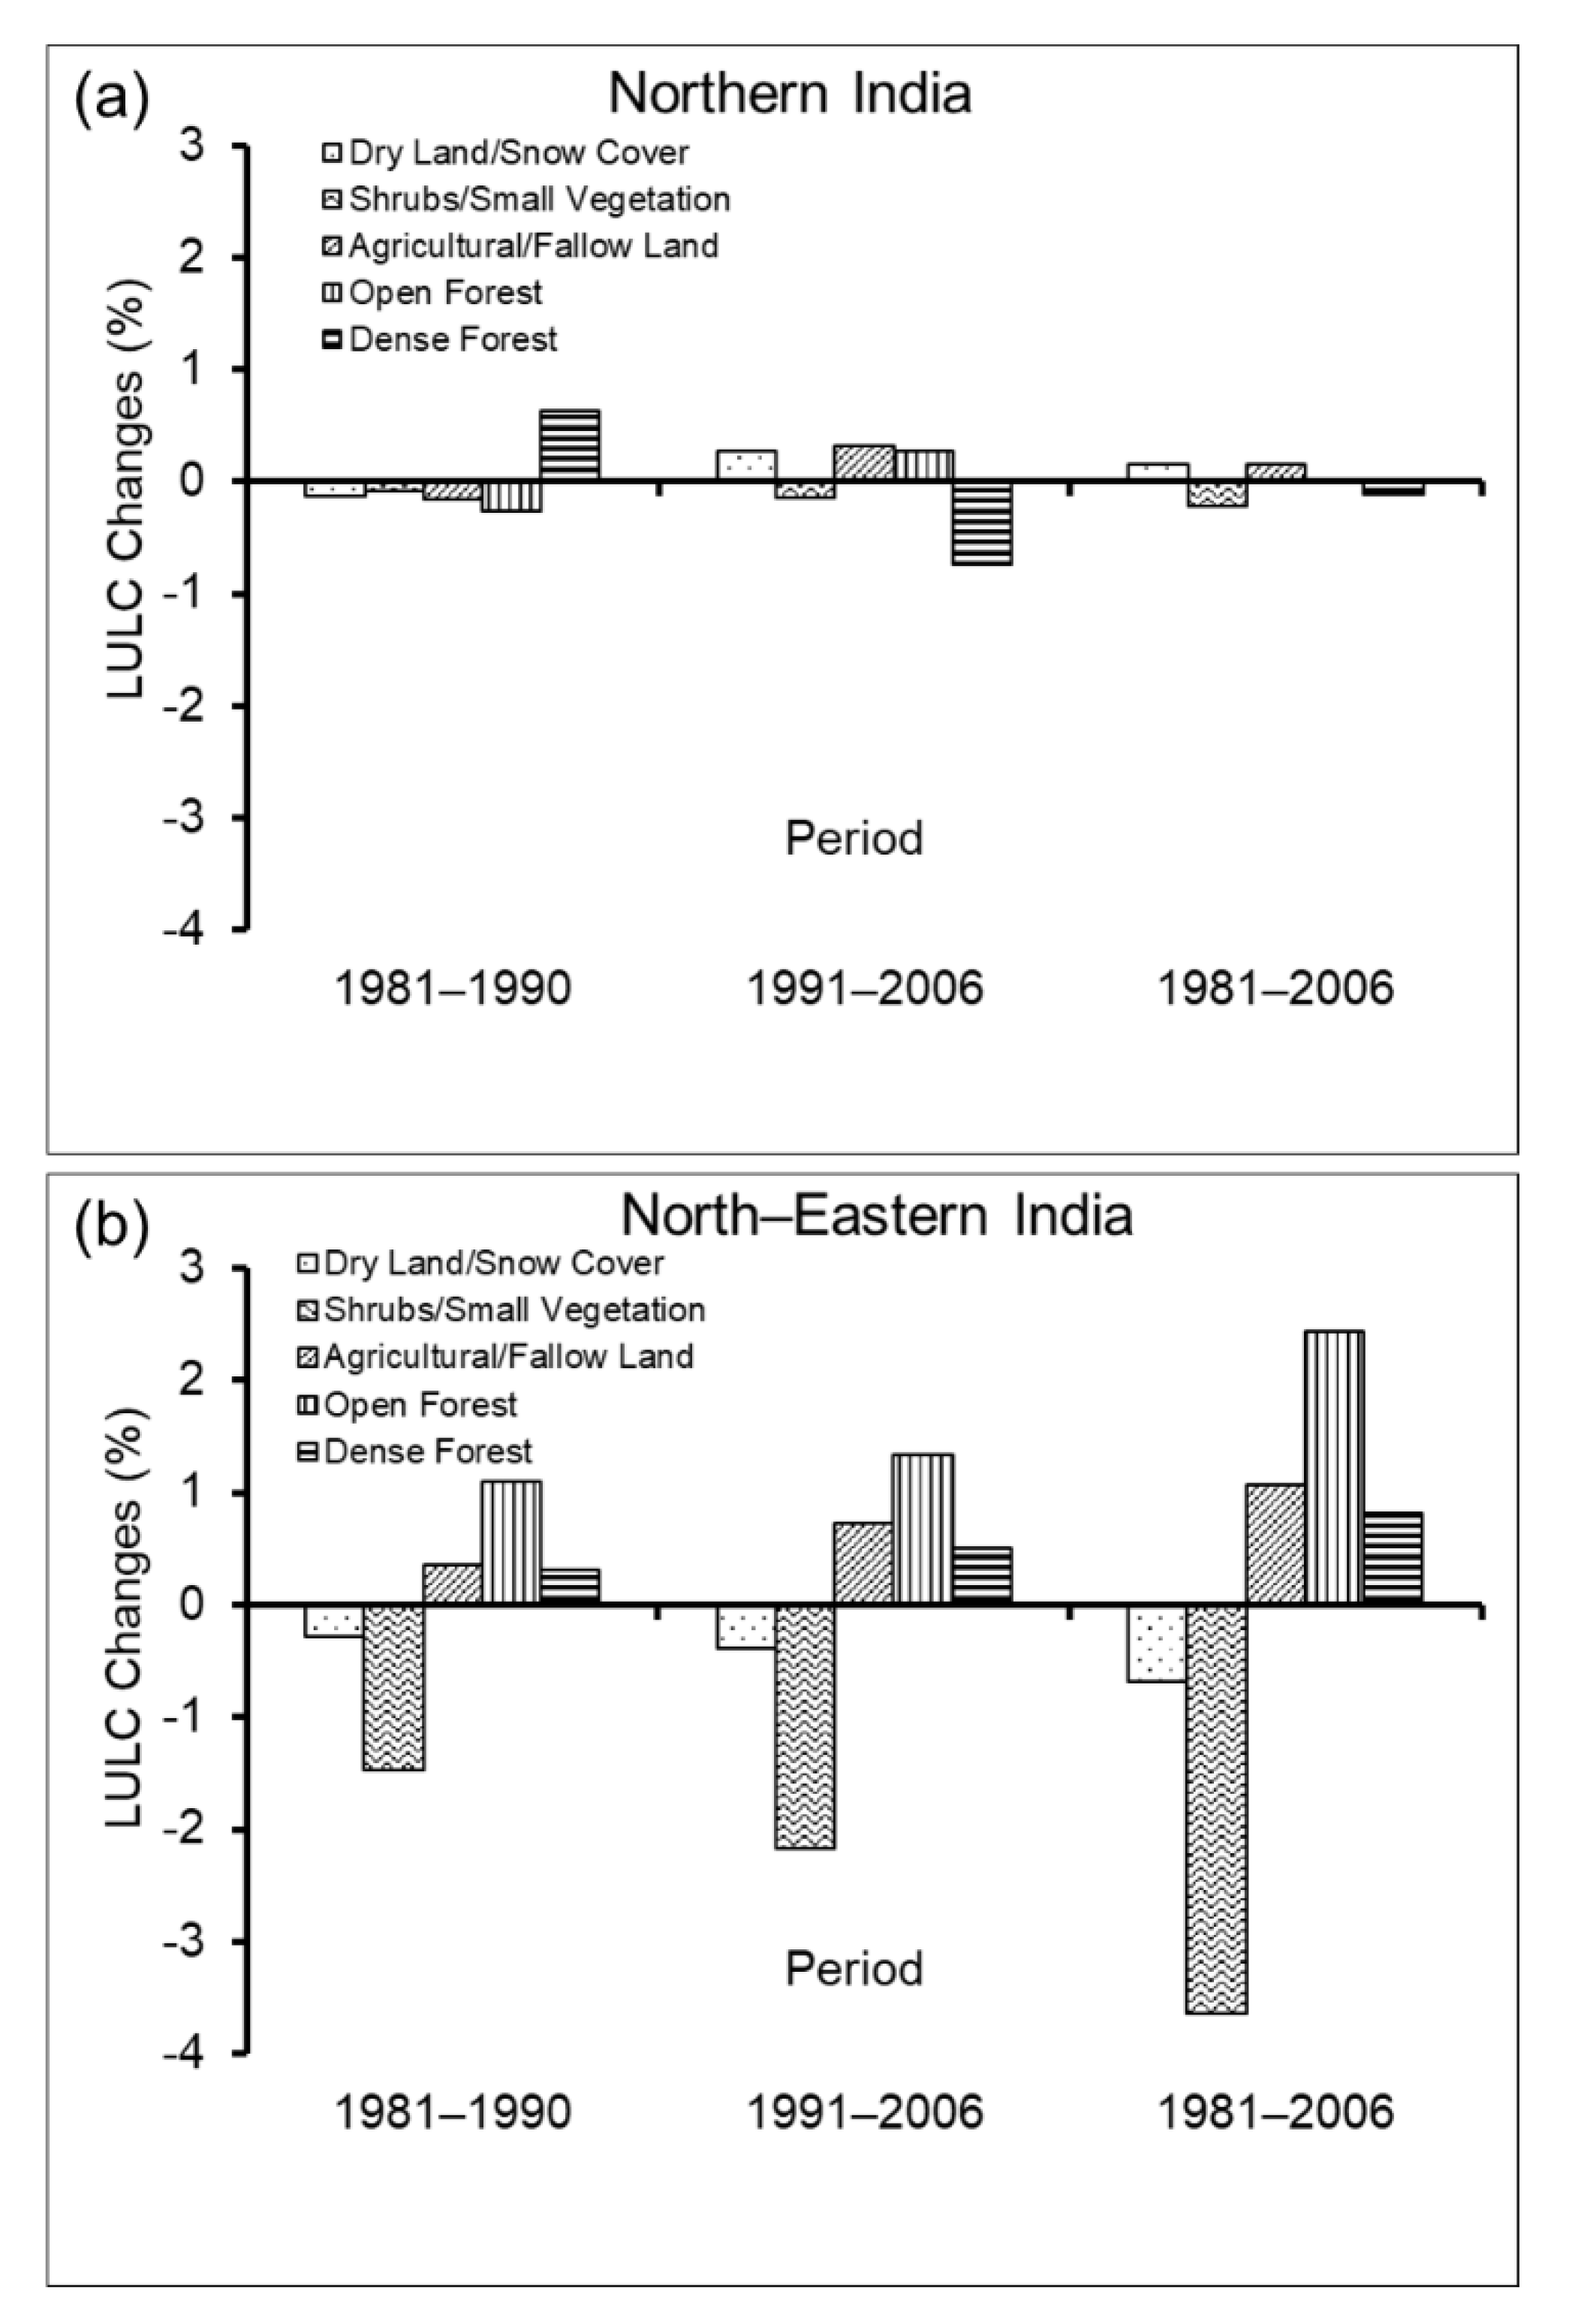
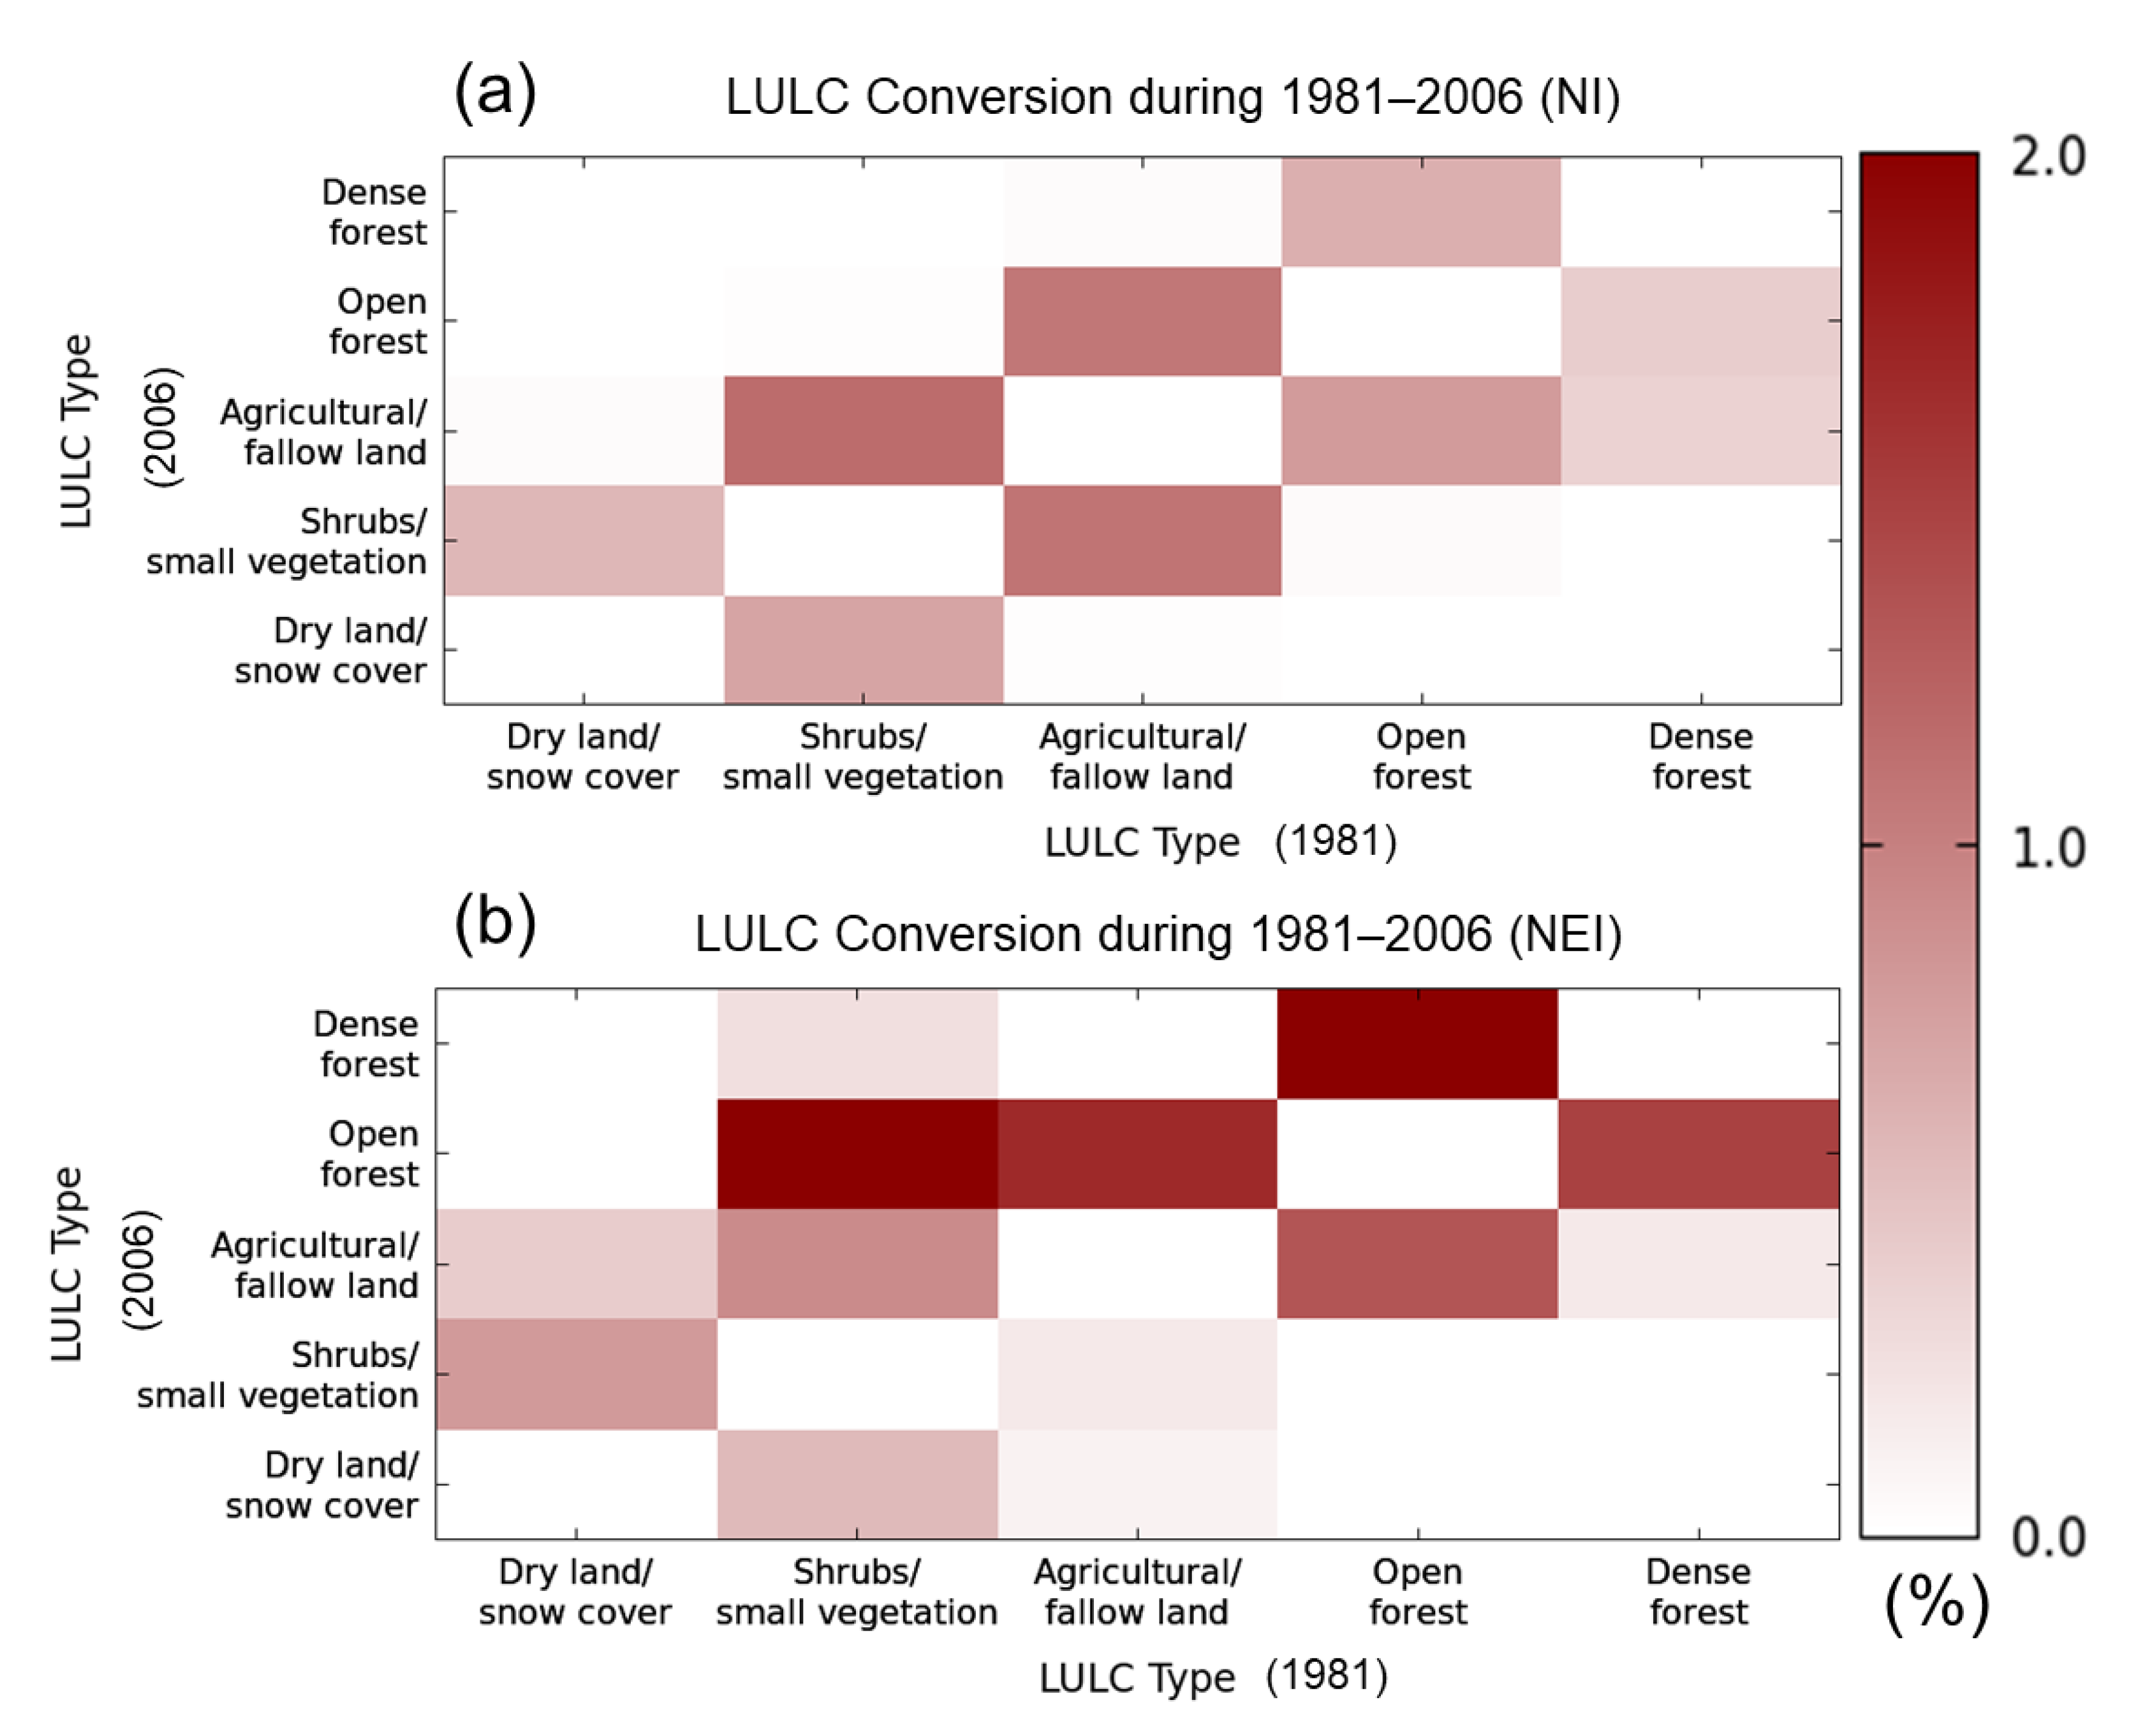
3.3. LULC Change
3.4. LULC Change versus Temperature Trends
4. Discussion
5. Conclusions
Author Contributions
Funding
Institutional Review Board Statement
Informed Consent Statement
Data Availability Statement
Acknowledgments
Conflicts of Interest
References
- Intergovernmental Panel on Climate Change (IPCC). Climate Change 2013: The Physical Science Basis. Contribution of Working Group I to the Fifth Assessment Report of the Intergovernmental Panel on Climate Change; Stocker, T.F., Qin, D., Plattner, G.-K., Tignor, M., Allen, S.K., Boschung, J., Nauels, A., Xia, Y., Bex, V., Midgley, P.M., Eds.; Cambridge University Press: Cambridge, UK; New York, NY, USA, 2013; p. 1535. [Google Scholar]
- Gogoi, P.P.; Vinoj, V.; Swain, D.; Roberts, G.; Dash, J.; Tripathy, S. Land use and land cover change effect on surface temperature over Eastern India. Sci. Rep. 2019, 9, 1–10. [Google Scholar] [CrossRef] [PubMed] [Green Version]
- Viterbo, P. The Role of the Land Surface in the Climate System; Meteorological Training Course Lecture Series; ECMWF: Reading, UK, 2002. [Google Scholar]
- Teuling, A.J.; Seneviratne, S.I.; Stöckli, R.; Reichstein, M.; Moors, E.; Ciais, P.; Luyssaert, S.; van den Hur Ammann, B.; Bernhofer, C. Contrasting response of European forest and grassland energy exchange to heatwaves. Nat. Geosci. 2010, 3, 722–727. [Google Scholar] [CrossRef]
- Jain, S.; Panda, L.; Kant, S. Possible Socio-scientific Issues of Land-use and Land-cover Change Impact and Associated Tools of Study with a Special Reference to Delhi-Mumbai Industrial Corridor Region. Int. J. Earth Atmos. Sci. 2014, 1, 58–70. [Google Scholar]
- Li, Y.; Zhao, M.; Motesharrei, S.; Mu, Q.; Kalnay, E.; Li, S. Local cooling and warming effects of forest based on satellite data. Nat. Commun. 2015, 6, 6603. [Google Scholar] [CrossRef] [Green Version]
- Kayet, N.; Pathak, K.; Chakrabarty, A.; Sahoo, S. Spatial impact of land use/land cover change on surface temperature distribution in Saranda Forest, Jharkhand. Model. Earth Syst. Environ. 2016, 2, 127. [Google Scholar] [CrossRef] [Green Version]
- Nayak, S.; Behera, M.D. Land use/land cover classification and mapping of Pilibhit District Uttar Pradesh India. Indian Geogr. J. 2008, 83, 1–10. [Google Scholar]
- Rawat, J.S.; Biswas, V.; Kumar, M. Changes in land use/cover using geospatial techniques: A case study of Ramnagar town area, district Nainital, Uttarakhand, India. Egypt. J. Remote Sens. Space Sci. 2013, 16, 111–117. [Google Scholar] [CrossRef] [Green Version]
- Nayak, S.; Mandal, M.; Maity, S. RegCM4 simulation with AVHRR land use data towards temperature and precipitation climatology over Indian region. Atmos. Res. 2018, 214, 163–173. [Google Scholar] [CrossRef]
- Nayak, S.; Mandal, M. Impact of land use and land cover changes on temperature trends over India. Land Use Policy 2019, 89, 104238. [Google Scholar] [CrossRef]
- Roy, S.S.; Mahmood, R.; Niyogi, D.; Lei, M.; Foster, S.A.; Hubbard, K.G.; Pielke, R., Sr. Impacts of the agricultural Green Revolution–induced land use changes on air temperatures in India. J. Geophys. Res. Atmos. 2007, 112. [Google Scholar] [CrossRef] [Green Version]
- Niyogi, D.; Pyle, P.; Lei, M.; Arya, S.P.; Kishtawal, C.M.; Shepherd, M.; Chen, F.; Wolfe, B. Urban modification of thunderstorms: an observational storm climatology and model case study for the Indianapolis urban region. J. Appl. Meteorol. Climatol. 2011, 50, 1129–1144. [Google Scholar] [CrossRef]
- Mohan, M.; Kandya, A. Impact of urbanization and land-use/land-cover change on diurnal temperature range: A case study of tropical urban airshed of India using remote sensing data. Sci. Total Environ. 2015, 506, 453–465. [Google Scholar] [CrossRef] [PubMed]
- Mukherjee, F.; Singh, D. Assessing Land Use–Land Cover Change and Its Impact on Land Surface Temperature Using LANDSAT Data: A Comparison of Two Urban Areas in India. Earth Syst. Environ. 2020, 4, 385–407. [Google Scholar] [CrossRef]
- Nayak, S.; Mandal, M. Impact of land use and land cover change on temperature trends over Western India. Curr. Sci. 2012, 102, 1166–1173. [Google Scholar]
- Sahana, M.; Ahmed, R.; Sajjad, H. Analyzing land surface temperature distribution in response to land use/land cover change using split window algorithm and spectral radiance model in Sundarban Biosphere Reserve, India. Model. Earth Syst. Environ. 2016, 2, 81. [Google Scholar] [CrossRef] [Green Version]
- Nayak, S.; Mandal, M. Examining the impact of regional land use and land cover changes on temperature: the case of Eastern India. Spat. Inf. Res. 2019, 27, 601–611. [Google Scholar] [CrossRef]
- Oliver, J.E.; Wilson, L. Climate classification. In The Encyclopedia of Climatology; Oliver, J.E., Fairbridge, R.W., Eds.; Van Nostrand Reinhold Company: New York, NY, USA, 1987; pp. 221–236. [Google Scholar]
- Kalnay, E.; Cai, M. Impact of urbanization and land-use change on climate. Nature 2003, 423, 528–531. [Google Scholar] [CrossRef]
- Lim, Y.K.; Cai, M.; Kalnay, E.; Zhou, L. Impact of Vegetation Types on Surface Temperature Change. J. Appl. Meteorol. Climatol. 2008, 47, 411–424. [Google Scholar] [CrossRef] [Green Version]
- Fall, S.; Niyogi, D.; Gluhovsky, A.; Pielke, R.A.; Kalnay, E.; Rochon, G. Impacts of land use land cover on temperature trends over the continental United States: assessment using the North American Regional Reanalysis. Int. J. Clim. 2010, 30, 1980–1993. [Google Scholar] [CrossRef] [Green Version]
- Shen, X.; Liu, B.; Lu, X. Effects of land use/land cover on diurnal temperature range in the temperate grassland region of China. Sci. Total Environ. 2017, 575, 1211–1218. [Google Scholar] [CrossRef]
- Jin, K.; Wang, F.; Zong, Q.; Qin, P.; Liu, C. Impact of variations in vegetation on surface air temperature change over the Chinese Loess Plateau. Sci. Total Environ. 2020, 716, 136967. [Google Scholar] [CrossRef]
- DeFries, R.S.; Townshend, J.R.G. NDVI-derived land cover classifications at a global scale. Int. J. Remote Sens. 1994, 15, 3567–3586. [Google Scholar] [CrossRef]
- Hansen, M.C.; DeFries, R.S.; Townshend, J.R.; Sohlberg, R. Global land cover classification at 1 km spatial resolution using a classification tree approach. Int. J. Remote Sens. 2000, 21, 1331–1364. [Google Scholar] [CrossRef]
- Dash, S.K.; Sharma, N.; Pattnayak, K.C.; Gao, X.J.; Shi, Y. Temperature and precipitation changes in the north-east India and their future projections. Glob. Planet. Chang. 2012, 98, 31–44. [Google Scholar] [CrossRef]
- Verma, R. The Major Drainage Systems in the Northeastern Region of India. In The Indian Rivers; Springer: Singapore, 2018; pp. 429–464. [Google Scholar]
- Chakraborty, K.; Sudhakar, S.; Sarma, K.K.; Raju, P.L.N.; Das, A.K. Recognizing the rapid expansion of rubber plantation-A threat to native forest in parts of northeast India. Curr. Sci. 2018, 114, 207. [Google Scholar] [CrossRef]
- Menne, M.J., Jr.; Williams, C.N. Homogenization of temperature series via pairwise comparisons. J. Clim. 2009, 22, 1700–1717. [Google Scholar] [CrossRef] [Green Version]
- Menne, M.J., Jr.; Williams, C.N.; Palecki, M.A. On the reliability of the U.S. surface temperature record. J. Geophys. Res. 2010, 115, D11108. [Google Scholar] [CrossRef] [Green Version]
- Fall, S.; Watts, A.; Nielsen-Gammon, J.; Jones, E.; Niyogi, D.; Christy, J.R.; McNider, R.; Sr Pielke, R.A. Analysis of the impacts of station exposure on the U.S. Historical Climatology Network temperatures and temperature trends. J. Geophys. Res. 2011, 116, D14120. [Google Scholar] [CrossRef] [Green Version]
- Nocco, M.A.; Smail, R.A.; Kucharik, C.J. Observation of irrigation-induced climate change in the Midwest United States. Glob. Chang. Biol. 2019, 25, 3472–3484. [Google Scholar] [CrossRef]


| Sl. No | Station Name | Longitude (E) | Latitude (N) |
|---|---|---|---|
| 1 | Agartala | 91.250 | 23.883 |
| 2 | Agra | 77.967 | 27.150 |
| 3 | Allahabad/Bamhrauli | 81.733 | 25.450 |
| 4 | Amritsar | 74.867 | 31.633 |
| 5 | Bareilly | 79.400 | 28.367 |
| 6 | Dehradun | 78.033 | 30.317 |
| 7 | Dibrugarh/Mohanbar | 95.017 | 27.483 |
| 8 | Gauhati | 91.583 | 26.100 |
| 9 | Gorakhpur | 83.367 | 26.750 |
| 10 | Hissar | 75.733 | 29.167 |
| 11 | Imphal | 93.900 | 24.667 |
| 12 | Lucknow/Amausi | 80.883 | 26.750 |
| 13 | New Delhi/Safdarjun | 77.200 | 28.583 |
| 14 | Patiala | 76.467 | 30.333 |
| 15 | Srinagar | 74.833 | 34.083 |
| 16 | Tezpur | 92.783 | 26.617 |
| (a) Northern India | ||||||
| LULC Type | 1981 | 1991 | 2006 | |||
| Producers Accuracy (%) | Users Accuracy (%) | Producers Accuracy (%) | Users Accuracy (%) | Producers Accuracy (%) | Users Accuracy (%) | |
| DL/SC | 100.00 | 80.00 | 90.00 | 90.00 | 90.00 | 90.00 |
| S/SV | 75.00 | 75.00 | 60.00 | 75.00 | 66.67 | 100.00 |
| A/FL | 90.91 | 96.77 | 96.43 | 96.43 | 100.00 | 96.88 |
| OF | 100.00 | 66.67 | 75.00 | 75.00 | 66.67 | 66.67 |
| DF | 66.67 | 100.00 | 100.00 | 75.00 | 66.67 | 66.67 |
| Overall classification accuracy 90.00% | 90.00% | 92.00% | ||||
| (b) North-Eastern India | ||||||
| LULC Type | 1981 | 1991 | 2006 | |||
| Producers Accuracy (%) | Users Accuracy (%) | Producers Accuracy (%) | Users Accuracy (%) | Producers Accuracy (%) | Users Accuracy (%) | |
| DL/SC | 80.00 | 80.00 | 75.00 | 75.00 | 100.00 | 83.33 |
| S/SV | 80.00 | 100.00 | 88.89 | 88.89 | 100.00 | 75.00 |
| A/FL | 100.00 | 60.00 | 75.00 | 75.00 | 62.50 | 100.00 |
| OF | 94.12 | 94.12 | 84.62 | 91.67 | 94.44 | 94.44 |
| DF | 93.33 | 93.33 | 95.00 | 90.48 | 93.75 | 88.24 |
| Overall classification accuracy 90.00% | 88.00% | 90.00% | ||||
| (a) Northern India | |||
| LULC Type | 1981 (%) | 1991 (%) | 2006 (%) |
| Dry land/snow cover | 31.18 | 31.06 | 31.34 |
| Shrubs/small vegetation | 8.85 | 8.76 | 8.63 |
| Agricultural/fallow land | 49.00 | 48.83 | 49.15 |
| Open forest | 5.73 | 5.46 | 5.75 |
| Dense forest | 5.25 | 5.88 | 5.14 |
| (b) North-Eastern India | |||
| LULC Type | 1981 (%) | 1991 (%) | 2006 (%) |
| Dry land/snow cover | 15.80 | 15.52 | 15.12 |
| Shrubs/small vegetation | 15.56 | 14.09 | 11.92 |
| Agricultural/fallow land | 12.95 | 13.31 | 14.03 |
| Open forest | 24.97 | 26.06 | 27.40 |
| Dense forest | 30.71 | 31.02 | 31.52 |
Publisher’s Note: MDPI stays neutral with regard to jurisdictional claims in published maps and institutional affiliations. |
© 2021 by the authors. Licensee MDPI, Basel, Switzerland. This article is an open access article distributed under the terms and conditions of the Creative Commons Attribution (CC BY) license (http://creativecommons.org/licenses/by/4.0/).
Share and Cite
Nayak, S.; Maity, S.; Singh, K.S.; Nayak, H.P.; Dutta, S. Influence of the Changes in Land-Use and Land Cover on Temperature over Northern and North-Eastern India. Land 2021, 10, 52. https://doi.org/10.3390/land10010052
Nayak S, Maity S, Singh KS, Nayak HP, Dutta S. Influence of the Changes in Land-Use and Land Cover on Temperature over Northern and North-Eastern India. Land. 2021; 10(1):52. https://doi.org/10.3390/land10010052
Chicago/Turabian StyleNayak, Sridhara, Suman Maity, Kuvar S. Singh, Hara Prasad Nayak, and Soma Dutta. 2021. "Influence of the Changes in Land-Use and Land Cover on Temperature over Northern and North-Eastern India" Land 10, no. 1: 52. https://doi.org/10.3390/land10010052
APA StyleNayak, S., Maity, S., Singh, K. S., Nayak, H. P., & Dutta, S. (2021). Influence of the Changes in Land-Use and Land Cover on Temperature over Northern and North-Eastern India. Land, 10(1), 52. https://doi.org/10.3390/land10010052