Article

Effects of Land Cover Changes on Net Primary Productivity in the Terrestrial Ecosystems of China from 2001 to 2012

1
Center for Ecological Forecasting and Global Change, Northwest A&F University, Yangling 712100, China
2
Key Laboratory of Southwest China Wildlife Resources Conservation, China West Normal University, Ministry of Education, Nanchong 637009, China
3
State Key Laboratory of Soil Erosion and Dryland Farming on the Loess Plateau, Northwest A&F University, Yangling 712100, China
4
College of Hydrology and Water Resources, Hohai University, Nanjing 210098, China
5
Department of Biology Sciences, Institute of Environment Sciences, University of Quebec at Montreal, Montreal, QC H2L 2C4, Canada
*
Author to whom correspondence should be addressed.
Land 2020, 9(12), 480; https://doi.org/10.3390/land9120480
Submission received: 21 October 2020 / Revised: 20 November 2020 / Accepted: 25 November 2020 / Published: 29 November 2020
(This article belongs to the Special Issue Land Use and Climate Change)

Abstract

:
The 2001–2012 MODIS MCD12Q1 land cover data and MOD17A3 NPP data were used to calculate changes in land cover in China and annual changes in net primary productivity (NPP) during a 12-year period and to quantitatively analyze the effects of land cover change on the NPP of China’s terrestrial ecosystems. The results revealed that during the study period, no changes in land cover type occurred in 7447.31 thousand km2 of China, while the area of vegetation cover increased by 160.97 thousand km2 in the rest of the country. Forest cover increased to 20.91%, which was mainly due to the conversion of large areas of savanna (345.19 thousand km2) and cropland (178.96 thousand km2) to forest. During the 12-year study period, the annual mean NPP of China was 2.70 PgC and increased by 0.25 PgC, from 2.50 to 2.75 PgC. Of this change, 0.21 PgC occurred in areas where there was no land cover change, while 0.04 PgC occurred in areas where there was land cover change. The contributions of forest and cropland to NPP exhibited increasing trends, while the contributions of shrubland and grassland to NPP decreased. Among these land cover types, the contributions of forest and cropland to the national NPP were the greatest, accounting for 40.97% and 27.95%, respectively, of the annual total NPP. There was no significant correlation between changes in forest area and changes in total annual NPP (R2 < 0.1), while the correlation coefficient for changes in cropland area and total annual NPP was 0.48. Additionally, the area of cropland converted to other land cover types was negatively correlated with the changes in NPP, and the loss of cropland caused a reduction in the national NPP.

1. Introduction

Net primary production (NPP) represents the total amount of organic matter accumulated by vegetation per unit area and time and is the difference between the carbon absorbed by photosynthesis and the carbon released by autotrophic respiration [1]. NPP is used to determine the carbon sources/sinks of ecosystems, regulates ecological processes, and is the material basis for the survival and reproduction of other organisms in terrestrial ecosystems [2]. Due to differences in the carbon sequestration capacity of different vegetation types, there are differences in NPP per unit area [3]. Therefore, land cover changes will affect NPP to some extent. NPP is not only affected by precipitation, temperature, and other environmental factors but also actively responds to human activities [4,5]. Land use and land cover change (LUCC) is a popular topic in global research and is one of the important factors by which human activities can induce changes in total NPP in terrestrial ecosystems. Therefore, against the background of the increasing impact of global changes and human activities on the ecological environment, several international studies have employed terrestrial ecosystem models to investigate the effects of land use and land cover change on NPP [6]. Examples include the CASA model [7,8], SIB2 model [9], CENTURY model [10], and TEM model [11], all of which use either land use or land cover changes as input data to evaluate NPP changes. Since the 19th century, international researchers have obtained many important results on the relationship between global or regional ecosystem NPP and climatic factors, particularly precipitation and temperature. The responses of vegetation cover to climate change, however, exhibit large spatiotemporal heterogeneity, and different vegetation types have different sensitivities and response characteristics to climate change. Therefore, the driving mechanisms behind the spatiotemporal heterogeneity of NPP at the regional level remain unclear [3].
China covers a vast area, features a complex geographical environment. As one of the world’s first cultivated areas [12], it has responded to the rapid population growth of the past 300 years in the form of an unprecedented expansion of its agricultural land [13]. In addition, the modernization of China has resulted in a new active period of structural changes in China’s land use [14]. Subsequently, cropland afforestation, the conversion of fields to grassland, and the implementation of natural forest resource conservation have resulted in some improvements to vegetation cover. By the end of 2007, the area of returning farmland to forest and grassland had reached up to 9,264,135 ha, and the afforestation of barren hills and wasteland had reached 14,979,333 ha [15]. During this period, China’s research on land use changes and climate change has been more developed than that of any other period. Many researchers have examined the effects of land use changes on ecosystem NPP at the regional scale [16,17,18]. In Xinjiang, the total NPP of the whole area increased by 252.51 Gg C during 2001–2009, mainly resulting from forest expansion [19]; however, the total NPP on the Sanjiang Plain declined by 6.7 % (0.29 × 10⁴ Gg C) from 2000 to 2005 and this reduction had a significant correlation with LUCC in terms of wetland degeneration, forest reduction, and farmland increase [20]. Additionally, in mainland China the national total losses in NPP attributed to urbanization reached 1.695 TgC between the late 1980s and 2015 [21].
Therefore, the objectives of this study were to (1) use the MODIS land cover and NPP data to study changes in land use and land cover in China from 2001–2012 at the national scale and (2) further examine their effects on the country’s terrestrial ecosystem NPP. This research will assist in the identification of land configuration dynamics and the responses of ecosystems to changes in the land configuration dynamics of China in recent years.

2. Materials and Methods

2.1. Data Sources

The MODIS Land Cover Type MCD12Q1 [22] was used in this study. MCD12Q1 is a descriptive land cover product obtained after processing the annual observation data from the Terra and Aqua satellites. Its spatial resolution is 500 m. Cross-validation analysis indicates that the overall accuracy of the product is approximately 75% correctly classified [23]. According to land cover dataset assessments across China, the overall spatial agreement of MCD12Q1 2001 and 2010 reached 73.2% [24].
We selected the land cover map of China from 2001–2012 that was classified according to the U.S. University of Maryland (UMD) classification scheme [25]. Table 1 lists the land cover type and definition of the UMD classification scheme.
In this study, the downloaded data were reclassified based on the UMD land cover type into 8 types: Water bodies, forests (including evergreen needleleaf forests, evergreen broadleaf forests, deciduous needleleaf forests, deciduous broadleaf forests, mixed forests), shrubland (including closed shrublands or shrublands, open shrubland), savanna (including woodlands, woodlands/shrublands), grassland, cropland, urban and built-up areas, and barren areas. Statistical analysis was then performed on the annual area changes in every land type across China.
The NPP data used in this study comprised the MODIS 2001–2012 vegetation product MOD17A3, which has a spatial resolution of 1 km. The Biome-BGC carbon cycle process model [27] was used to generate the MOD17A3 product [28]. Model inputs included land cover type, daily leaf area index (LAI), and daily meteorological data (including PAR, precipitation, minimum temperature, maximum temperature, and vapor pressure deficit), and the land cover and leaf area index were derived from Landsat data [29]. At present, this product is widely used in the estimation of vegetation growth and biomass, environmental observations in different regions, and global change studies, allowing some information to be obtained.

2.2. Data Analysis

The land use dynamic degree model [30] is a marker that reveals the land use rate of change and is often used to analyze temporal changes in land use type areas. The calculation of the land use change dynamic degree for each land cover type from 2001–2012 was employed to analyze the areal change of each land use type during the study period [31]. The equation is as follows
S = i         j n S i j / S i × 1 / t × 100 %
where S represents the rate of change of land use in the corresponding study region during time period t; S i represents the total area of the ith land use type at the start of monitoring; Δ S i j represents the sum of the area of the ith land use type that was converted to other land use types during the monitoring period; and t is the time period of land use change. The land transfer matrix in 2-year intervals from 2001–2012 was generated to obtain the annual conversion between various land use types during the 12-year period.
Correlation analysis was employed to establish a regression formula between the annual changes in the percentage of each land use type over the total land area of China, the annual conversion area among the four main vegetation types (forests, shrubland, grassland, and cropland), and the calculation of the annual NPP changes as well as the coefficient of determination, R2. R2 < 0.4 indicates a low correlation and R2 < 0.6 indicates a moderate correlation. Additionally, we established a multiple linear regression equation between the area change of six coverage types and the change in national NPP to find the relationship between land cover change and NPP.

3. Results

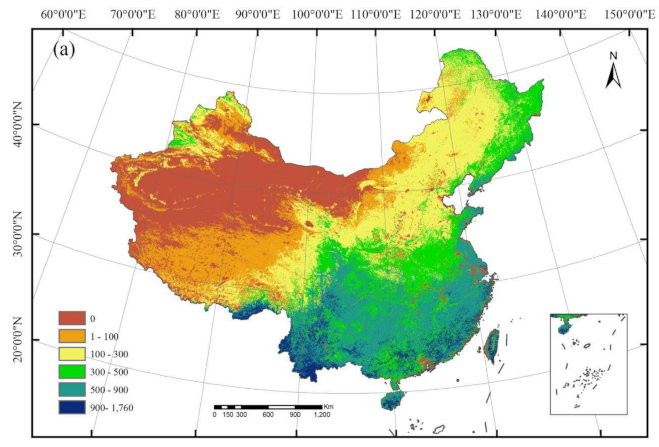
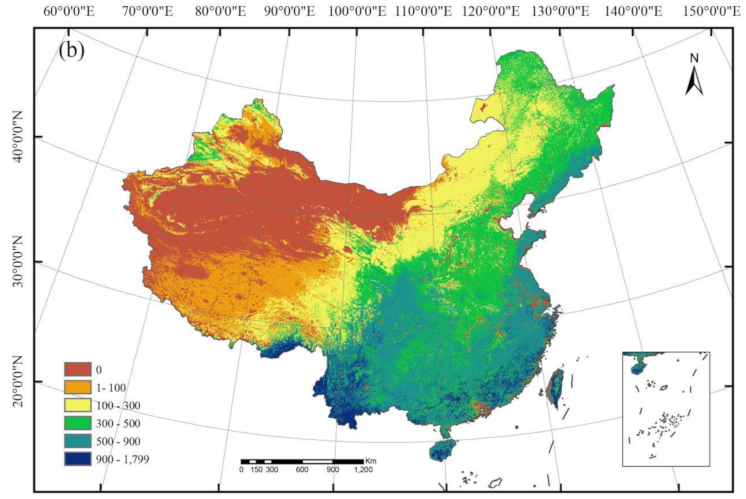
3.1. Land Cover Changes in China from 2001–2012

Statistical analysis of the MCD12Q1 land cover data revealed that during the study period, the area of vegetation cover (including forests, savanna, shrubland, grassland, and cropland) expanded from 7073.08 thousand km2 in 2001 to 7234.04 thousand km2 in 2012, an increase of 160.97 thousand km2 (Table 2), although the areas of and grassland decreased. The reduction in shrubland area was the greatest (approximately 45.84%) based on the rate of change, while the area of forest and cropland increased by 467.25 thousand km2 (30.79%) and 58.26 thousand km2 (3.45%), respectively, compared with their respective values in 2001. In areas without vegetation cover, the area of water bodies increased by 14.98%, and the area of bare land (including permafrost) decreased by 158.66 thousand km2 (−7.05%).
The land use change dynamic degree analysis (Table 2) showed that from 2001–2012, the reduction rate of shrubland in China was the fastest (S = −3.85%), followed by that of savanna (S = −2.71%). The areas of water bodies and forests continuously increased, by 1.25% and 2.57%, respectively. Although the area of cropland increased, this increase was small (0.29%). Overall, the area of bare land decreased by an annual average of 0.59%, while the area of vegetation cover increased by an annual average of 0.19%.
The increase in forest area was mainly due to decreases in savanna, shrubland, and cropland (Table 3). From 2001–2012, 345.19 thousand km2 of savanna, 44.00 thousand km2 of shrubland, and 178.96 thousand km2 of cropland were converted to forests, accounting for 46.87%, 17.96%, and 10.61% of the 2001 areas of savanna, shrubland, and cropland, respectively. The increase in cropland area mainly originated from shrubland, savanna, and grassland. During the study period, 13.80% of shrubland (33.81 thousand km2), 12.86% of savanna (94.69 thousand km2), and 9.17% of grassland (264.94 thousand km2) were converted to cropland. In addition to the conversion of shrubland to forests and cropland, a large amount of shrubland was converted to grassland (99.78 thousand km2) and bare land (15.04 thousand km2), accounting for 40.73% and 13.08%, respectively, of the grassland in 2001. A small area of shrubland (12.26 thousand km2, 5.01%) was converted to savanna.
With the exception of small areas of grassland (44.02 thousand km2) and bare land (33.78 thousand km2) that were converted to shrubland, the areas of other land cover types that were converted to shrubland were extremely low (<1%). This process caused the area of shrubland to greatly decrease during the 12-year period. While savanna was converted to other land cover types, some forest (100.61 thousand km2, 6.63%), shrubland (12.26 thousand km2, 5.01%), and cropland (84.67 thousand km2, 5.02%) areas were converted to savanna. In addition, 229.66 thousand km2 are land (which declined in area) was converted to grassland, accounting for 10.22% of the bare land area in 2001.

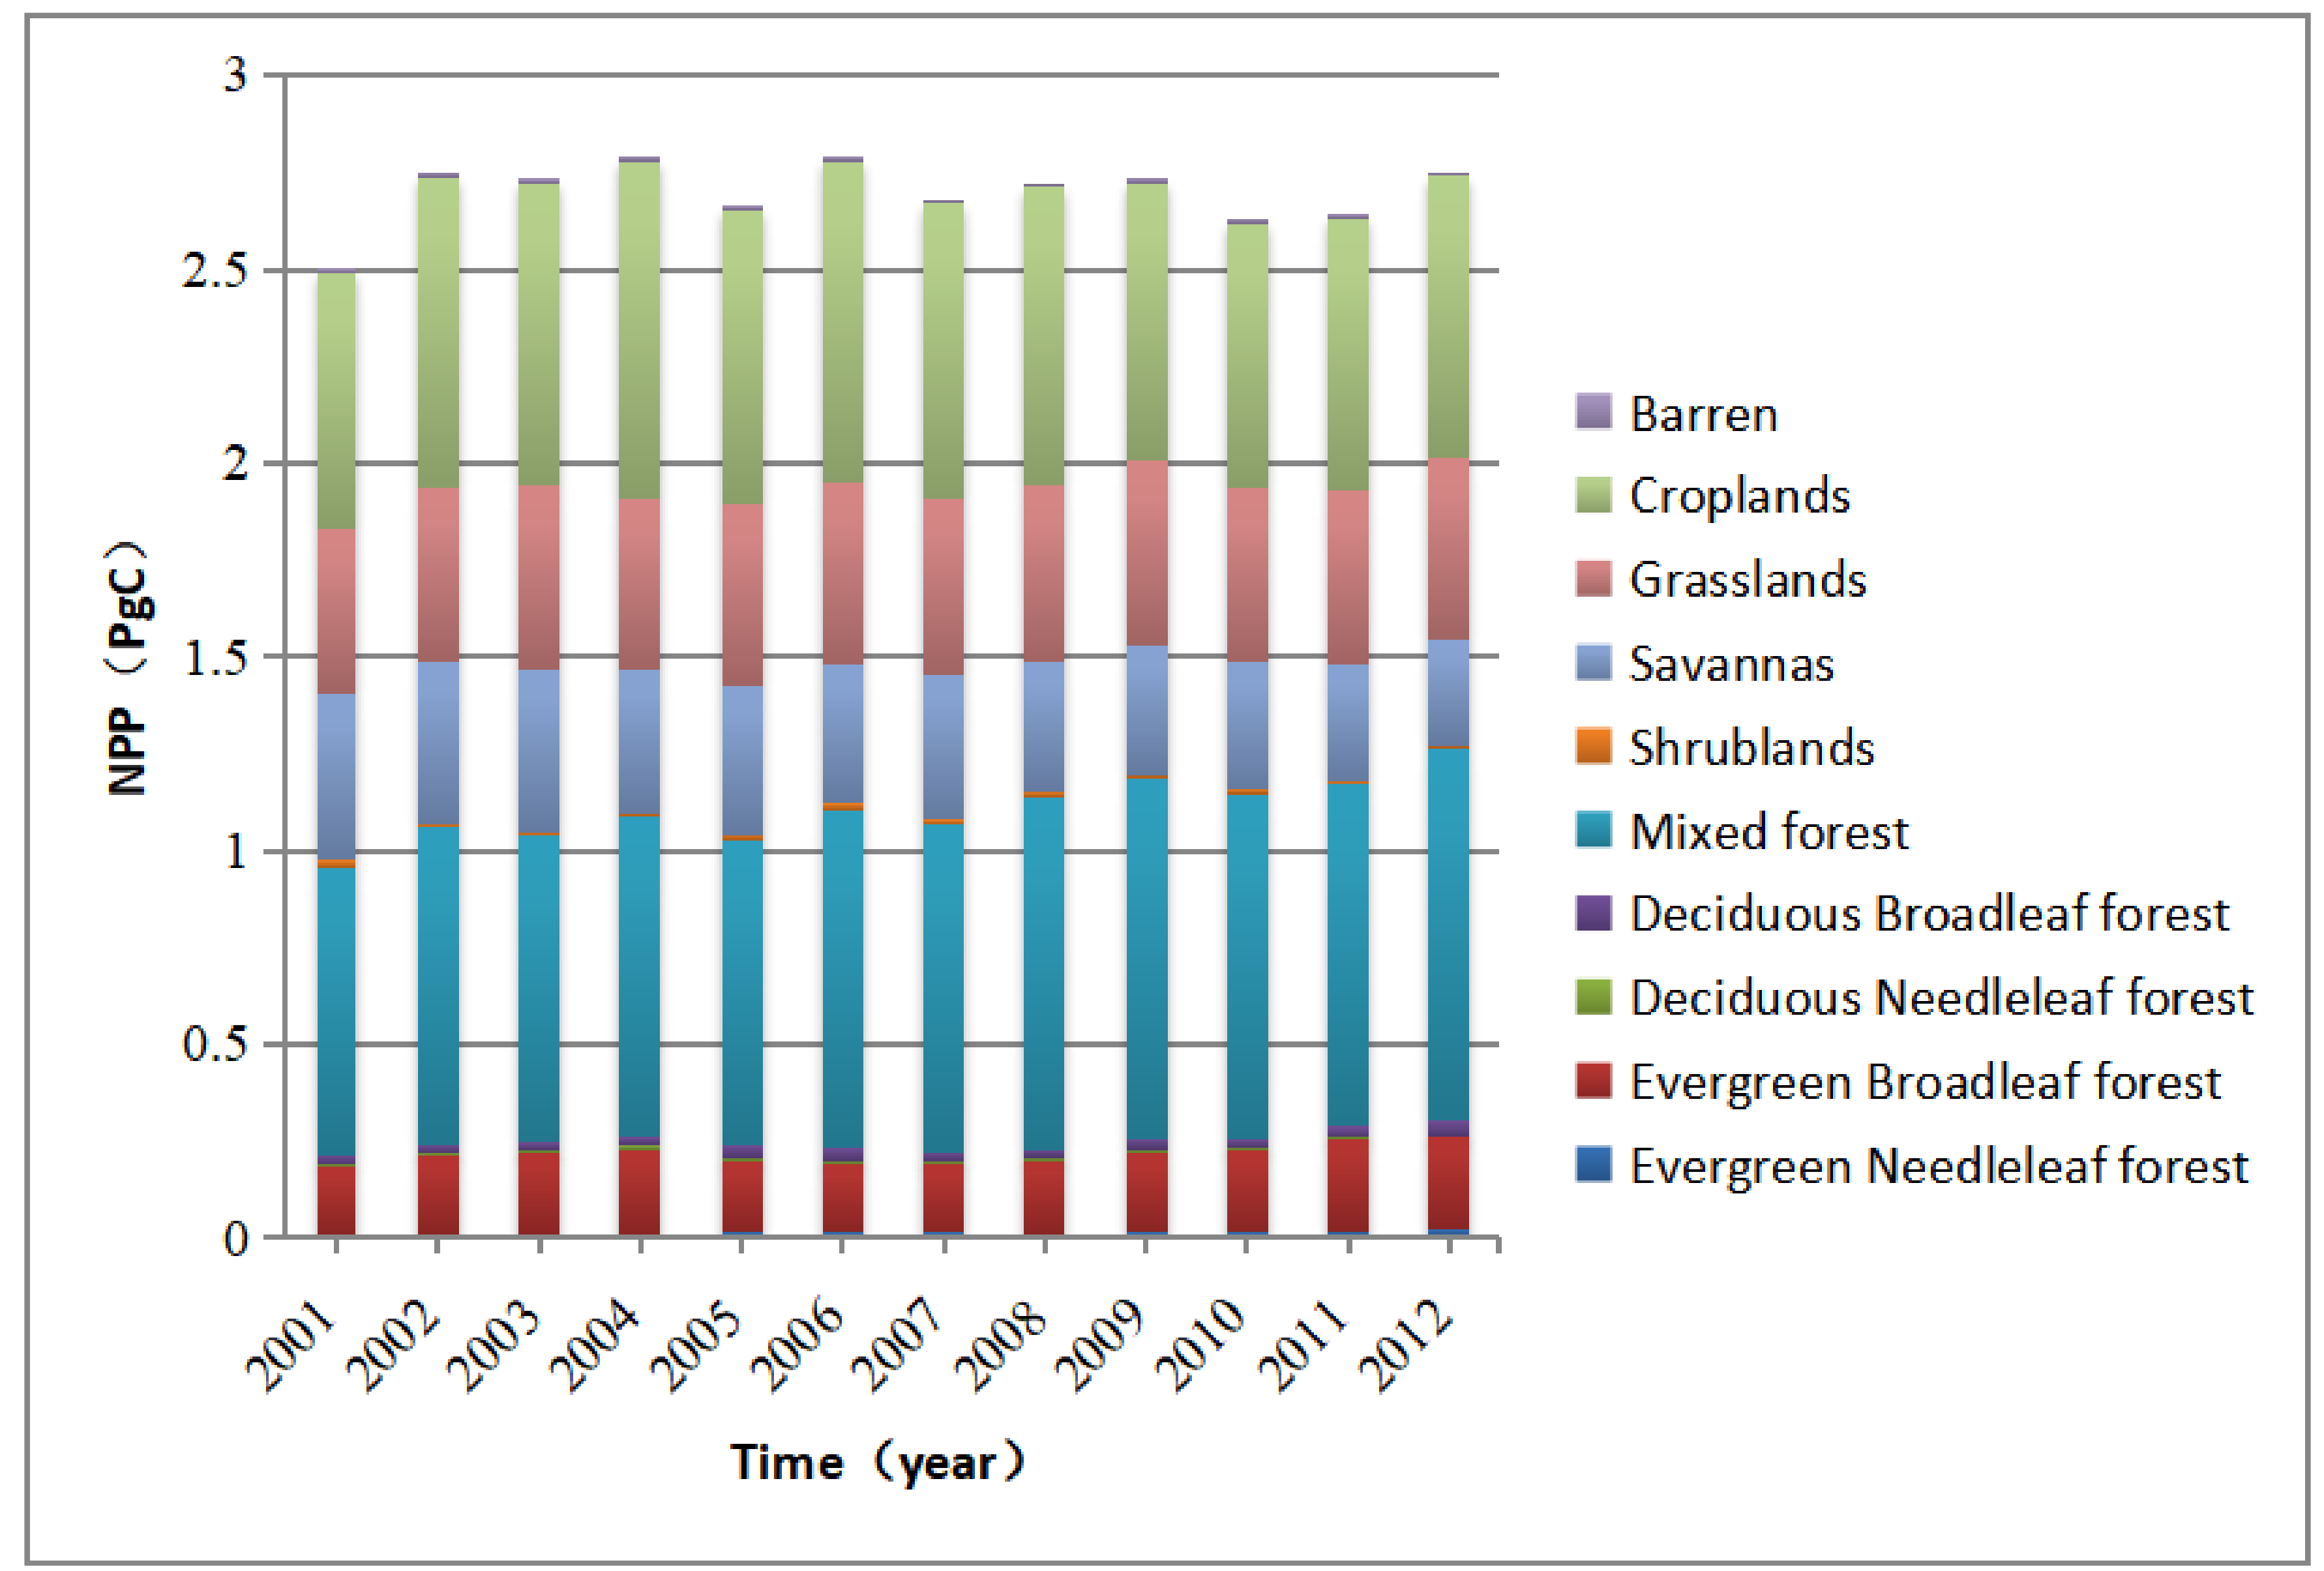
3.2. Annual Changes in Terrestrial NPP and Contribution of Major Vegetation Types in China from 2001–2012

Statistical analysis of the MODIS MOD17A3 data for China (Figure 1) revealed that the mean total NPP of China’s terrestrial vegetation from 2001–2012 was 2.70 PgC/year. With the exception of 2001, when the national NPP was low (2.50 PgC), the mean NPP in the remaining 11 years was >2.63 PgC (2010), with its peak (2.79 PgC) occurring in 2004. In 2012, China’s terrestrial vegetation NPP was 0.25 PgC higher than its 2001 level, i.e., 2.75 PgC vs. 2.50 PgC.
Among forests, shrubland, savanna, grassland, and cropland, the contribution of forests to the national NPP was the greatest, with an average of 1.10 PgC per year in the 12-year period, accounting for 40.89% of the total annual NPP. This value was followed by that of cropland, grassland, savanna, and shrubland, with total annual NPP contributions of 27.95% (0.76 PgC), 16.94% (0.46 PgC), 13.38% (0.36 PgC), and 0.44% (0.01 PgC), respectively, while the remaining 0.40% originated from bare land and sparsely vegetated land. During the study period, forest NPP increased each year (from 0.95 PgC in 2001 to 1.27 PgC in 2012), cropland NPP initially increased prior to decreasing, grassland NPP increased, and the NPP levels of shrubland and savanna both decreased.
There were large differences in the mean annual NPP of different vegetation cover types. Of the forests, the mean annual NPP of evergreen broadleaf forests was the highest (1028 gC/m2/year), followed by that of mixed forests (572 gC/m2/year). The NPP values of the remaining forest types in descending order were evergreen coniferous forests (466 gC/m2/year), deciduous broadleaf forests (360 gC/m2/year), and deciduous coniferous forests (309 gC/m2/year). The annual mean NPP values of cropland and grassland were 415 gC/m2/year and 168 gC/m2/year, respectively. For shrubland, the NPP of closed shrubs was 315 gC/m2/year, and the NPP of sparse shrubs was 72 gC/m2/year (Figure 2).
From the spatial distribution, it can be seen that the mean annual national NPP and land cover type map during the 12-year study period exhibited similar regional distributions, decreasing from the southeast to northwest. Regions with an NPP of 900 gC/m2/year mostly appeared in Yunnan Province, while there were large desert areas with NPP values of zero around the Taklamakan Desert in Xinjiang. Compared with 2001, the NPP in northeastern to central China displayed a significant increase by 2012, increasing at an average of 300–500 gC/m2/year to the northwest (Figure 2).
Combining land cover and NPP changes revealed that no land cover change occurred in 7447.31 thousand km2 (Table 3) of China during the study period, and the total NPP increased by 0.25 PgC compared with that in 2001. Of these changes, 0.21 PgC occurred in areas where there was no land cover change, while 0.04 PgC occurred in areas where there was land cover change. Among regions with no land cover changes, the NPP of all land cover types increased, with the exception of savanna, for which the annual mean NPP decreased.

3.3. Correlation Analysis of Land Cover Area Changes and National NPP

A statistical analysis of the annual changes in the areas of various land cover types showed that forest cover increased from 15.99% in 2001 to 20.91% in 2012, and cropland cover increased from 17.77% in 2001 to 18.38% in 2012 (Table 2); in contrast, the areas of savanna and bare land decreased (Table 2). In this study, we calculated the annual area dynamics of each vegetation type during the study period and determined the correlations of each with the total NPP each year. Our results revealed that the annual changes in cropland area had the highest R2 with annual NPP changes, reaching 0.48 (Figure 3), indicating a moderate correlation. In addition, changes in shrubland, savanna, and bare land areas exhibited some negative correlations with annual NPP changes, with R2 values of 0.23, 0.24, and 0.12, respectively, indicating a low correlation. Meanwhile, the changes in forest and grassland areas did not show any correlation with NPP (R2 < 0.1).
Using multiple linear stepwise regression analysis, the fitting equation between the change in coverage area and the total amount of NPP was obtained (Table 4). The R2 of the fitting equation was 0.83, and the p value was less than 0.01. The results showed that the area changes in savanna, grassland, farmland, and wasteland affected the total amount of NPP in China. The changes in the areas of these four coverage types explained the change in NPP.

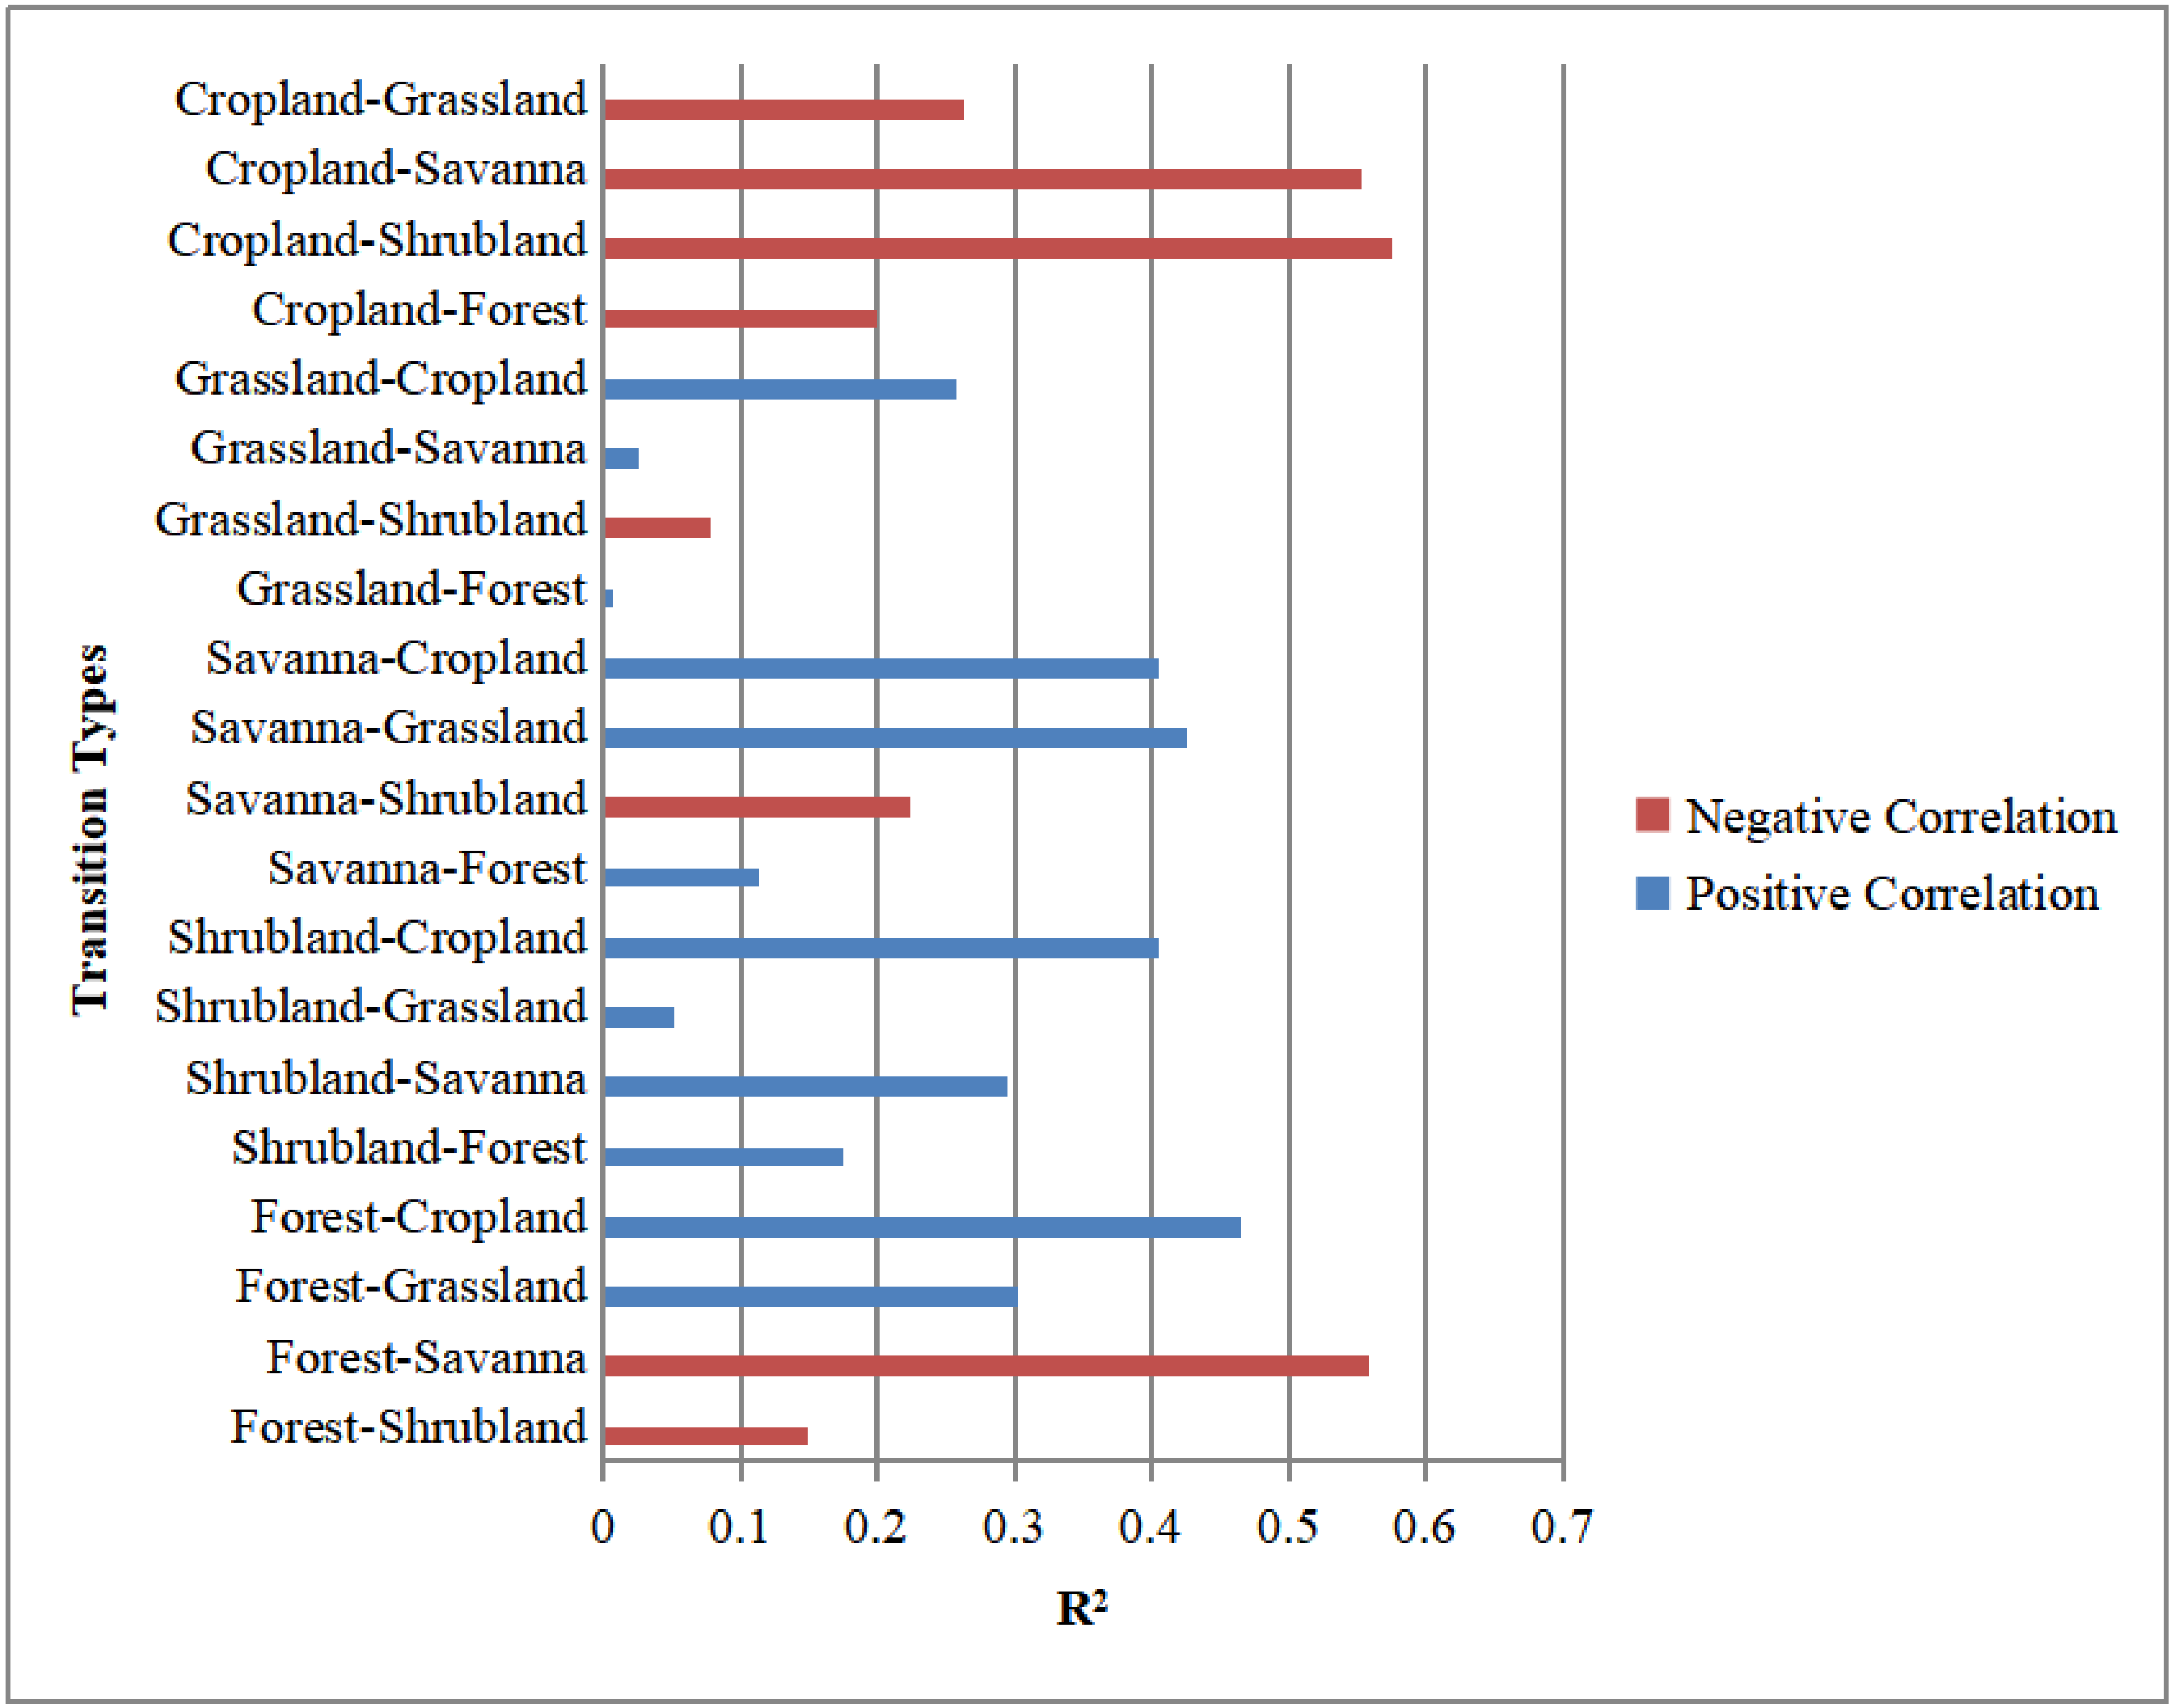
3.4. Correlation Analysis of the Area Converted between Vegetation Types and National NPP

We calculated the annual conversion area between forest, shrubland, savanna, grassland, and cropland and constructed a regression formula with the annual NPP changes. The results showed that, with the exceptions of the conversion of grassland to forest, shrubland, and savanna and the conversion of shrubland to grassland (R2 < 0.1), the mutual conversion between various types displayed some correlation with changes in NPP (Figure 4). The highest correlation was found for the conversion of cropland to shrubland, with an R2 of 0.57. In addition, the conversions of forest to grassland and from cropland to savanna exhibited moderate correlations with changes in NPP, with R2 values of 0.56 and 0.55, respectively. In addition, R2 > 0.4 was found for the conversions of forest to cropland, shrubland to cropland, savanna to grassland, and savanna to cropland. Meanwhile, the R2 values of the other conversions ranged from 0.11–0.30, showing a low correlation.
From the slope in the linear regression formula, it can be seen that the conversions of cropland to other vegetation types were negatively correlated with the annual NPP changes. In addition, the conversion of forest to shrubland, forest to savanna, and savanna to shrubland were negatively correlated with changes in NPP changes.

4. Discussion

4.1. Land Cover and NPP Changes in China from 2001–2012

Since the 1990s, China has initiated various key forestry projects, such as natural forest conservation, wind-blown sand governance in Beijing-Tianjin, and cropland afforestation, in an effort to achieve ecological restoration [32]. Since cropland afforestation was initiated in 1999, tremendous progress has been made in ecological restoration and poverty alleviation [33]. In combination with this study, we discovered that the forest area increased in China from 2001–2012. At the same time, large tracts of cropland were converted to forest and grassland. The national cropland afforestation project planned to complete 146.7 thousand km2 of cropland afforestation by 2010. The results of this study revealed that a total of 165 thousand km2 underwent cropland afforestation from 2001–2012, demonstrating that China’s cropland afforestation was well implemented. However, in other studies, based on different datasets, although the estimates in China showed a net increase in forest cover (from 1.5% to 3.4%) during 2000–2013 [34], there have been other studies that have shown a net decrease in forest cover [35]. So, there is a speculation that China’s forest cover could have stabilized during the 2000s (2000–2013) [34]. This difference may be due to the definition of different land cover classification schemes and the resolution of the dataset; thus, further studies are needed to verify the area change of forest in China after year 2000.
In addition, a large area of grassland was lost in China during the 12-year period, as it was converted to forests, cropland, or desert. It can be speculated that grassland degradation and reclamation are still ongoing under many grassland conservation measures (such as converting cropland to grassland and prohibiting grazing). During the same period, however, approximately 229.66 thousand km2 (10.20%) of bare land was converted to grassland, indicating that the ecological environment in some parts of China gradually improving.
From 2001–2012, the annual mean NPP of China was 2.70 PgC, and the mean NPP per unit area decreased from the southeast to northwest. Since there are large differences in the carbon sequestration capacity per unit area among different land cover types, the annual mean NPP and land cover of China exhibited similar distribution patterns. During the study period, NPP increased from 2.50 to 2.75 PgC. The current estimates of NPP at global and regional scales are highly uncertain [36]. Precision analysis of the simulation results of the Miami model, LUE model, CASA model, CEVSE model, and GLOPEM model in China demonstrated that the CASA model results were the most accurate [37]. The NPP of China from 2001–2010 measured by the CASA model increased from 2.25 to 2.62 PgC [38], and the values, variation trends, and spatial distribution were close to the statistical results of this study.

4.2. Correlation between Land Cover and NPP Changes in China from 2001–2012

Changes in grassland area did not significantly affect NPP. The area dynamics of shrubland, savanna, and bare land displayed some negative correlations with NPP, but the R2 values were not high. Forest and cropland provided the largest contributions to total NPP in China. The correlation between the area dynamics and annual NPP changes, however, revealed that the effects of changes in cropland area on NPP were higher and that forest area dynamics were not correlated with NPP. A possible reason for this result may be that the biomass per unit area and NPP differences in sparse forests and close forests are higher, while the carbon sequestration capacity per unit area of young forests is not high. As forest area and crown density increase, however, the NPP per unit area will significantly increase. Therefore, the effects of an increase in forest area on total national NPP are not significant.
From the correlation between the conversion area of land cover types and NPP, cropland was shown to have the highest correlation between area and NPP, and its conversion to other vegetation types exhibited negative correlations with NPP. From the R2 values, it can be seen that for the land cover types with low correlations between area dynamics and NPP, the correlations between land type conversion and NPP changes were also low. For example, the NPP changes between shrubland, grassland, and forest had R2 < 0.2. Conversions involving cropland had R2 > 0.2, regardless of whether the correlations were positive or negative, and most R2 values were >0.4. Correlation studies of NPP in other regions of China have shown that cropland exerts significant effects on NPP. For example, Liu et al. employed the BEPS model to calculate that cropland NPP accounted for 33.67% of the national NPP in China from 2001–2010 [39]. Dong et al. employed the CASA model to calculate changes in forest and cropland areas on the Sanjiang Plain from 2000–2010 and found that total NPP decreased by 6.7% [20].
It is worth noting that most other studies on the effects of land use changes on NPP have examined ecosystems consisting of either woody plants (forests) or grasses (grasslands), while there have been few studies examining savanna, which is a mixed ecosystem consisting of woody plants and grasses. However, our study found that the correlations between savanna area dynamics and NPP, as well as the conversion of savanna to other vegetation types and NPP, differed from those of forests and grassland. Therefore, the contributions to and effects of mixed woody plant-grass ecosystems on national NPP is are worthy of further study.

4.3. Uncertainty Analysis

During the study period, the MCD12Q1 data showed that the area of urban land in China was approximately 83 thousand km2. (Based on the definition in the classification scheme, these data were obtained from the population distribution layer in the digital chart of the world [26], instead of AVHRR image classification.) From 2001–2012, there was no significant change in area and there was no spatial transfer, although statistical data from the Statistical Yearbook of China [40] and China Land Resource Bulletin [41] revealed that some cropland area was lost each year from 2001–2012 due to conversion to construction land. This result was not reflected in the MCD12Q1 data, however. Related studies also showed that construction land increased by 1.7053 million ha from 2000–2005, of which 1.276 million ha came from cropland [16]. Therefore, further research on the precision of the MCD12Q1 data on urban construction land in the UMD classification scheme is required. At the same time, changes in the unclassified land area of the MCD12Q1 data were large, which somewhat interfered with the study results.
In addition to the effects of land cover change, NPP exhibits significant responses to precipitation and temperature [3]. Gao used the GLO-PEM model to simulate NPP in northern China. The results revealed that the effects of climate on NPP predominated in the study region (accounting for 90% of the total effects). With regard to regions with land use, the effects of land use were dominant, accounting for 97% of the effects [42]. However, our study did not consider the effects of climatic factors. Therefore, further research is required to determine the proportion of the effects of land use change on NPP changes of China.

5. Conclusions

We found that during the 12-year period, the vegetation cover in China has increased, of which forest area displayed the largest increase. The increase in area mainly originated from savanna and cropland, while shrubland, savanna, and grassland showed varying degrees of reduction. At the same time, some bare land was gradually replaced by shrubland and grassland. Among these land cover changes, forest and cropland provided the largest contributions to China’s NPP, although the effect of cropland area on total annual NPP was greater, and forest area did not exhibit any correlation with NPP. In addition, the loss of cropland has resulted in the total NPP to decrease.
Moreover, from 2000 to 2012, the annual total NPP has increased by 0.25 PgC. Of this change, 0.21 PgC occurred in areas where there was no land cover change, while only 0.04 PgC occurred in areas where there was land cover change. Furthermore, 7447.31 thousand km2 of China did not experience land cover change, but the annual mean NPP values of various land cover types have been changed. We can conclude that China’s land cover underwent various changes from 2001–2012 and exhibited some limited association with NPP; however, land cover change was not the main controlling factor causing NPP changes, so further studies are needed to verify and quantify the relationship between land cover and NPP and other potential factors as well.

Author Contributions

Conceptualization, Q.Z. and H.L.; methodology, C.P. and Q.Z.; software, H.L. and J.Z.; validation, J.D.; data curation, H.L.; writing—original draft preparation, H.L.; writing—review and editing, Z.Y. and B.Y.; supervision, C.P. and Q.Z.; project administration, C.P. and Q.Z.; funding acquisition, C.P. and Q.Z. All authors have read and agreed to the published version of the manuscript.

Funding

This study was financially supported by the Second Tibetan Plateau Scientific Expedition (2019QZKK0304), the National Key R&D Program of China (2016YFC0500203), the Fundamental Research Funds for the Central Universities (2019B04714), and the Natural Sciences and Engineering Research Council of Canada (NSERC) discovery grant.

Acknowledgments

The authors would like to express their gratitude to the editors and the anonymous reviewers for their comments and suggestions.

Conflicts of Interest

The authors declare no conflict of interest.

References

  1. Lieth, H.; Whittaker, R.H. Primary Productivity of the Biosphere; Springer: Berlin/Heidelberg, Germany, 1975; Volume 32, p. 274. [Google Scholar]
  2. Field, C.B.; Behrenfeld, M.J.; Randerson, J.T.; Falkowski, P. Primary production of the biosphere: Integrating terrestrial and oceanic components. Science 1998, 281, 237–240. [Google Scholar]
  3. Piao, S.L.; Fang, J.Y.; He, J.S. Variations in vegetation net primary production in the Qinghai-Xizang Plateau, China, from 1982 to 1999. Clim. Chang. 2006, 74, 253–267. [Google Scholar]
  4. Ahl, D.E.; Gower, S.T.; Mackay, D.S.; Burrows, S.N.; Norman, J.M.; Diak, G.R. The effects of aggregated land cover data on estimating NPP in northern Wisconsin. Remote Sens. Environ. 2005, 97, 1–14. [Google Scholar]
  5. Wang, H.; Li, X.B.; Long, H.L.; Gai, Y.Q.; Wei, D.D. Monitoring the effects of land use and cover changes on net primary production: A case study in China’s Yongding River basin. For. Ecol. Manag. 2009, 258, 2654–2665. [Google Scholar]
  6. Cramer, W.; Kicklighter, D.W.; Bondeau, A.M.B.; Churkina, C.; Nemry, B. Comparing global models of terrestrial net primary productivity (NPP): Overview and key results. Glob. Chang. Biol. 1999, 5 (Suppl. S1), 1–15. [Google Scholar]
  7. Potter, C.S.; Randerson, J.T.; Field, C.B.; Matson, P.M.; Vitousek, P.M. Terrestrial ecosystem production: A process model based on global satellite and surface data. Glob. Biogeochem. Cycles 1993, 7, 811–841. [Google Scholar]
  8. Xu, H.J.; Wang, X.P. Effects of altered precipitation regimes on plant productivity in the arid region of northern China. Ecol. Inform. 2016, 31, 137–146. [Google Scholar]
  9. Sellers, P.J. A revised land surface parameterization (SiB2) for atmospheric GCMs, Part II: The generation of global fields of terrestrial biophysical parameters from satellite data. J. Clim. 1996, 9, 706–737. [Google Scholar]
  10. Parton, W.J.; Scurlock, J.M.O.; Ojima, D.S.; Gilmanov, T.G.; Scholes, R.J. Observations and modeling of biomass and soil organic matter dynamics for the grassland biome worldwide. Glob. Biogeochem. Cycles 1993, 7, 785–809. [Google Scholar]
  11. McGuire, A.D.; Melillo, J.M.; Kicklighter, D.W.; Joyce, L.A. Equilibrium responses of soil carbon to climate change: Empirical and process-based estimates. J. Biogeogr. 1995, 22, 785–796. [Google Scholar]
  12. Liujuan, M.; Feng, Z.; Bin, H.; Mario, F.; Qiang, L.; Xue, C.; Xuefeng, C. Synthesis of China’s land use in the past 300 years. Glob. Planet. Chang. 2013, 100, 224–233. [Google Scholar]
  13. Goldewijk, K.K. Three centuries of global population growth: A spatial referenced population (density) database for 1700–2000. Popul. Environ. 2005, 26, 343–367. [Google Scholar]
  14. Ge, Q.S.; Dai, J.H.; He, F.N. Land Use Changes and Terrestrial Carbon Budgets in China during the Last 300 Years; Science Press: Beijing, China, 2008; pp. 108–128. [Google Scholar]
  15. Chen, X.; Zhang, X.; Zhang, Y.; Wan, C. Carbon sequestration potential of the stands under the grain for green program in Yunnan province, China. For. Ecol. Manag. 2009, 258, 199–206. [Google Scholar]
  16. Yang, H.F.; Mu, S.J.; Li, J.L. Effects of ecological restoration projects on land use and land cover change and its influences on territorial NPP in Xinjiang, China. Catena 2014, 115, 85–95. [Google Scholar]
  17. Dong, G.T.; Bai, J.; Yang, S.T.; Wu, L.N.; Cai, M.Y.; Zhang, Y.C.; Luo, Y.; Wang, Z.W. The impact of land use and land cover change on net primary productivity on China’s Sanjiang Plain. Environ. Earth Sci. 2015, 74, 2907–2917. [Google Scholar]
  18. Zhang, Y.; Zhang, C.B.; Wang, Z.Q.; Yang, Y.; Zhang, Y.Z.; Li, J.L.; An, R. Quantitative assessment of relative roles of climate change and human activities on grassland net primary productivity in the Three-River Source Region, China. Acta Pratacult. Sin. 2017, 26, 1–14. [Google Scholar]
  19. Jiang, C.W.; Zhi, F.; Cheng, J.; Qian, L.X. Analyzing the effects of land cover change on vegetation net primary productivity in Guangdong province. J. Nat. Resour. 2016, 31, 961–972. [Google Scholar]
  20. Liu, J.H.; Gao, J.X. Effects of climate and land use change on the changes of NPP in the farming-pastoral ecotone of northern China. Resour. Sci. 2009, 31, 493–500. [Google Scholar]
  21. Li, J.; Wang, Z.L.; Lai, C.G.; Wu, X.Q.; Zeng, Z.Y.; Chen, X.H.; Lian, Y.Y. Response of net primary production to land use and land cover change in mainland China since the late 1980s. Sci. Total Environ. 2018, 639, 237–247. [Google Scholar]
  22. Friedl, M.A.; Mciver, D.K.; Hodges, J.C.F.; Zhang, X.Y.; Schaaf, C.B. Global land cover mapping from modis: Algorithms and early results. Remote Sens. Environ. 2002, 83, 287. [Google Scholar]
  23. Friedl, M.A.; Sulla-Menashe, D.; Tan, B.; Schneider, A.; Ramankutty, N.; Sibley, A. Modis collection 5 global land cover: Algorithm refinements and characterization of new datasets. Remote Sens. Environ. 2010, 114, 168–182. [Google Scholar]
  24. Yang, Y.; Xiao, P.; Feng, X.; Li, H. Accuracy assessment of seven global land cover datasets over China. ISPRS J. Photogramm. Remote Sens. 2017, 125, 156–173. [Google Scholar]
  25. Hansen, M.C.; Defries, R.S.; Townshend, J.R.G.; Sohlberg, R.A. Global land cover classification at 1km spatial resolution using a classification tree approach. Int. J. Remote Sens. 2000, 21, 1331–1364. [Google Scholar]
  26. Danko, D.M. The digital chart of the world project. Photogramm. Eng. Remote Sens. 1992, 58, 1125–1128. [Google Scholar]
  27. Running, S.; Hunt, E. Generalization of a forest ecosystem process model for other biomes, biome-BGC, and an application for global-scale models. Scaling Physiol. Process. 1993. [Google Scholar] [CrossRef]
  28. Turner, D.P.; Ritts, W.D.; Cohen, W.B.; Gower, S.T.; Running, S.W.; Zhao, M. Evaluation of MODIS NPP and GPP products across multiple biomes. Remote Sens. Environ. 2006, 102, 282–292. [Google Scholar]
  29. Cohen, W.B.; Maiersperger, T.K.; Gower, S.T.; Turner, D.P. An improved strategy for regression of biophysical variables and Landsat ETM + data. Remote Sens. Environ. 2003, 84, 561–571. [Google Scholar]
  30. Liu, J.Y.; Zhang, Z.X.; Xu, X.L.; Kuang, W.H.; Zhou, W.S.; Zhang, S.W.; Li, R.D.; Yan, C.Z.; Yu, D.S.; Wu, S.X.; et al. Spatial patterns and driving forces of land use change in China in the early 21st Century. Acta Geogr. Sin. 2009, 64, 1411–1420. [Google Scholar]
  31. Wang, J.; Zheng, Z.Y.; Shao, X.M.; Chen, B.M.; Huang, X.Y.; Zhang, Y. China Land Use Change and Sustainable Development; Chinese Financial & Economic Publishing House: Beijing, China, 2012; pp. 98–129. [Google Scholar]
  32. Tao, R.; Xu, Z.G.; Xu, J.T. Returning farmland to forest, grain policy and sustainable development. Soc. Sci. China 2004, 6, 25–38. [Google Scholar] [CrossRef]
  33. Li, M.; Yao, S.B. Study on the comprehensive benefit evaluation of sloping land converting program. J. Northwest A&F Univ. (Soc. Sci. Ed.) 2016, 16, 118–124. [Google Scholar]
  34. Li, Y.; Sulla-Menashe, D.; Motesharrei, S.; Song, X.P.; Kalnay, E.; Ying, Q. Inconsistent estimates of forest cover change in China between 2000 and 2013 from multiple datasets: Differences in parameters, spatial resolution, and definitions. Sci. Rep. 2017, 7, 8748. [Google Scholar]
  35. Song, D.X.; Huang, C.; Noojipady, P.; Channan, S.; Townshend, J.R. Comparison of remote sensing based forest area and change estimation with national forestry inventory between 2000 and 2005 in China. In Proceedings of the Geoscience and Remote Sensing Symposium (IGARSS) 2014 IEEE International, Quebec City, QC, Canada, 13 July 2014. [Google Scholar]
  36. Shao, J.; Zhou, X.; Luo, Y.; Zhang, G.; Zhu, W. Uncertainty analysis of terrestrial net primary productivity and net biome productivity in china during 1901–2005. J. Geophys. Res. Biogeosci. 2016, 121, 1372–1393. [Google Scholar]
  37. Liang, W.; Yang, Y.T.; Fan, D.M.; Guan, H.D.; Zhang, T.; Long, D.; Zhou, Y.; Bai, D. Analysis of spatial and temporal patterns of net primary production and their climate controls in China from 1982 to 2010. Agric. For. Meteorol. 2015, 204, 22–36. [Google Scholar]
  38. Pei, F.S.; Li, X.; Liu, X.P.; Lao, C.H. Assessing the impacts of droughts on net primary productivity in China. J. Environ. Manag. 2013, 114, 362–371. [Google Scholar]
  39. Liu, Y.B.; Ju, W.M.; He, H.L.; Wang, S.Q.; Sun, R.; Zhang, Y.D. Changes of net primary productivity in China during recent 11 years detected using an ecological model driven by MODIS data. Front. Earth Sci. 2013, 7, 112–127. [Google Scholar]
  40. National Bureau of Statistics, Statistical Yearbook of China; China Statistics Press: Beijing, China, 2012.
  41. Ministry of Land and Resources of the People’s Republic of China. Land and Resources; National Land & Resources Information: Beijing, China, 2012. [Google Scholar]
  42. Gao, Z.Q.; Liu, J.Y.; Cao, M.K.; Li, K.R.; Tao, B. Impacts of land use and climate change on regional net primary productivity. Acta Geogr. Sin. 2004, 59, 581–591. [Google Scholar]
Figure 1. The annual NPP of China during 2001–2012.
Land 09 00480 g001
Figure 2. Spatial distribution of mean NPP in China (unit:gCm-2yr-1): (a) Distribution of mean NPP in 2001; (b) distribution of mean NPP in 2012.
Land 09 00480 g002aLand 09 00480 g002b
Figure 3. Correlation between the area change of different land cover types and annual NPP in China during 2001–2012.
Land 09 00480 g003
Figure 4. Correlation between the area of land cover type transitions and annual NPP changes in China during 2001–2012.
Land 09 00480 g004
Table 1. The UMD classification scheme.
CodeClassesDefinitions
0Water BodiesOceans, seas, lakes, reservoirs, and rivers. Can be either fresh or salt water. This class is derived from a land/water mask.
1Evergreen Needleleaf ForestsLands dominated by trees with a percent canopy cover >60% and height exceeding 5 m. Almost all trees remain green all year. Canopy is never without green foliage.
2Evergreen Broadleaf ForestsLands dominated by trees with a percent canopy cover >60% and height exceeding 5 m. Almost all trees remain green all year. Canopy is never without green foliage.
3Deciduous Needleleaf ForestLands dominated by trees with a percent canopy cover >60% and height exceeding 5 m. Trees shed their leaves simultaneously in response to cold seasons.
4Deciduous Broadleaf ForestsLands dominated by trees with a percent canopy cover >60% and height exceeding 5 m. Trees shed their leaves simultaneously in response to dry or cold seasons.
5Mixed ForestsLands dominated by trees with a percent canopy cover >60% and height exceeding 5 m. Consists of tree communities with interspersed mixtures or mosaics of needleleaf and deciduous forest types. Neither type has <25% or >75% landscape coverage.
6WoodlandsLands with herbaceous or woody understories and tree canopy cover of >40% and <60%. Trees exceed 5 m in height and can be either evergreen or deciduous.
7Wooded Grasslands/ShrublandsLands with herbaceous or woody understories and tree canopy cover of >10% and <40%. Trees exceed 5 m in height and can be either evergreen or deciduous.
8Closed Bushlands or ShrublandsLands dominated by bushes or shrubs. Bush and shrub percent canopy cover is >40%. Bushes do not exceed 5 m in height. Shrubs or bushes can be either evergreen or deciduous. Tree canopy cover is <10%. The remaining cover is either barren or herbaceous.
9Open ShrublandLands dominated by shrubs. Shrub canopy cover is >10% and < 40%. Shrubs do not exceed 2 m in height and can be either evergreen or deciduous. The remaining cover is either barren or of annual herbaceous type.
10GrasslandsLands with continuous herbaceous cover and <10% tree or shrub canopy cover.
11CroplandsLands with >80% of the landscape covered in crop-producing fields. Note that perennial woody crops will be classified as the appropriate forest or shrubs land cover type.
12Urban and Built-upLand covered by buildings and other man-made structures. Note that this class is not mapped from the Advanced Very High Resolution Radiometer (AVHRR) imagery but is developed from the populated places layer that is part of the Digital Chart of the World [26].
13BarrenLands of exposed soil, sand, rocks, snow, or ice that never have more than 10% vegetated cover during any time of year.
14UnclassifiedPoints where the ISLSCP II land/sea mask was labeled land and the UMD original data had sea and which could not be filled in from a 3 by 3 average of surrounding cells.
Table 2. Area of land use and dynamic changes in China during 2001–2012 (unit: thousand km2).
Land Cover TypeWaterForestShrublandSavannaGrasslandCroplandUrban and Built-upBarrenUnclassifiedVegetation Land
Area in 200166.86 1517.59244.95 736.43 2887.72 1686.38 83.49 2251.46 16.44 7073.08
Area in 201276.88 1984.85131.89 496.62 2876.04 1744.64 83.48 2092.80 4.14 7234.04
Changed area10.01 467.25 −113.06 −239.81 −11.68 58.26 −0.01 −158.66 −12.31 160.97
Changed rates14.98%30.79%−46.16%−32.56%−0.40%3.45%−0.01%−7.05%−74.85%2.28%
S1.25%2.57%−3.85%−2.71%−0.03%0.29%0.00%−0.59%−6.24%0.19%
Table 3. Transferring matrix of land cover types in China during 2001–2012 (unit: thousand km2).
FromTo
WaterForestShrublandSavannaGrasslandCroplandUrban and Built-upBarrenUnclassified
Water58.00 3.46 0.11 0.56 1.90 0.59 0.00 2.23 0.00
86.75%5.17%0.17%0.83%2.85%0.88%0.00%3.34%0.00%
Forest2.90 1337.58 3.77 100.61 31.62 39.79 0.00 1.31 0.01
0.19%88.14%0.25%6.63%2.08%2.62%0.00%0.09%0.00%
Shrubland0.56 44.00 39.40 12.26 99.78 33.81 0.00 15.04 0.09
0.23%17.96%16.09%5.01%40.73%13.80%0.00%6.14%0.04%
Savanna1.05 345.19 3.17 274.31 16.98 94.69 0.00 1.01 0.02
0.14%46.87%0.43%37.25%2.31%12.86%0.00%0.14%0.00%
Grassland5.67 71.93 44.02 23.66 2381.50 264.94 0.00 95.92 0.07
0.20%2.49%1.52%0.82%82.47%9.17%0.00%3.32%0.00%
Cropland2.38 178.96 7.51 84.67 114.03 1297.30 0.00 1.32 0.21
0.14%10.61%0.45%5.02%6.76%76.93%0.00%0.08%0.01%
Urban and built-up0.01 0.00 0.00 0.00 0.00 0.00 83.48 0.00 0.00
0.01%0.00%0.00%0.00%0.00%0.00%99.98%0.00%0.00%
Barren6.11 2.54 33.78 0.27 229.66 6.12 0.00 1972.50 0.49
0.27%0.11%1.50%0.01%10.20%0.27%0.00%87.61%0.02%
Unclassified0.20 1.18 0.13 0.27 0.56 7.40 0.00 3.46 3.23
1.21%7.20%0.78%1.65%3.43%45.01%0.00%21.05%19.67%
Note: The percentage represents the land area that was converted divided by the total area of that land type in 2001.
Table 4. Multiple linear stepwise regression analysis between the change of coverage area and the total amount of NPP.
Regression ModelR2FP
NPP = AreaGrass 0.2726 − AreaSavanna 1.004 + AreaCrop 0.777 + AreaBare 0.60240.838.73<0.01
Publisher’s Note: MDPI stays neutral with regard to jurisdictional claims in published maps and institutional affiliations.

