Article

To Mitigate or Adapt? Explaining Why Citizens Responding to Climate Change Favour the Former

by
Kristina Blennow
1,* and
Johannes Persson
2
1
Department of Landscape Architecture, Planning and Management, SLU Alnarp, Swedish University of Agricultural Sciences, 234 22 Lomma, Sweden
2
Department of Philosophy, Lund University, 222 22 Lund, Sweden
*
Author to whom correspondence should be addressed.
Land 2021, 10(3), 240; https://doi.org/10.3390/land10030240
Submission received: 30 December 2020 / Revised: 16 February 2021 / Accepted: 22 February 2021 / Published: 1 March 2021
(This article belongs to the Special Issue Land Use and Climate Change)

Abstract

:
Why do citizens’ decisions made because they favour the mitigation of climate change outnumber those made because they favour adaptation to its impacts? Using data collected in a survey of 338 citizens of Malmö, Sweden, we tested two hypotheses. H1: the motivation for personal decisions because they favour adaptation to the impacts of climate change correlates with the decision-making agent´s knowledge of specific local impacts of climate change, and H2: the motivation for personal decisions because they favour mitigation of climate change correlates with the risk perception of the decision-making agent. While decisions made because they favour mitigation correlated with negative net values of expected impacts of climate change (risk perception), decisions made because they favour adaptation correlated with its absolute value unless tipping point behaviour occurred. Tipping point behaviour occurs here when the decision-making agent abstains from decisions in response to climate change in spite of a strongly negative or positive net value of expected impacts. Hence, the decision-making agents´ lack of knowledge of specific climate change impacts inhibited decisions promoting adaptation. Moreover, positive experiences of climate change inhibited mitigation decisions. Discussing the results, we emphasised the importance of understanding the drivers of adaptation and mitigation decisions. In particular, we stress that attention needs to be paid to the balance between decisions solving problems ‘here and now’ and those focusing on the ‘there and then’.

1. Introduction

Responses to climate change are categorised into two main kinds. Climate change mitigation refers to efforts to stabilise greenhouse gas concentrations in the atmosphere; adaptation, on the other hand, is about adjusting to the (positive or negative) effects of climate change [1]. Studies show that citizens voluntarily deciding in favour of mitigation of climate change outnumber by far citizens voluntarily deciding in favour of adaptation in the same population, e.g., [2]. This difference in citizens´ responses indicates that categorising our responses to climate change into these two kinds is useful. But prima facie, it is not obvious why one kind of response should be more common than the other or why one response should not be an instance of both kinds. After all, if we assume that both are varieties of causal intervention, mitigation and adaptation differ mainly with regard to where in the enormously complicated causal process, we attempt to intervene. Why then would decision-making in favour of mitigation be more common than decision-making in favour of adaptation to climate change?
In a study on the personal motivation driving mitigation and adaptation behaviour, Semenza et al. [2] found motivation for voluntary mitigation to be explained mainly by the risk perception of the decision-making agent. By contrast, the motivation for voluntary adaptation was explained mainly by the agent´s knowledge of climate change impacts. Intuitively, this makes sense for the simple reason that whereas we can assume that the present climatic state is a reasonably well-defined part of the mental models of decision-making agents, the same models may vary considerably in their resolution of the expected downstream effects of climate change. In a recent study, Blennow et al. [3] found strong belief in the local impacts of climate change to be a prerequisite of decision-making favouring adaptation to climate change. This result is consistent with the findings set out in Semenza et al. [2]. Moreover, belief in local impacts of climate change can become stronger with experience of the impacts of climate change (see [4]).
Not all findings point in the same direction as Semenza et al. [2], however. Sometimes mental models of high resolution concerning local effects of climate change seem to discourage adaptation decisions. Blennow et al. [3] found that decisions in favour of adaptation to local impacts of climate change also correlated with the absolute net value of the expected local impacts of climate change unless tipping point behaviour occurred. The tipping-point behaviour in question here occurs when a decision-making agent refrains from taking action even though s(he) expects substantial net negative or net positive value of impacts of climate change [3]. Such behaviour might have many explanations, but a person exhibiting tipping point behaviour believes that the earth (or relevant parts of it) has passed into a new system with uniformly worse or better consequences in the relevant part of the system. For this reason, there is no point in taking measures to adapt. For instance, if tipping-point thinking occurs, we should not expect increased knowledge of climate change impacts to lead to decisions favouring adaptation rather than mitigation.
The theory of rational decision-making relates to adaptation decisions. In it, alternative options are evaluated with respect to their expected utility. A (rational) decision-making agent is expected to decide in favour of adaptation to the expected impacts of climate change, whether positive or negative ([5], and also see [3]). Essentially, the theory tells us that in any given decision situation the rational decision-maker should choose the option with maximal expected utility. However, Blennow et al. [3] found net negative values of expected climate change impacts (risk perception) to be a stronger driver of decisions in favour of adaptation to climate change than net positive values. This result implies that some mechanism producing the asymmetry is operating. It is possible that loss aversion (where decision-makers are more averse to losses than they are attracted to same size gains (see e.g., [6])) or, more obviously, risk aversion (a preference for certain outcomes over uncertain outcomes), applies in certain domains of climate change adaptation decisions. Loss aversion is one of the mechanisms producing the S-shaped utility function known from prospect theory [7].
We are not aware of any similar findings regarding climate mitigation decisions. Two reasons for this can be imagined. First, prospect theory, for instance, was developed to explain decisions made by individuals. Second, the consequences envisaged did not include very longterm effects. But climate mitigation projects have often been evaluated by institutions, and the consequences guiding them are typically long-term and sometimes even intergenerational (e.g., [8]). This is not to deny that prospect theory has at times been applied to collective decision-making, and to individual decision-making in relation to climate change mitigation (e.g., [9]). So far, any robust correlation between net values of expected climate change impacts and decisions promoting mitigation remains to be demonstrated. We conjecture that a (rational) decision-making agent’s expectation of net positive value of climate change impacts inhibits (intentional) decision-making promoting mitigation because mitigation of climate change would reduce the expected benefit. We also conjecture that tipping point behaviour may not only inhibit decisions promoting adaptation to climate change but also, when it is negative, inhibit decisions promoting mitigation of climate change.
Herein, we tested the following hypotheses:
Hypothesis 1.
Motivation for personal decisions in favour of adaptation to the impacts of climate change correlates with the decision-making agent´s knowledge of specific local impacts of climate change (cf. [2]).
Hyphothesis 2.
Motivation for personal decisions in favour of mitigation of climate change correlates with the risk perception of the decision-making agent (cf. [2]).
We used the results of our investigation to identify the communication needs of citizens of Malmö, Sweden, regarding mitigation and adaptation.

2. Materials and Methods

2.1. Data

Data were collected in a survey of citizens living in Malmö, the third biggest city in Sweden and situated in Skåne county. Climate change scenarios for Skåne county indicate that in the future, the climate will be warmer, the growing season will be longer, heatwaves will be more frequent, and the need for domestic heating will reduce. Rising summer temperatures will lead to a somewhat greater need for artificial cooling. Average, as well as extreme, precipitation will also increase, as will wintertime river inflow, and in some places, there will be reduced summertime river inflow, generally reducing the return period of extreme river water flow. There will be a higher number of days with low soil moisture [10]. The sea level in Skåne is expected to rise more relative to the land than it will in other parts of Sweden as a result of low, and locally even negative, land rise [11].
Students on the Master´s level course Climate Change—Landscape in Transition, run at the Swedish University of Agricultural Sciences in Alnarp, approached citizens of different social status (men and women alike) in shopping centres and public spaces and invited them to respond on the spot to an online survey using a tablet. The questionnaire was presented in the open-source LimeSurvey tool [12]. Responses were collected between 27 February and 1 March 2018. Participation was voluntary. The sample appeared to be fairly representative of citizens of middle-sized coastal cities in Southern Sweden.
The survey included 20 questions about the respondent´s beliefs and expectations about climate change and its impacts and about landscape values and socio-demography. Responses to 8 of the 20 questions (totalling 338 complete responses) from the Malmö citizens were used in this study (Table 1) (Table S1).

2.2. Statistical Analysis and Machine Learning Modelling

The Bayesian proportions test was used to test the null hypothesis that the proportions (probabilities of success) in groups were the same (i.e., that we were using a uniform prior distribution) Bayesian robust correlation was used to test the correlation between strength of belief in having experienced the impacts of climate change and decisions in favour either of mitigation or of adaptation [13].
Recent developments in machine learning techniques have improved the modelling of non-linear and complex relationships significantly, e.g., [14]. Bayesian Additive Regression Tree (BART) modelling consisting of additive trees has comparable or better predictive performance than the popular tree-based machine learning techniques random forest and boosting (e.g., [15]). It also imposes a probability model [16,17].
Two univariate BART models modified for classification problems, requiring no prior distribution and with the capacity to identify complex non-linear relationships [17], were fitted to the data to predict the probability of decisions favouring either mitigation or adaptation in response to the impacts of climate change. The fraction of mitigation or adaptation decisions observed was used as the rule for determining if the probability estimate is great enough to be classified into the positive category (see [3]). The variable net value of expected impacts (homogeneity of expected climate change values in [18]) was used in both of the univariate models
n e t   v a l u e   o f   e x p e c t e d   i m p a c t s = n = 1 23 ( a Q 5 + a Q 6 )
where n refers to sub-questions a to x in questions Q5 and Q6 in Table S1 and a = 4 if the response is ‘Yes, always”’ and a = 3 if the response is ‘Often’. Thus, negative and positive scores were assigned to negative and positive net values of expected impacts, respectively. For any other response to these questions, a = 0. The values used to convert valuations expressed in words to numbers were chosen to reflect the number of alternative pre-defined answers to each question (Table 1). As described by Persson et al. [18], the net value of expected impacts was, therefore, a measure of how strongly climate change was expected to have determinately negative or positive impacts on all 23 objects. In this study, the net value of expected impacts ranged from −92 to +92. An individual with a homogeneous set of expected values will expect climate changes always or often to lead either to a negative (net value of expected impacts << zero) or to a positive (net value of expected impacts >> zero) impact on the objects. Those with inhomogeneous values, on the other hand, will expect the impacts to be sometimes determinately negative and sometimes determinately positive, or neither determinately negative nor determinately positive (net value of expected impacts = zero). For example, a person of this kind might expect positive impacts of climate change on the opportunities for outdoor swimming in the summer and, concurrently, negative impacts of climate change in terms of increased beach erosion. In each model, the probability of decisions in favour of climate change action was taken to be the equivalent of the expected utility value of a decision in favour of adaptation or mitigation (cf. [5]).
Five-fold cross-validation was used for optimal tuning of the model parameters by selecting the model with the lowest out-of-sample root mean square error [17].
All analyses were conducted using the R Project for Statistical Computing v4.0.3 [19] using the bartMachine package [7] and the Bayesian First Aid package [13]. All of the statistical tests were made in the Bayesian statistical framework using a 90% credible interval (CI).

3. Results

Most respondents held positive and/or negative local impacts of climate change to be probably or definitely true (p = 0.96; 90% CI (0.94−0.98)) (Q1 and Q2 in Table 1 and Table S1). It was also found that decisions in favour of mitigation outnumbered those in favour of adaptation to the impacts of climate change (Q7 and Q8 in Table 1). While only one in five had decided in favour of adaptation, four in five had decided in favour of mitigation (Table S1).

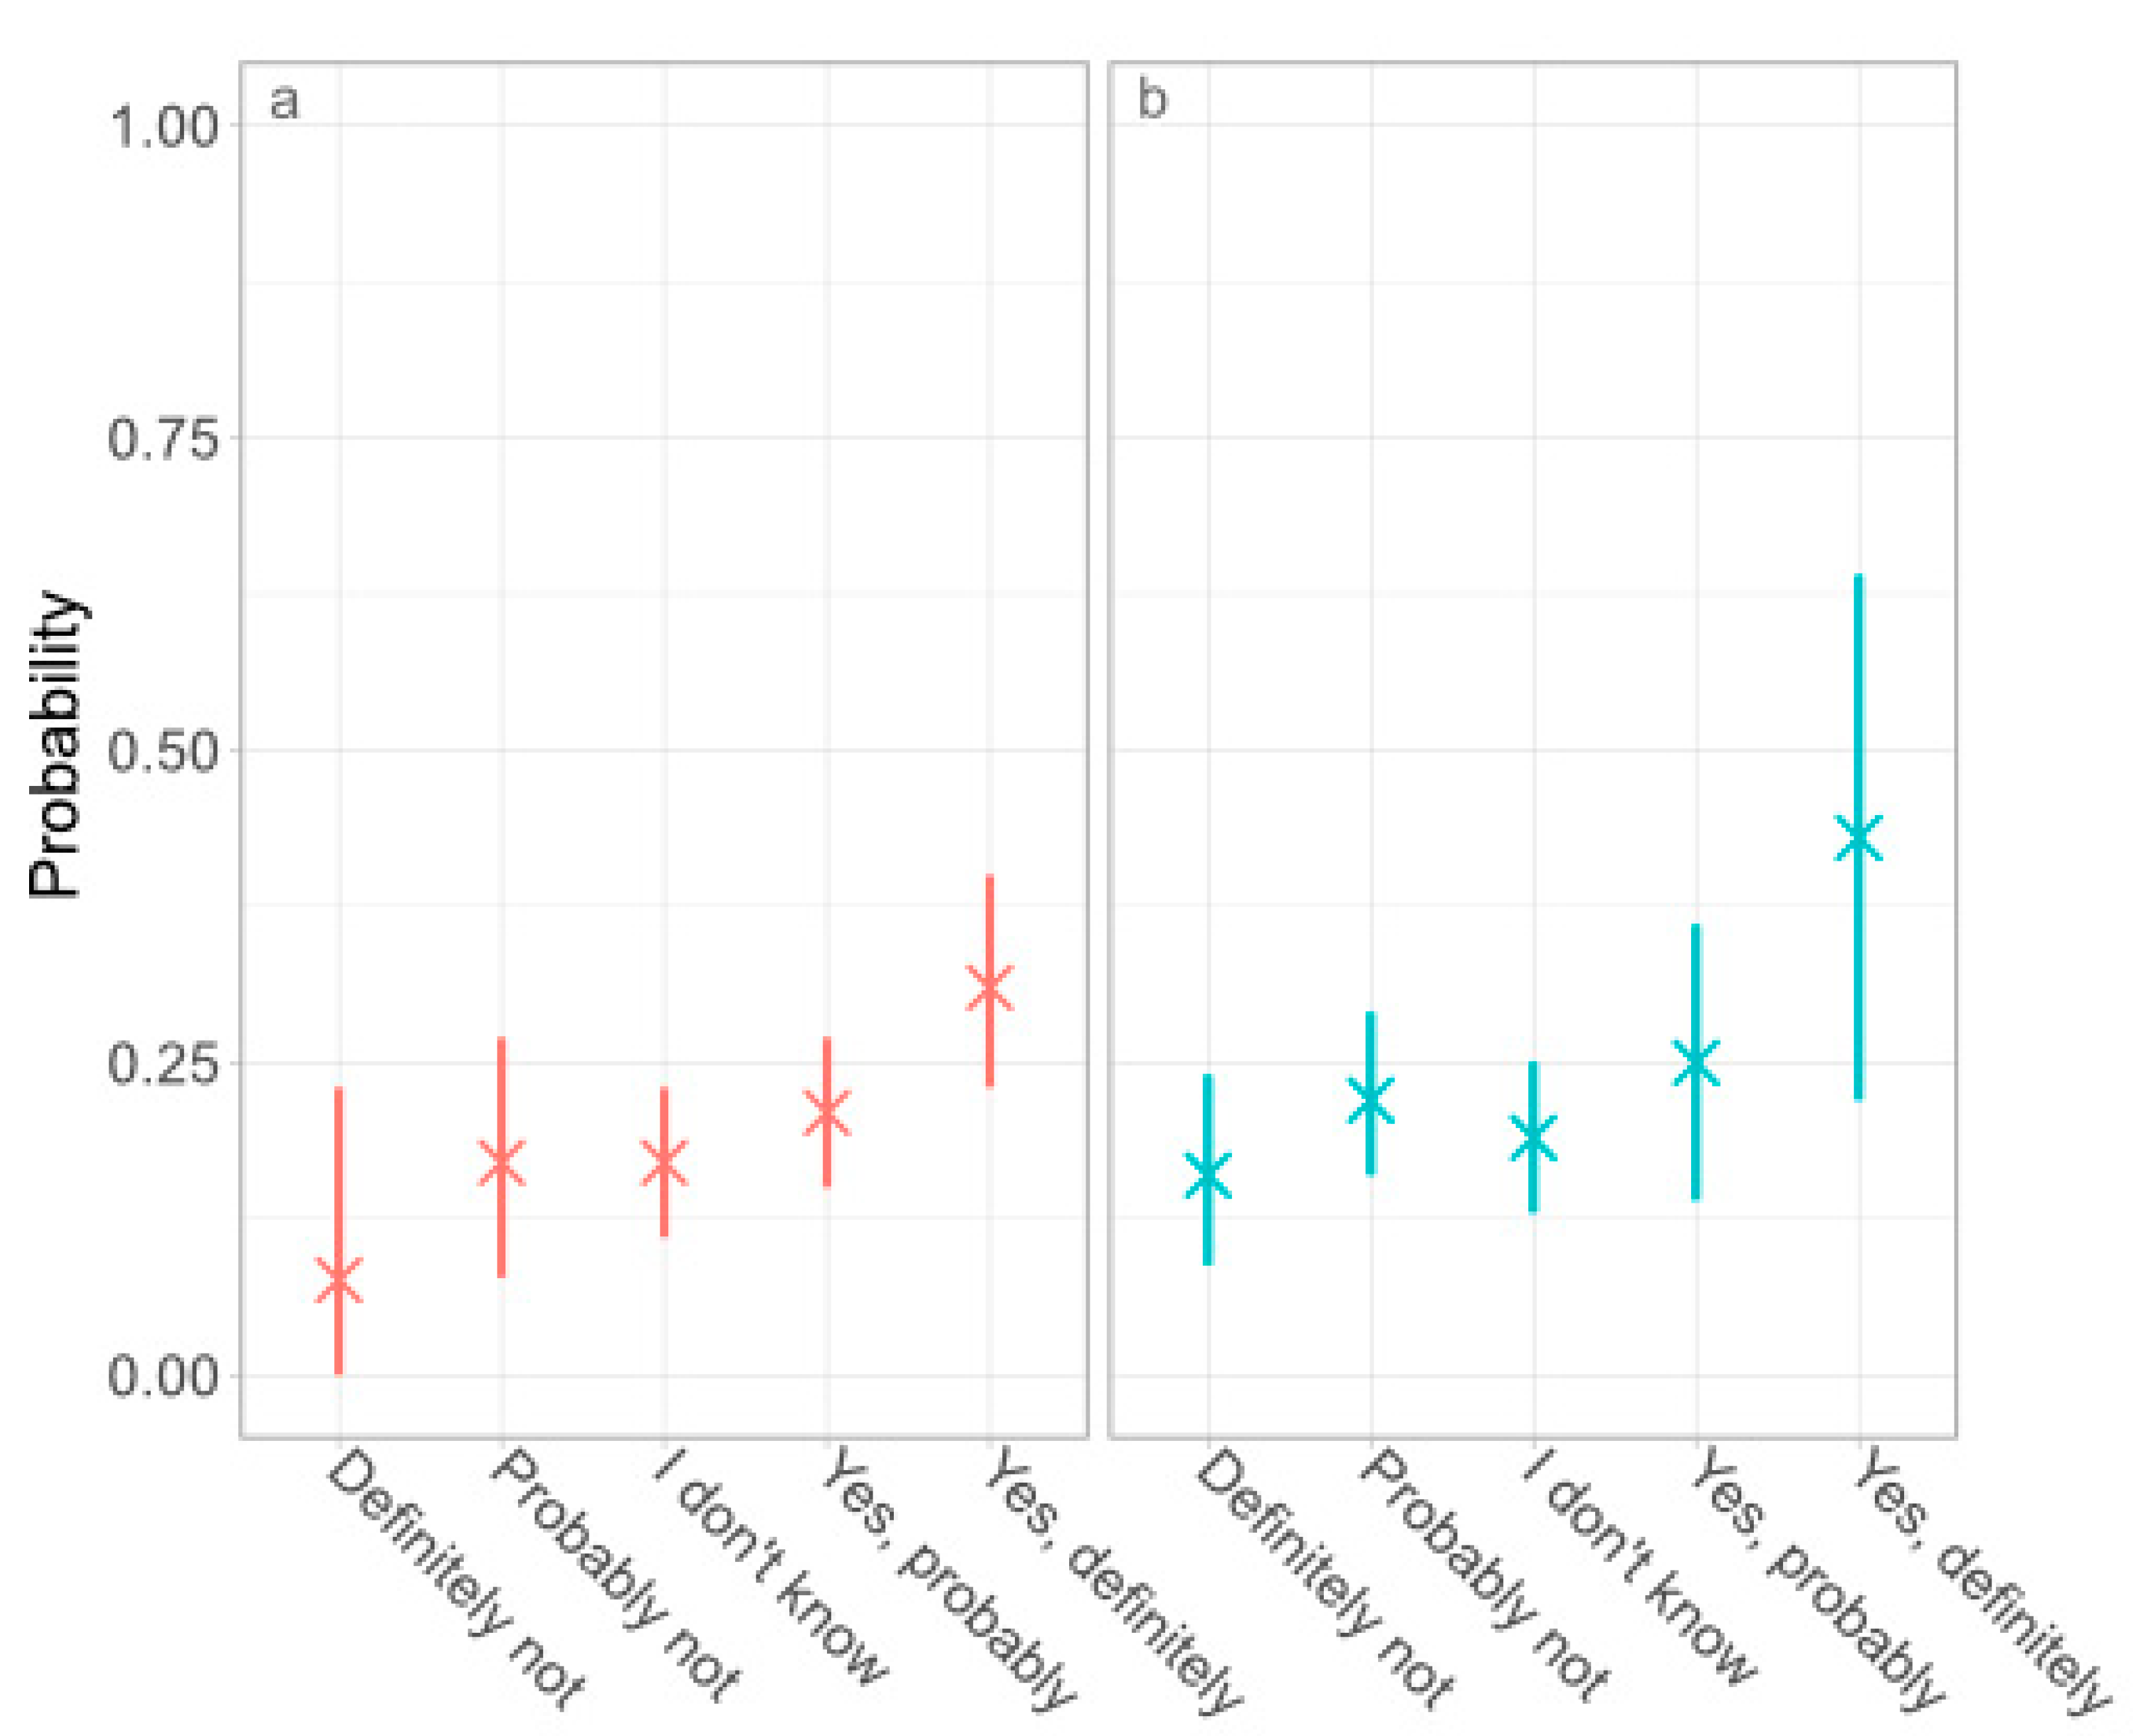
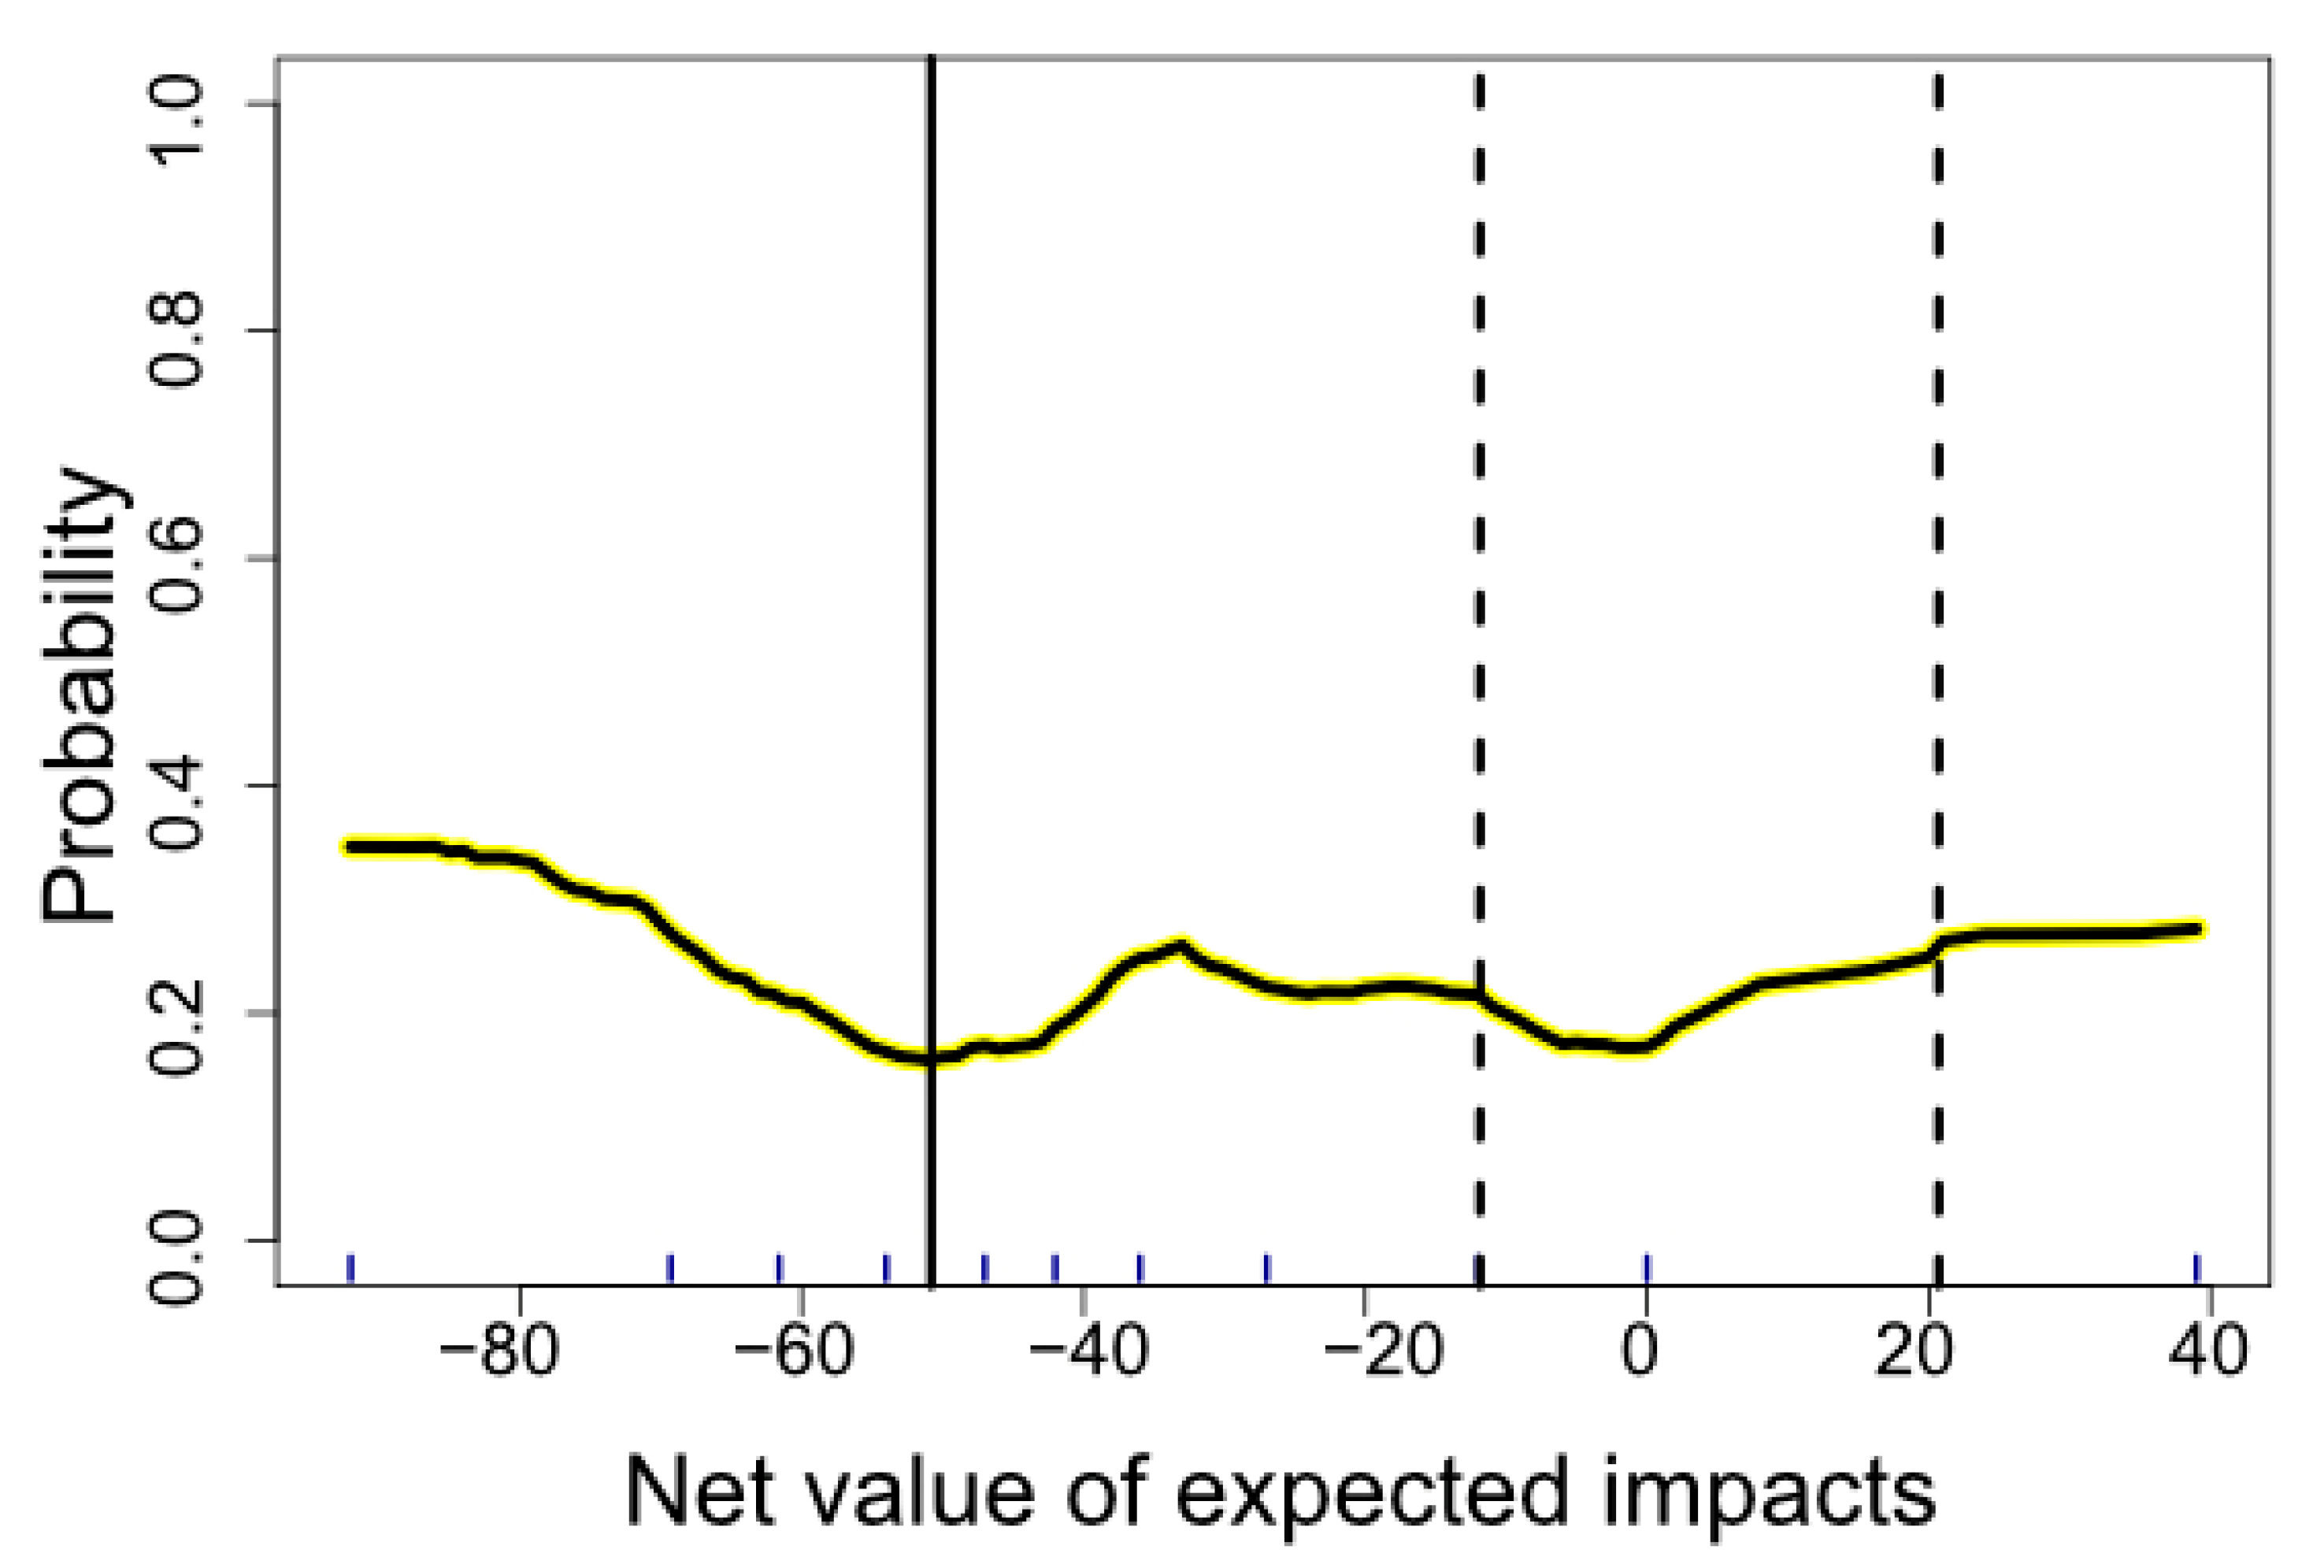
3.1. H1: Motivation for Personal Decisions Because They Favour of Adaptation to the Impacts of Climate the Change Correlates with the Decision-Making Agent´s Knowledge of Specific Local Impacts of Climate Change

Three empirical consequences of H1 were tested: (1a) decisions made because they favour adaptation to climate change correlate positively with strength of belief that one has experienced negative impacts of climate change; (1b) decisions made because they favour adaptation to climate change correlate positively with strength of belief that one has experienced positive impacts of climate change; and (1c) decisions made because they favour adaptation to the impacts of climate change are made in response to net negative as well as net positive expected impacts of climate change unless tipping-point behaviour occurrs (cf. [2]).
We found decisions made because they favour adaptation to climate change to be positively correlated with strength of belief that one has experienced negative as well as positive impacts of climate change (Figure 1). A BART model based on the net value of expected impacts predicted decisions made because they favour adaptation with a misclassification error of 13.9% (Figure S1), which was somewhat above the 10% limit accepted in this study. Nevertheless, a trend could be seen by which the equivalent of the expected utility function for decisions favouring adaptation generally increased with increasing absolute net value of expected impacts (Figure 2 and Figure S1). At the negative extreme of the net value of expected impacts range, the model predicted that one in three citizens would have taken measures to adapt to the impacts of climate change, while at the positive extreme of the range, it predicted only that approximately one in four citizens would have done so (Figure 2). In addition to low expected utility at net values of expected impacts close to zero, a local minimum was identified at a net value of expected impacts of −51. A levelling out of the equivalent of the expected value curve below approximately −12 meant that sometimes decisions promoting adaptation were not taken in spite of a net value of expected impacts lower than this value. This indicates tipping point behaviour. However, below a net value of expected impacts of −51, the utility expected from decisions promoting adaptation increased. This can be interpreted as two varieties of this behaviour were seen. Correspondingly, a breakpoint for positive tipping point behaviour was inserted at +21. Negative as well as positive tipping point behaviour was identified (Figure 2) (Table 2).

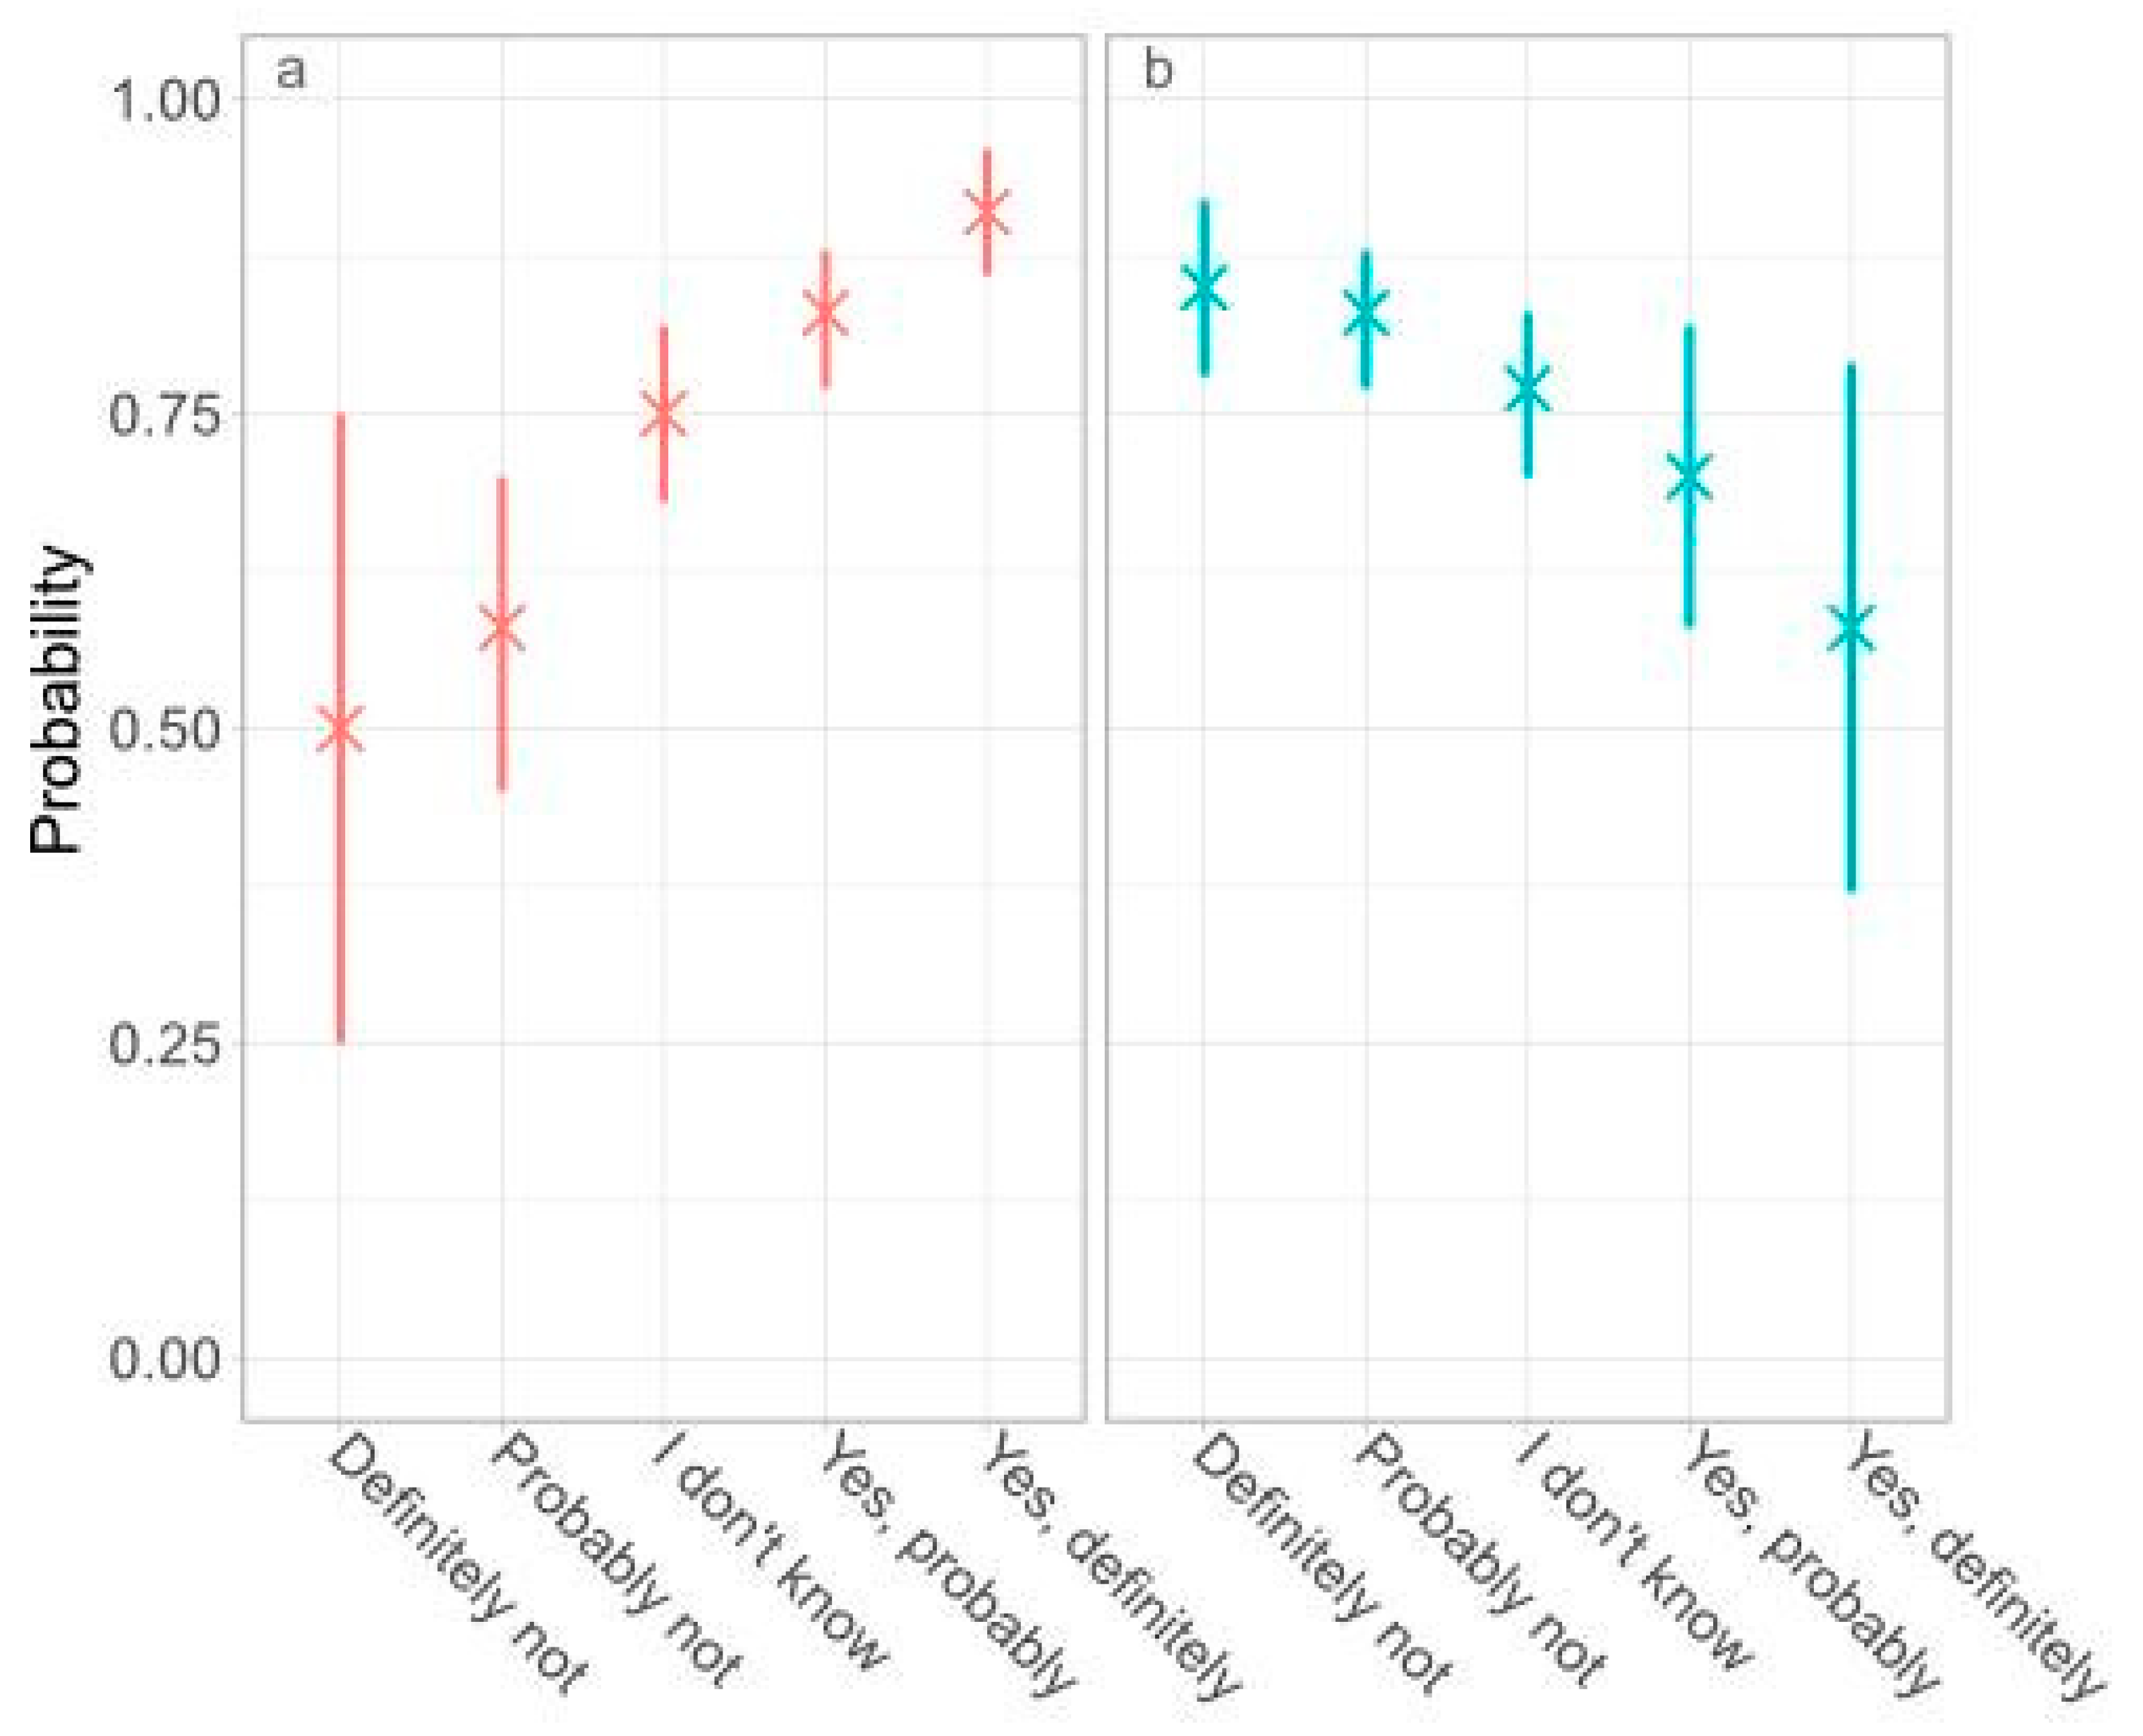
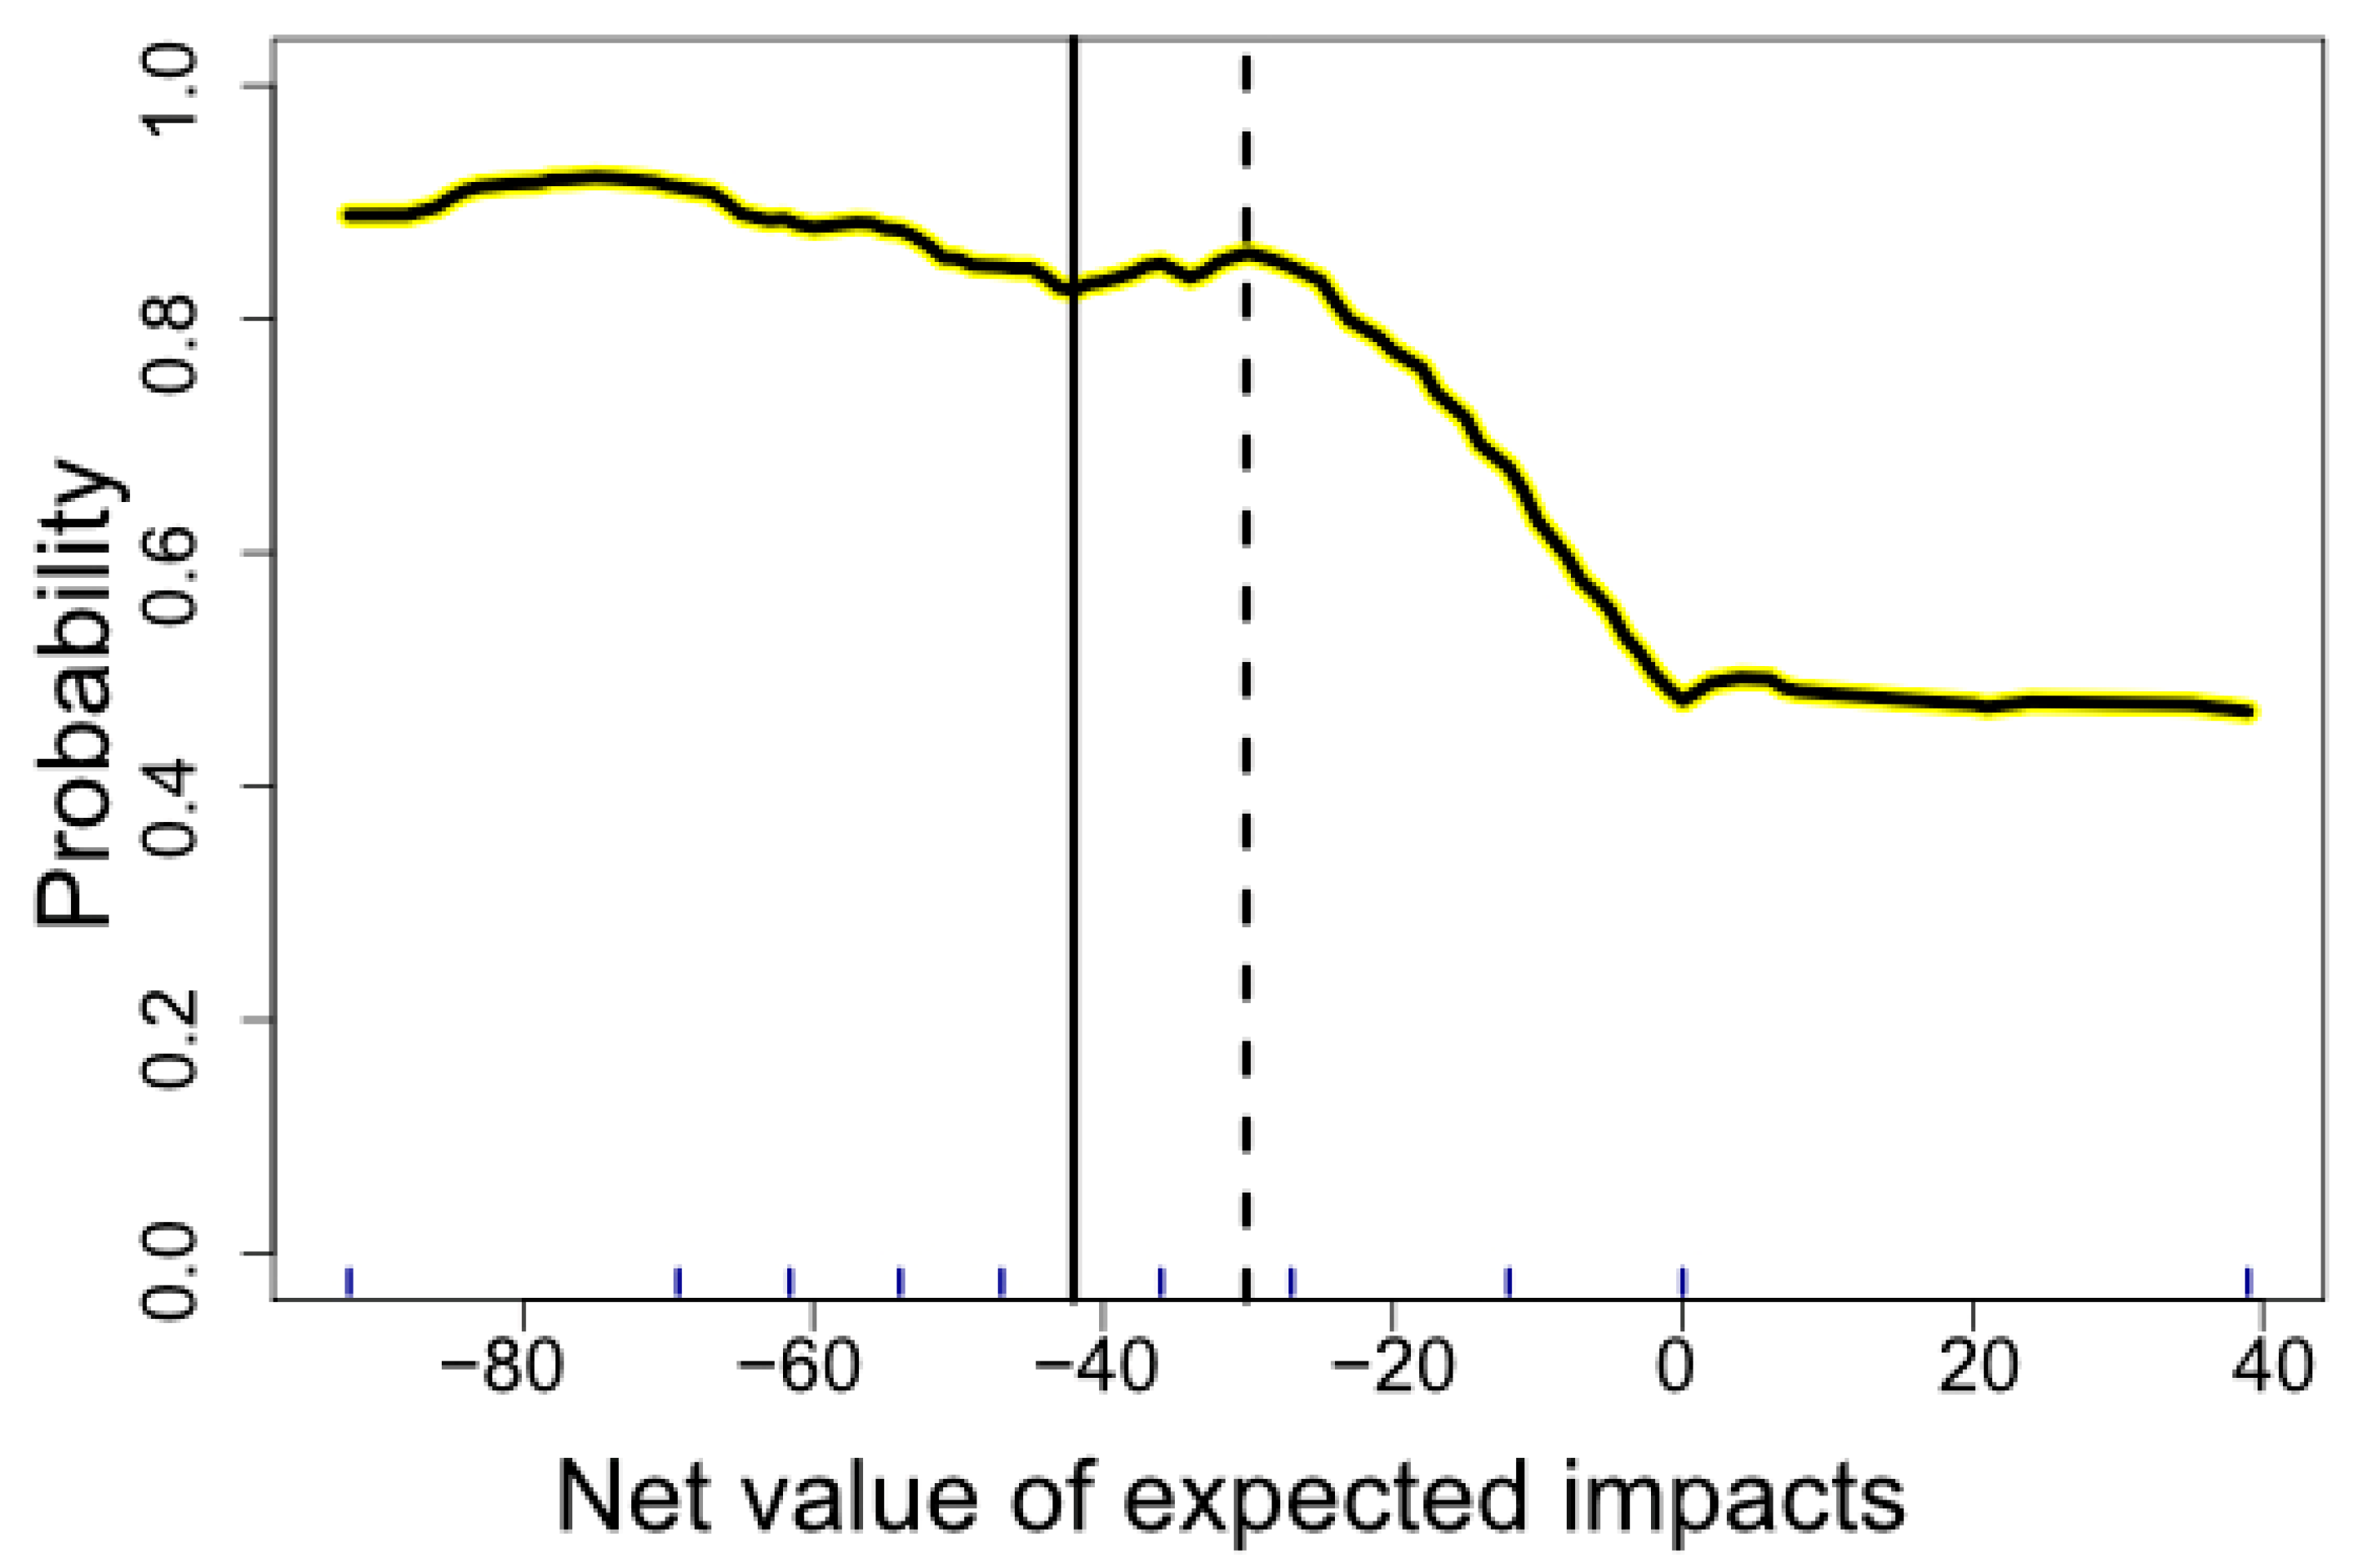
3.2. H2: Motivation for Personal Decisions Because They Favour Mitigation of Climate Change Correlates with the Risk Perception of the Decision-Making Agent

Four empirical consequences of H2 were tested: (2a) decisions made because they favour mitigation to climate change correlate positively with strong beliefs that one has experienced negative impacts of climate change; (2b) decisions were made because they favour mitigation to climate change correlate negatively with strong beliefs that one has experienced positive impacts of climate change; (2c) decisions were made because they favour mitigation to climate change were more common among those with net negative value of expected impacts of climate change than among those with the net positive value of expected impacts of climate change; and (2d) negative tipping point behaviour occurred in decision-making promoting mitigation of climate change.
We found that decisions made because they favour mitigation to climate change were indeed correlated positively with the strong beliefs that one had experienced negative impacts of climate change and negatively with the strong beliefs that one had experienced positive impacts of climate change (Figure 3). A BART model predicted decisions made because they favour mitigation of climate change with high accuracy (Figure S2). In the model, the equivalents of the expected utility function generally increased with increasingly net negative values of expected impacts (Figure 4 and Figure S2). At the negative extreme of the net value of expected impacts range, the model predicted that six in seven citizens would have taken measures to mitigate climate change, while at the positive extreme of the range, it predicted that only approximately one in two citizens would have done so (Figure 4). Decisions made because they favour mitigation of climate change correlated with climate change risk perception in a Bayesian test of proportions (Table 3). Negative tipping point behaviour was, furthermore, observed (Figure 4) (Table 2).

4. Discussion

Like the study conducted by Semenza et al. [2], the present study confirmed that decisions made because they favour the mitigation of climate change outnumbered those made because they favour adaptation in the same population (Table S1). Why is this? It is not as if every acknowledged difference between mitigation and adaptation (see, e.g., [8]) gives us reason to expect such a result. For instance, although adaptation and mitigation can be implemented on the same local scale, mitigation has been conceived as having global benefits and adaptation, typically, as having local benefits. Similarly, given the long residence time of greenhouse gases in the atmosphere, many would agree that mitigation’s global benefits will normally be evidenced considerably later than those of adaptation. Indeed, Article 4.7 of the Paris Agreement states that ‘Mitigation co-benefits resulting from Parties’ adaptation actions and/or economic diversification can contribute to mitigation outcomes under this Article’, but not vice versa [20]. Since many, if not most, of the climate change impacts that are expected to emerge, will do so in future decades and even centuries, these findings are important. It should be noted that in line with [18], the present study was only concerned with intentional adaptation and mitigation and that there might be unintentional causal interaction between adaptation and mitigation behaviours which the respondents did not take into account (but which, for instance, societal institutions are well aware of [8]). With this qualification in mind, was it to be expected that citizens of Malmö would favour decision-making promoting global (rather than local) and temporally distant (rather than more immediate) benefits?
Previous studies have found that strong belief in local impacts of climate change is a necessary, but not sufficient, condition of decision-making in favour of climate change and that the belief may be fortified further by experiences of the impacts of climate change [3,4]. In the present study, most respondents believed in the local impacts of climate change, but only one in five had taken measures to adapt to them (Table S1). Decisions made because they favoured adaptation to the impacts of climate change correlated positively with the strength of belief in both negative and positive experiences of impacts of climate change (Figure 1). This indicates that experience of negative and experience of positive impacts of climate change can promote decisions in favour of adaptation. In a study by Blennow et al. [3], which was based on a larger sample size than this study, the net value of expected impacts predicted decisions made because they favour adaptation to the impacts of climate change with high accuracy, when used as a covariate in a BART model. The pattern along the range of net expected values in the present study is similar to that in the study by Blennow et al. [3], but the predictive power of the BART model was somewhat lower in the present study. Nevertheless, a trend of increasing adaptation with its absolute value was observed unless tipping point behaviour occurred (Figure 2). Strong positive as well as negative values of expected impacts of climate change indicate knowledge of the specific causal consequences of climate change for the environment, and therefore H1, which states that motivation for personal decisions because they favour adaptation to the impacts of climate the change correlates with the decision-making agent´s knowledge of specific local impacts of climate change, was corroborated.
In the present study, two varieties of negative tipping point behaviour were identified (Figure 2 and Figure 4). Uniformly worse (or better) consequences than the present might be understood in two ways. First, it might be understood in the sense that whatever humankind do, the consequences will be worse (or better) than if we had done whatever it is that we do before passing the tipping point. We refer to this as ‘systemic’ tipping point thinking. The local minimum in the estimated probability of decisions in favour of adaptation observed at moderately negative net values of expected impacts of climate change (Figure 2) corresponds to a local minimum on the equivalent of the expected utility curve observed in a study on decisions in favour of adaptation to climate change among European forest professionals [3]. In that study, the local minimum correlated with just a few measures for adaptation perceived by the decision-making agents as effective. Data on the perceived effectiveness of adaptation measures were not available in the present study, so the hypothesis stating that lack of effective adaptation measures explains the local minimum could not be tested here. But if corroborated, it would indicate that the increase in the curve below −51 in the present study occurred because some citizens had decided in favour of adaptation even without effective adaptation measures that were perceived to be available. If that is so, those with a net value of expected impacts of climate change below −51 and who did not decide in favour of adaptation thought that the climate system (or relevant parts of it) had passed a tipping point, see [3]. In the new system, for them, nothing would be gained from decisions in favour of adaptation. We call this kind of tipping point behaviour ‘systemic tipping point behaviour’.
Second, our conception of risk is also tied to our own decision-making options and their expected consequences (e.g., [21]). When a systemic tipping point is passed, many negative consequences are certain—they are the same whatever I decide to do, and they do in that sense not belong to the context of risk any longer. In such cases, one does not take risks; one merely runs or will be exposed to them [22]. However, with some of the risks, ‘one merely runs’, could be managed by society. The levelling out of the curve below a net value of expected impacts of climate change of approximately −12 for decisions made because they favour adaptation to climate change indicates that tipping point behaviour of this kind can take place below this value (Figure 2). We call this kind of tipping point behaviour ‘decision maker’s tipping point beaviour’. Such deviation from loss aversion has been reported before (e.g., [23]).
With respect to positive tipping point behaviour, the levelling out of the curve above a net value of expected impacts of climate change of approximately +21 might be taken to indicate that the citizens were satisfied under the changed conditions and that, as a result, they did not decide in favour of adaptation to climate change (Figure 2, cf. [24]). Hence, they displayed decision maker’s tipping point behaviour. However, it can also be interpreted as an indication that the citizens believed that a climatic tipping point had indeed been passed, introducing an altogether better system, in which case the utility expected from decisions in favour of climate change adaptation would be less. On this second reading, systemic tipping point behaviour might have taken place. However, this hypothesis could not be tested with the data available in the present study. Satisficing [8], and positive systemic tipping point behaviour, as well as other psychological mechanisms, might explain the data.
Like decisions favouring adaptation to the impacts of climate change, decisions in favour of mitigation of climate change correlated with the strength of belief that one has experienced negative and positive impacts of climate change (Figure 3). However, the correlation for negative experiences was positive, but the correlation for positive experiences was negative. This indicates that while experience of negative impacts of climate change promoted decisions in favour of mitigation, positive impacts of climate change inhibited them. Like decisions made because they favour adaptation to climate change in the study by Blennow et al. [3], decisions made because they favour mitigation correlated with the net value of expected impacts (Figure 4). However, they increased only with the negative, not the positive, net value of expected climate change impacts, unless tipping point behaviour occurred (Figure 4). Indeed, decisions made because they favour mitigation to climate change were more common among those with net negative value of expected impacts of climate change (risk perception) than they were among those with net positive value of expected impacts of climate change (Table 3). Since negative tipping point behaviour was also observed (Figure 4) (Table 2), H2, which states that motivation for personal decisions made because they favour mitigation of climate change correlates with the risk perception of the decision-making agent, was corroborated.
Plainly, if mitigation decisions are triggered by experiences of negative local climate change impacts but are, in fact, interventions with consequences that are, relatively speaking, temporally distant and global, we have a problem. Since mitigation decisions taken now are so important for future agents, the aim should not be to decrease their number—even if they might be the wrong response to the decision maker’s present problem. But if they replace suitable adaptation decisions, there is a real problem. To illustrate: If a climate change mitigation decision is always “a human intervention to reduce emissions or enhance the sinks of greenhouse gases” [25] (pp. 554), mitigation is clearly the wrong solution to the risks of flooding in Malmö 2020–2030. To manage the risk of flooding during the current decade, an adaptation decision is required according to the definition. Ideally, of course, an adaptation decision that is also a human intervention to reduce emissions or enhance the sinks of greenhouse gases is preferable. The problem is amplified if, in addition, mitigation decisions are inhibited by the experience of positive local climate change impacts. Communication strategies to circumvent this problem are essential. Since, unfortunately, in climate change discourse, mitigation and adaptation have been conceptualised as different kinds of endeavour—partly for historical reasons (see e.g., [26])—such strategies must be grounded in what we find drives and inhibits adaptation and mitigation, as currently defined. Therefore, it is important to develop communications guidelines that facilitate decisions aligning more closely with the needs of current and future agents.
Our findings suggest the following guidelines:
Individuals
  • Lacking a strong belief that they have experienced impacts of climate change need communications that strengthen that belief. Communications strengthening negative, as well as positive experiences of climate change, promote adaptation decisions, while communications strengthening only negative and not positive experiences of climate change, promote mitigation decisions.
  • Lacking knowledge of climate change impacts need communications on the causal connections between climate change and its specific impacts on the (local) environment. Communications on causal connections creating negative as well as positive impacts of climate change tend to favour adaptation decisions, while communications on causal connections, creating only negative and not positive impacts, tend to favour mitigation decisions.
  • Exhibiting tipping point behaviour require communications on effective measures for climate change response. Where individuals exhibiting tipping point behaviour are concerned, communications on effective measures in response to negative as well as positive impacts of climate change tend to favour adaptation decisions, while only communications on effective measures in response to negative impacts of climate change can favour mitigation decisions.
  • Exhibiting systemic tipping point behaviour require communications on whether the earth (or the relevant parts of the system) has reached a tipping point.

5. Conclusions

Climate change policies need to reflect the fact that strong belief in local impacts of climate change is a necessary, but not sufficient, condition of intentional mitigation and adaptation decisions. The study found that decision-making agents’ strength of belief in having experienced local impacts of climate change correlate with decisions in favour of mitigation as well as adaptation to the impacts of climate change. But, whereas negative as well as positive experiences promoted adaptation decisions, only negative experiences promoted mitigation decisions. Positive experiences of climate change inhibited them. Moreover, decisions in favour of mitigation of climate change correlate with the net negative expected impacts (risk perception) of the decision-making agents, and decisions in favour of adaptation to the impacts of climate change correlate with net negative as well as net positive expected impacts of climate change unless tipping point behaviour occurs. While decisions in favour of greenhouse gas emission reduction always help mitigate climate change, decisions in favour of adaptation to the impacts of climate change require more specific knowledge. The decision-making agents’ lack of knowledge on the specific impacts of climate change thus provides a plausible explanation of why citizens´ decisions made because they favour adaptation to the impacts of climate change are outnumbered by those made because they favour mitigation of climate change.
Communications on the specific positive or negative local climate change impacts can thus strengthen citizens’ propensity to decide in favour of adaptation to climate change, whereas their propensity to decide in favour of mitigation can be strengthened by communications on negative local impacts of climate change only (and by information that weakens a perceived but mistaken link between climate change and a positive event, categorised by the agent as an impact of climate change). However, for those with tipping point behaviour, communications need to focus on effective measures for adaptation unless they display systemic tipping point behaviour, in which case they need communications on whether the earth or the relevant part of the system has reached a tipping point or not. Mitigation of global and long-term climate change correlated with experiences of local impacts, hence, calls for policies, including communication strategies, that take this new knowledge into consideration when developing policies for here and now as well as there and then.

Supplementary Materials

The following are available online at https://www.mdpi.com/2073-445X/10/3/240/s1, Figure S1: Convergence diagnostics and test of covariate importance for a BART model of the probability of having decided in favour of adaptation (taken as the equivalent of the expected value of the utility of adaptation), Figure S2: Convergence diagnostics and test of covariate importance for a BART model of the probability of having decided in favour of mitigation (taken as the equivalent of the expected value of the utility of mitigation), Table S1: Responses to survey questions by response level split between those who has/has not decided in favour of adaptation and mitigation of climate change, respectively, Table S2: Model errors of univariate BART models of decisions in favour of adaptation to the impacts of climate change and mitigation of climate change, respectively.

Author Contributions

Conceptualisation, K.B. and J.P.; methodology, K.B. and J.P.; software, K.B.; validation, K.B. and J.P.; formal analysis, K.B.; investigation, K.B.; resources, K.B.; data curation, K.B.; writing—original draft preparation, K.B. and J.P.; writing—review and editing, J.P. and K.B.; visualisation, K.B.; supervision, K.B.; project administration, K.B.; funding acquisition, K.B. and J.P. All authors have read and agreed to the published version of the manuscript.

Funding

The research was supported by The Swedish Energy Agency, grant number 45808-1 (to K.B.) and The Swedish Foundation for Humanities and Social Sciences, grant number M14-0138:1 (to J.P.).

Institutional Review Board Statement

Ethical review and approval were waived for this study due to no questions on sensitive personal information being included.

Informed Consent Statement

Informed consent was obtained from all subjects involved in the study.

Data Availability Statement

The data can be accessed by anyone with a legitimate interest in it, to the extent that the transfer of data is in accordance with the Swedish and European regulation on data protection. Requests should be addressed to the Swedish University of Agricultural Sciences via [email protected].

Acknowledgments

All respondents to the questionnaire are gratefully acknowledged for their participation. Also, the students in the 2018 course Climate Change—Landscape in Transition at the Swedish University of Agricultural Sciences in Alnarp are gratefully acknowledged for agreeing to let us use the data they had collected.

Conflicts of Interest

The authors declare no conflict of interest. The funders had no role in the design of the study; in the collection, analyses, or interpretation of data; in the writing of the manuscript, or in the decision to publish the results.

References

  1. Bede, A.; van der Linden, P.; Verbruggen, A. Annex II: Glossary. In Climate Change 2007: Synthesis Report; Pauchari, R., Reisinger, A., Eds.; Intergovernmental Panel on Climate Change: Geneva, Switzerland, 2007; pp. 76–99. [Google Scholar]
  2. Semenza, J.C.; Ploubidis, G.B.; George, L.A. Climate change and climate variability: Personal motivation for adaptation and mitigation. Environ. Health 2011, 10, 46. [Google Scholar] [CrossRef] [PubMed] [Green Version]
  3. Blennow, K.; Persson, J.; Goncalves, L.; Borys, A.; Dutca, I.; Hynynen, J.; Janeczko, E.; Lyubenova, M.; Merganic, J.; Merganicova, K.; et al. The role of beliefs, expectations and values in decision-making favoring climate change adaptation: Implications for communications with European forest professionals. Environ. Res. Lett. 2020, 15, 114061. [Google Scholar] [CrossRef]
  4. Blennow, K.; Persson, J.; Tomé, M.; Hanewinkel, M. Climate change: Believing and seeing implies adapting. PLoS ONE 2012, 7, e50181. [Google Scholar] [CrossRef] [PubMed] [Green Version]
  5. Von Neumann, J.; Morgenstern, O. The Theory of Games and Economic Behavior; Princeton University Press: Princeton, NJ, USA, 1944. [Google Scholar]
  6. Rabin, M. Psychology and Economics. J. Econ. Lit. 1998, 36, 11–46. [Google Scholar]
  7. Tversky, A.; Kahneman, D. Advances in Prospect Theory: Cumulative Representation of Uncertainty. J. Risk Uncertain. 1992, 5, 297–323. [Google Scholar] [CrossRef]
  8. Klein, R.J.T.; Schipper, E.L.F.; Dessai, S. Integrating mitigation and adaptation into climate and development policy: Three research questions. Environ. Sci. Policy 2005, 8, 579–588. [Google Scholar] [CrossRef]
  9. Oberghaus, D. Prospect theory, mitigation and adaptation to climate change. J. Risk Res. 2017, 20, 909–930. [Google Scholar] [CrossRef]
  10. Ohlsson, A.; Asp, M.; Berggren-Clausen, S.; Berglöv, G.; Björck, E.; Johnell, A.; Mårtensson, J.A.; Nylén, L.; Persson, H.; Sjökvist, E. Framtidsklimat i Skåne län—Enligt RCP-Scenarier; Klimatologi Nr. 29, Swedish Meteorological Institute: Norrköping, Sweden, 2015. [Google Scholar]
  11. Nerheim, S.; Schöld, S.; Persson, G.; Sjöström, Å. Framtida Havsnivåer i Sverige; Klimatologi Nr. 48, Swedish Meteorological Institute: Norrköping, Sweden, 2017. [Google Scholar]
  12. LimeSurvey Project Team. LimeSurvey: An Open Source Survey Tool; LimeSurvey Project: Hamburg, Germany, 2016; Available online: www.limesurvey.org (accessed on 25 January 2018).
  13. Bååth, R. Bayesian first aid: A package that implements Bayesian alternatives to the classical * .test functions in R. In Proceedings of the UseR! 2014—the Int. R User Conf., Los Angeles, California, USA, 30 June–3 July 2014. [Google Scholar]
  14. Shalev-Shwartz, S.; Ben-David, S. Understanding Machine Learning: From Theory to Algorithms, 1st ed.; Cambridge University Press: New York, NJ, USA, 2016. [Google Scholar]
  15. Kern, C.; Klausch, T.; Kreuter, F. Tree-based machine learning methods for survey research. Surv. Res. Methods 2019, 13, 73–93. [Google Scholar] [PubMed]
  16. Chipman, H.A.; George, E.I.; McCulloch, R.E. BART: Bayesian additive regression trees. Ann. Appl. Stat. 2010, 4, 266–298. [Google Scholar] [CrossRef]
  17. Kapelner, A.; Bleich, J. Bartmachine: Machine learning with Bayesian additive regression trees bartmachine: Machine learning with Bayesian additive regression trees. J. Stat. Softw. 2016, 70, 1–40. [Google Scholar] [CrossRef] [Green Version]
  18. Persson, J.; Blennow, K.; Gonçalves, L.; Borys, A.; Dutcă, I.; Hynynen, J.; Janeczko, E.; Lyubenova, M.; Martel, S.; Merganic, J.; et al. No polarization–Expected Values of Climate Change Impacts among European Forest Professionals and Scientists. Sustainability 2020, 12, 2659. [Google Scholar] [CrossRef] [Green Version]
  19. R Core Team. R: A Language and Environment for Statistical Computing; R Foundation for Statistical Computing: Vienna, Austria, 2020. [Google Scholar]
  20. United Nations. Paris Agreement. Available online: Sustainabledevelopment.un.org/content/documents/17853paris_agreement.pdf (accessed on 24 January 2021).
  21. Luhmann, N. Risk: A sociological Theory; de Gruyter: New York, NJ, USA, 1993. [Google Scholar]
  22. Persson, J. Risker i Kunskapens Mellanrum; Nya Doxa: Nora, Sweden, 2007. [Google Scholar]
  23. Wakker, P. Testing and Characterizing Properties of Nonadditive Measures through Violations of the Sure-Thing Principle. Econometrica 2001, 69, 1039–1059. [Google Scholar] [CrossRef] [Green Version]
  24. Simon, H.A. A behavioral model of rational choice. Quart. J. Econ. 1955, 69, 99–118. [Google Scholar] [CrossRef]
  25. Masson-Delmotte, V.; Zhai, P.; Pörtner, H.-O.; Roberts, D.; Skea, J.; Shukla, P.R.; Pirani, A.; Moufouma-Okia, W.; Péan, C.; Pidcock, R.; et al. (Eds.) Annex I: Glossary. In Global Warming of 1.5 °C. An IPCC Special Report on the Impacts of Global Warming of 1.5°C Above Pre-Industrial Levels and Related Global Greenhouse Gas Emission Pathways, in the Context of Strengthening the Global Response to the Threat of Climate Change, Sustainable Development, and Efforts to Eradicate Poverty; Intergovernmental Panel on Climate Change: Geneva, Switzerland, 2018; pp. 542–562. [Google Scholar]
  26. Biesbroek, G.R.; Swart, R.J.; van der Knaap, W.G.M. The mitigation-adaptation dichotomy and the role of spatial planning. Habitat Int. 2009, 33, 230–237. [Google Scholar] [CrossRef]
Figure 1. Adaptation by the experience of climate change. Estimated probability of decision-making favouring adaptation to climate change by strength of belief that one has experienced impacts of climate change: (a) negative experience (Bayesian robust correlation ρ = 0.83; 95.6% probability of a positive correlation) and (b) positive experience (Bayesian robust correlation ρ = 0.66; 90.4% probability of a positive correlation) of climate change impacts (Q3, Q4, and Q7 in Table 1).
Land 10 00240 g001
Figure 2. The equivalent of expected utility from decisions in favour of adaptation. A BART model was constructed for the probability of decision-making promoting adaptation based on the net value of expected impacts. Probabilities were taken as equivalents of the utility expected from decisions in favour of adaptation (see Figure S1 and Table S2). Breakpoints for negative tipping point behaviour of two kinds are shown as lines below which the two kinds of tipping point behaviour can occur. ‘Decision maker´s tipping point behaviour’ is shown as a dashed line and ‘Systemic tipping point behaviour’ as a full line.
Land 10 00240 g002
Figure 3. Mitigation by the experience of climate change. Estimated probability of decision-making favouring mitigation of climate change by the strength of belief that one has experienced impacts of climate change: (a) negative experience (Bayesian robust correlation (ρ = 0.95; 98.9% probability of a positive correlation) and (b) positive experience (Bayesian robust correlation ρ = −83.9; 96.9% probability of a negative correlation) of climate change impacts (Q3, Q4, and Q8 in Table 1).
Land 10 00240 g003
Figure 4. The equivalent of expected utility from decisions in favour of mitigation. A BART model of the probability of decision-making promoting climate change mitigation based on the net value of expected climate change impacts was constructed. Probabilities were taken as the equivalents of the utility expected from decisions in favour of mitigation (see Figure S2 and Table S2). Breakpoints for negative tipping point behaviour of two kinds are shown as lines below which tipping point behaviour can occur. ‘Decision maker´s tipping point behaviour’ is shown as a dashed line, and ‘Systemic tipping point behaviour’ is shown as a full line.
Land 10 00240 g004
Table 1. Short versions of the questions analysed.
NumberQuestionResponse Option
1Do you believe that the climate is changing because of human causes to the extent that it will affect you and/or your environment negatively?Yes, definitely
Yes, probably
I do not know
Probably not
Definitely not
2Do you believe that the climate is changing because of human causes to the extent that it will affect you and/or your environment positively?Yes, definitely
Yes, probably
I do not know
Probably not
Definitely not
3Have you experienced sudden extreme situations or gradual changes occurring in the municipality, with negative impacts, which you interpret as caused by long-term and global climate change?Yes, definitely
Yes, probably
I do not know
Probably not
Definitely not
4Have you experienced sudden extreme situations or gradual changes occurred in the municipality, with positive impacts, which you interpret as caused by long-term and global climate change?Yes, definitely
Yes, probably
I do not know
Probably not
Definitely not
5Do you expect long-term and global climate changes to lead to negative impacts in Malmö: applied to 23 relevant objects a.Yes, always
Often
Rarely
No, never
I do not know b
6Do you expect long-term and global climate changes to lead to positive impacts in Malmö on: applied to 23 relevant objects a.Yes, always
Often
Rarely
No, never
I do not know b
7Have you adopted any measures involving climate change adaptation? Examples include getting a fan in case of a heat wave, altering vacation location because of climate change, relocating from an exposed location.Yes
No
8Have you adopted any measure in favour of climate change mitigation?Yes
No
a ’Transport’, ‘Beaches’, ‘The coast’, ‘The value of my property’, ‘The value of others´ property’, ‘Damage to my property’, ‘Damage to other´s property’, ‘Nature/fauna/flora’, ‘Spread of alien species’, ‘Permanent inundation of coastal areas’, ‘Opportunities for outdoor swimming’, ‘The temperature climate’, ‘The precipitation climate’, ‘The wind climate’ ‘Insects indoors’, ‘Health’, ‘Expenses for the municipality’, ‘Heating’, ‘Taxes’, ‘Winter sports’, ‘Agriculture’, ‘Tourism’, ‘Drinking water’. b ’I do not know’ was interpreted as meaning ‘I do not know’ or ‘I am indifferent’ and hence was not seen as the mid-point on the scale.
Table 2. Tipping point behaviour in relation to decisions favouring responding to climate change (adaptation and mitigation).
Breakpoint of Net Value of Expected Impacts for Tipping Point BehaviourTipping Point
Behaviour (No
Decision in
Response to
Climate Change Made)
(n)
No Tipping Point Behaviour (Decision in Response to
Climate Change Made)
(n)
Estimated Relative
Frequency of Tipping Point Behaviour with 90% CI
Adaptation
<−51 *10290.76 (0.70–0.83)
>−12 **210580.22 (0.18–0.26)
>21 **230.61 (0.29–0.94)
Mitigation
<−42 *191470.12 (0.078–0.16)
<−30 **291950.13 (0.097–0.17)
* Systemic tipping point behaviour. ** Decision maker´s tipping point behaviour. CI: credible interval.
Table 3. Estimated relative frequency of decision-making favouring mitigation of climate change by the valence of the net value of expected impacts of climate change and 90% CI.
Net Value of Expected Impacts < 0Net Value of Expected Impacts ≥ 0Difference in Net Value of Expected
Impacts
Estimated relative
frequency
0.83 (0.80–0.87)0.45 (0.31–0.58)0.39 (0.25–0.52)
Publisher’s Note: MDPI stays neutral with regard to jurisdictional claims in published maps and institutional affiliations.

