Article

Vulnerability of Subaerial and Submarine Landscapes: The Sand Falls in Cabo San Lucas, Mexico

by
Juan Carlos Alcérreca-Huerta
1,
Jorge R. Montiel-Hernández
2,
Mariana E. Callejas-Jiménez
3,
Dulce A. Hernández-Avilés
4,
Giorgio Anfuso
5,* and
Rodolfo Silva
6
1
Department of Observation and Study of the Earth, the Atmosphere and the Ocean, National Council of Science and Technology-The Southern Border College (CONACYT-ECOSUR), Chetumal 77014, Mexico
2
Institute of Marine Sciences and Limnology, National Autonomous University of Mexico, Mexico City 04510, Mexico
3
Department of Observation and Study of the Earth, the Atmosphere and the Ocean, The Southern Border College (ECOSUR), Chetumal 77014, Mexico
4
Faculty of Architecture, National Autonomous University of Mexico, Mexico City 04510, Mexico
5
Department of Earth Science, Faculty of Marine and Environmental Sciences, University of Cadiz, 11003 Cadiz, Spain
6
Institute of Engineering, National Autonomous University of Mexico, Mexico City 04510, Mexico
*
Author to whom correspondence should be addressed.
Land 2021, 10(1), 27; https://doi.org/10.3390/land10010027
Submission received: 10 December 2020 / Revised: 25 December 2020 / Accepted: 28 December 2020 / Published: 31 December 2020
(This article belongs to the Section Landscape Ecology)

Abstract

:
The coastal landscape of the south of the Baja California peninsula provides significant socio-economic benefits based on tourism. An analysis of coastal vulnerability was conducted for Cabo San Lucas, considering wave climate conditions, sediment characterization, beach profiles, and the historical occurrence of coastline changes, hurricanes, and El Niño Southern Oscillation (ENSO) events. The coastal scenery was also classified considering the landscape value of the environment from a touristic point of view, based on human and natural interactions on the landscape. Results show that the vulnerability increases close to the submarine sand falls, near intense urbanization, in resort areas, and at locations with narrow beach and dune widths. The degree of vulnerability along the coast alters abruptly, as urban and recreational sites alternate with natural sites. This coastline has seen exponential development since the 1980s, resulting in highly vulnerable areas with a low, and decreasing, touristic value, as the landscape has been changed into an urban settlement with limited natural attractions. Urban and recreational settlements threaten to cover dunes and reservoirs of natural sediments, increasingly affecting vulnerability in the area as well as the landscape values of many parts of the coast, including the submarine sand falls.

1. Introduction

Coastal systems are transitional regions which require holistic approaches to analyze disturbances related to impacts from coastal erosion, landscape threats, urbanization, sea level rise, and the introduction of exotic species [1,2,3,4]. Through vulnerability concepts, approaches, and evaluations [5,6,7,8], the various ways in which human-induced changes affect coastal processes can be identified.
The evaluation and diagnosis of the theoretical damage along a coast provide the basis for calculating vulnerability indices that simplify several complex parameters and reduce the dimensions of the components to interpret vulnerability [9]. The first Coastal Vulnerability Index (CVI) was focused on the effects of sea level rise, floods, and erosion processes [2,3,10]. Other indices were later developed, taking into consideration physical variables only [11]. The introduction of Geographical Information Systems (GIS) at local, regional, and national levels has assisted the development of CVIs related to natural hazards [12], flood risk analysis from extreme storm surges [13], the vulnerability of urban coastal sectors [14], regional coastal erosion [15], and sea level rise [16,17,18]. Recent CVIs have been devised to analyze vulnerability on a wide variety of coastal systems [6,19,20,21,22].
The estimation and interpretation provided by vulnerability analysis usually are the basis of regional and local management plans [23,24]. A diagnosis of the degree for erosion/accretion [25,26], sediment flow patterns, and coastal agents serves to identify hydro-sedimentary balances [27,28,29] to support vulnerability analyses. Besides vulnerability, the coastal scenery could also be classified considering the landscape value of the environment from a touristic perspective. This differs from vulnerability since the coastal scenery classification considers images, representations, and sensations of a site, as perceived by the inhabitants or visitors of the place [30,31].
The impressive submarine sand falls in Cabo San Lucas, on the southern tip of the Californian Peninsula, Mexico, are part of a World Heritage Natural Area [32]. Vast masses of sand travel down the walls of a submarine canyon, to depths of over 1000 m. The submarine sand falls, together with the coastal landscape of Cabo San Lucas, have been attractive to tourists since they were first documented by [33], due to the unusual underwater sand fall and the own natural beauty of the coastline. These submarine sand falls are not a unique phenomenon, but their scale exceeds those of other submarine canyons [34]. Since [35], only a small number of studies (e.g., [24,27,36,37]) have been conducted to explore the relationships between the falls and ecological, physical, and coastal processes in the area.
This study aims to examine the vulnerability of Cabo San Lucas and possible implications for the submarine sand falls by: (i) appraisal of the wave climate (1979–2018), (ii) analysis of sediment characterization and beach profiles (using field surveys of 2015–2017 and 2020), and (iii) identification of coastline changes (1968–2007). The study area of Cabo San Lucas is analyzed considering three zones, defined by the coasts of the Pacific Ocean, San Lucas Bay, and the Cape of San Lucas, where the submarine sand falls are located. An analysis of coastal scenery is also developed to classify the present value of the coastal landscape.

2. Materials and Methods
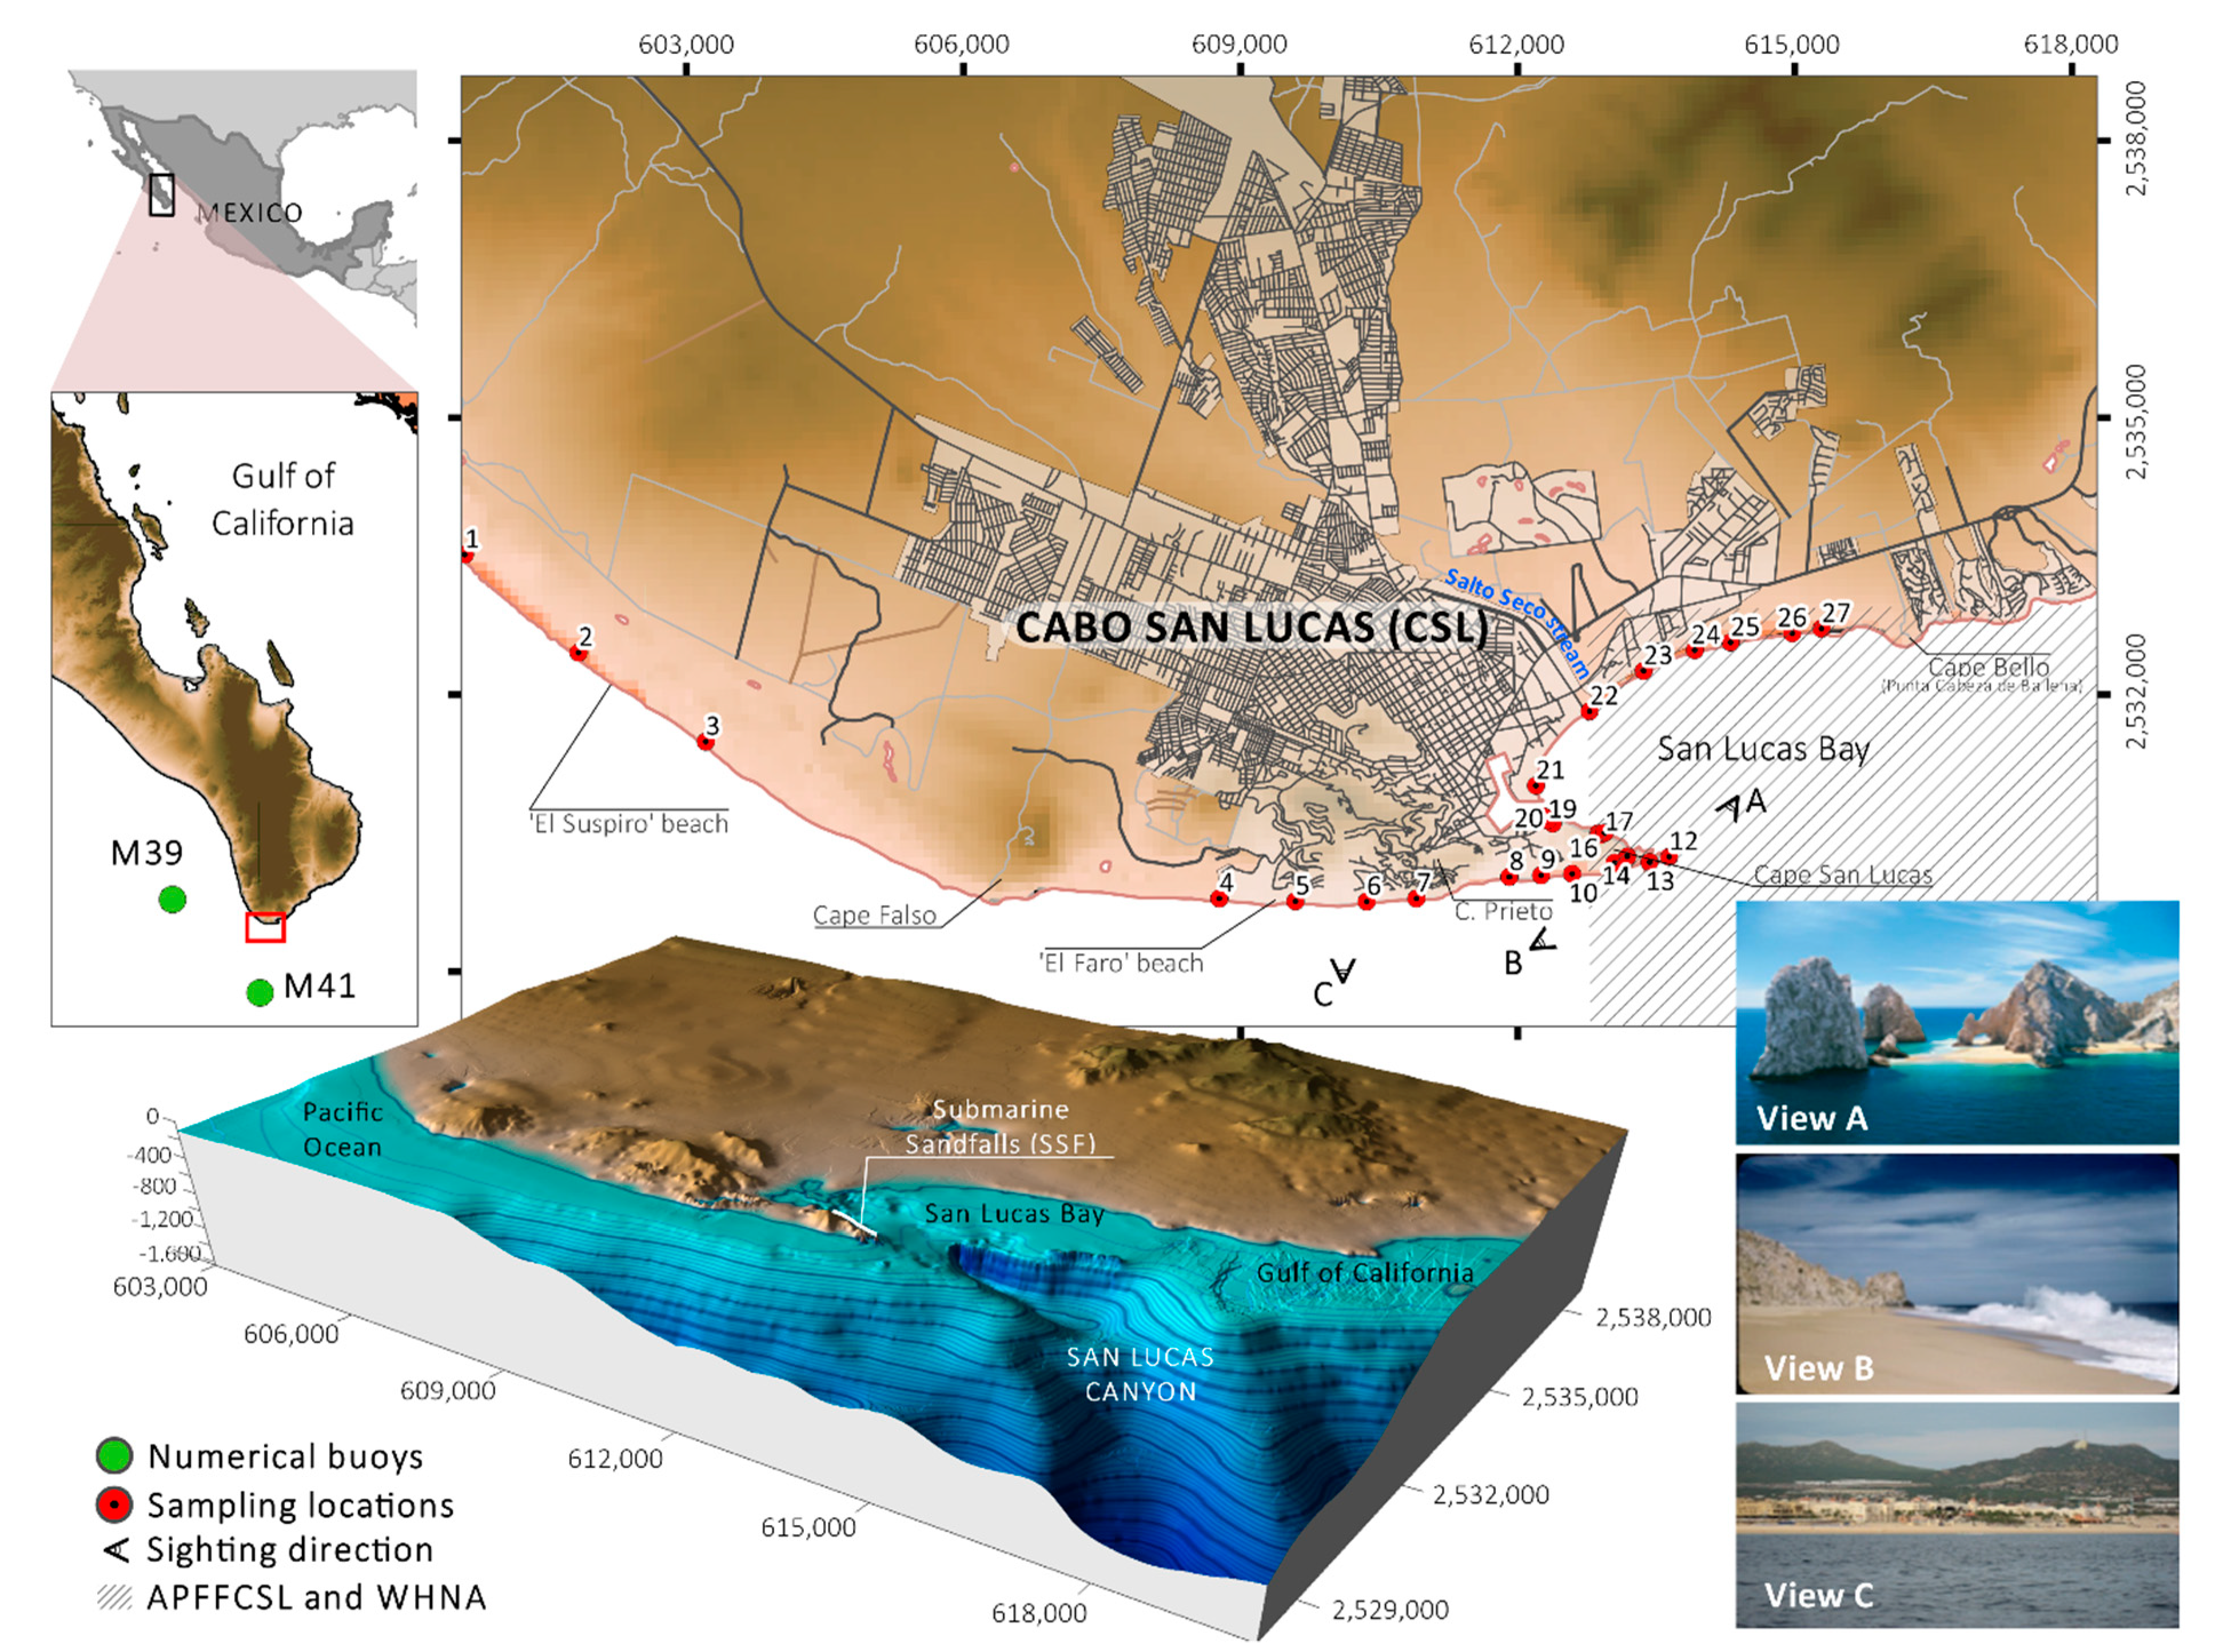
2.1. Study Area

The coastal landscape around Cabo San Lucas, on the southern tip of the Baja California peninsula, is a succession of sandy beaches, rocky cliffs, and arid, unvegetated hills 60–240 m in height. A sandy strip connects the Pacific coast with that of San Lucas Bay, forming a passage between the hill of El Vigía and the headland of Cabo San Lucas, which is considered to delimit the Gulf of California from the waters of the Pacific. In the southernmost part of San Lucas Bay are the submarine sand falls (Figure 1). Studies on the geology of the region by [38,39] describe the sediment deposits and granite formations, which make up the beaches and dunes of Cabo San Lucas, as well as the San Lucas submarine canyon, where the submarine sand falls are located (Figure 1). Since 1973, the submarine sand falls and part of San Lucas Bay have been part of the Flora and Fauna Protected Natural Area of Cabo San Lucas (APFFCSL) and, in 2005, were designated part of a World Heritage Natural Area (WHNA-Islands and Protected Areas of the Gulf of California) (Figure 1) [32]. However, in 2019, they were included in the List of World Heritage in Danger [40].
The distinctive coastal landforms of the rocky outcrops, Los Frailes, and the natural arch of Cabo San Lucas are iconic images of the region (Figure 1). In 1960, an Integrally Planned Center (IPC) was first stablished, implementing a 33 km Tourist Corridor connecting Cabo San Lucas with the city of San Jose del Cabo [41], which began to operate in 1976. Since the late 1980s, Cabo San Lucas has become a nationally and internationally known tourist destination [42]. The exponential growth of the economic and anthropogenic activities in Cabo San Lucas also included the construction of the inland port of Cabo San Lucas [43] (Figure 1).
Currently, Cabo San Lucas receives 2.57 million tourists per year, of which ~72% are foreigners [44]. Tourism is the primary source of income in the area, with sport fishing, diving, and golf being the major attractions. In fact, Cabo San Lucas is considered the golf capital of Mexico with nine golf courses [45]. There are a large number of hotels (>55), condominiums, timeshare properties, and recreational facilities related to sport fishing and nautical activities. Alongside this economic development, there has been significant population growth, with Cabo San Lucas passing from a village of 10,000 inhabitants in 1970 to a city of more than 238,000 inhabitants in 2010. This excessive urban growth has been largely unplanned, with urban or tourist development projects, limited only by the existence of natural protected areas.
The coasts of Cabo San Lucas are also a dynamic sea–land transition zone, where apart from the anthropogenic activities, swells have considerable influence on coastline changes and sediments, especially on the Pacific side. Inside San Lucas Bay, the predominant waves are generated by local winds, which interact with the swell-type waves refracted–diffracted inside the bay. The Cabo San Lucas region is also affected by tropical storms and hurricanes, the strongest, most recent being hurricanes Isis (1998), Juliette (2001), and Odile (2014).

2.2. Field Measurements, Sampling Techniques, and Data Analysis

Wave climate conditions for Cabo San Lucas (1979–2018) were analyzed using data from numerical buoys M39 and M41, located at 23.0° N, 110.5° W and 22.5° N, 110.0° W, respectively (Figure 1). The output dataset from a hybrid wave forecasting model [46,47] was used. This model is based on wind and bathymetric information, providing hourly significant wave height (HS), peak wave period (TP), and wave direction. Wave rose diagrams for regular and extreme wave conditions were produced.
Extreme wave conditions were defined considering those events at which HS exceeded a threshold hcrit and did not fall below this over a 12 h period, and with hcrit as 1.5 the mean annual significant wave height (hcrit > 1.5 HS(t)) [48]. The estimated joint HS-TP probabilities were implemented for the modeling of wave propagation and wave-induced currents at Cabo San Lucas, using the WAPO (WAve Propagation On the coast) [49] and COCO2 (COrrientes COsteras [Coastal currents]) [50] numerical models, respectively. A one-way coupling was conducted between the models, so that the output results from WAPO were introduced as input for the COCO2 model to estimate the wave-induced coastal currents related to representative events. The modeling considered the most common HS-TP conditions with the wave direction linked to the most frequent regular wave climate and that of the most critical extreme wave events. The number of local extreme wave events was compared with the El Niño Southern Oscillation (ENSO) conditions described by the Oceanic Niño Index (ONI) [51] to see any possible relation with ocean anomalies in the Niño 3.4 region (5° N–5° S, 120°–170° W). The trajectories of tropical depressions, or hurricanes, within a radius of 5, 30, and 60 NM from Cabo San Lucas, were identified based on the dataset from [51].
Sand samples were taken at sites: (a) on the Pacific Ocean coastline, with less spacing close to the submarine sand falls, that is, ~1.5 km apart (sites 1–3); 0.5–0.8 km apart (sites 4–7); and 0.2–0.5 km apart (sites 8–11); (b) in the submarine sand falls area, surface and submerged samples up to 30 m depth (sites 12–13) were collected; and (c) on the San Lucas Bay coastline, with a spacing of 0.2–0.5 close to the submarine sand falls (sites 14–20) and 0.5–0.8 km further away (sites 21–26) (Figure 1). On each beach profile, 3–5 sand samples were taken (i.e., beach dune, backshore, swash zone, and breaker zone) in field surveys of 2015–2017 and in 2020.
Grain size, roundness, and sphericity were measured with a particle analyzer, CAMSIZER P4. This analyzer uses the Dynamic Image Analysis method for determining the grain size distribution, as well as the shape of particles (roundness and sphericity), according to the Krumbein–Sloss chart [52].
Mean values and relative standard deviation (RSD) were calculated for the grain size, roundness, sphericity, and density values. The spatial variation of grain size was interpolated to generate distribution gridded maps of D50 values per sampling year (D50year i). These grids were averaged at each grid cell (Equation (1)), giving a D50Av spatial distribution. The interannual grain size variability was analyzed considering the RMSED50 (Equation (2)) to compare the average D50Av distribution in Cabo San Lucas to that obtained for a specific year (D50year i).
D 50   A v = 1 n i = 1 n D 50 y e a r   i
R M S E D 50 = 1 n i = 1 n ( D 50 y e a r   i D 50 A v ) 2
To identify factors of pressure on the coastal system of Cabo San Lucas and the submarine sand falls, measurements of beach profiles were carried out in 2016, using an RTK system on San Lucas Bay from the shoreline up to the landward limit of the beach/dune, often coinciding with infrastructure. Changes to the coastline were also assessed considering digitalized and georeferenced photogrammetry information of the shoreline dated 1968, 1989, 1997, and 2007.
The classification of the coastal scenery was carried out using the methodology described in [53], which has been successfully applied to many different countries worldwide [18,53,54,55,56]. This uses 26 landscape components, 18 physical and 8 human (Table 1), ranked on a 1–5 scale of attributes from presence/absence or low quality (1) to excellent/outstanding (5) [57]. The attribute results were processed using Fuzzy Logic Assessment, which is described in detail in [53], to overcome the subjectivity of any assessor. An evaluation index (D) is obtained and used to identify the coastal scenic value as classified in Table 1.
The locations assessed were between adjacent littoral units. The littoral units were limited by fixed obstacles (e.g., headlands, cliffs, harbor breakwaters) or nonfixed obstacles (e.g., dynamic river mouths, tidal-discovered geoforms) along the Pacific Ocean (CL1, CL2, CL3, CL4, CL5) and on San Lucas Bay (CL6, CL7, CL8, CL9) (Figure 1). The class scenic values were mapped together with sediment characterization and marine hydrodynamics, to identify sources of risk in the area.
The Coastal Vulnerability Index (CVI) for Cabo San Lucas included the formulation of three subindices based on [9,58,59], concerning the resilience of the coast to erosion (geomorphological indicators, GI), coastal forcing variables contributing to wave-induced erosion (hydrodynamic indicators, HI), and infrastructure potentially at risk (socio-economic indicators, SI). A linear ranking scale of 1–4 was defined for the ai indicators, according to their vulnerability: very low (1), low (2), moderate (3), high (4) (Table 2). The ranges of the ai indicators consider the maximum and minimum values of the given indicator (ai), defined specifically for the coastal environment of Cabo San Lucas. This approach is similar to that described elsewhere (e.g., [16,60,61]). Coastal cells of 200 m × 200 m were defined for measurement of the ai indicators [22,60], accounting for the wave climate, sediment analysis, and beach profiles, as well as digital elevation models (DEM) (1:10,000) from [62].
The CVI was then calculated for each of the coastal cells as the nth root of the product of the ai values (Equation (3)), so that the resulting CVI was within the range and the statistic distributional features of the indicators, being less sensitive to extreme values [60]:
CVI = ( i = 1 n a i ) 1 / n = a 1 · a 2 · · a n n
The CVI values for each coastal cell were used to obtain a coastal vulnerability map of the study area. Two coastal zones were also defined: the Pacific Ocean and San Lucas Bay shorelines, divided by the extreme tip of the Cape of San Lucas (22.87632° N, 109.89431° W). Based on the average scores obtained at each cell, a general CVI value was assigned to Cabo San Lucas and to each zone.
Figure 2 summarizes the main steps in the methodology leading to the Evaluation Index (D), and to the Coastal Vulnerability Index (CVI). Both cover key elements in the quantification of the region’s coastal vulnerability and the present value of the coastal landscape from a touristic point of view.

3. Results

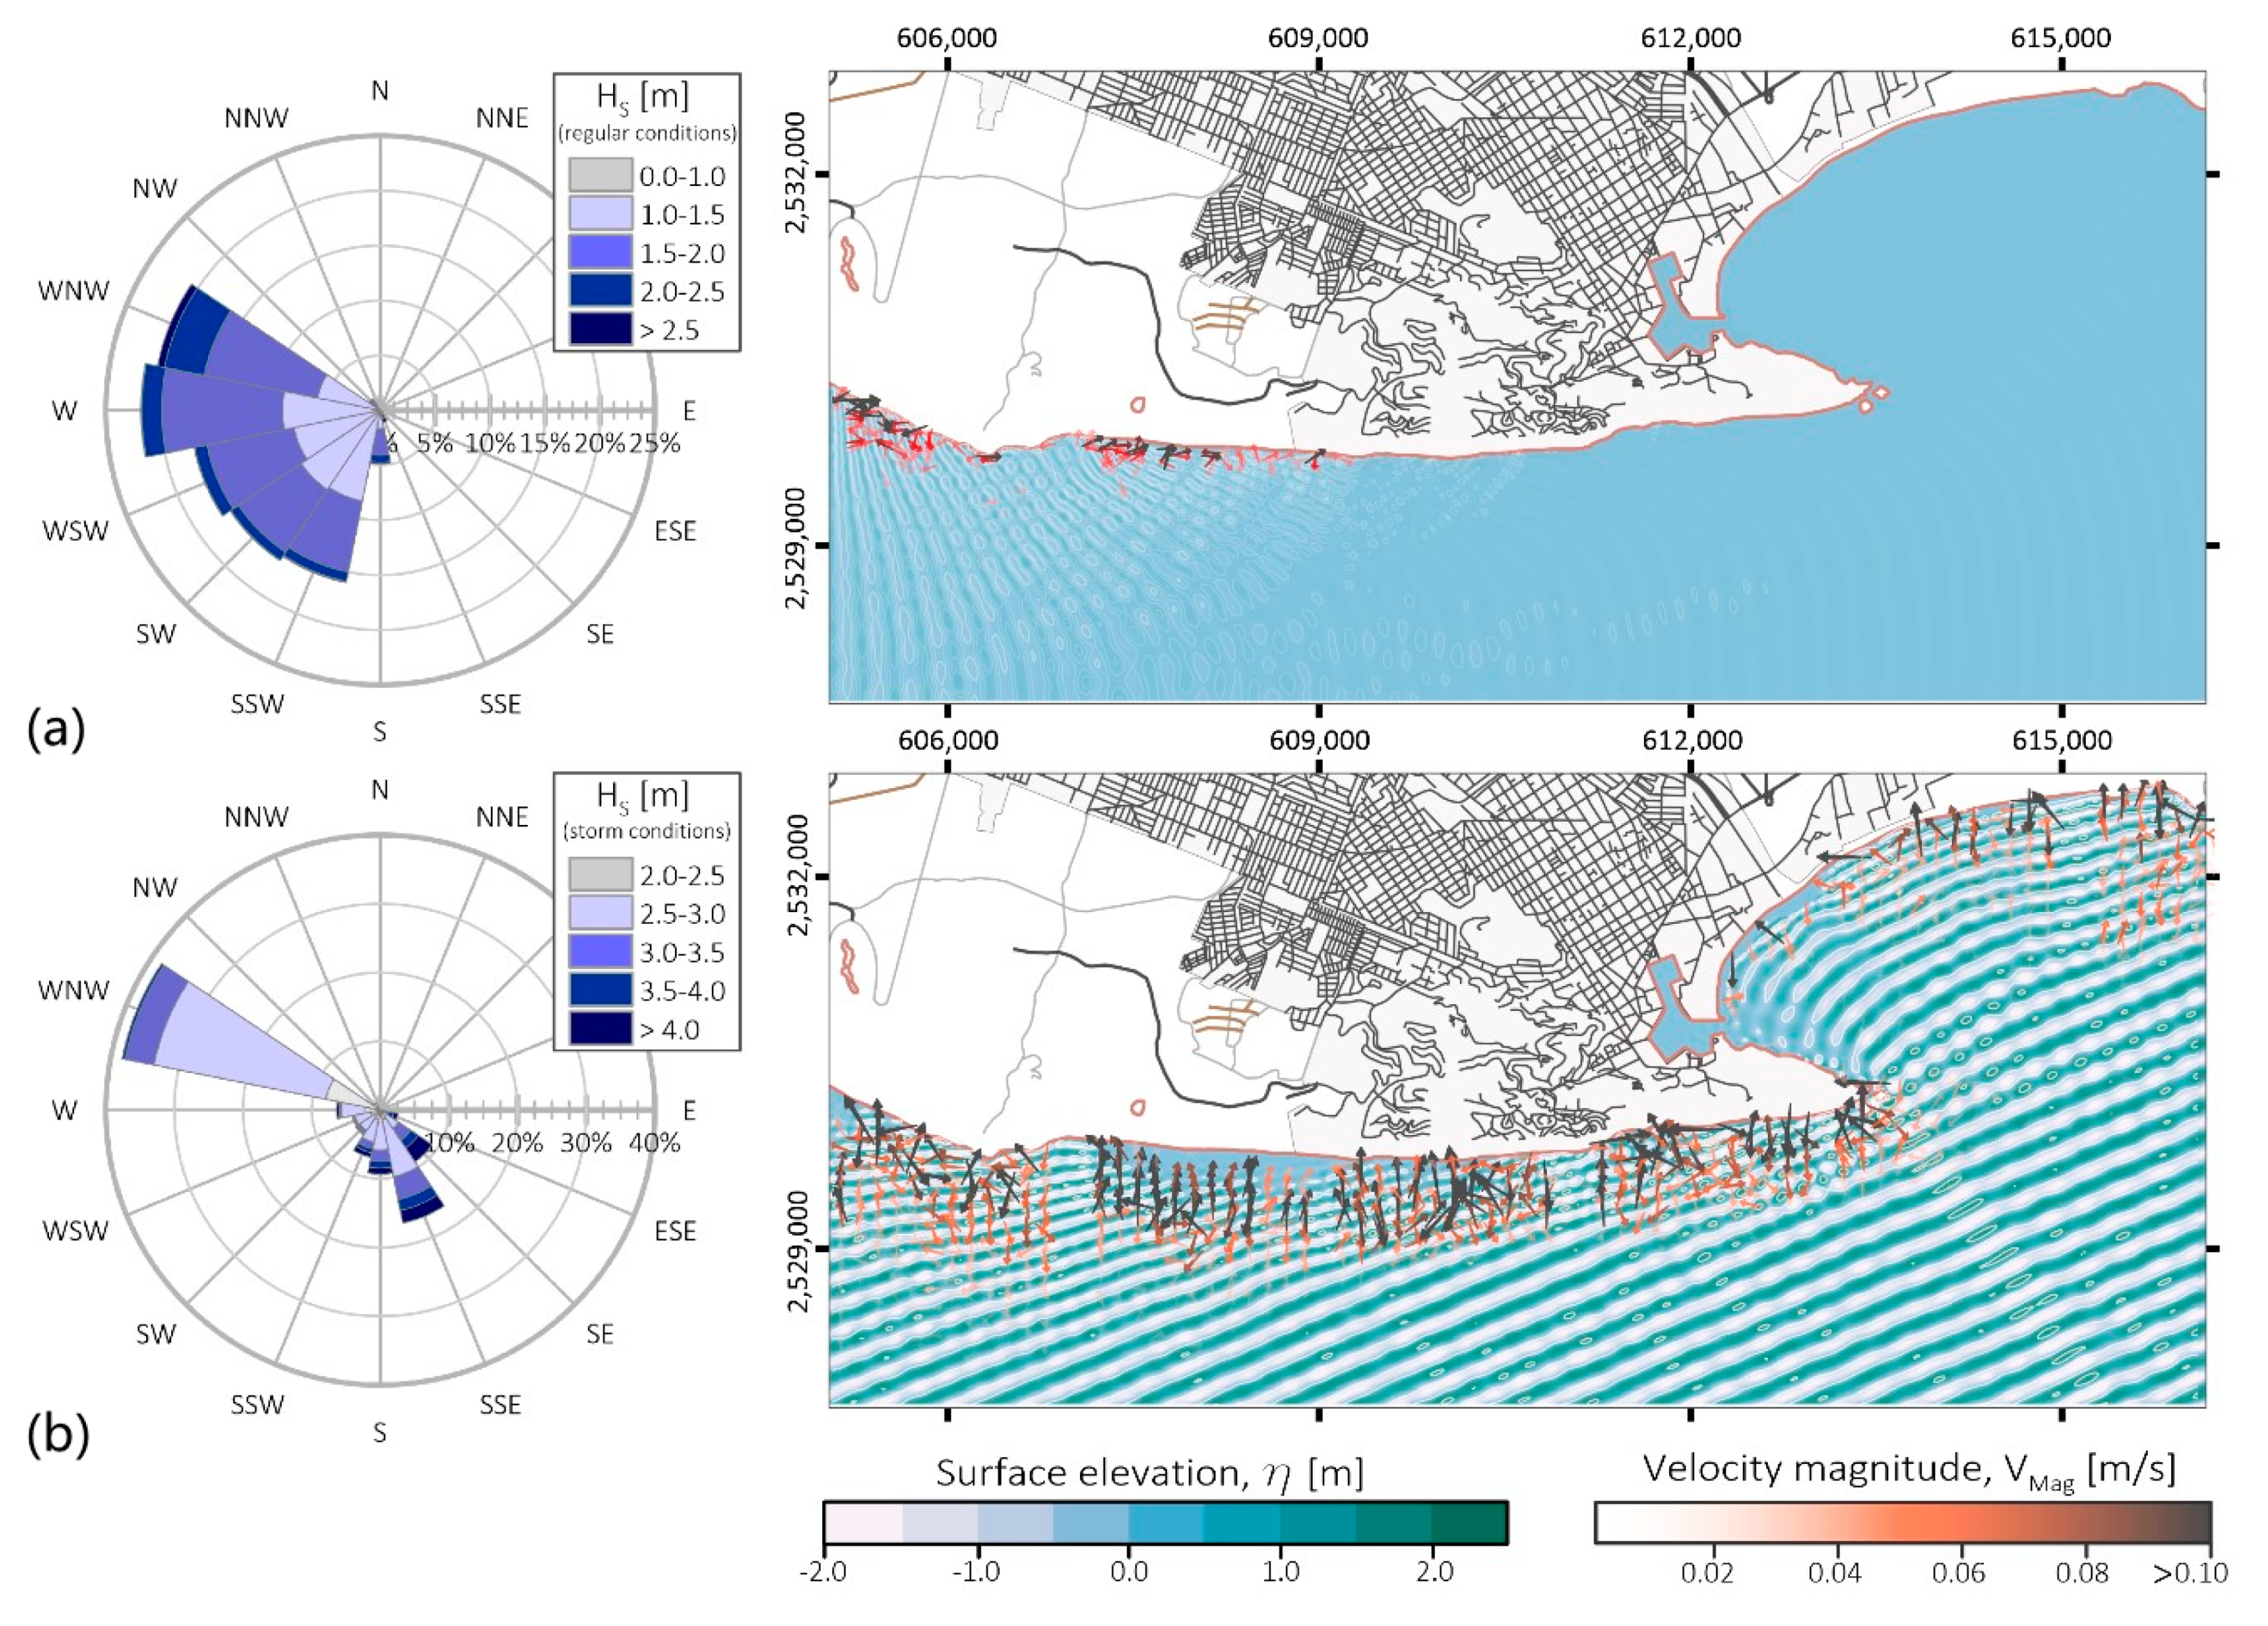
3.1. Hydrodynamics: Waves and Currents

For 1979–2018, the mean annual significant wave height for Cabo San Lucas was HS = 1.61 ± 0.07 m. Considering 1.5 HS, a hcrit = 2.47 m was defined as the threshold for extreme wave event conditions. The maximum annual wave height was 4.0–4.5 ± 1.2 m, with a peak of HS = 8.14 m in 2001. About 94.6% of the waves in normal conditions were propagated with a W–E component direction (Figure 3). Wave heights of HS = 1.1–1.9 have a 78% occurrence probability, with 51% related to wave periods Tp = 10.77–15.81 s.
Only 2.1% of the wave conditions recorded are related to extreme wave events. A bimodal behavior in wave direction for extreme wave events was observed: 38.3–53.4% have a W–E component direction considering M39 and M41 numerical buoys, respectively, with ~98.2% linked to wave heights hcrit < HS < 3.5 m. The most critical conditions occur with waves propagated with SSE–NNW direction (10.7–16.8%), of which 20.8–21.6% have wave heights HS > 3.5 m.
Conditions of HS = 1.6 m and Tp = 13.4 s for W–E waves’ approaching direction were used to model wave propagation around Cabo San Lucas and estimate wave-induced currents as a proxy for identifying episodic erosion hotspots. For the extreme conditions, waves of HS = 3.30 m, TP = 12.3 s, and SSE–NNW direction were considered. The results of modeled wave and wave-induced currents fields are shown in Figure 3.
Under normal wave conditions, wave refraction is observed along the Pacific coastline, where wave-induced currents generally show chaotic patterns west to Cape Falso. However, close to the shoreline, wave-induced currents become oriented to the east, with velocities ranging from 0.05 to 0.1 m/s. Wave dissipation also occurs towards the east with effects that may contribute to the transport and sediment deposition close to the Cape of San Lucas. For the modeling of the extreme wave conditions, wave propagation on the Pacific and San Lucas Bay shorelines does not show large dissipation effects and is mostly limited to El Faro beach. Wave reflection and diffraction are caused by the Cape of San Lucas, giving a small sheltered area at the port and the shoreline in between. Wave-induced currents are mainly cross-shore, both land- and seaward, due to incident and reflected waves. The velocity magnitude of the currents is usually 0.06–0.10 m/s, with the lower values inside San Lucas Bay and reaching 0.30 m/s west of Cape Falso.

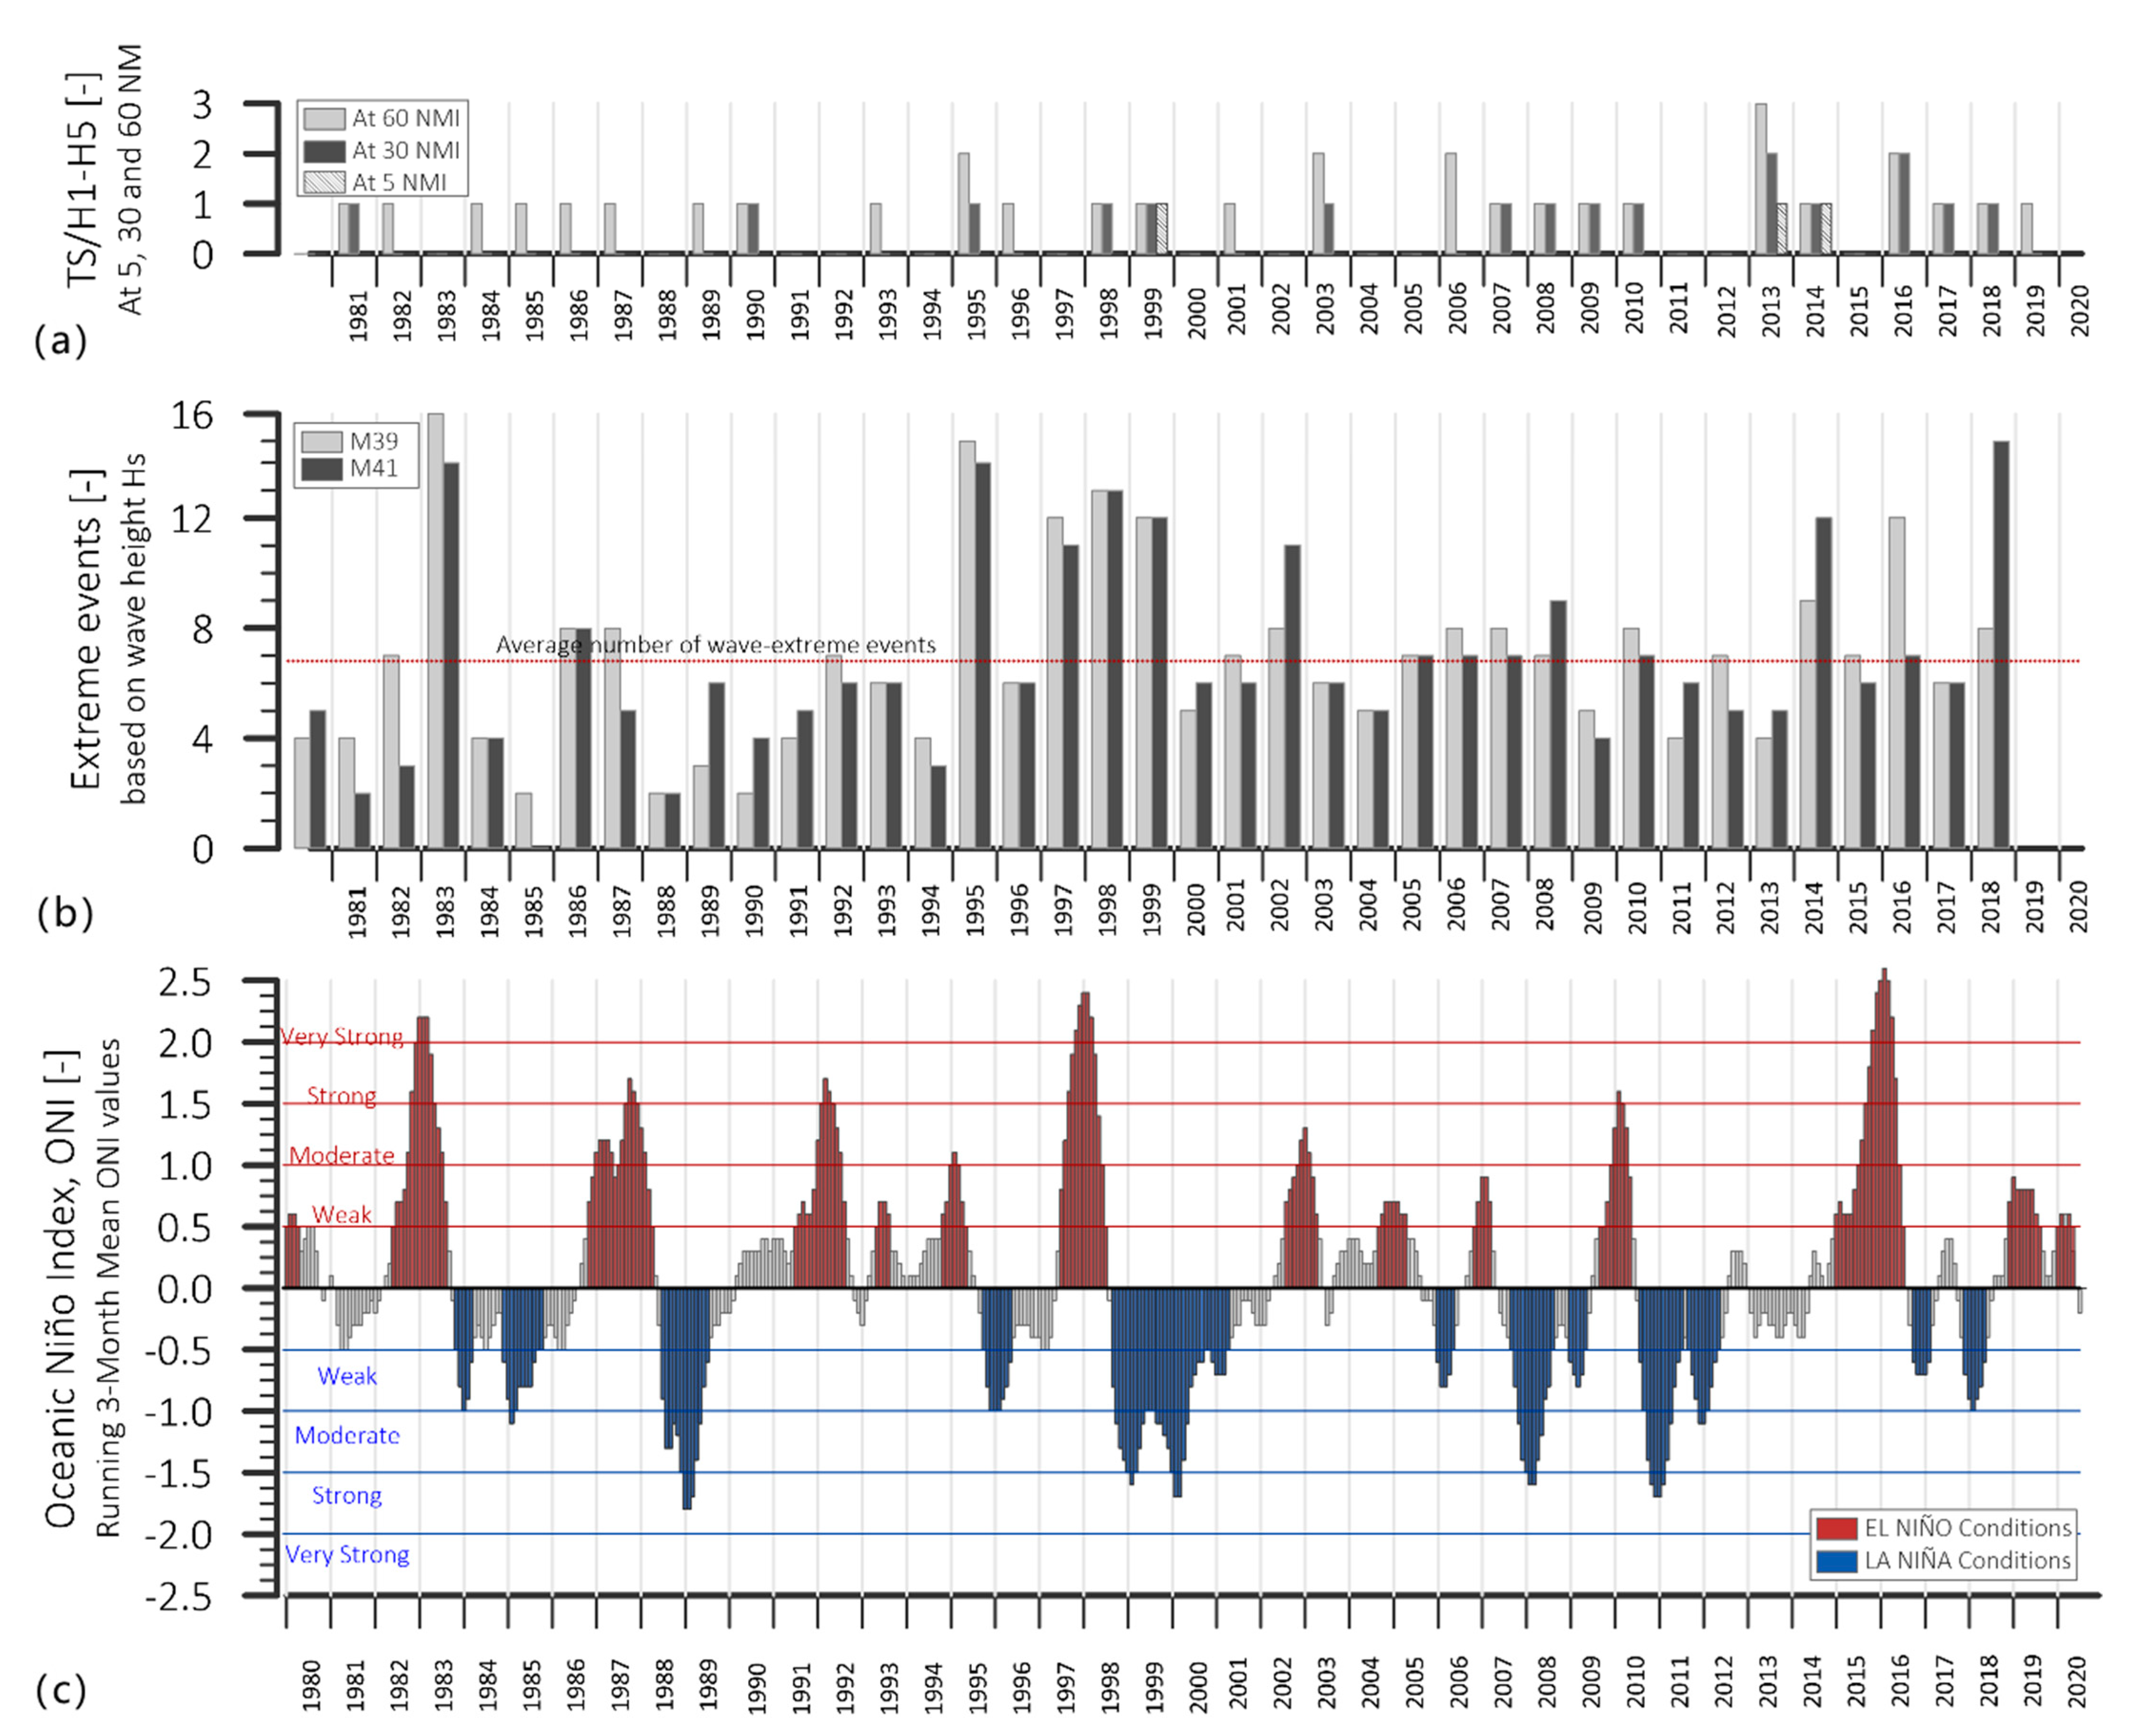
3.2. Storms and ENSO Events

A record of the storms and El Niño Southern Oscillation (ENSO) events at Cabo San Lucas for 1980–2019 is given in Figure 4. Tropical storms (TS) or hurricanes (H1–H5) at 60 nautical miles occur almost every year in the study area (Figure 4a). However, at 30 NMI an increase in the number of tropical storms or hurricanes was observed (i.e., 1980–1989: one event; 1990–1999: four events; 2000–2009: four events; 2010–2019: five events). Three events occurred at 5 NMI from Cabo San Lucas in 1999 (TS-Greg), 2013 (TS-Juliette), and 2014 (H3-Odile), with TS-Juliette significantly affecting the Pacific shoreline of Cabo San Lucas.
Analysis of the dataset from numerical buoys M39 and M41 identified 270 extreme wave events in 1980–2018, with an average of ~6.9 events per year (Figure 4b). The annual average of extreme wave events per year was 5.4 (1980s), 8.1 (1990s), 6.7 (2000s), and 7.5 (2010s). In Cabo San Lucas, tropical storms and hurricanes were also less frequent in 1980–1989.
There is no clear trend of El Niño or La Niña conditions in relation to local incident tropical storms, hurricanes, or wave extreme events in Cabo San Lucas (Figure 4), for which correlation analysis considered a linear trend leading to r2 < 0.22. Nevertheless, about 3–4 of El Niño events and 2–4 peaks of La Niña occurred in each decade. There was a slight increase for La Niña conditions in the last two decades, with no apparent local effects in Cabo San Lucas. Strong to extreme conditions for El Niño were seen in 1983, 1987, 1992, 1997–1998, 2010, and 2015–2016. For these periods, the number of extreme wave events was higher than average, with a maximum of 16 events in 1983, but this is not necessarily related to tropical storms or hurricanes occurring in the vicinity of Cabo San Lucas.

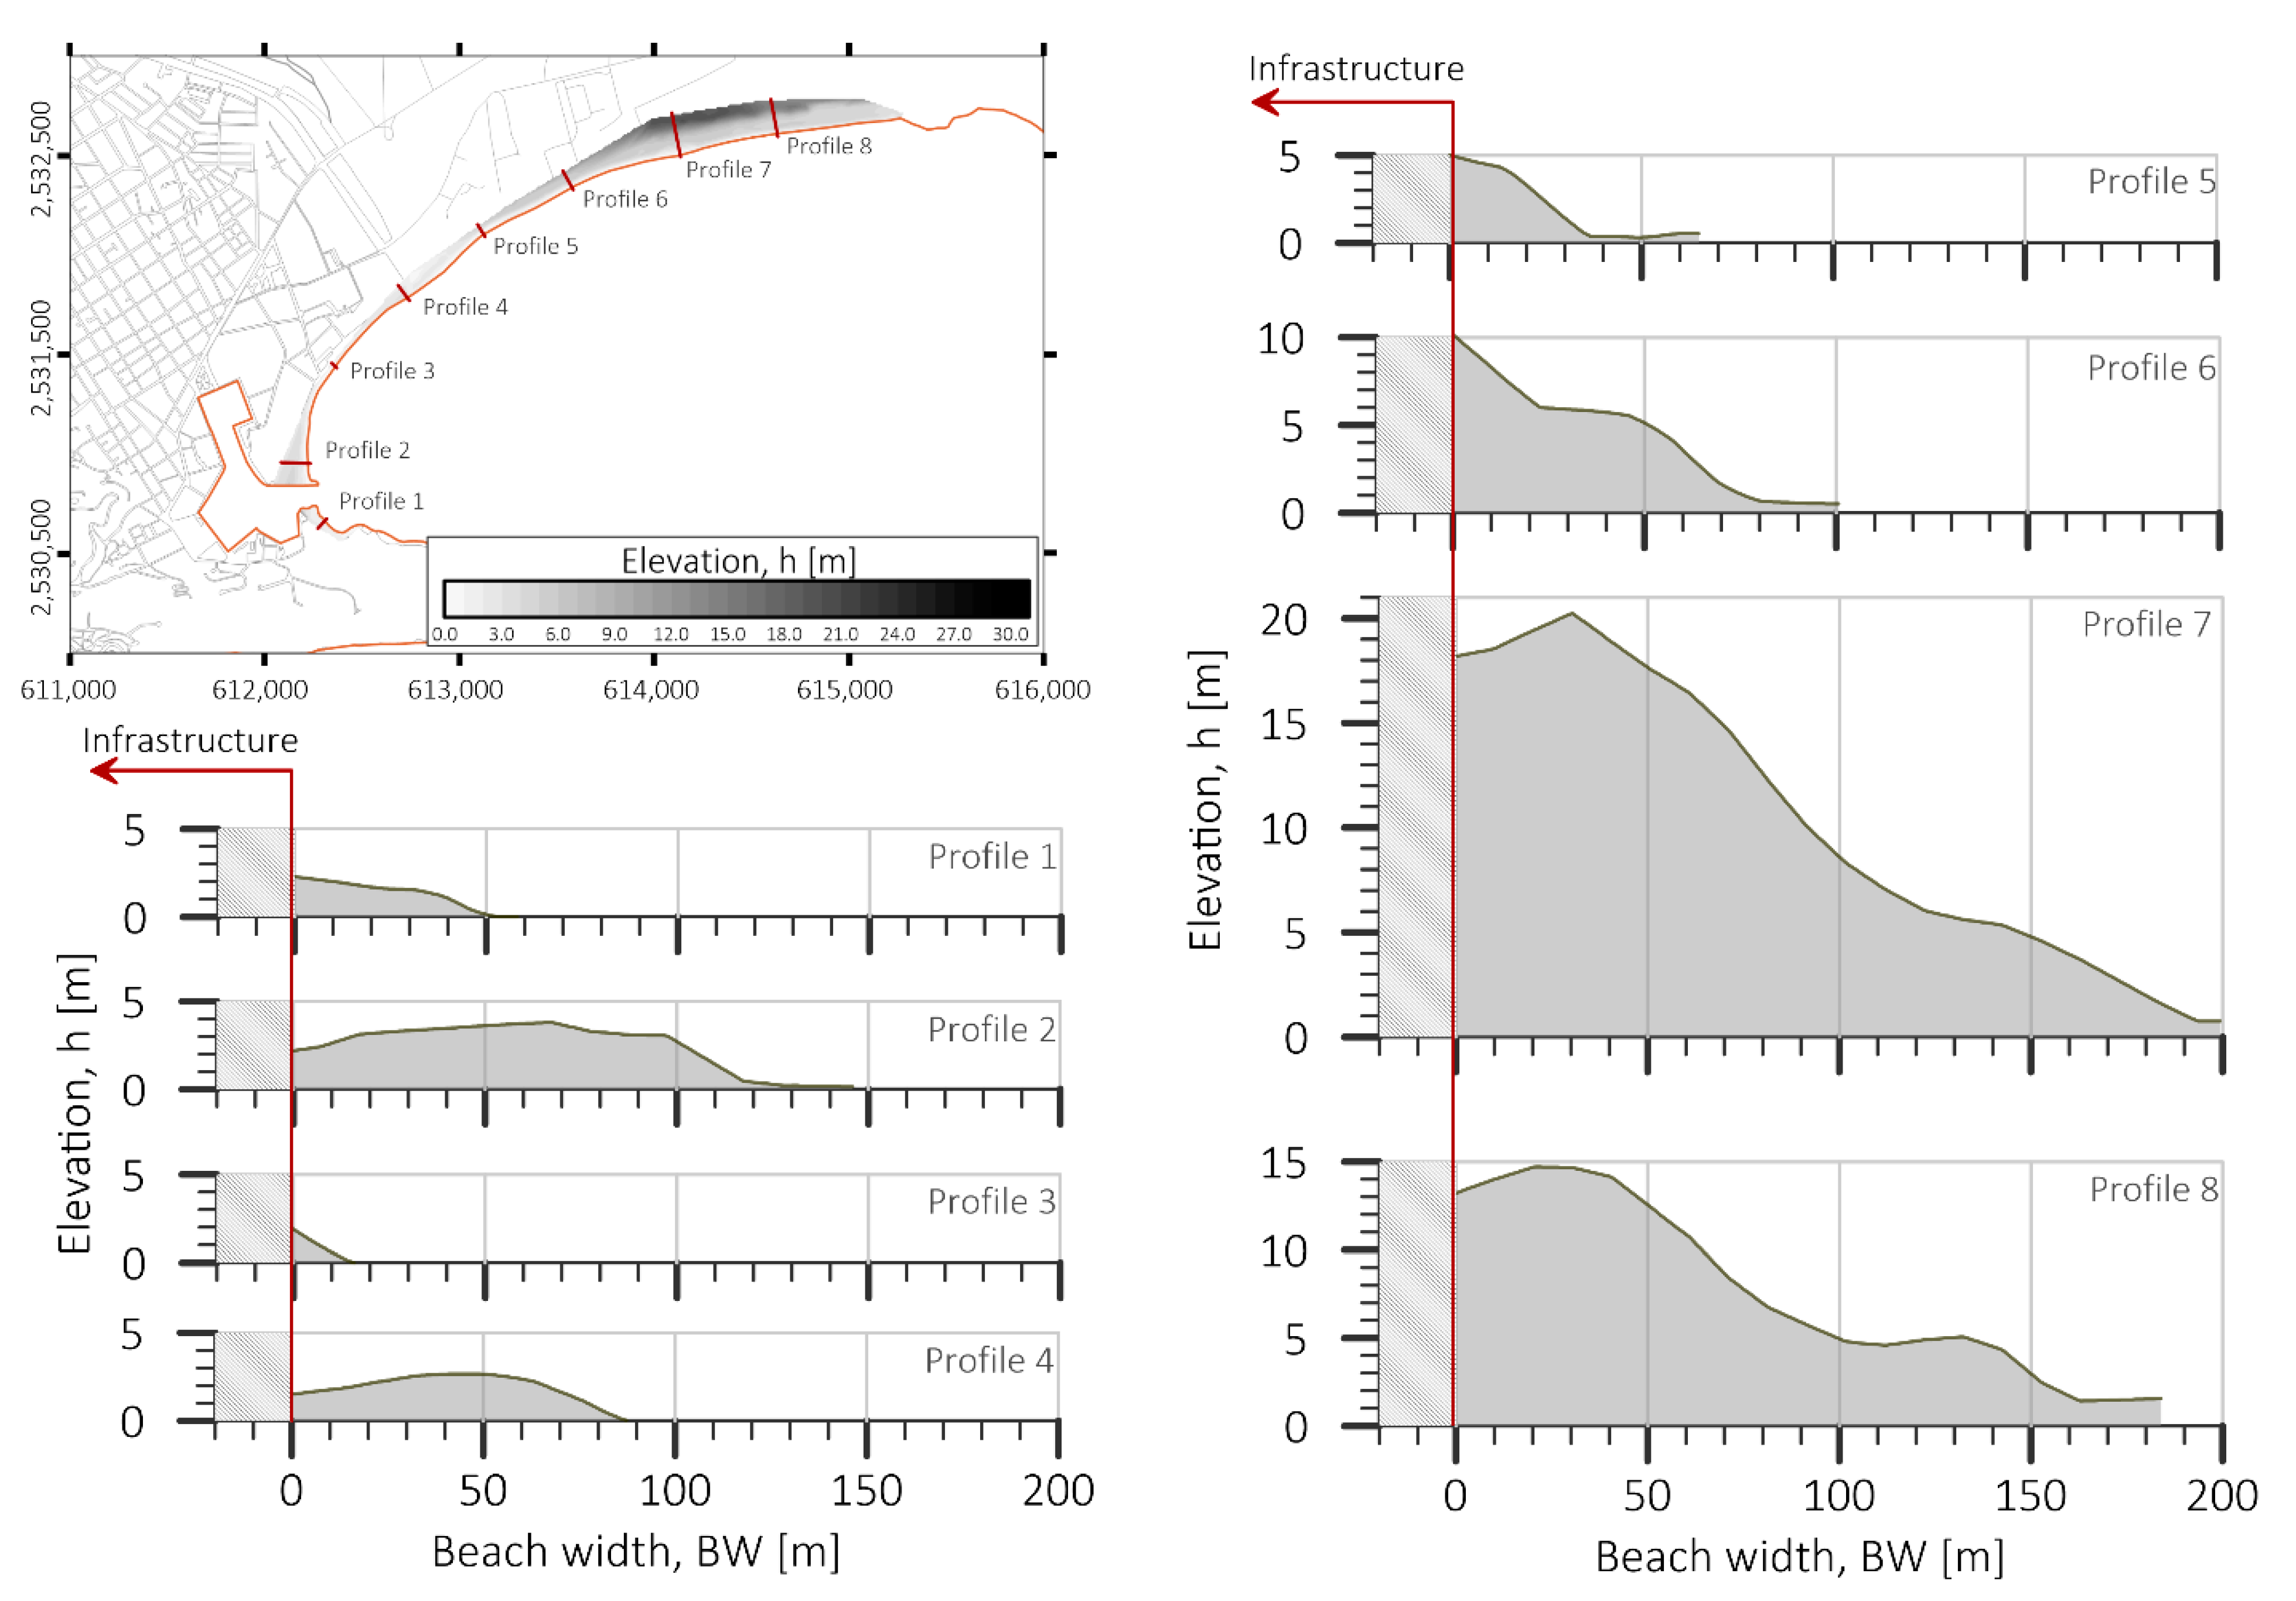
3.3. Sediments, Beach Profiles, and Coastline Changes

The sediment around Cabo San Lucas is composed of coarse and very coarse sands with D50,mean = 0.838 mm (RSDD50 = 36.2%), density ρmean = 2.541 kg/m3 (RSDρ = 2.3%), sphericity SPmean = 0.83 (RSDSP = 3.7%), and roundness Rmean = 0.69 (RSDR = 7.4%). Density, sphericity, and roundness values are typical of terrigenous sediment from the granite formations in the area (with a high quartz content), with low spatial and temporal variations.
The most notable differences are related to the grain size distribution and the site conditions in the region (Figure 5a):
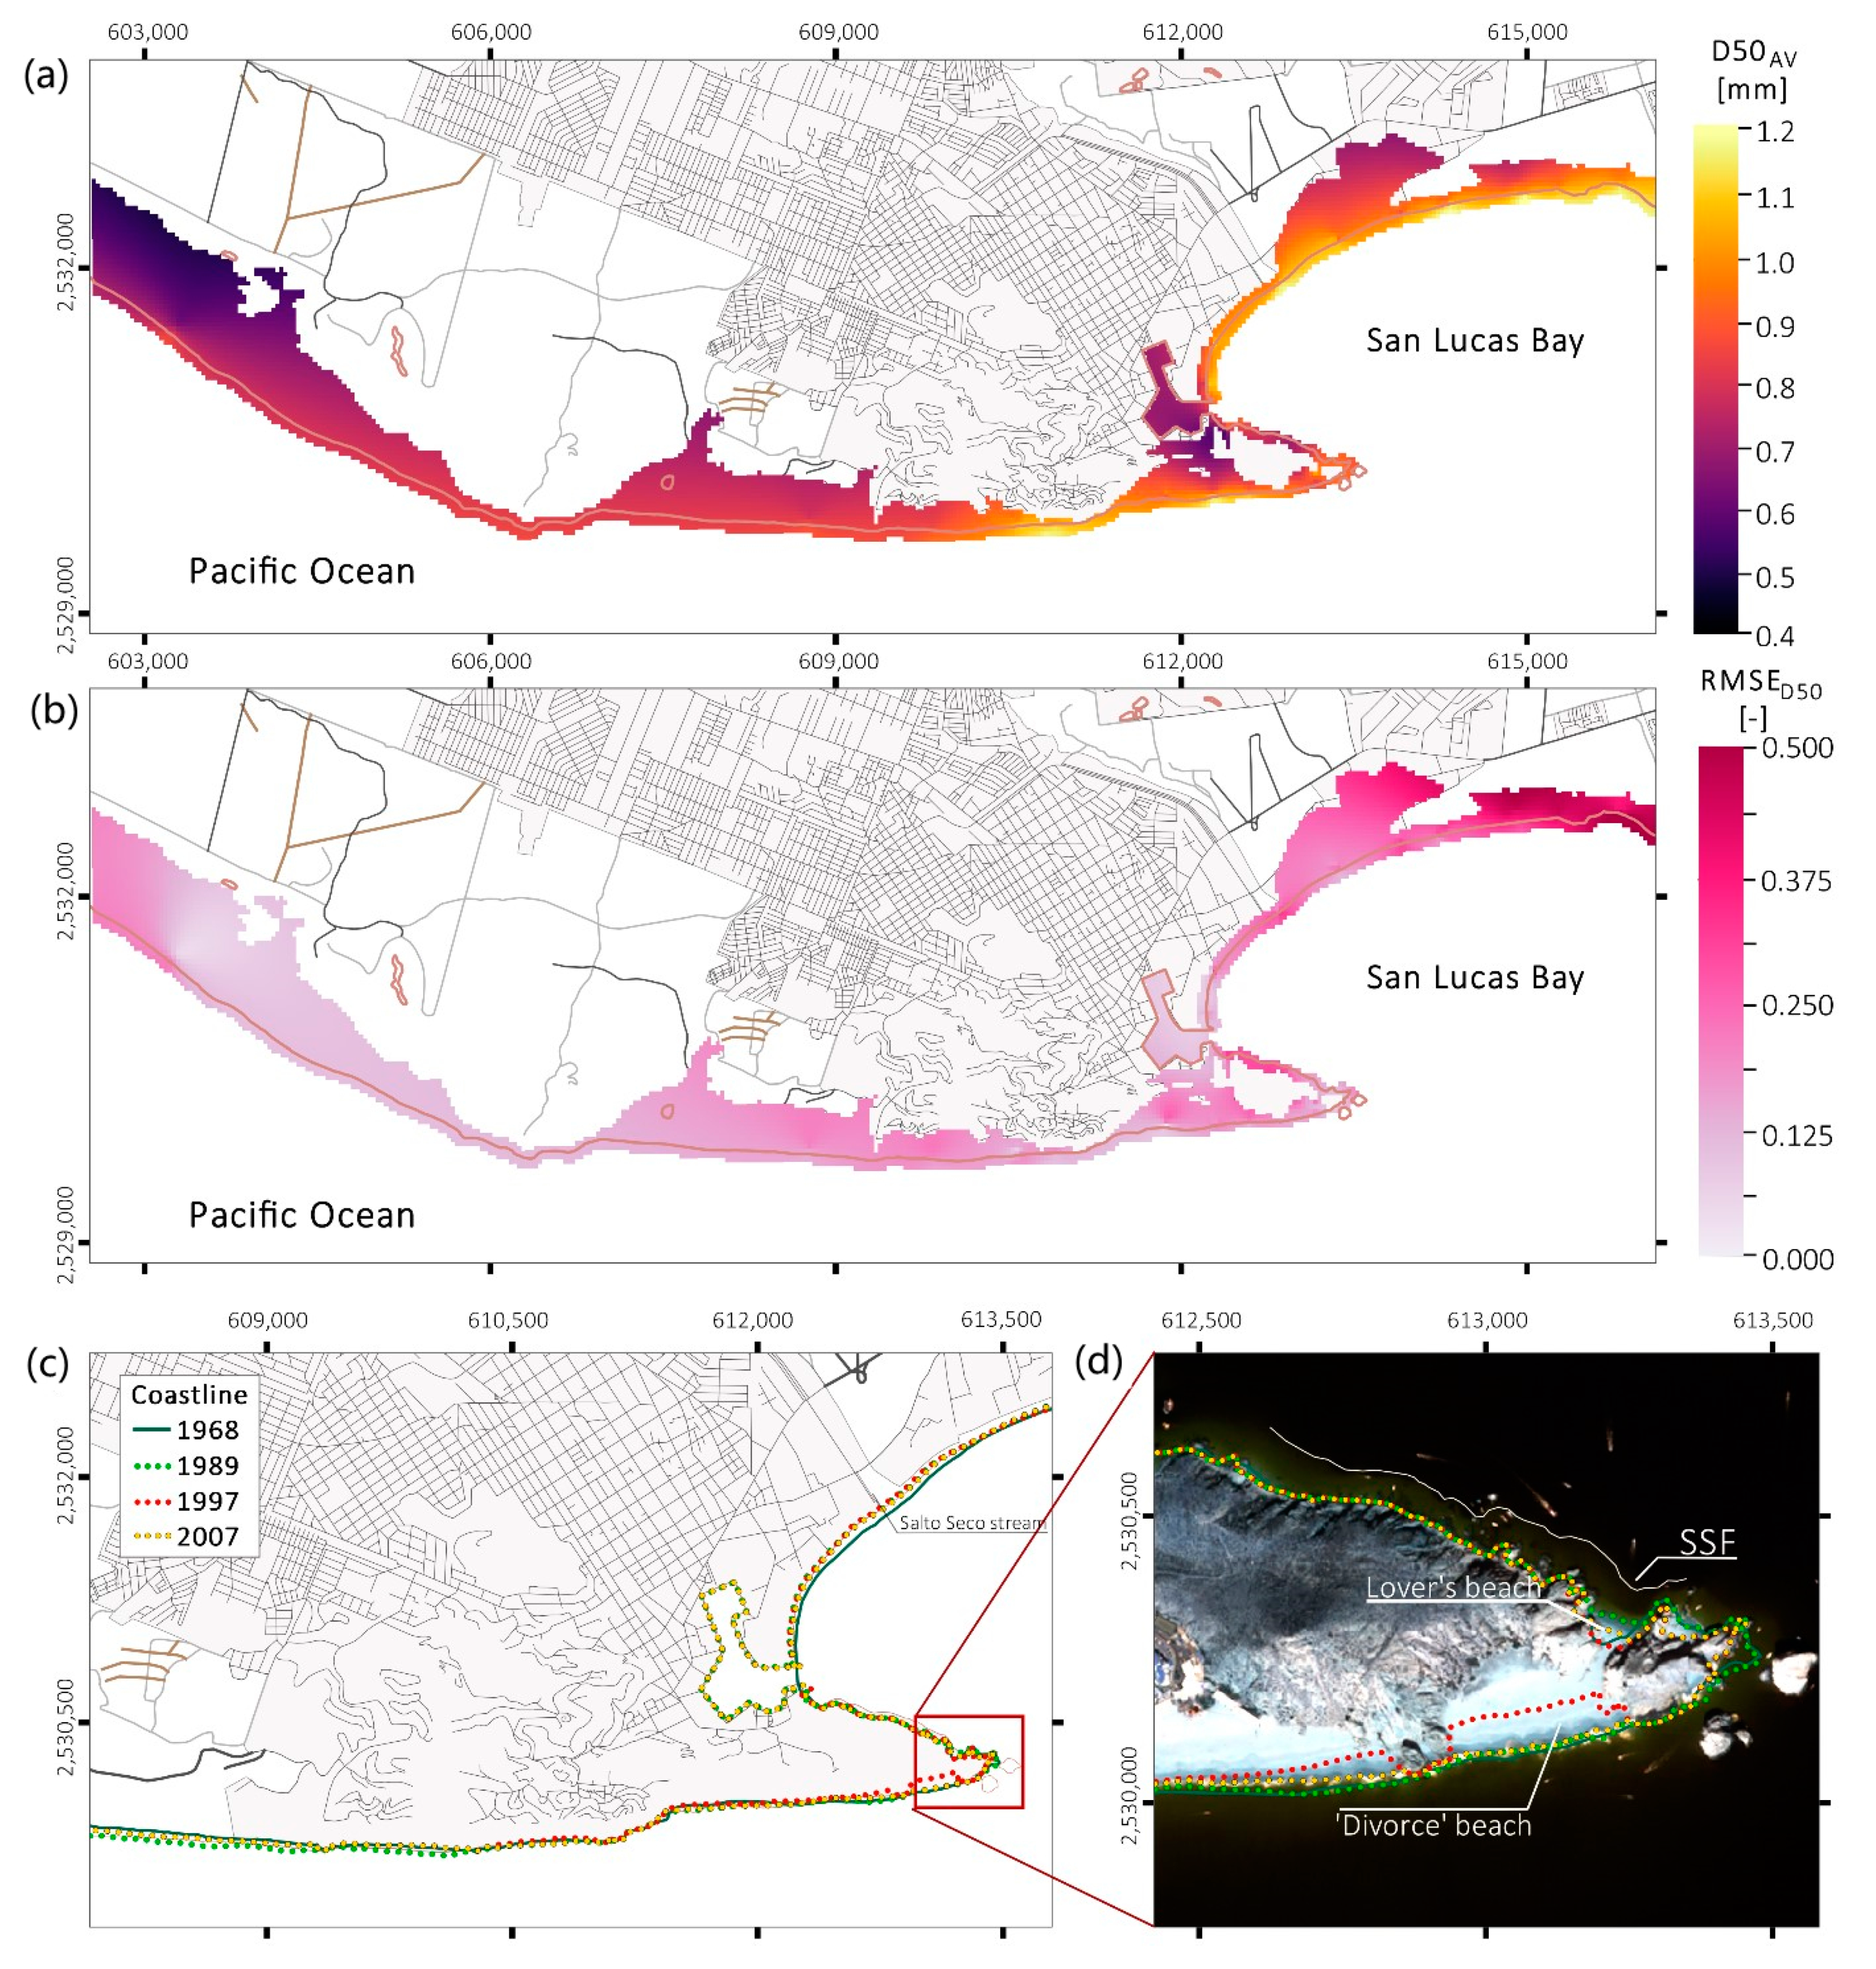
  • Pacific coastline. The average grain size is D50 = 0.803 ± 0.243 mm, with a mean value of 0.939 mm for the breaker/submerged zones, decreasing gradually to the swash zone (0.825 mm) and the beach face dunes (0.699 mm). The finest sediment (0.335 mm) is found on the dunes west of Cape Falso. The coarsest sand is found near Cerro Prieto (1.615 mm), particularly in the swash zone. Pocket beaches have homogeneous grain size distribution with coarser values observed near the headlands.
  • Submarine sand falls. The sand falls are inside San Lucas Bay, close to the arch of Cabo San Lucas. Most of the sediment is submerged and has a grain size of D50 = 0.796 ± 0.325 mm (i.e., smaller than that of the breaker/submerged zones on the Pacific and San Lucas Bay shorelines). The finest grain sizes (0.342–0.389 mm) belong to sand samples taken from depths > 18.3 m.
  • San Lucas Bay coastline. On average, the sediment on this coastline is the coarsest in the study area, D50 = 0.884 ± 0.353 mm. Around the Salto Seco stream and Cape Bello, the grain sizes are up to 1.995 mm. At the east end of the bay, coral fragments were found. Sediment deposition from the Salto Seco stream normally occurs after intense and intermittent rainfall, further transported along the coastline. The finest sediments are found close to the submarine sand falls and the port (0.428 mm), as well as on the dunes (0.794 mm). Like the Pacific coastline, there is a gradual decrease in sediment size from the breaker to the beach face and dunes zones.
The sediment on the dunes around Cabo San Lucas is finer on the Pacific side than on the San Lucas Bay coastline. According to [39], this is mainly due to the aeolian processes over the dunes on the Pacific coastline. In San Lucas Bay, these processes and alluvial sediment deposition are combined.
Figure 5b shows the spatial and temporal variation of sediment grain size, based on the estimation of RMSED50. There is greater variation between the years on the San Lucas Bay coastline than on the Pacific, mainly near Cape Bello, at the dunes, beach face, swash, and breaker zones. Further variations are seen at the mouth of the Salto Seco stream (RMSED50 ≈ 0.326), where RMSED50 is related to areas with large sediment grain sizes. On the other hand, the beach face and dunes west of Cape Falso have the lowest temporal variation, with an RMSED50 < 0.125. Similar results occur around Cape Falso and Cerro Prieto on the Pacific coastline, as well as within the port and close to the submarine sand falls, with RMSED50 values 0.099–0.195 at the submarine sand falls, increasing to 0.308 between the submarine sand falls and the port.
Coastline changes from 1968 to 2007 are shown in Figure 5c,d. The most relevant modification is the port of Cabo San Lucas, an excavation of ~0.22 km2 in the continental mass, made in 1973. Further shoreline changes are found around the mouth of the Salto Seco stream, Cape San Lucas, and El Faro beach. A general retreat of the shoreline occurs within San Lucas Bay and close to the submarine sand falls, 1968–1989 (Figure 5c). Between the port of Cabo San Lucas and Cape Bello, retreat (−) or accretion (+) was of about −117,000 m2 (1968–1989), −1000 m2 (1989–1997), and −9900 m2 (1997–2007). On the other hand, around El Faro beach, retreat (−) or accretion (+) was of +91,000 m2, −86,000 m2, +131,00 m2 for the same periods. Severe coastline changes occurred in 1989 at the Divorce and Lover’s beaches close to the submarine sand falls, with a temporal retreat of ~70 m and ~50 m, respectively (Figure 5d). The shoreline dynamism is more pronounced at the Lover’s beach (Figure 5d).
In addition to sediment and coastline changes, the pressure caused by infrastructures varies, being particularly intense in San Lucas Bay (Figure 6). Profiles 1–5 have a maximum elevation of 3–5 m with a small berm. In profile 3 particularly, the infrastructure lies directly on top of the beach face (with a width of 15.8 m). The shape of profile 4 is due to the bar at Salto Seco, which is disrupted in extreme rainfall events.
Profiles 6–8 have a steep beach face followed by a berm and well-developed primary dunes. The dune crests reach up to 20 m in height and are interrupted behind by a highway. Beach widths in these profiles vary from 100 to 200 m. The pressure caused by the growth of the city and tourism is currently most seen in profiles 1 to 5. The profiles 6–8 are included in the natural protected areas.

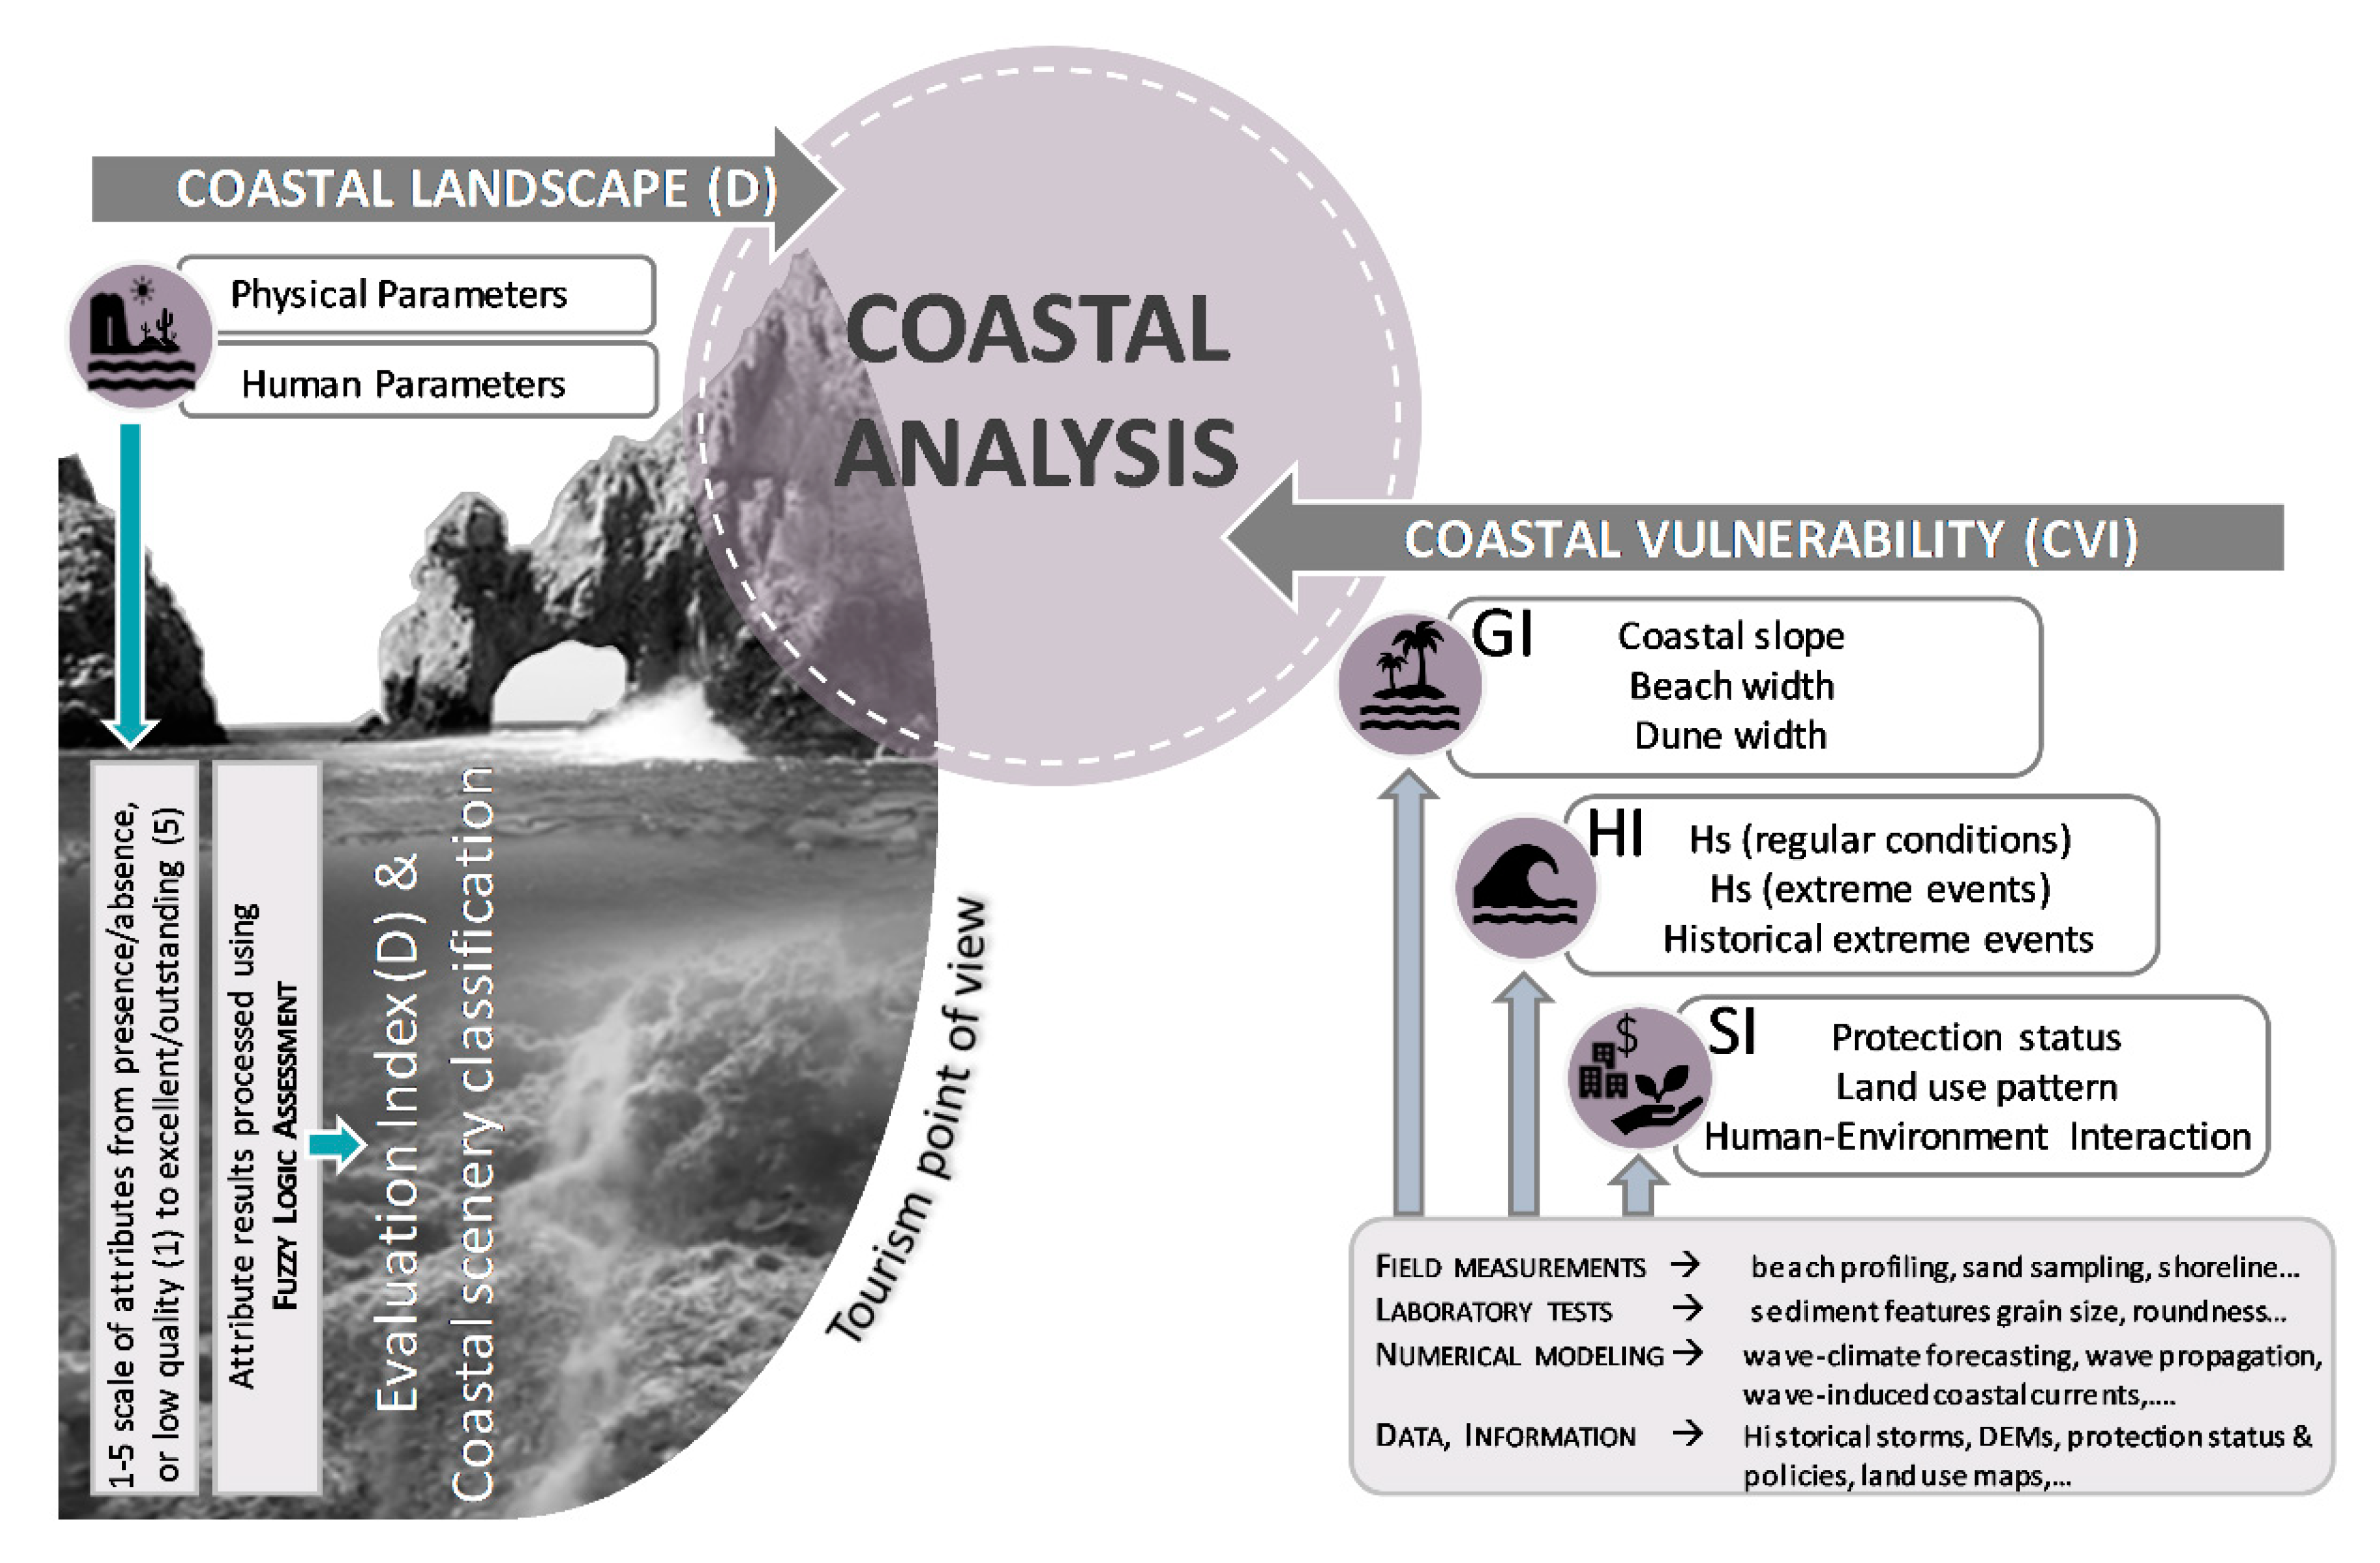
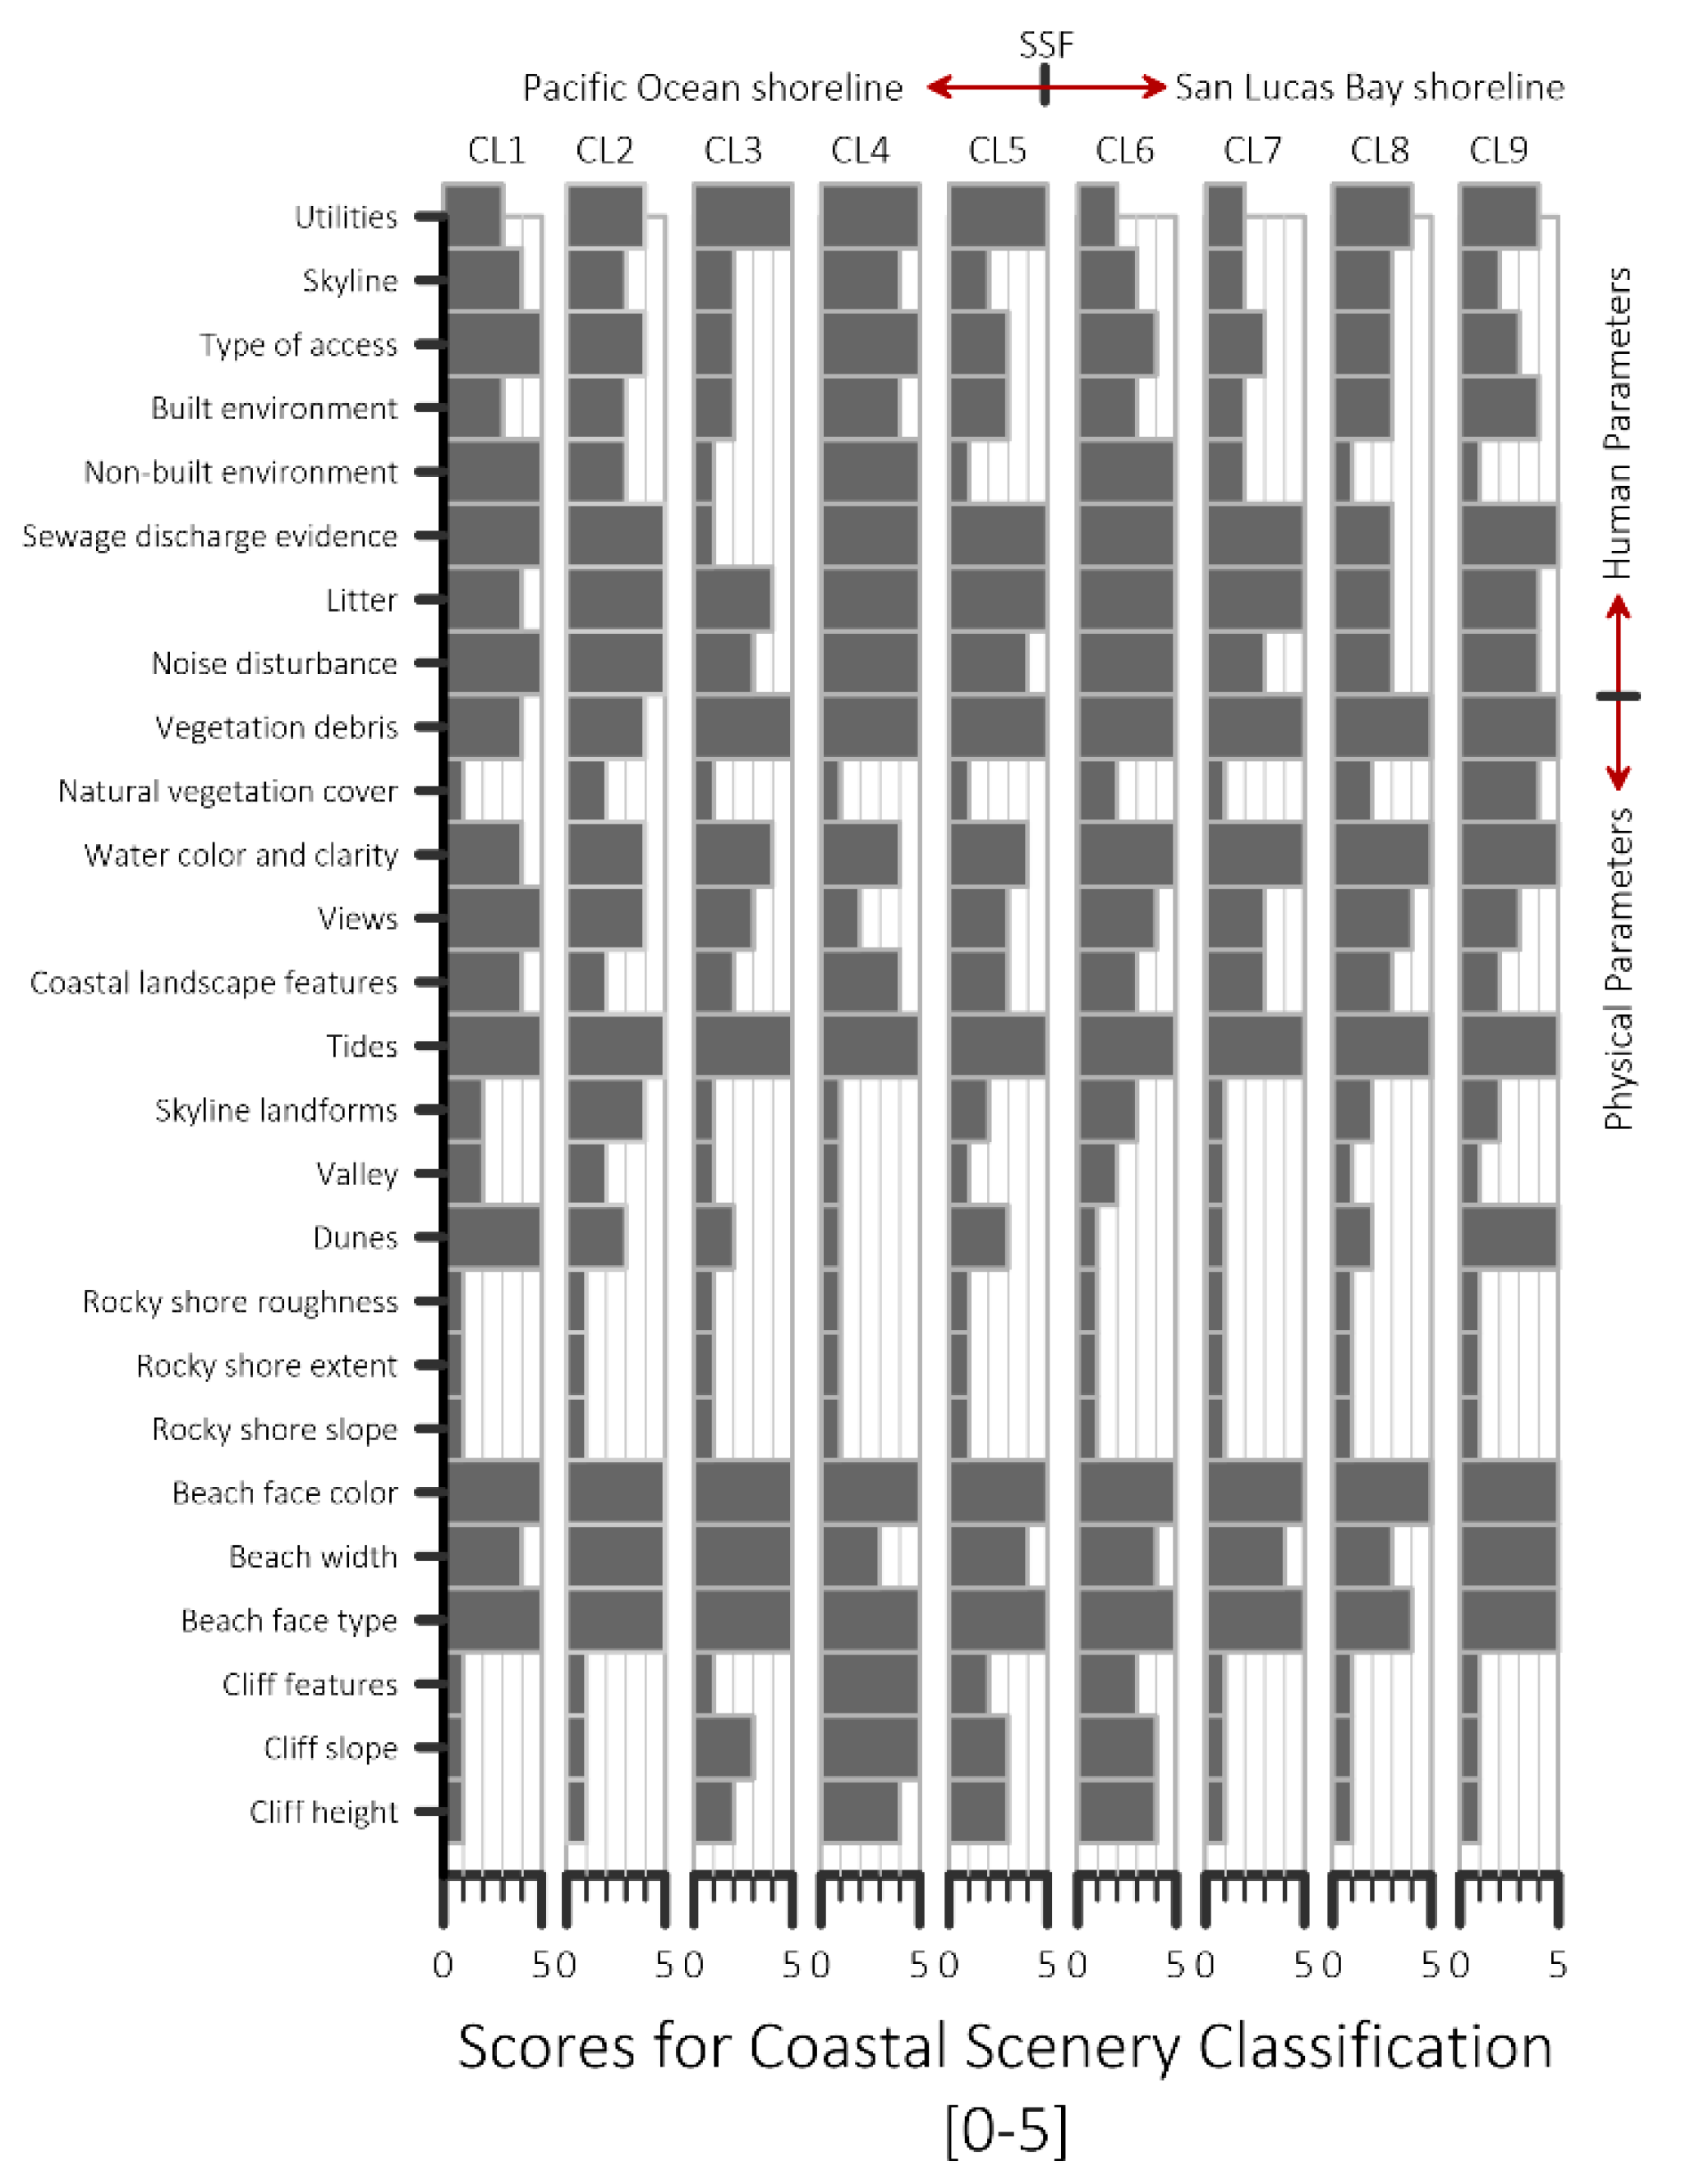
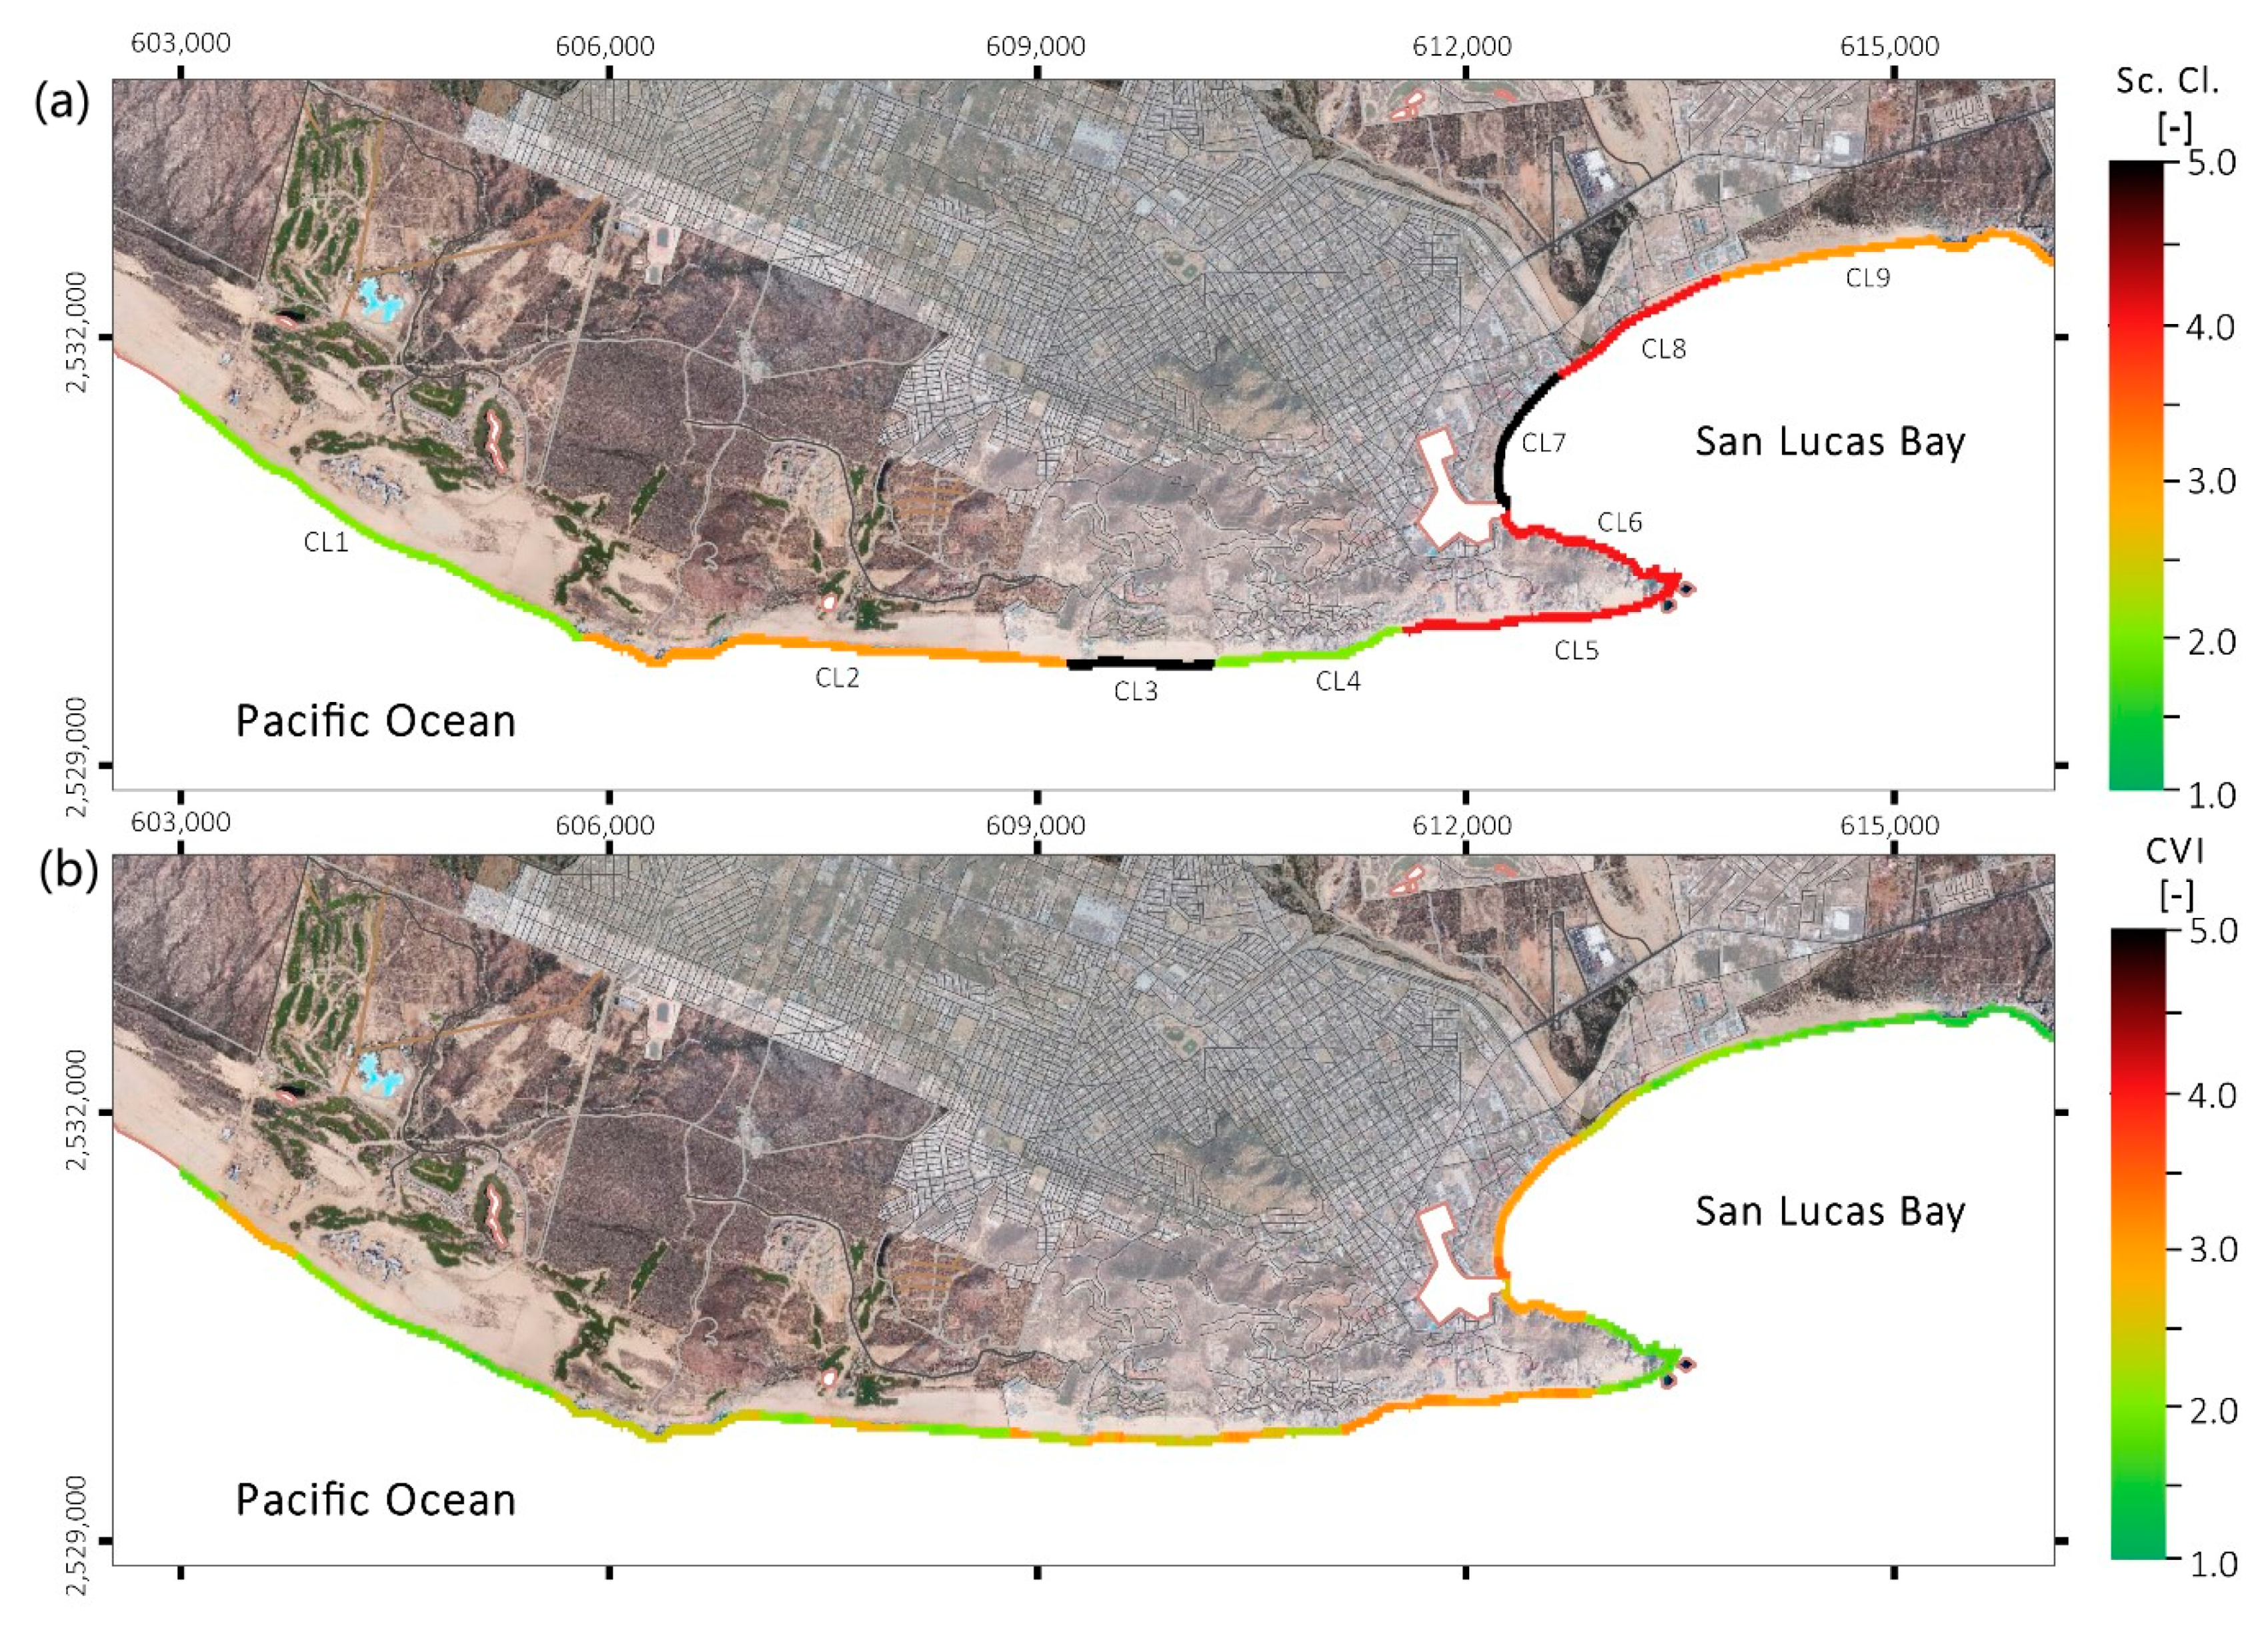
3.4. Coastal Scenery Classification and Vulnerability

Human and physical parameters are scored to provide a scale to evaluate what constitutes a beautiful coastal scene [56]. The sites assessed in the study area are described in Figure 7 and Figure 8a. The highest scores (≥4) were given by the clear, dark blue waters in Cabo San Lucas, due to the absence of suspended sediment, as river discharges are limited to extreme rainfall events in storm conditions. This sediment rapidly settles due to its coarseness and density. Behind the beach, the dunes in the study area also score highly (Figure 7). Cliff features (e.g., height, slope, indentation, banding, screes, irregular profile) are most valuable in the coastal scenery close to the submarine sand falls. Due to the arid climate, vegetation debris on the coast linked to land plants is rarely found, and sandy, golden beaches composed of terrigenous sediment are the norm. Microtidal conditions are found, and there is little to no noise disturbance.
Scores ≤3 were given to elements considered undesirable for tourism or related human activities, such as the steep rocky cliffs with short extent, and absent roughness. In some places, evidence of sewage discharge, close to resort areas or urban developments, also conferred negative ratings. The beach features close to the submarine sand falls score lower than those in the rest of the study area, but the non-built environment, cliffs, and other coastal features (e.g., rocky ridges, arches, caves) increase the overall score. Values related to the built environment are low (≤2), especially at CL3 and CL7, where buildings cater to large-scale tourism (Figure 7 and Figure 8a).
In the Evaluation Index (D) for coastal scenery, CL3 and CL7 received values of D = −0.25 and D = −0.31, respectively (i.e., Scenery Class 5, Table 1). At these sites, the built environment is linked to intense tourism development, flat skylines, sewage discharge, bare natural vegetation cover, and no dune formations, as the buildings and infrastructure were built on top of them (Figure 8a). For CL5, CL6, and CL8, the Evaluation Index was 0.25, 0.37, and 0.06, respectively (i.e., Scenery Class 4, Figure 8a), mostly due to the built environment and limited beach widths, especially compared to the other sites (Figure 6). There are no cliffs in CL8, whereas evidence of sewage discharge, litter, and noise disturbance was found.
Sites CL2 and CL9 had D values of 0.47 and 0.45, respectively (Scenery Class 3). These sites are described as natural sites, with light tourism and low urban development, but with limited landscape features. They have not yet fully embraced tourism or built urban infrastructure but have begun to display early-medium stages of development.
The best category for coastal scenery, Class 2, was given to CL1 and CL4 on the Pacific shoreline (Figure 8a). CL1 is an attractive natural site, where fields of dunes predominate, reaching 400–700 m inland. Open, sandy, golden beaches, cliffs, and extensive views are the outstanding features (Figure 7). However, beyond the dune areas, golf courses and village resorts, built between 2016 and 2020, stretch over the dunes. Tourism infrastructure could be further developed, affecting the current coastal scenery classification (Figure 8a). At CL4 almost all the human-related parameters scored ≥4. Even though the natural features are less attractive than those of other sites, the built environment here integrates smoothly into the cliffs. This built environment dates from 1975 and was designed not to affect the landscape.
Figure 8b shows the results of the analysis of coastal vulnerability. Most of the sites where natural conditions prevail have low values (CVI = 1.0–2.0). The beach and cliffs around the submarine sand falls and the dune fields on both shorelines have little infrastructure. In the west of the study area, at El Suspiro beach, the beach and dune field widths are 170–190 m and 450–600 m, respectively, while close to Cape Bello, inside San Lucas Bay, they are 70–90 m and 150–170 m, respectively.
Shorelines with intense urban and resort development have higher vulnerability values (CVI ≥ 3.0). Two areas with this classification are near Cape of San Lucas. The urban growth in San Lucas Bay is concentrated between the marina and the Salto Seco stream, therefore the vulnerability of these areas is high, despite the low scores for the hydrodynamic indicators here (Figure 3). On the Pacific side, at Cerro Prieto and the Cape of San Lucas, vulnerability is higher at resort areas. Although the tourist developments here are not as intensive as in other areas in San Lucas Bay, other hydrodynamic indicators increase the vulnerability.
The mean value for all the coastal cells in each zone is shown in Table 3. On both coasts, the slope is similar, but there are differences in beach and dune widths. The beaches and dunes are ~1.4 and 3.7 times more extensive on the Pacific coast, where hydrodynamic indicators related to the wave height and extreme events (i.e., tropical storms or hurricanes) are also higher. Therefore, if urban and resort development continues here, vulnerability will increase.

4. Discussion and Concluding Remarks

The coastal scenery classification and the coastal vulnerability were examined for Cabo San Lucas, where tourism development and particularly the submarine sand falls rely on the ecological, physical, and coastal processes taking place in the area.
The sediment size variation (coarse to fine, and in landward direction) (Figure 4b) attends to aeolian, fluvial, and marine transport processes in Cabo San Lucas (Figure 5a). Sediment tends to be driven from the dunes towards the submarine sand falls by wave-induced currents (Figure 3). [64] described this as the dominant pattern of sediment transport along the coast, with transport in the opposite direction during storm events. The extreme dynamism of this coastline is reflected in the high rates of retreat or accretion found close to the submarine sand falls (Figure 5d). This dynamism responds to progressive variations in wave action, wave-induced-currents, and sediment budget [65]. Intermittent phenomena, such as hurricanes and extreme wave events, may mobilize substantial masses of water and sediment [66,67]. Periodic high floods related to hurricanes increase the depositional loads on fan deltas [68], as occurs in the intermittent Salto Seco stream, whose sediment load is currently affected by the increase in urbanization. These episodes also shape the coastline in a dramatic way [27]. Ref [34] reported that the submarine sand falls are usually most active after storm periods (i.e., extreme wave events impact the subaerial and submarine environments).
In the 1990s and in the 2010s, there was a slight increase in the number of tropical storms and extreme wave conditions per year, with similar frequency to that of the Baja California peninsula [67,68]. From the results obtained in this work, no evident relationship with the ENSO is evident. This may be because the El Niño and La Niña events have a slight time lag (Figure 3). Ref [69] showed that the ONI explains better the multiannual wave climate variation in the tropical Pacific. Thus, further analyses are needed to see whether there are any relationships with local vulnerability as already described for climatology [70,71], fisheries [72], or nutrients [73].
The long-term coastline changes reflect the pressure exerted by the infrastructure near the coast (Figure 6), which reduces the elevation, slope, and sediment content in the area. Coastal slope, beach width, and dune conservation indicate the relative risk of inundation, the potential speed of shoreline retreat, and the resilience to extreme wave events and tropical storms [3,9,17,58]. The lower vulnerability conditions found (CVI = 1.0–2.0) are in sectors with large dune formations of 150–600 m (e.g., El Suspiro beach in the Pacific coast), considerable beach widths of 70–190 m (e.g., El Suspiro beach and near Cape Bello), or where the natural environment has national and international protection status, such as the submarine sand falls and the beaches between Salto Seco stream and Cape Bello. Vulnerability decreases around the submarine sand falls and at the limits of the study area (Figure 8b), but the coastal scenery classification is negatively affected by the urban and tourist infrastructures affecting the skyline (Figure 8a). In terms of landscape, it can be said that the most beautiful areas are those with cliffs and unique features, as also identified by [56]. The areas with intermediate values are close to urban areas. It may be possible to increase the coastal landscape value, and decrease its vulnerability, by enhancing the regulation on the extent of tourist/urban projects and ensuring that these are located away from sediment deposits, encouraging the amalgamation of the landscape and the built environment, enhancing and regulating the architectural design, avoiding shadows cast on beaches, reducing beach litter and sewage discharges, restoring marshes, and implementing monitoring strategies for a continuous vulnerability assessment. Sea level rise, increasing effects of storm surges due to climate change, should also be taken into account for infrastructure and the urban/recreational areas, to prevent risk and damage, as well as to improve future planning for tourism and urban development [74,75].
The current coastal landscape is under threat from the continuing urban growth in the area, with a 500% increase in population over the last three decades [44], and the vertiginous growth of internationally oriented tourism [76]. The vulnerability of the coastline is also likely to increase if coastal infrastructure on the Pacific continues unstopped. Coastal infrastructure on San Lucas Bay is now restricted due to the legislation regarding natural protected areas. The attractiveness of the landscape, the vulnerability of the area, and socioeconomic development are linked to current tourism market demands, policies, and environmental capacity, which should be a sustainable framework, to avoid “self-destructive tourism” [77].
Cabo San Lucas can undoubtedly boast pristine natural resources, in subaerial landscapes and natural submarine phenomena. Its geographical remoteness, yet international connectivity, make it a “peripheral region” as described by [76,78], where tourism is the primary economic activity, but not usually supported by integrated land–sea management [79]. Thus, the vulnerability of the coast depends on the understanding of risk sources associated with environmental and social changes [79,80,81] that, complemented by coastal landscape value assessments, could enhance co-adaptive strategies for the conservation of unique phenomena such as the submarine sand falls and their surrounding area. The integration of the Evaluation Index (D) for coastal landscape assessment as part of a socio-economic indicator within vulnerability analyses should be further explored, particularly for sites where tourism is the main economic driving force, thanks to their natural landscape beauty.

Author Contributions

Conceptualization, J.C.A.-H. and R.S.; methodology, J.C.A.-H., J.R.M.-H., G.A., and R.S.; software, J.C.A.-H., J.R.M.-H., and R.S.; validation, G.A. and R.S.; formal analysis, J.C.A.-H., J.R.M.-H., and M.E.C.-J.; investigation, J.C.A.-H., J.R.M.-H., and D.A.H.-A.; resources, R.S.; data curation, J.C.A.-H., J.R.M.-H., M.E.C.-J., and D.A.H.-A.; writing—original draft preparation, J.C.A.-H., J.R.M.-H., M.E.C.-J., and D.A.H.-A.; writing—review and editing, G.A. and R.S.; visualization, J.C.A.-H. and M.E.C.-J.; supervision, J.C.A.-H., G.A., and R.S.; project administration, R.S.; funding acquisition, R.S. All authors have read and agreed to the published version of the manuscript.

Funding

Funding is acknowledged from the Program of Postdoctoral Grants from II-UNAM and DGAPA-UNAM for the first author, for research studies 2014–2016, and from CONACYT for the Master studies of the second author.

Institutional Review Board Statement

Not applicable.

Informed Consent Statement

Not applicable.

Data Availability Statement

The data presented in this study are available on request from the corresponding author. The data are not publicly available due to the confidentiality agreement with the partner institutions.

Acknowledgments

Collaboration with Los Cabos COASTKEEPER, Andromeda Divers y más, Comisión Nacional de Áreas Naturales Protegidas (CONANP), CEMIE-Océano (CONACYT -SENER-Sustentabilidad Energética project: FSE-2014-06-249795 “Centro Mexicano de Innovación en Energía del Océano (CEMIE-Océano)”), and Secretaría de Marina (SEMAR) is gratefully recognized. The support of all hotels, resorts, and villages as well as permission to access their facilities in the study area is also thankfully appreciated. Special thanks are given to Jill Taylor for the revision of the manuscript and to Martha Huerta-Sánchez for the graphics assistance.

Conflicts of Interest

The authors declare no conflict of interest. The funders had no role in the design of the study; in the collection, analyses, or interpretation of data; in the writing of the manuscript, or in the decision to publish the results.

References

  1. Dal Cin, R.; Simeoni, U. A Model for Determining the Classification, Vulnerability and Risk in the Southern Coastal Zone of the Marche (Italy). J. Coast. Res. 1994, 10, 18–29. [Google Scholar]
  2. Vulnerability of the East Coast, U.S.A. to Future Sea Level Rise. Available online: http://www.jstor.org/stable/44868636 (accessed on 12 October 2020).
  3. Ramieri, E.; Hartley, A.; Barbantini, A.S.; Ilipe Duarte Gomes, A.; Hilden, M.; Laihonen, P.; Marinova, N.; Santini, M. Methods for assessing coastal vulnerability to climate change. In ETC CCA Technical Paper 1/2011; European Topic Centre on Climate Change Impacts, Vulnerability and Adaptation: Bologna, Italy, 2011; p. 93. [Google Scholar]
  4. Simeoni, U.; Tessari, U.; Gabbianeli, G.; Schiavi, C. Sea storm risk assessment in the Ravenna littoral (Adriatic Sea, Northern Italy). In Proceedings of the 6th International Conference on the Mediterranean Coastal Environment MEDCOAST 03, Ravenna, Italy, 7–11 October 2003; pp. 2223–2234. [Google Scholar]
  5. Adger, W.N. Vulnerability. Glob. Environ. Chang. 2006, 16, 268–281. [Google Scholar] [CrossRef]
  6. Davies, W.T.R. Applying a Coastal Vulnerability Index (CVI) to the Westfjords, Iceland: A Preliminary Assessment. Master’s Thesis, University of Akureyri, Akureyri, Iceland, 2012. [Google Scholar]
  7. Füssel, H.-M. Vulnerability: A generally applicable conceptual framework for climate change research. Glob. Environ. Chang. 2007, 17, 155–167. [Google Scholar] [CrossRef]
  8. Nelson, R.; Kokic, P.; Crimp, S.; Meinke, H.; Howden, S.M. The vulnerability of Australian rural communities to climate variability and change: Part I—Conceptualising and measuring vulnerability. Environ. Sci. Policy 2010, 13, 8–17. [Google Scholar] [CrossRef]
  9. McLaughlin, S.; Cooper, J.A.G. A multi-scale coastal vulnerability index: A tool for coastal managers? Environ. Hazards 2010, 9, 233–248. [Google Scholar] [CrossRef]
  10. Gornitz, V. Global coastal hazards from future sea level rise. Palaeogeogr. Palaeoclimatol. Palaeoecol. 1991, 89, 379–398. [Google Scholar] [CrossRef]
  11. Abuodha, P.A.; Woodroffe, C.D. Vulnerability assessment. In Coastal Zone Management; Thomas Telford Ltd.: London, UK, 2010; pp. 262–290. [Google Scholar]
  12. Szlafsztein, C.; Sterr, H. A GIS-based vulnerability assessment of coastal natural hazards, state of Pará, Brazil. J. Coast. Conserv. 2007, 11, 53–66. [Google Scholar] [CrossRef]
  13. Burzel, A.; Dassanayake, D.R.; Naulin, M.; Kortenhaus, A.; Oumeraci, H.; Wahl, T.; Mudersbach, C.; Jensen, J.; Gönnert, G.; Sossidi, K.; et al. Integrated flood risk analysis for extreme storm surges (XtremRisk). Coast. Eng. Proc. 2011, 1, 9. [Google Scholar] [CrossRef] [Green Version]
  14. De Pippo, T.; Donadio, C.; Pennetta, M.; Petrosino, C.; Terlizzi, F.; Valente, A. Coastal hazard assessment and mapping in Northern Campania, Italy. Geomorphology 2008, 97, 451–466. [Google Scholar] [CrossRef]
  15. Rangel-Buitrago, N.; Posada-Posada, B.O. Determination of the vulnerability and the coastal risk by the application of GIS tools and multicriteria methods. Rev. Intrópica 2013, 8, 29–42. [Google Scholar]
  16. Özyurt, G.; Ergin, A. Application of Sea Level Rise Vulnerability Assessment Model to Selected Coastal Areas of Turkey. J. Coast. Res. 2009, 248–251. [Google Scholar]
  17. Özyurt, G.; Ergin, A. Improving coastal vulnerability assessments to sea-level rise: A new indicator-based methodology for decision makers. J. Coast. Res. 2010, 262, 265–273. [Google Scholar] [CrossRef]
  18. Ergin, A.; Karaesmen, E.; Uar, B. A quantitative study for evaluation of coastal scenery. J. Coast. Res. 2011, 27, 1065–1075. [Google Scholar] [CrossRef]
  19. IPCC. Cambio Climático 2001. Impactos, Adaptación y Vulnerabilidad; Grupo Intergubernamental de Expertos sobre el Cambio Climático-Organización Mundial Meteorológica, OMM-PNUMA: New York, NY, USA, 2001; p. 101. [Google Scholar]
  20. Denner, K.; Phillips, M.R.; Jenkins, R.E.; Thomas, T. A coastal vulnerability and environmental risk assessment of Loughor Estuary, South Wales. Ocean Coast. Manag. 2015, 116, 478–490. [Google Scholar] [CrossRef]
  21. Musekiwa, C.; Cawthra, H.; Unterner, M.; Van Zyl, F. An assessment of coastal vulnerability for the South African coast. S. Afr. J. Geomat. 2015, 4, 123. [Google Scholar] [CrossRef] [Green Version]
  22. Kantamaneni, K.; Phillips, M.; Thomas, T.; Jenkins, R. Assessing coastal vulnerability: Development of a combined physical and economic index. Ocean Coast. Manag. 2018, 158, 164–175. [Google Scholar] [CrossRef]
  23. CIMSMyC. Política Nacional de Mares y Costas de México. Gestión Integral de las Regiones más Dinámicas del Territorio Nacional; Comisión Intersecretarial para el Manejo Sustentable de Mares y Costas-SEMARNAT: Mexico City, Mexico, 2012; p. 97. [Google Scholar]
  24. SECTUR. Agendas de Competitividad de los Destinos Turísticos de México 2013–2018. Los Cabos, Baja California Sur; Secretaría de Turismo: Mexico City, Mexico, 2014; p. 687. [Google Scholar]
  25. Guido-Aldana, P.; Ramírez-Camperos, A.; Godínez-Orta, L.; Cruz-León, S.; Juárez-León, A. Estudio de la erosión costera en Cancún y la Riviera Maya, México. Av. Recur. Hidrául. 2009, 20, 41–55. [Google Scholar]
  26. Valderrama-Landeros, L.H.; Martell-Dubois, R.; Ressl, R.; Silva-Casarín, R.; Cruz-Ramírez, C.J.; Muñoz-Pérez, J.J. Dynamics of coastline changes in Mexico. J. Geogr. Sci. 2019, 29, 1637–1654. [Google Scholar] [CrossRef] [Green Version]
  27. Navarro-Lozano, J.O. Caracterización Sedimentológica y Geomorfológica de los Ambientes Costeros en la Bahía San Lucas, Baja California Sur, México. Master’s Thesis, Centro Interdisciplinario de Ciencias Marinas, La Paz, Mexico, 2006. [Google Scholar]
  28. Hesp, P.A.; Walker, I.J. Coastal Dunes. In Treatise on Geomorphology; Elsevier Inc.: Amsterdam, The Netherlands, 2013; pp. 328–355. ISBN 9780080885223. [Google Scholar]
  29. Yañez-Arancibia, A.; Day, J.W. La zona costera frente al cambio climático- vulnerabilidad de un sistema biocomplejo e implicaciones en manejo costero. In Impactos del Cambio Climático Sobre la Zona Costera; Yañez-Arancibia, A., Ed.; INECOL-INE-SEMARNAT: Xalapa, México, 2010; pp. 13–35. [Google Scholar]
  30. Mazzoni, E. Unidades de paisaje como base para la organización y gestión territorial. Rev. Geogr. 2014, 2, 51–81. [Google Scholar]
  31. Rangel-Buitrago, N.; Gracia, C.A.; Anfuso, G.; Ergin, A.; Williams, A. Evaluation of Landscape Feature by Mathematical Logic in the Central Area of the Caribbean Colombian Coast. Études Caribéennes 2016. [Google Scholar] [CrossRef]
  32. UNESCO. Islands and Protected Areas of the Gulf of California. Available online: https://whc.unesco.org/en/list/1182 (accessed on 5 August 2020).
  33. Limbaugh, C.; North, W.; Steward, J. Rivers of Sand (Underwater Motion-Picture Report of Submarine Sand Movement); Scientific Diving Consultants-Scripps Institution of Oceanography: La Jolla, CA, USA, 1959. [Google Scholar]
  34. Dill, R.F. Features in the Heads of Submarine Canyons Narrative of Underwater Film. In Deltaic and Shallow Marine Deposits; Developments in Sedimentology; Elsevier: Amsterdam, The Netherlands, 1964; pp. 101–104. [Google Scholar]
  35. Cousteau, J.M.; Cousteau, J.Y.; Olmos, E.J.; Wilson, G. Cousteau’s Rediscovery of the World I. Sea of Cortez: Legacy of Cortez; TBS Productions Inc., The Costeau Group: Atlanta, GA, USA, 1987. [Google Scholar]
  36. Alcérreca-Huerta, J.C.; Montiel-Hernández, J.R.; Hernández-Avilés, D.A.; Silva-Casarín, R.; Coastkeeper, L.C.; Divers y más, A. Estudios Para el Monitoreo, Conservación y Manejo de los Recursos Naturales de las Cascadas de Arena Submarinas de Cabo San Lucas. Seguimiento y Continuación de Estudios; II-UNAM: Mexico City, Mexico, 2016. [Google Scholar]
  37. Silva, R.; Alcérreca-Huerta, J.C.; Hernández-Avilés, D.A.; Coastkeeper, L.C.; Divers y más, A. Estudios Para el Monitoreo, Conservación y Manejo de los Recursos Naturales de las Cascadas de Arena Submarinas de Cabo San Lucas; II-UNAM: Mexico City, Mexico, 2015. [Google Scholar]
  38. Schaaf, P.; Böhnel, H.; Pérez-Venzor, J. Pre-Miocene palaeogeography of the Los Cabos Block, Baja California Sur: Geochronological and palaeomagnetic constraints. Tectonophysics 2000, 318, 53–69. [Google Scholar] [CrossRef]
  39. Servicio Geológico Mexicano. Carta Geológico-Minera Cabo San Lucas F12-B54, Baja California Sur, 1:50000; Servicio Geológico Mexicano-Coordinación General de Minería-Secretaría de Economía: Mexico City, Mexico, 2008. [Google Scholar]
  40. UNESCO. List of World Heritage in Danger. Available online: http://whc.unesco.org/en/danger/ (accessed on 20 August 2020).
  41. Dávila López, A. Centros integralmente planeados (CIPS) en México: Las piezas del proyecto turístico de FONATUR. In Proceedings of the VI International Seminar on Urbanism Research Barcelona-Bogotá, Universitat Politècnica de Catalunya, Barcelona, Spain, 12 June 2014. [Google Scholar]
  42. Ganster, P.; Arizpe-Covarrubias, Ó.A.; Ivanova, A. Los Cabos: Prospective for a Natural and Tourism Paradise; San Diego State University, Institute for Regional Studies of the Californias: San Diego, CA, USA, 2012; ISBN 978-1-938537-00-4. [Google Scholar]
  43. García-Villa, A. La Planificación de Centros Turísticos de México; Editorial Limusa-Grupo Noriega Editores: Mexico City, Mexico, 1992; ISBN 968-18-4227-8. [Google Scholar]
  44. SETUESBCS. Los Cabos. Información Estratégica 2020; Gobierno del Estado de Baja California Sur-Secretaría de Turismo, Economía y Sustentabilidad (Dirección de Informática y Estadística): La Paz, Mexico, 2020. [Google Scholar]
  45. Bojorquez-Luque, J. Cabo San Lucas: Historia de su Urbanización, 1970–2011. Ph.D. Thesis, Universidad Autónoma de Sinaloa, Culiacán, Mexico, 2019. [Google Scholar]
  46. Ruiz-Martínez, G.; Silva, R.; Pérez-Romero, D.M.; Posada-Vanegas, G.; Buatista-Godínez, E.G. Modelo híbrido para la caracterización del oleaje. Ing. Hidrául. México 2009, XXIV, 5–22. [Google Scholar]
  47. Silva, R.; Ruiz-Martínez, G.; Posada-Vanegas, G.; Pérez-Romero, D.M.; Rivillas, G.; Espinal, J.; Mendoza, E. Atlas de Clima Marítimo de la vertiente Pacífica Mexicana; Instituto de Ingeniería, Universidad Nacional Autónoma de México: Mexico City, Mexico, 2008. [Google Scholar]
  48. Boccotti, P. Wave Mecahnics for Ocean Engineering; Elsevier Science B.V.: Amsterdam, The Netherlands, 2000; ISBN 0444 50380 3. [Google Scholar]
  49. Silva, R.; Borthwick, A.G.L.; Taylor, R.E. Numerical implementation of the harmonic modified mild-slope equation. Coast. Eng. 2005, 52, 391–407. [Google Scholar] [CrossRef]
  50. Silva, R.; Baquerizo, A.; Losada, M.Á.; Mendoza, E. Hydrodynamics of a headland-bay beach—Nearshore current circulation. Coast. Eng. 2010, 57, 160–175. [Google Scholar] [CrossRef]
  51. NOAA-NWS. Historical El Niño/La Niña Episodes (1950-Present). Available online: https://origin.cpc.ncep.noaa.gov/products/analysis_monitoring/ensostuff/ONI_v5.php (accessed on 15 August 2020).
  52. Krumbein, W.C. Measurement and geological significance of shape and roundness of sedimentary particles. SEPM J. Sediment. Res. 1941, 11. [Google Scholar] [CrossRef]
  53. Ergin, A.; Karaesmen, E.; Micallef, A.; Williams, A.T. A new methodology for evaluating coastal scenery: Fuzzy logic systems. Area 2004, 36, 367–386. [Google Scholar] [CrossRef]
  54. Ergin, A.; Karakaya, T.; Micallef, A.; Radic, M.; Williams, A.T. Coastal scenic evaluation: A study of some Dalmatian (Croatia) areas. J. Coast. Res. 2006, SI 39, 898–902. [Google Scholar]
  55. Rangel-Buitrago, N.; Correa, I.D.; Anfuso, G.; Ergin, A.; Williams, A.T. Assessing and managing scenery of the Caribbean Coast of Colombia. Tour. Manag. 2013, 35, 41–58. [Google Scholar] [CrossRef]
  56. Anfuso, G.; Williams, A.T.; Cabrera Hernández, J.A.; Pranzini, E. Coastal scenic assessment and tourism management in western Cuba. Tour. Manag. 2014, 42, 307–320. [Google Scholar] [CrossRef]
  57. Rangel-Buitrago, N. Coastal Scenery; Coastal Research Library; Springer International Publishing: Cham, Switzerland, 2019; Volume 26, ISBN 978-3-319-78877-7. [Google Scholar]
  58. Pantusa, D.; D’Alessandro, F.; Riefolo, L.; Principato, F.; Tomasicchio, G. Application of a Coastal Vulnerability Index. A Case Study along the Apulian Coastline, Italy. Water 2018, 10, 1218. [Google Scholar] [CrossRef] [Green Version]
  59. Montiel-Hernández, J.R. Vulnerabilidad del Paisaje litoral de Cabo San Lucas, Baja California Sur. Master’s Thesis, Universidad Nacional Autónoma de México, Mexico City, Mexico, 2019. [Google Scholar]
  60. Cogswell, A.; Greenan, B.J.W.; Greyson, P. Evaluation of two common vulnerability index calculation methods. Ocean Coast. Manag. 2018, 160, 46–51. [Google Scholar] [CrossRef]
  61. Karymbalis, E.; Chalkias, C.; Chalkias, G.; Grigoropoulou, E.; Manthos, G.; Ferentinou, M. Assessment of the sensitivity of the southern coast of the Gulf of Corinth (Peloponnese, Greece) to sea-level rise. Open Geosci. 2012, 4. [Google Scholar] [CrossRef]
  62. INEGI. Modelo Digital de Elevación Tipo Superficie con 5m de Resolución Derivado de Datos de Sensores Remotos Satelitales y Aerotransportados. F12B54xx [Projection UTM, Datum ITRF08, 1:10000]; INEGI: Mexico City, Mexico, 2014. [Google Scholar]
  63. NOAA. NOAA Historical Hurricane Tracks. Available online: https://oceanservice.noaa.gov/news/historical-hurricanes/ (accessed on 5 August 2020).
  64. Murillo-Jiménez, J.M.; Full, W.; Nava-Sánchez, E.H.; Camacho-Valdéz, V.; León-Manilla, A. Sediment sources of beach sand from the southern coast of the Baja California peninsula, México -Fourier grain shape analysis-. In Sedimentary Provenance and Petrogenesis: Perspectives from Petrography and Geochemistry; Arribas, J., Critelli, S., Johnsson, M.J., Eds.; Geological Society of America: Boulder, CO, USA, 2007; pp. 297–318. [Google Scholar]
  65. Rizzo, A.; Aucelli, P.P.C.; Gracia, F.J.; Anfuso, G. A novelty coastal susceptibility assessment method: Application to Valdelagrana area (SW Spain). J. Coast. Conserv. 2018, 22, 973–987. [Google Scholar] [CrossRef]
  66. Camacho-Valdéz, V.; Murillo-Jiménez, J.M.; Nava-Sánchez, E.H.; Turrent-Thompson, C. Dune and Beach Morphodynamics at Cabo Falso, Baja California Sur, Mexico: Response to Natural, Hurricane Juliette (2001) and Anthropogenic Influence. J. Coast. Res. 2008, 243, 553–560. [Google Scholar] [CrossRef]
  67. Nava-Sánchez, E.H.; Martínez-Flores, G.; Murillo-Jiménez, J.M. Factores que provocan la erosión de playas en Baja California Sur, México. Rev. Comuni. Cient. Tecnol 2018, 4, 305–316. [Google Scholar]
  68. Martínez-Gutiérrez, G.; Mayer, L. Huracanes en Baja California, México, y sus implicaciones en la sedimentación en el Golfo de California. GEOS 2004, 24, 57–64. [Google Scholar]
  69. Odériz, I.; Silva, R.; Mortlock, T.R.; Mori, N. ENSO Impacts on Global Wave Climate and Potential Coastal Hazards. J. Geophys. Res. Ocean. 2020. [Google Scholar] [CrossRef]
  70. Pavia, E.G.; Graef, F.; Reyes, J. PDO–ENSO Effects in the Climate of Mexico. J. Clim. 2006, 19, 6433–6438. [Google Scholar] [CrossRef]
  71. Ohman, M.D.; Mantua, N.; Keister, J.; García-Reyes, M.; McClatchie, S. ENSO impacts on ecosystem indicators in the California Current System. US CLIVAR Var. 2017, 15, 8–15. [Google Scholar]
  72. Rojas-Mendez, J.A.; Robinson-Mendoza, C.J. Effects of ENSO 1997 1998 on the distribution of small pelagic fish off the west coast of Baja California. Int. J. Environ. Health 2008, 2, 45. [Google Scholar] [CrossRef]
  73. Hernández-Carmona, G.; Riosmena-Rodríguez, R.; Serviere-Zaragoza, E.; Ponce-Díaz, G. Effect of nutrient availability on understory algae during El Niño Southern Oscillation (ENSO) conditions in Central Pacific Baja California. J. Appl. Phycol. 2011, 23, 635–642. [Google Scholar] [CrossRef]
  74. Wilbanks, T.; Fernandez, S. Climate Change and Infrastructure, Urban Systems, and Vulnerabilities; Island Press: Washington, DC, USA, 2013. [Google Scholar]
  75. Vallejo, L.; Mullan, M. Climate-resilient infrastructure: Getting the policies right. In OECD Environment Working Papers; OECD Publishing: Paris, France, 2017; Volume 121, p. 74. [Google Scholar] [CrossRef]
  76. Gamez, A.; Angeles, M. Borders within. Tourism growth, migration and regional polarization in Baja California Sur (Mexico). J. Borderl. Stud. 2010, 25, 1–18. [Google Scholar] [CrossRef]
  77. Davenport, J.; Davenport, J.L. The impact of tourism and personal leisure transport on coastal environments: A review. Estuar. Coast. Shelf Sci. 2006, 67, 280–292. [Google Scholar] [CrossRef]
  78. Moscardo, G. Peripheral Tourism Development: Challenges, Issues and Success Factors. Tour. Recreat. Res. 2005, 30, 27–43. [Google Scholar] [CrossRef]
  79. Kelly, P.M.; Adger, W.N. Theory and Practice in Assessing Vulnerability to Climate Change and Facilitating Adaptation. Clim. Chang. 2000, 47, 325–352. [Google Scholar] [CrossRef]
  80. Koroglu, A.; Ranasinghe, R.; Jiménez, J.A.; Dastgheib, A. Comparison of Coastal Vulnerability Index applications for Barcelona Province. Ocean Coast. Manag. 2019, 178, 104799. [Google Scholar] [CrossRef]
  81. Smit, B.; Wandel, J. Adaptation, adaptive capacity and vulnerability. Glob. Environ. Chang. 2006, 16, 282–292. [Google Scholar] [CrossRef]
Figure 1. Location of Cabo San Lucas, the submarine sand falls, the San Lucas Canyon, and the natural protected areas APFFCSL and WHNA. Beaches, capes, and hills along the shoreline are also shown, along with sand sampling sites, numerical buoys, and views of the rocky outcrops of Los Frailes and the Arch of Cabo San Lucas (A), sand strips forming the passage between the Pacific Ocean and San Lucas Bay (B), and hotel developments (C).
Land 10 00027 g001
Figure 2. Methodology for the coastal analysis of vulnerability and landscape in Cabo San Lucas, based on geomorphological (GI), hydrodynamic (HI), and socioeconomic indicators for CVI, as well as on physical and human parameters for the Evaluation Index (D).
Land 10 00027 g002
Figure 3. Wave rose diagrams for (a) normal wave conditions and (b) extreme wave conditions based on M41 numerical buoy dataset. Wave propagation and wave-induced coastal currents results from WAPO and COCO2 models, respectively, considering HS = 1.60 m, TP = 13.4 s, W–E wave propagation (regular conditions), and HS = 3.30 m, TP = 12.3 s, SSE–NNW wave propagation (extreme conditions).
Land 10 00027 g003
Figure 4. Historical occurrence of (a) tropical storms (TS) and hurricanes (H1–H5) at a radius of 30 and 60 NM from Cabo San Lucas [63]; (b) storms, as defined by the significant wave height data from numerical buoys M39 and M41; and (c) Oceanic Niño Index (ONI) [51].
Land 10 00027 g004
Figure 5. Distribution maps of (a) average of sediment grain sizes (D50Av) (2015–2017 and 2020), and (b) variability of grain size RMSED50 (2015–2017 and 2020). (c) Coastline changes between 1968, 1989, 1997, and 2007. (d) Coastline changes for the Cape of San Lucas, where the submarine sand falls are found, for the same period.
Land 10 00027 g005
Figure 6. Beach profiles within San Lucas Bay, limited landward by infrastructure (e.g., hotels, restaurants, shopping centers, roadways).
Land 10 00027 g006
Figure 7. Human and natural scores given for the coastal landscapes (CL) assessed in the study area.
Land 10 00027 g007
Figure 8. Maps of the study area, showing (a) Scenery Classification (Sc. Cl.) according to Table 1 and (b) Coastal Vulnerability Index (CVI).
Land 10 00027 g008
Table 1. Coastal scenic classification and landscape components according to the methodology described in [53].
Coastal Scenic Classification
Class IExtremely attractive natural site with a high landscape value and Evaluation Index D ≥ 0.85.
Class IIAttractive natural sites with Evaluation Index 0.65 ≤ D < 0.85.
Class IIINatural sites with limited landscape features and Evaluation Index 0.40 ≤ D < 0.65.
Class IVUrbanized landscape with low landscape value and Evaluation Index 0.00 ≤ D < 0.40.
Class VIntense human development related to very unattractive urbanized landscapes and Evaluation Index D < 0.00.
Landscape Components Considered
PhysicalCliff (-height, -slope, -features); beach face (-type, -width, -color); rocky shore (-extent, -roughness); dunes; valley; skyline landforms; tides; coastal landscape features; views; water color and clarity; natural vegetation cover; vegetation debris.
HumanNoise disturbance; litter; sewage discharge evidence; non-built environment; built environment; type of access to the coast; skyline; utilities (power lines, pipelines, structures).
Table 2. Ranges of vulnerability for the CVI indicators (ai).
Type of IndicatorScore
Very Low (1)Low (2)Moderate (3)High (4)
GIa1Coastal slope a [%]>75 (rocky cliffs)50–7525–50<25 (beaches)
a2Beach width [m]>10050–10025–50<25
a3Dune width [m]>200150–200100–150<25
HIa4Wave height, HS (regular conditions) [m]0.0–0.50.5–1.51.5–2.02.0–2.5
a5Wave height, HS (extreme events) [m]4.0–6.06.0–8.08.0–10.0>10.0
a6Historical extreme events ratio b [-]Absent0.0–0.150.15–0.30>0.30
SIa7Protection status [-]National & InternationalInternationalNationalAbsent
a8Land use pattern [-]Dunes/Cliffs/Vegetation Beach/DunesAgriculture/RecreationalUrban/Industrial
a9Direct human–environment interaction c [Boolean: presence/absence]Absent Present
a The coastal slope was measured from the shoreline up to the limit with infrastructure or reaching the maximum littoral cell size landward (i.e., 200 m); b ratio of tropical storms or hurricanes which trajectory passed at a radius <5.0 NM of the littoral cell to those at a radius <30.0 NM, based on dataset from [63]; c dynamic interaction in space and time, generally related to landscape fragmentation, but also to the economic development based on the exploitation of the environment.
Table 3. Mean values for CVI assessment at Cabo San Lucas, the Pacific, and San Lucas Bay.
Type of IndicatorCOASTAL ZONE
Pacific OceanSan Lucas BayCSL
Coastal slope [%]9.712.610.1
Beach width [m]72.050.268.7
Dune width [m]142.538.7127.3
Wave height, regular events (HS) [m]1.5–2.00.5–1.51.5–2.0
Wave height, extreme events (HS,max) [m]8.0–106.0–8.06.0–10
Historical extreme events ratio [-]0.150.10.1
Protection status [-]---National & International
Land use pattern [-]Beach/Dunes/RecreationUrban & RecreationUrban & Recreation
Direct human–environment interaction [Absent–Present]PresentPresentPresent
CVI3.02.52.7
Publisher’s Note: MDPI stays neutral with regard to jurisdictional claims in published maps and institutional affiliations.

