Incorporating Rainfall-Runoff Events into Nitrate-Nitrogen and Phosphorus Load Assessments for Small Tile-Drained Catchments
Abstract
:1. Introduction
2. Materials and Methods
2.1. Experimental Sites
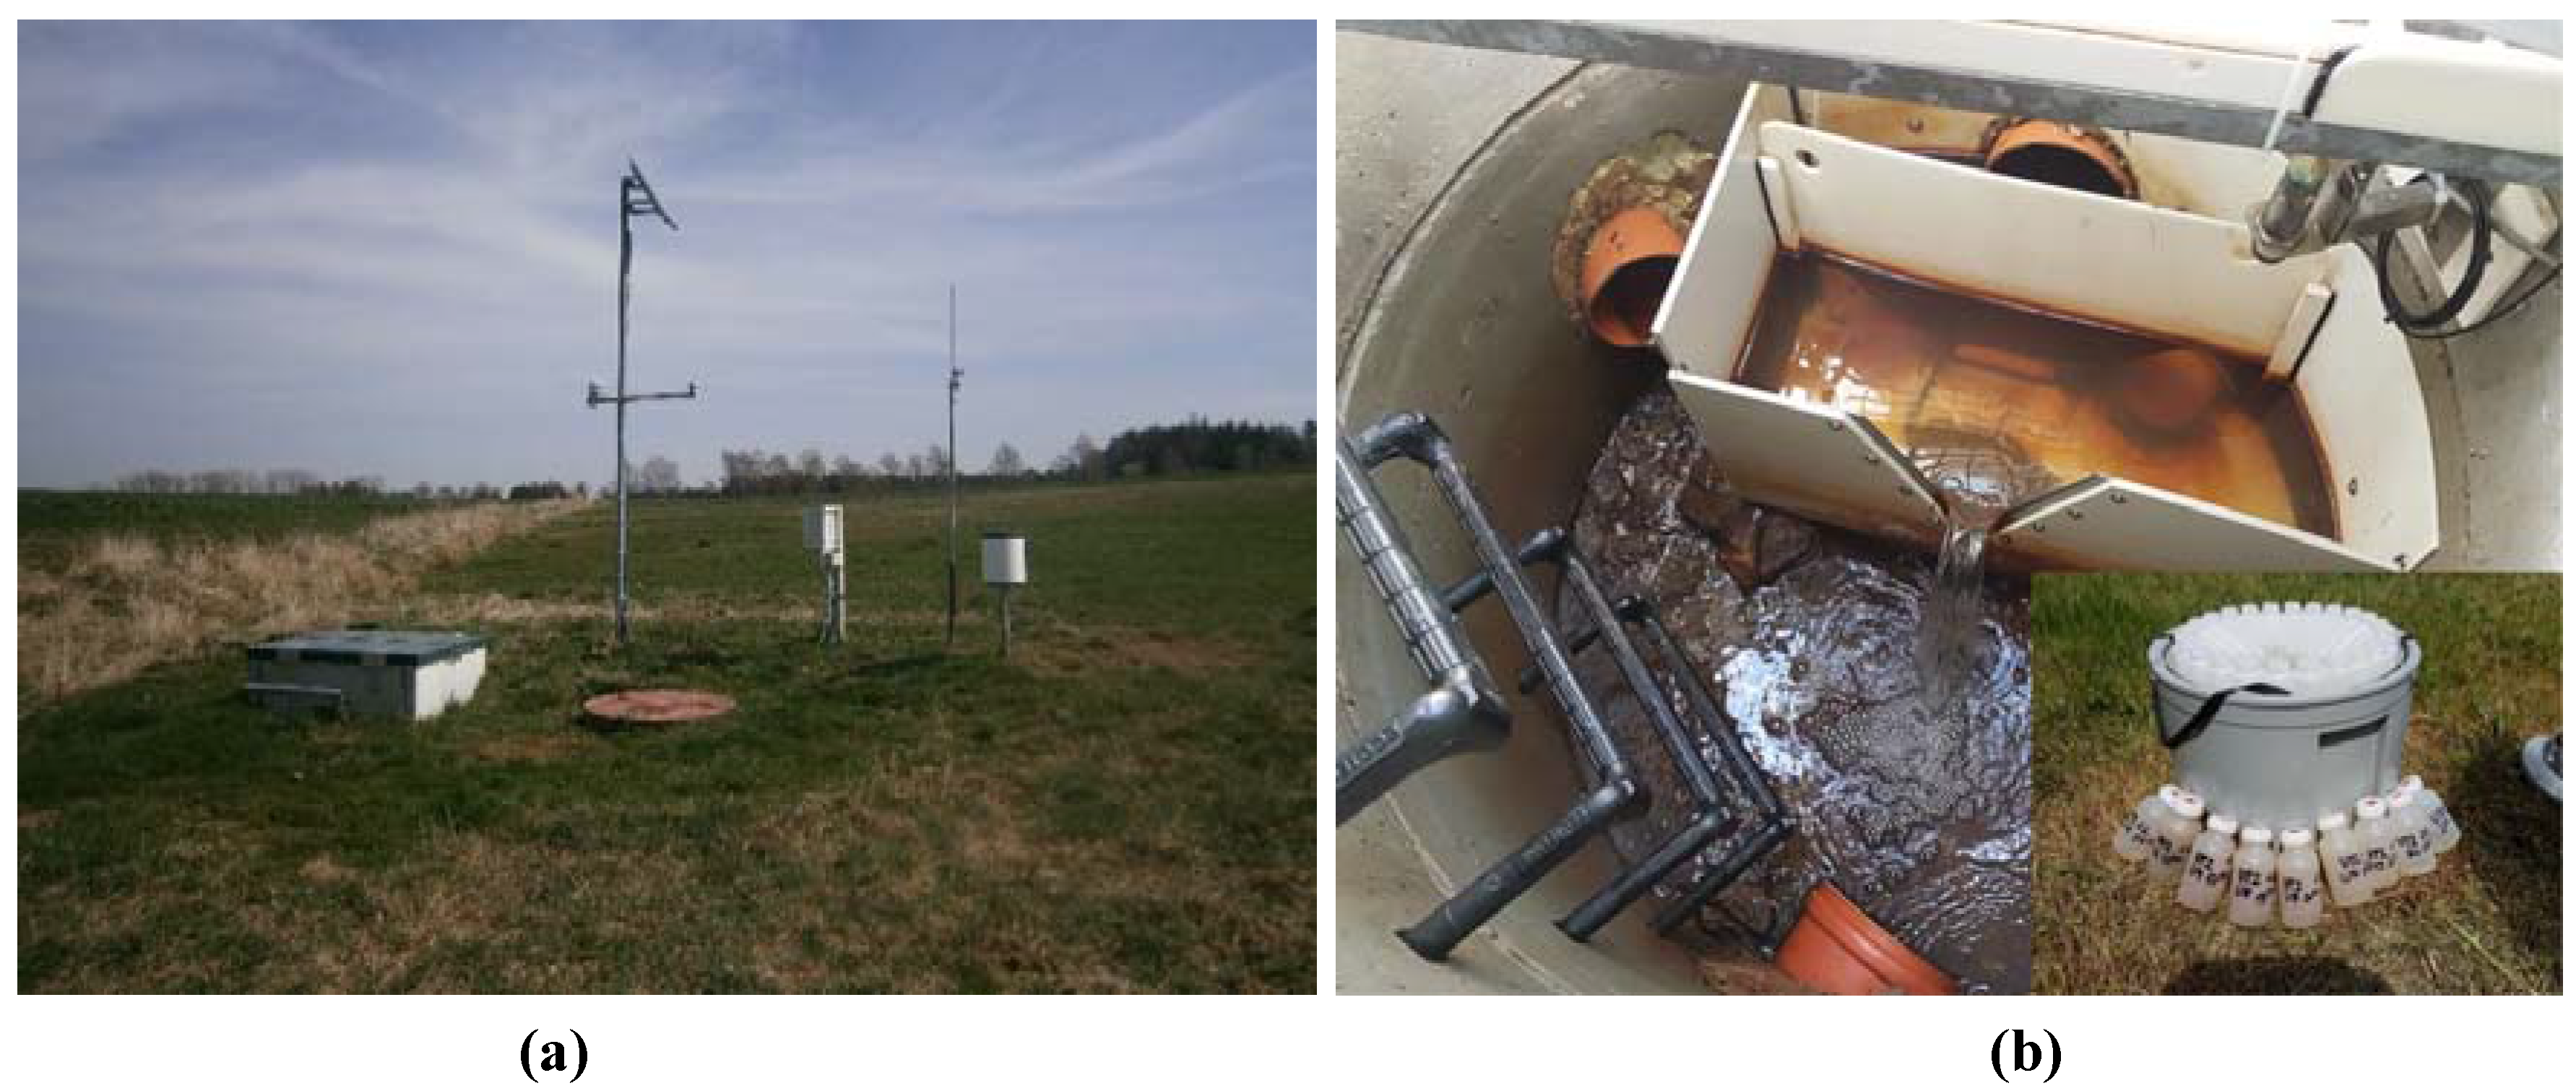
2.2. Monitoring the Setup and Analyses of Samples
2.3. Description of Applied Load Assessment Methods
2.4. Statistical Analyses and Comparison of Load Assessment Methods
3. Results
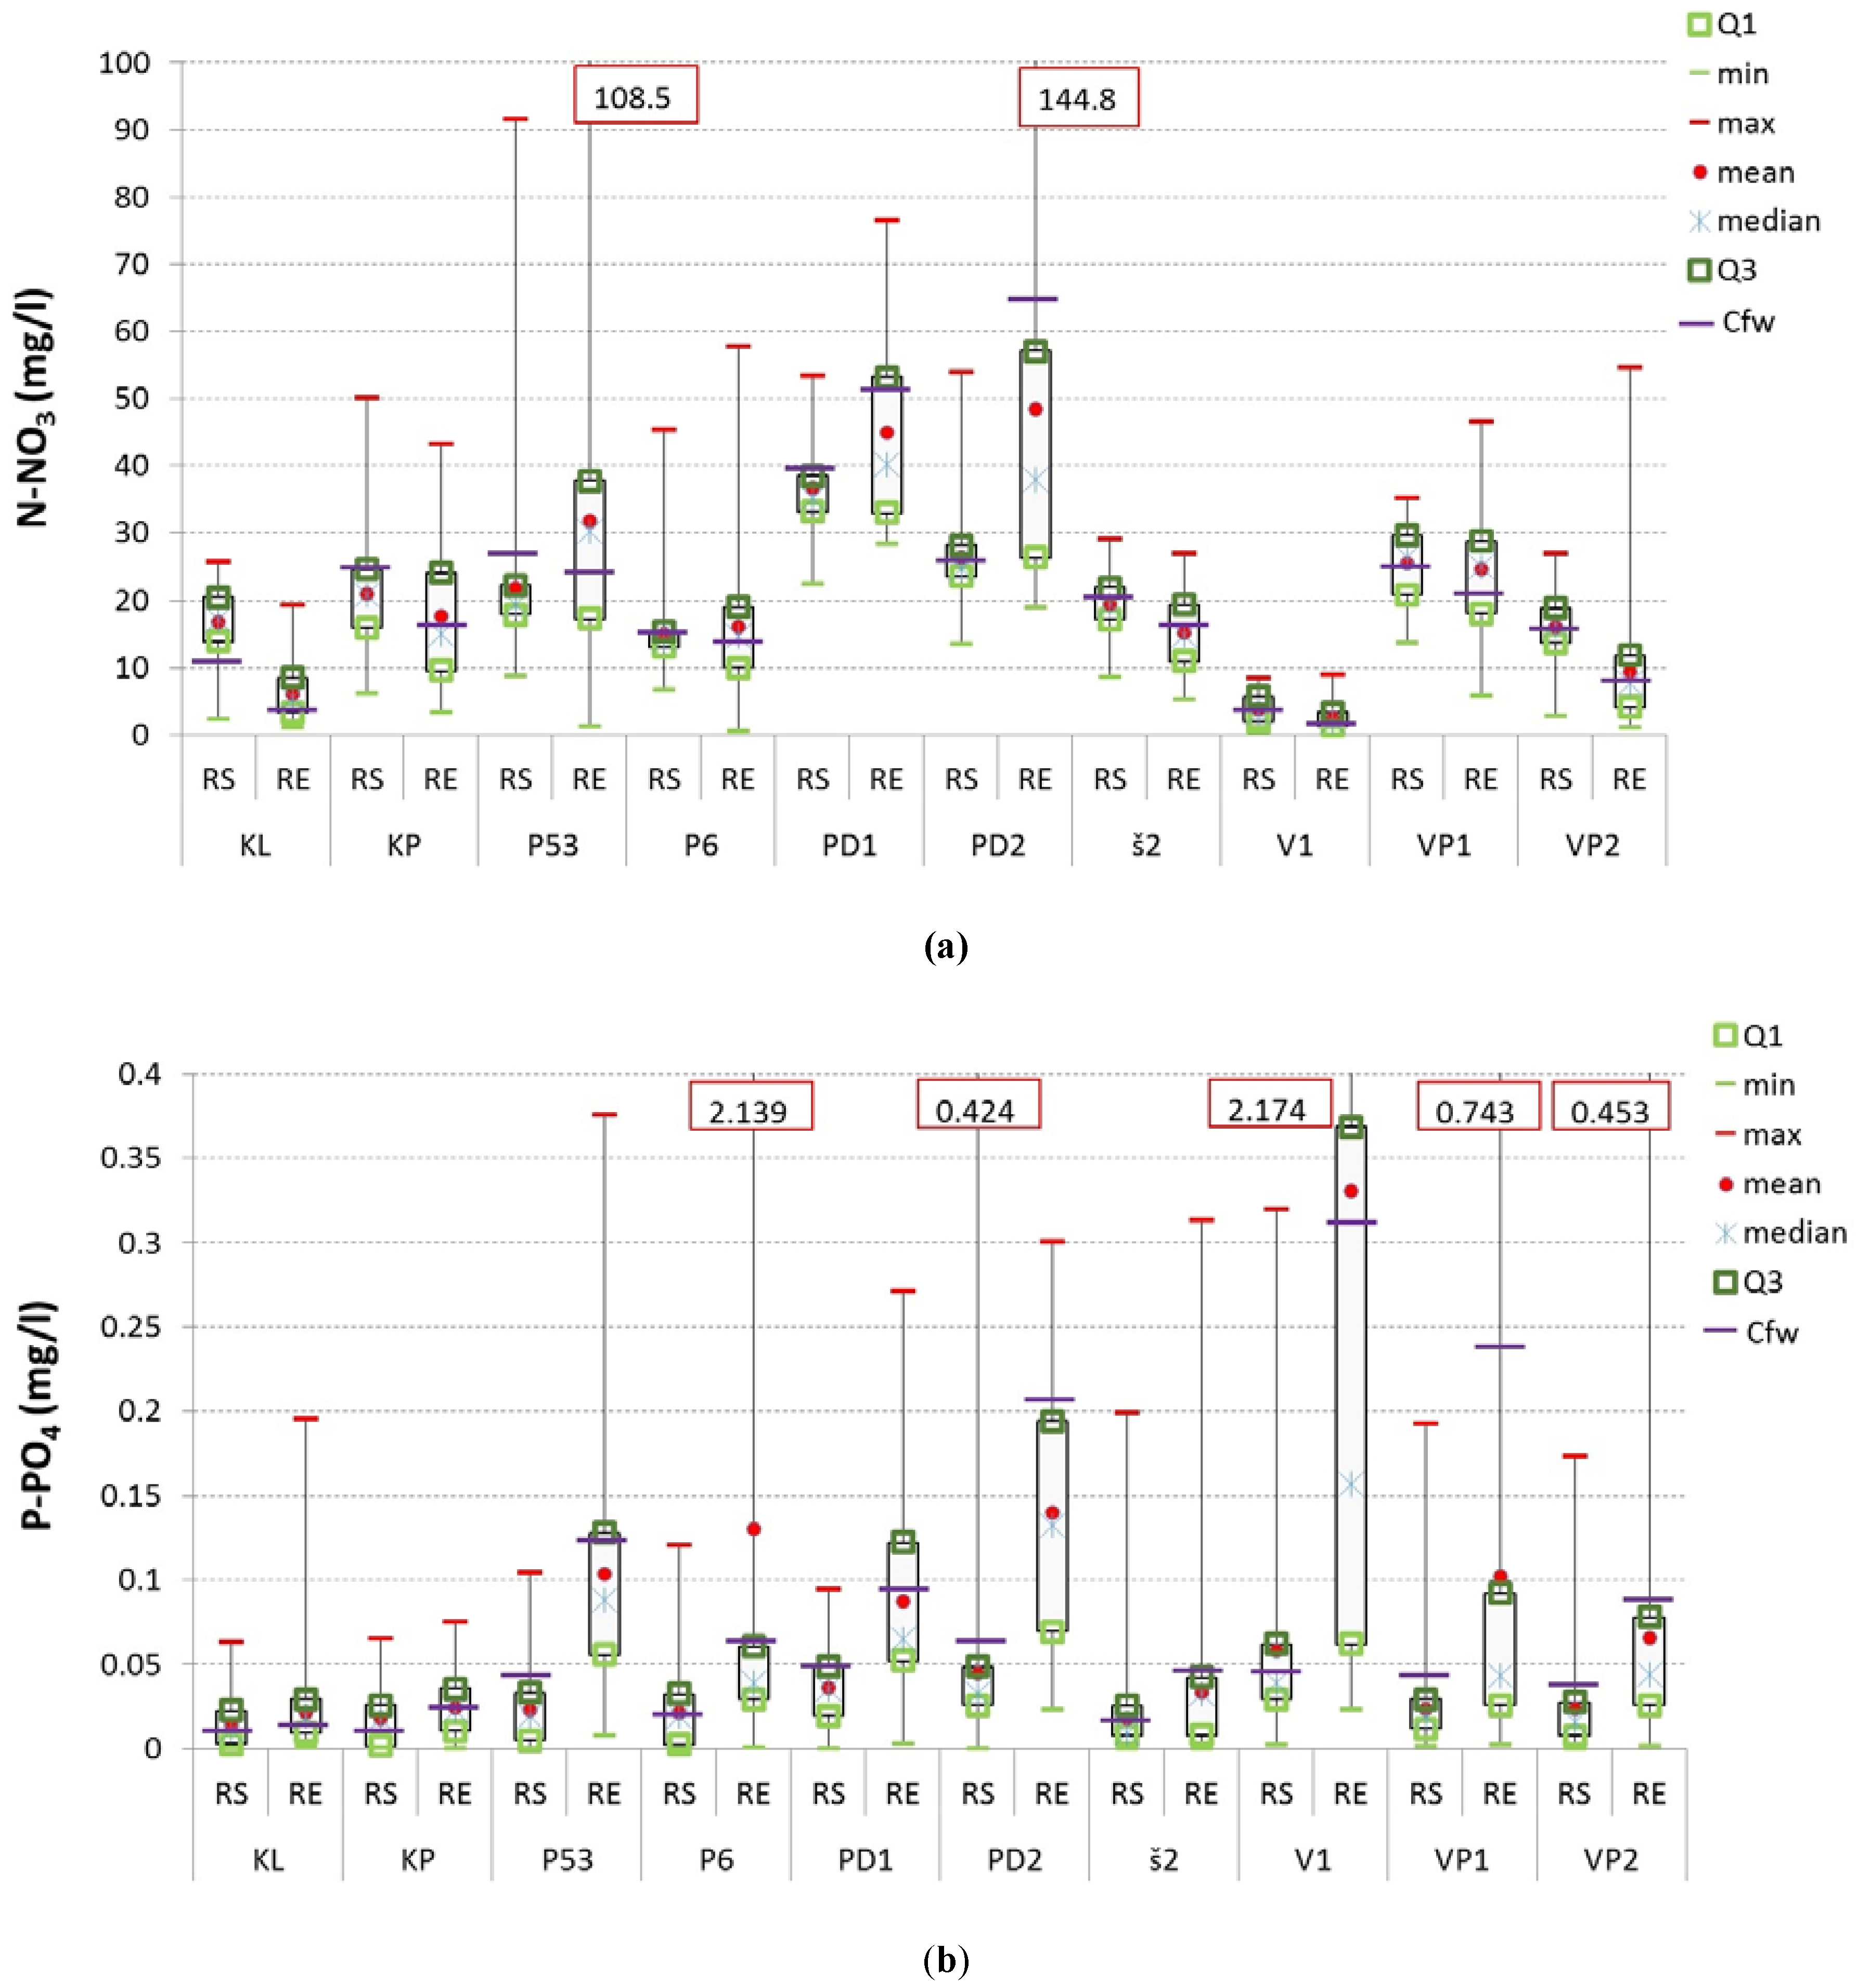
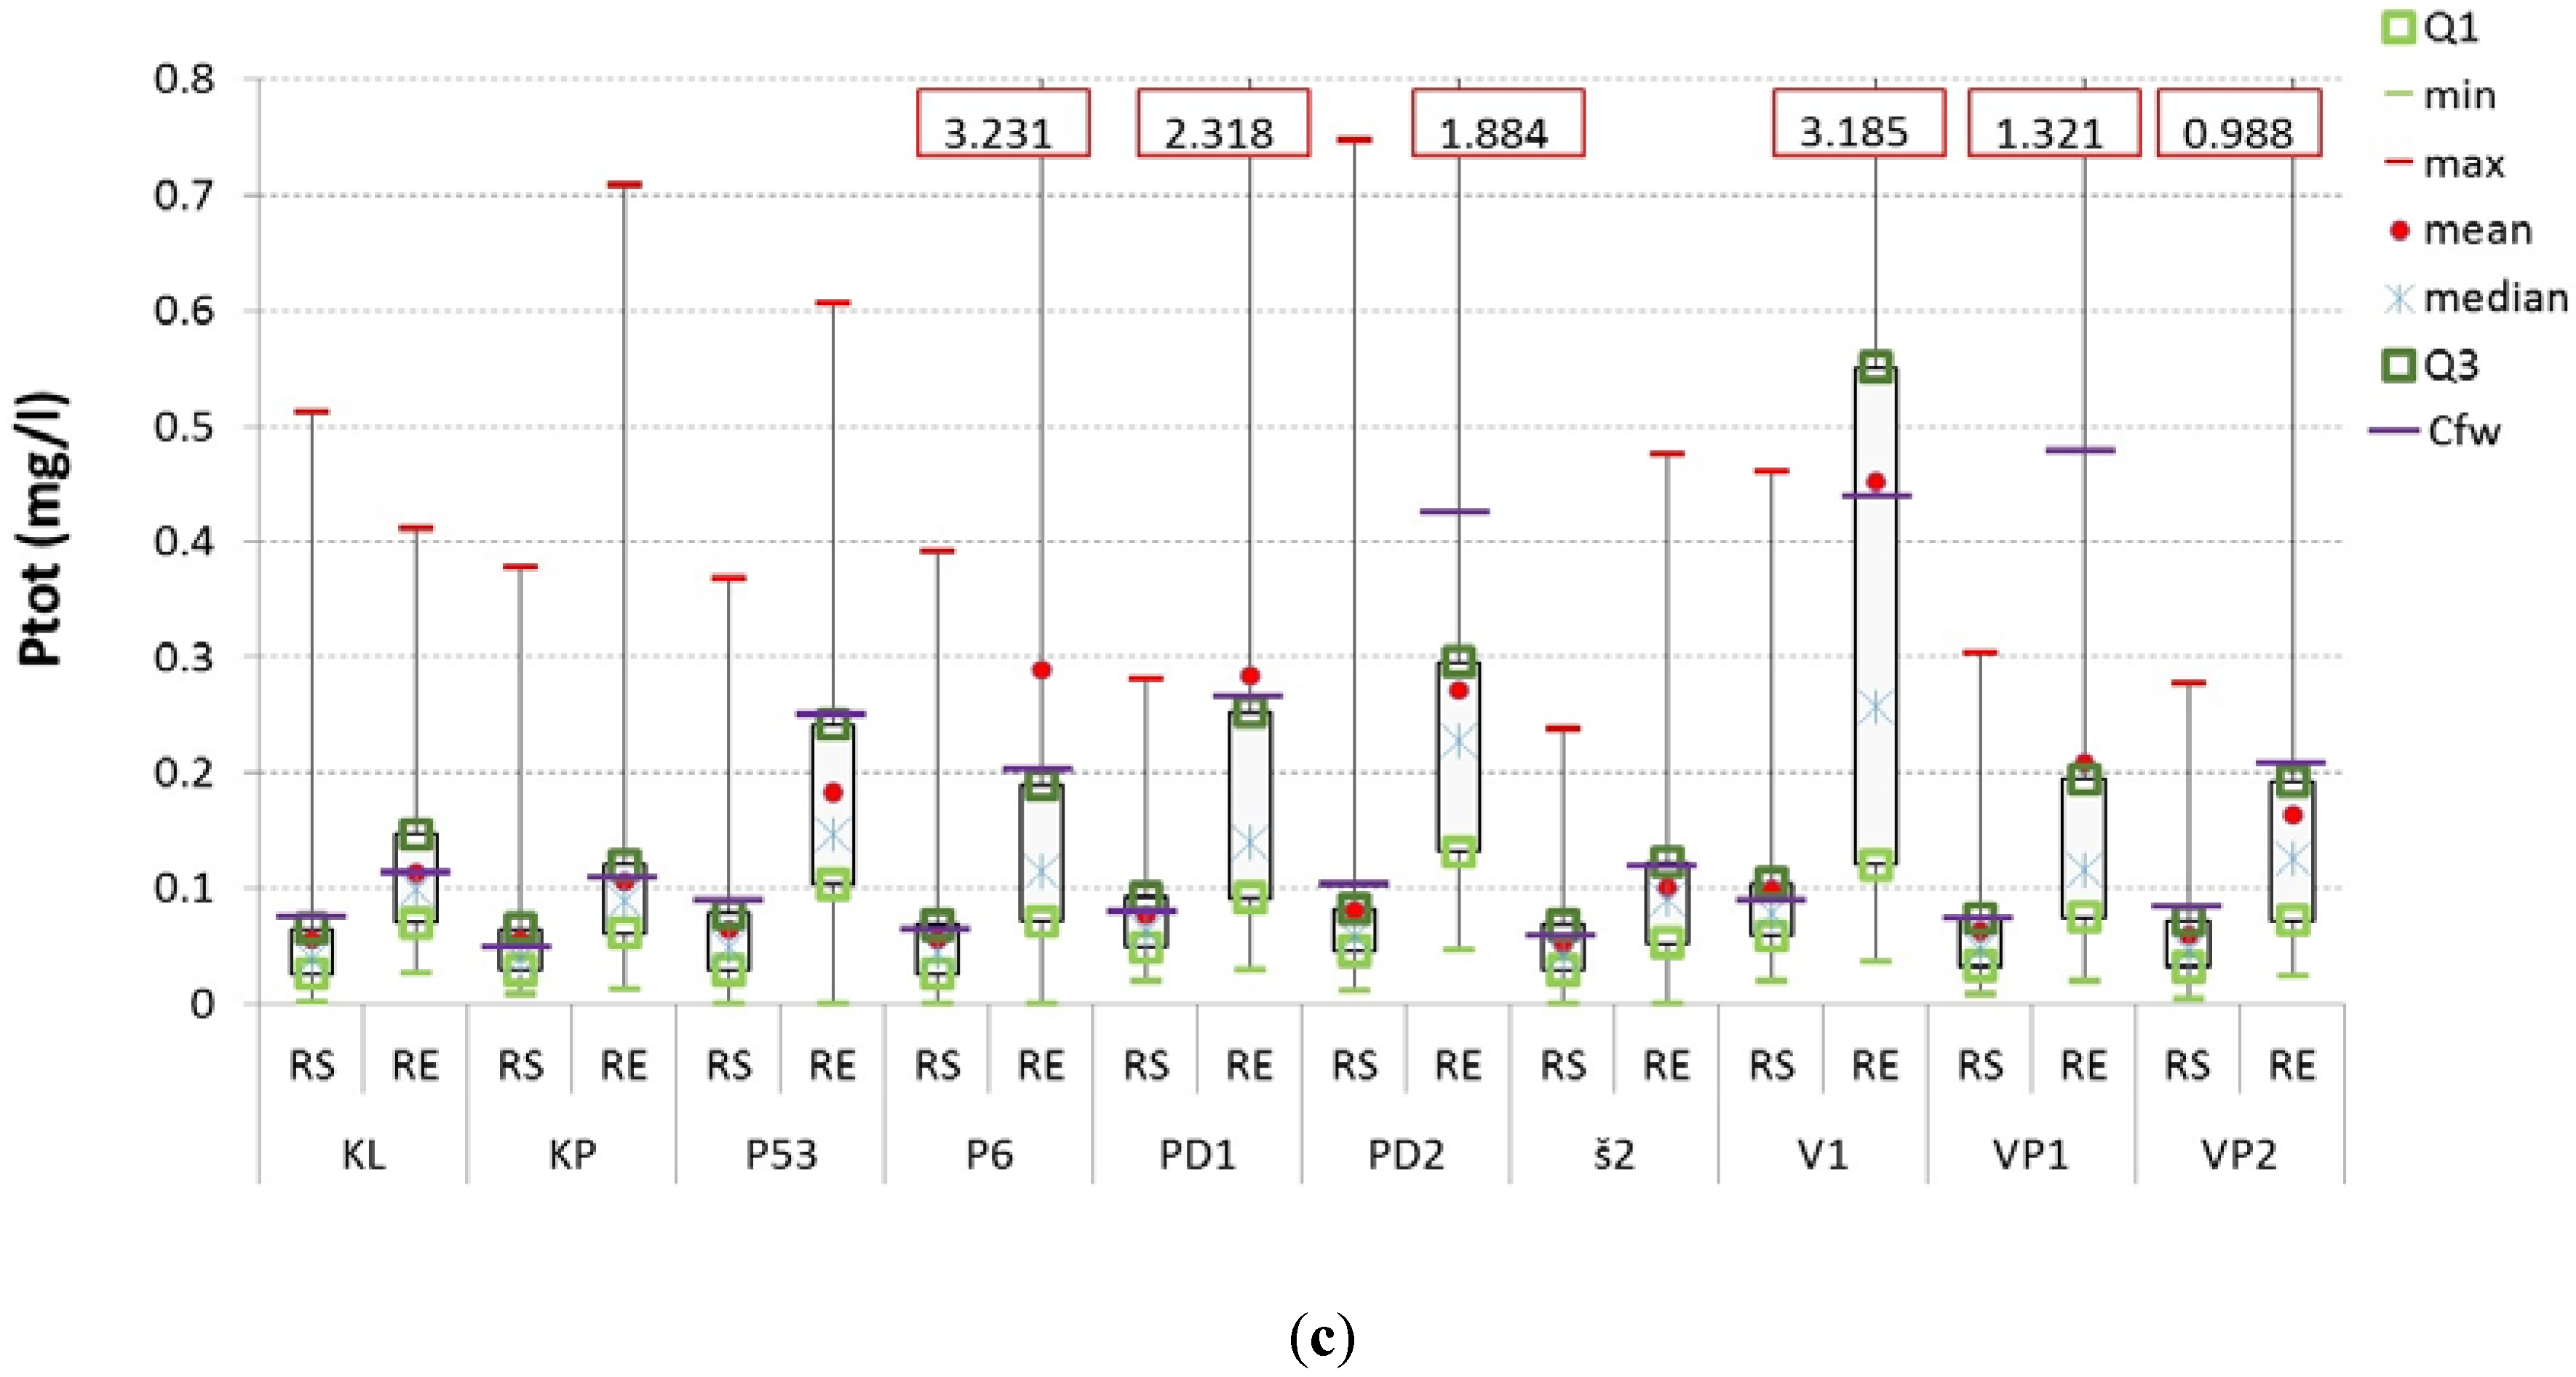
3.1. Dynamics of N and P Concentrations
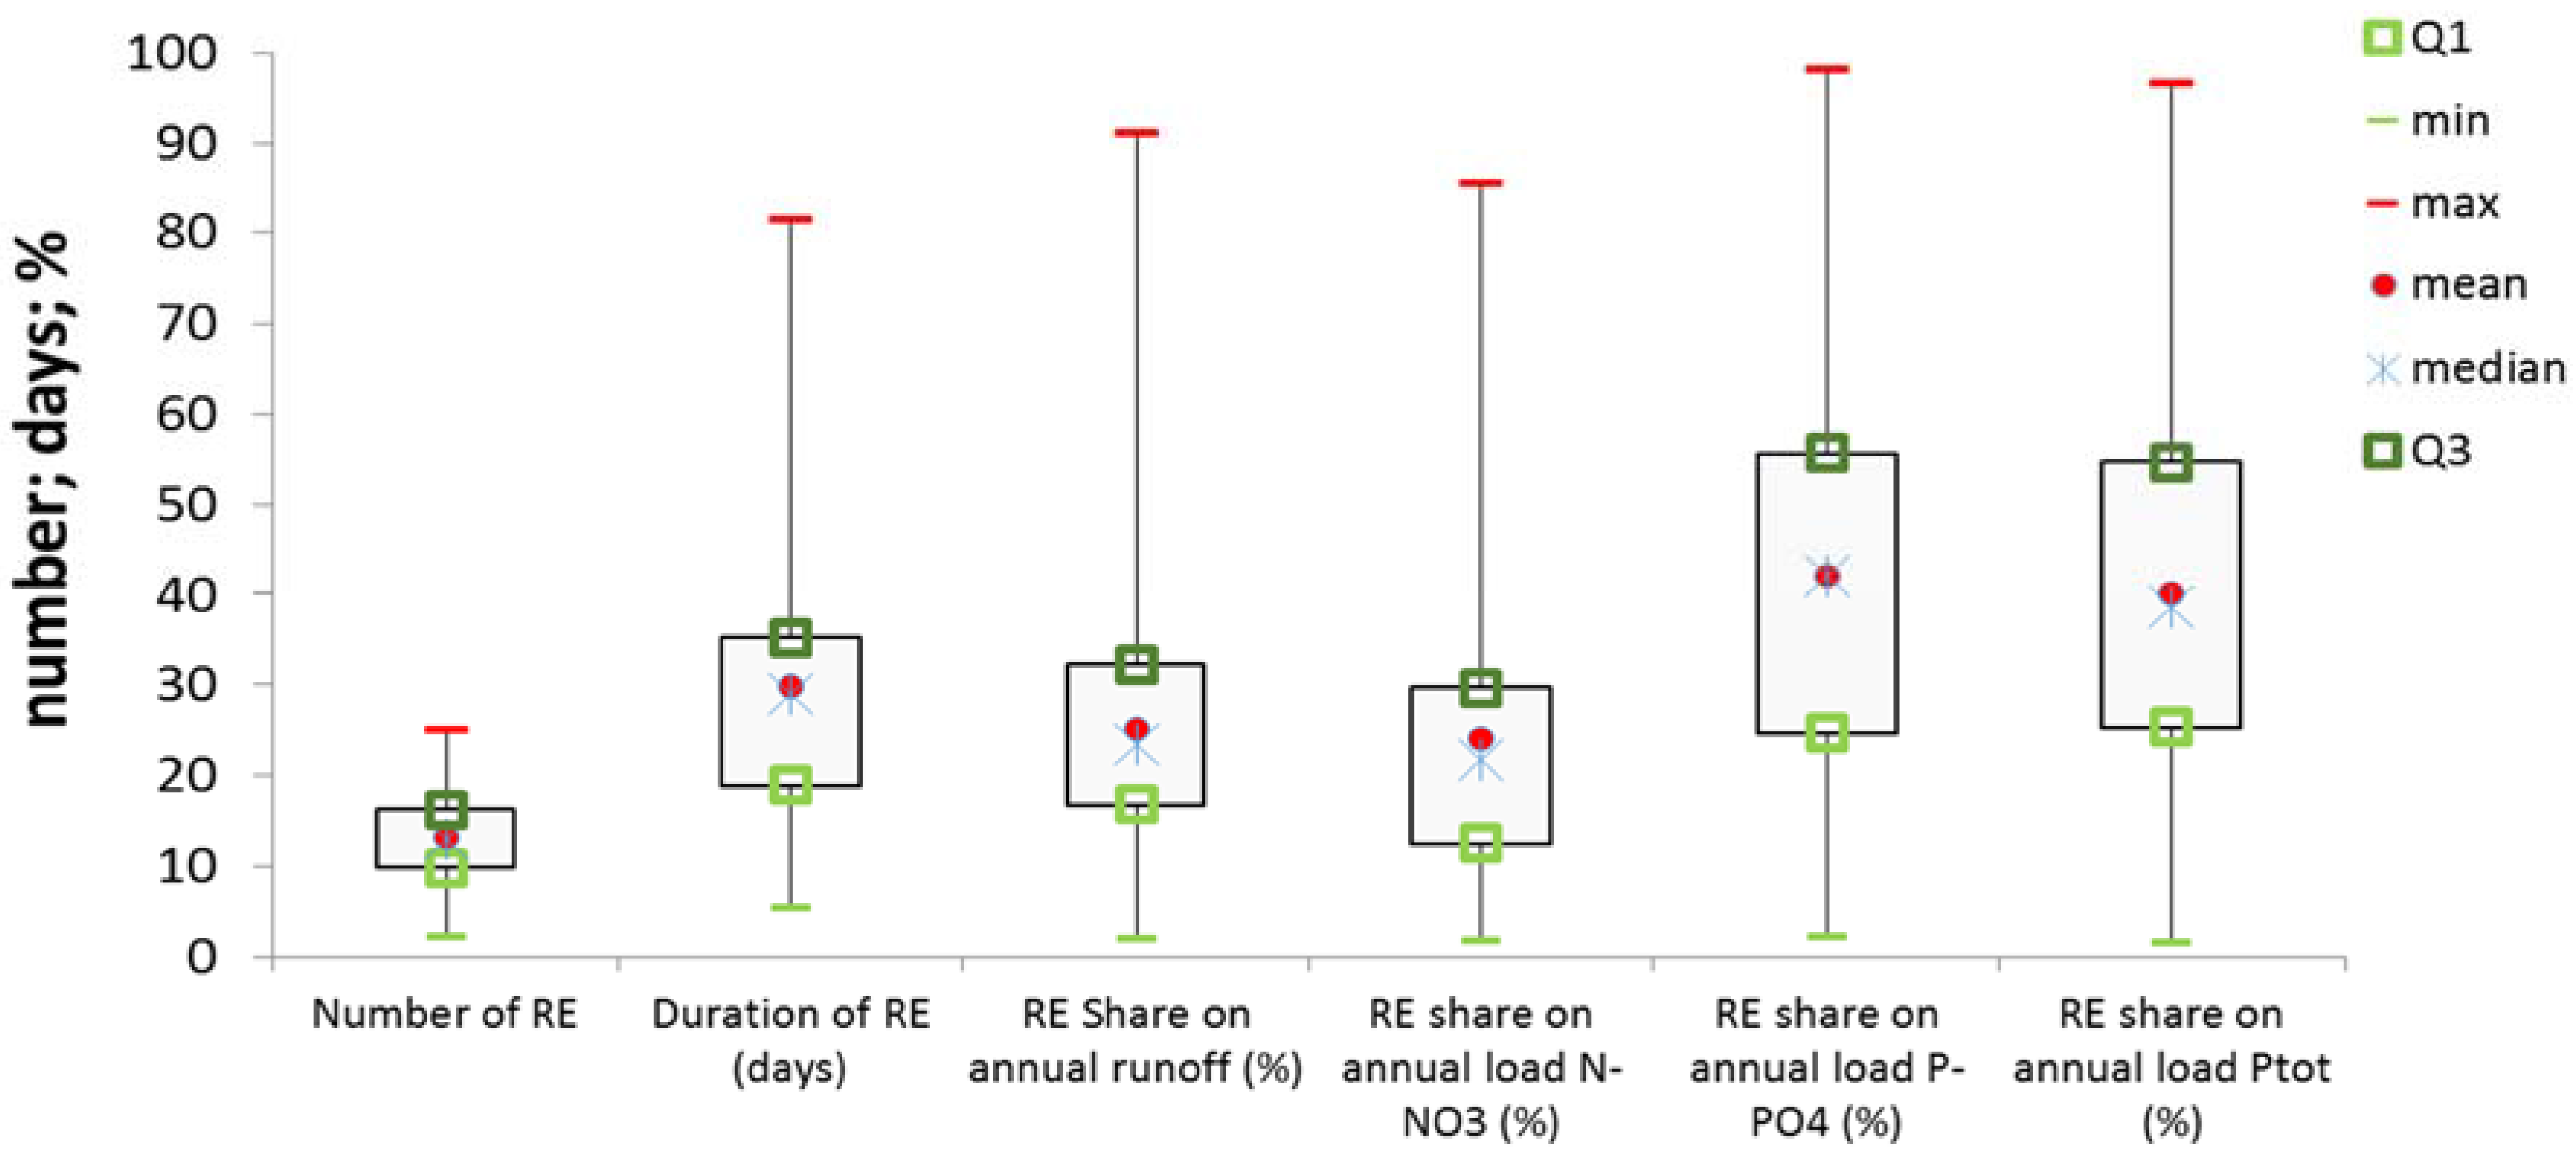
3.2. Runoff Events and Their Proportion in the Total Runoff, N and P Loads
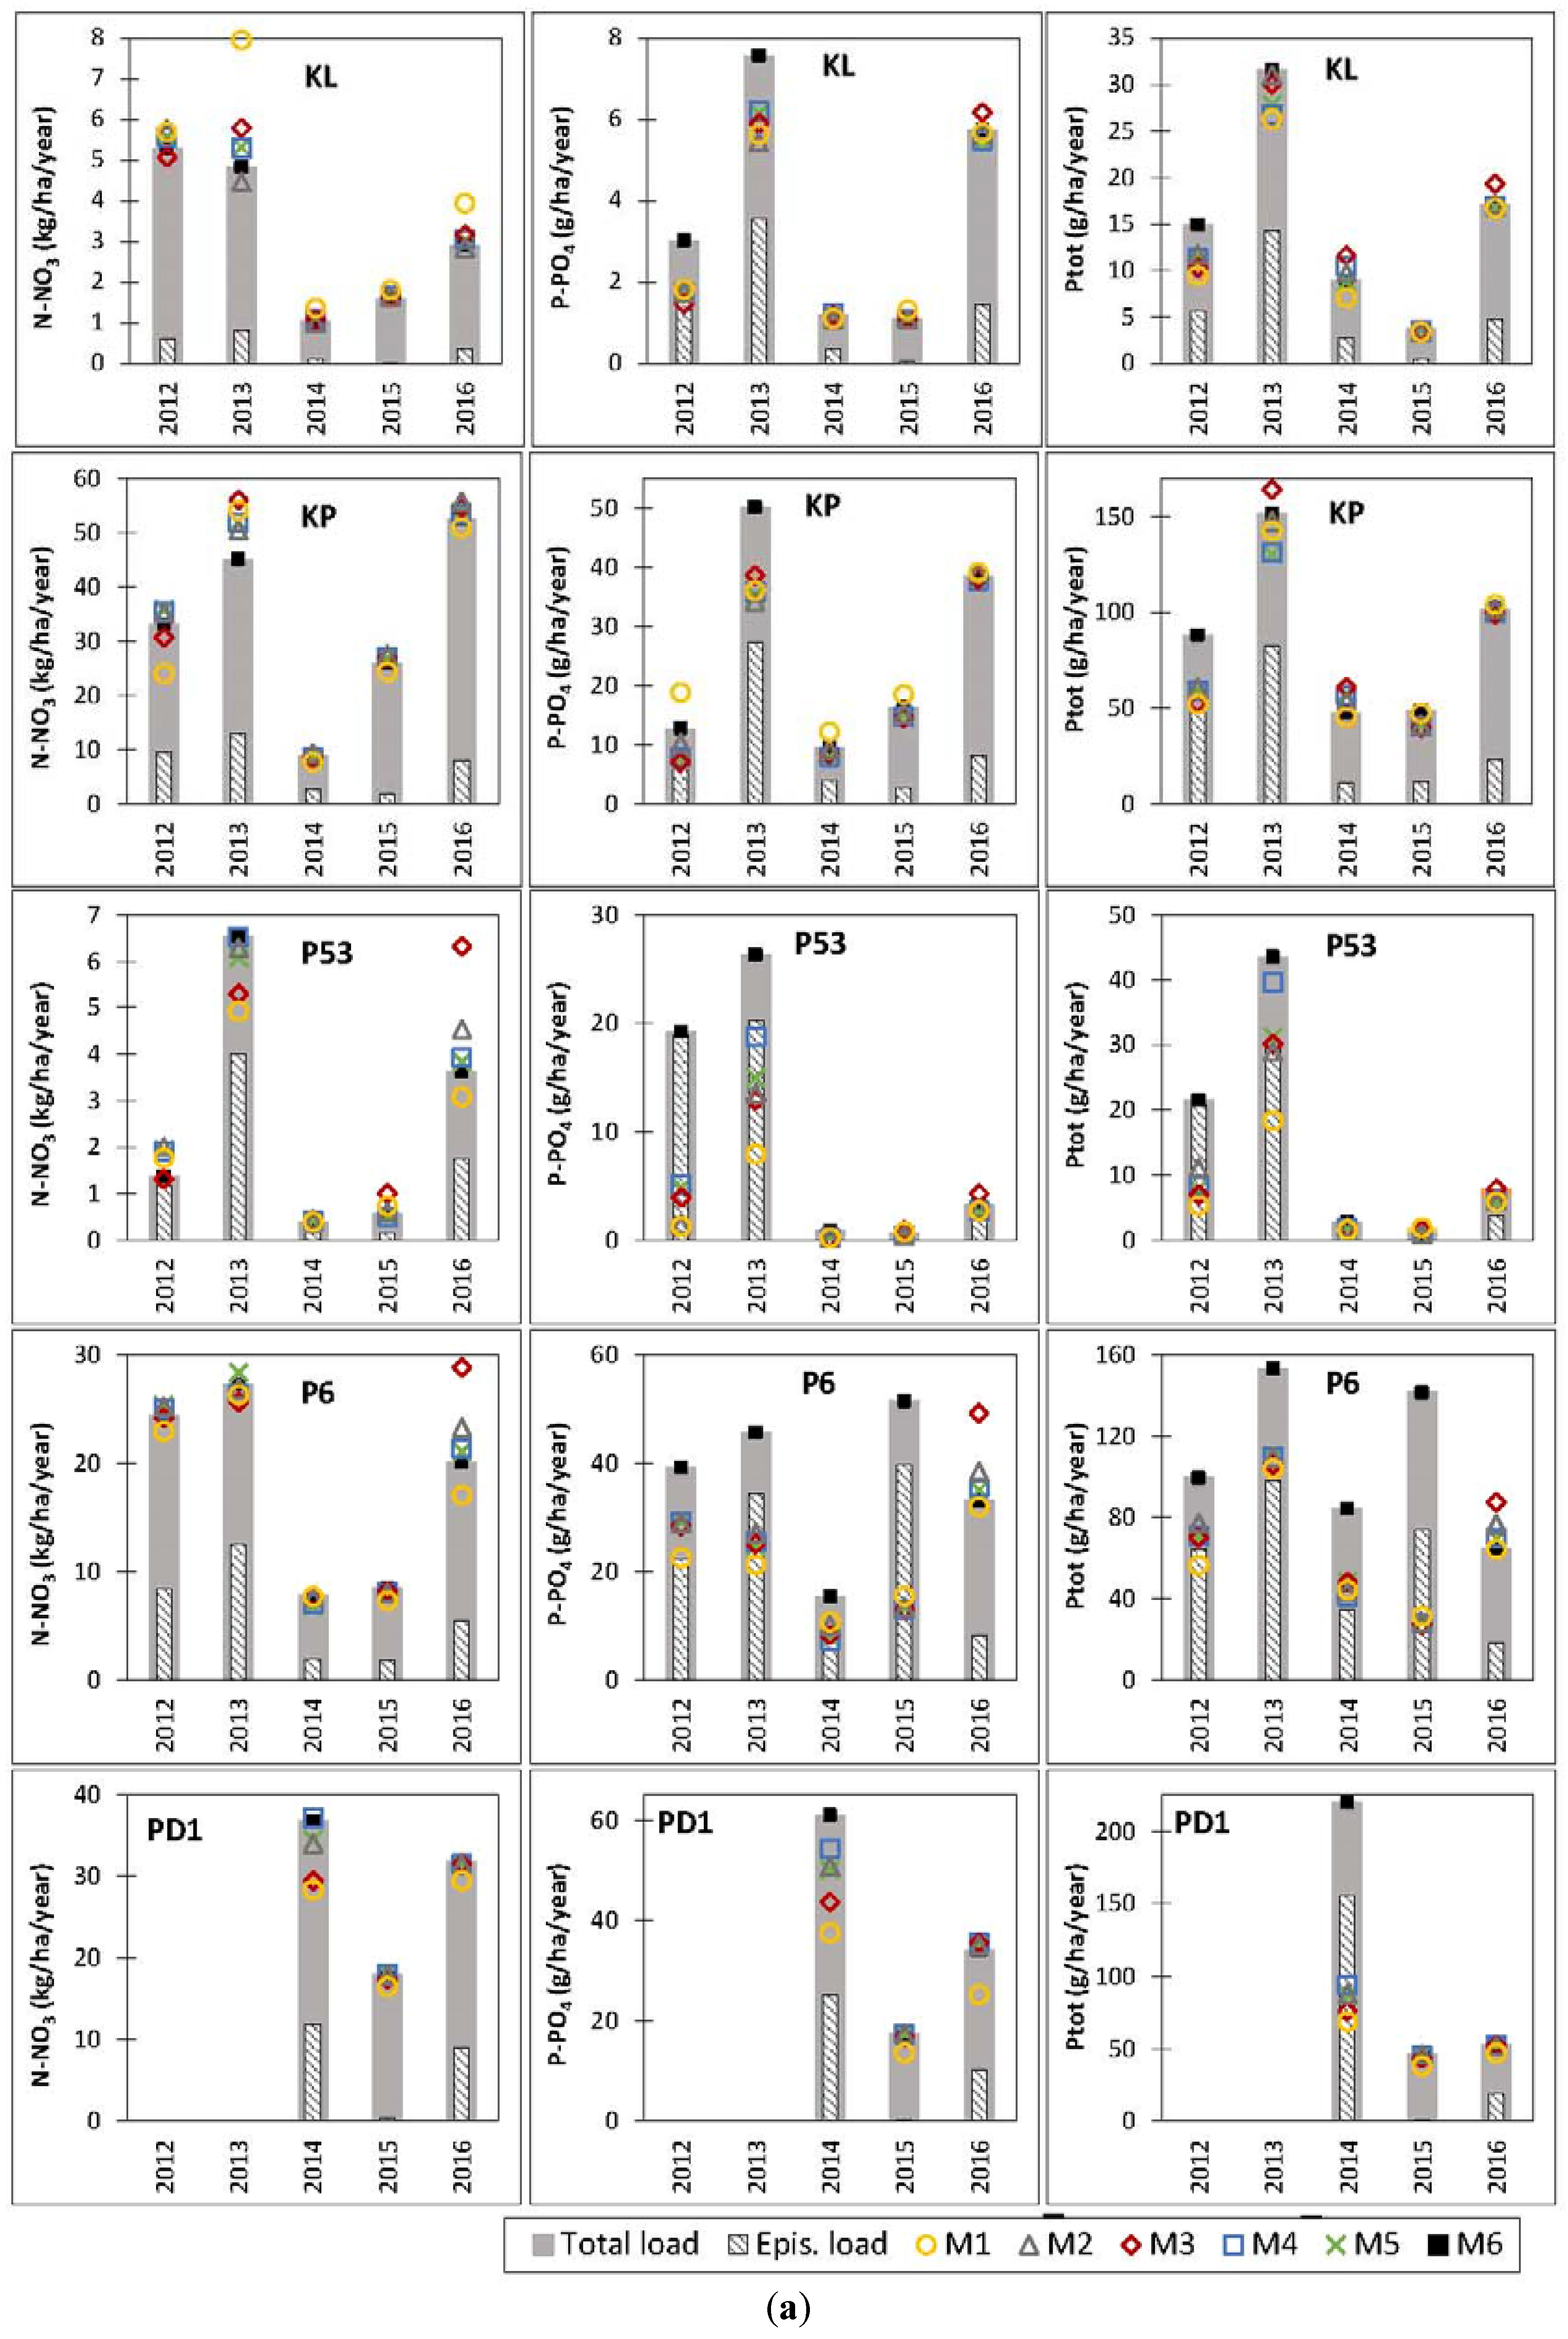
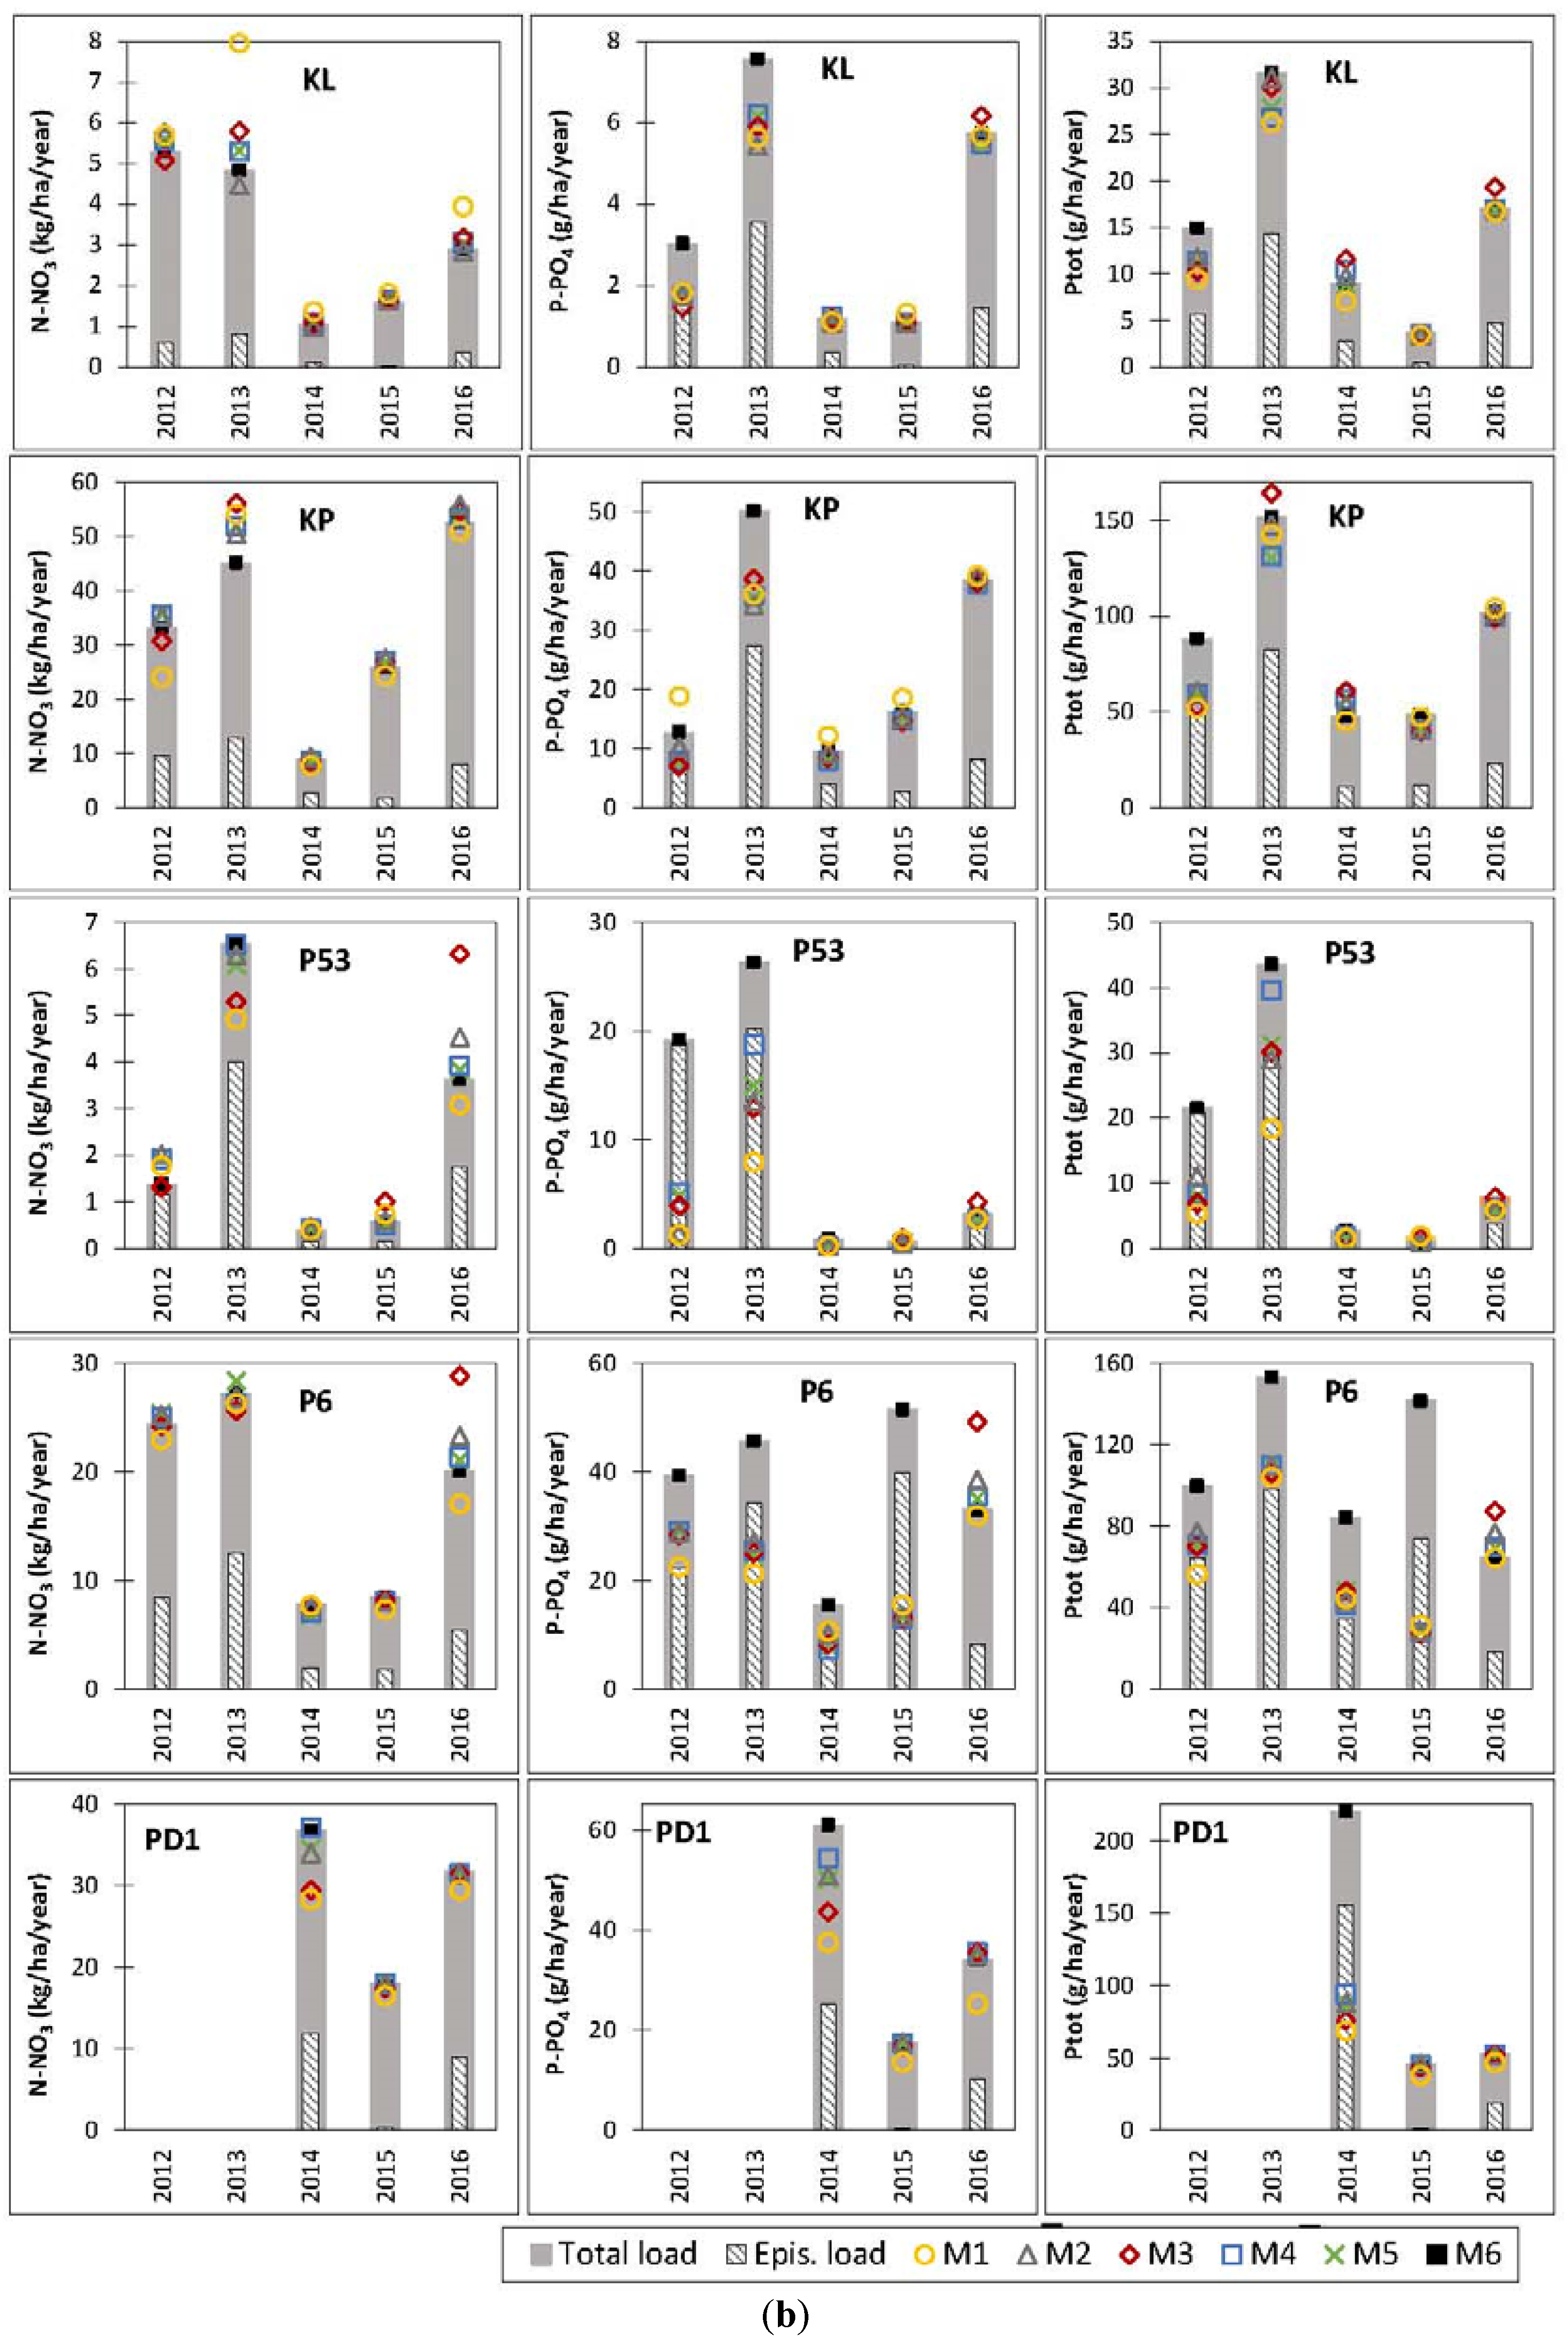
3.3. Comparison of Load Assessment Methods Annual Load Schemes
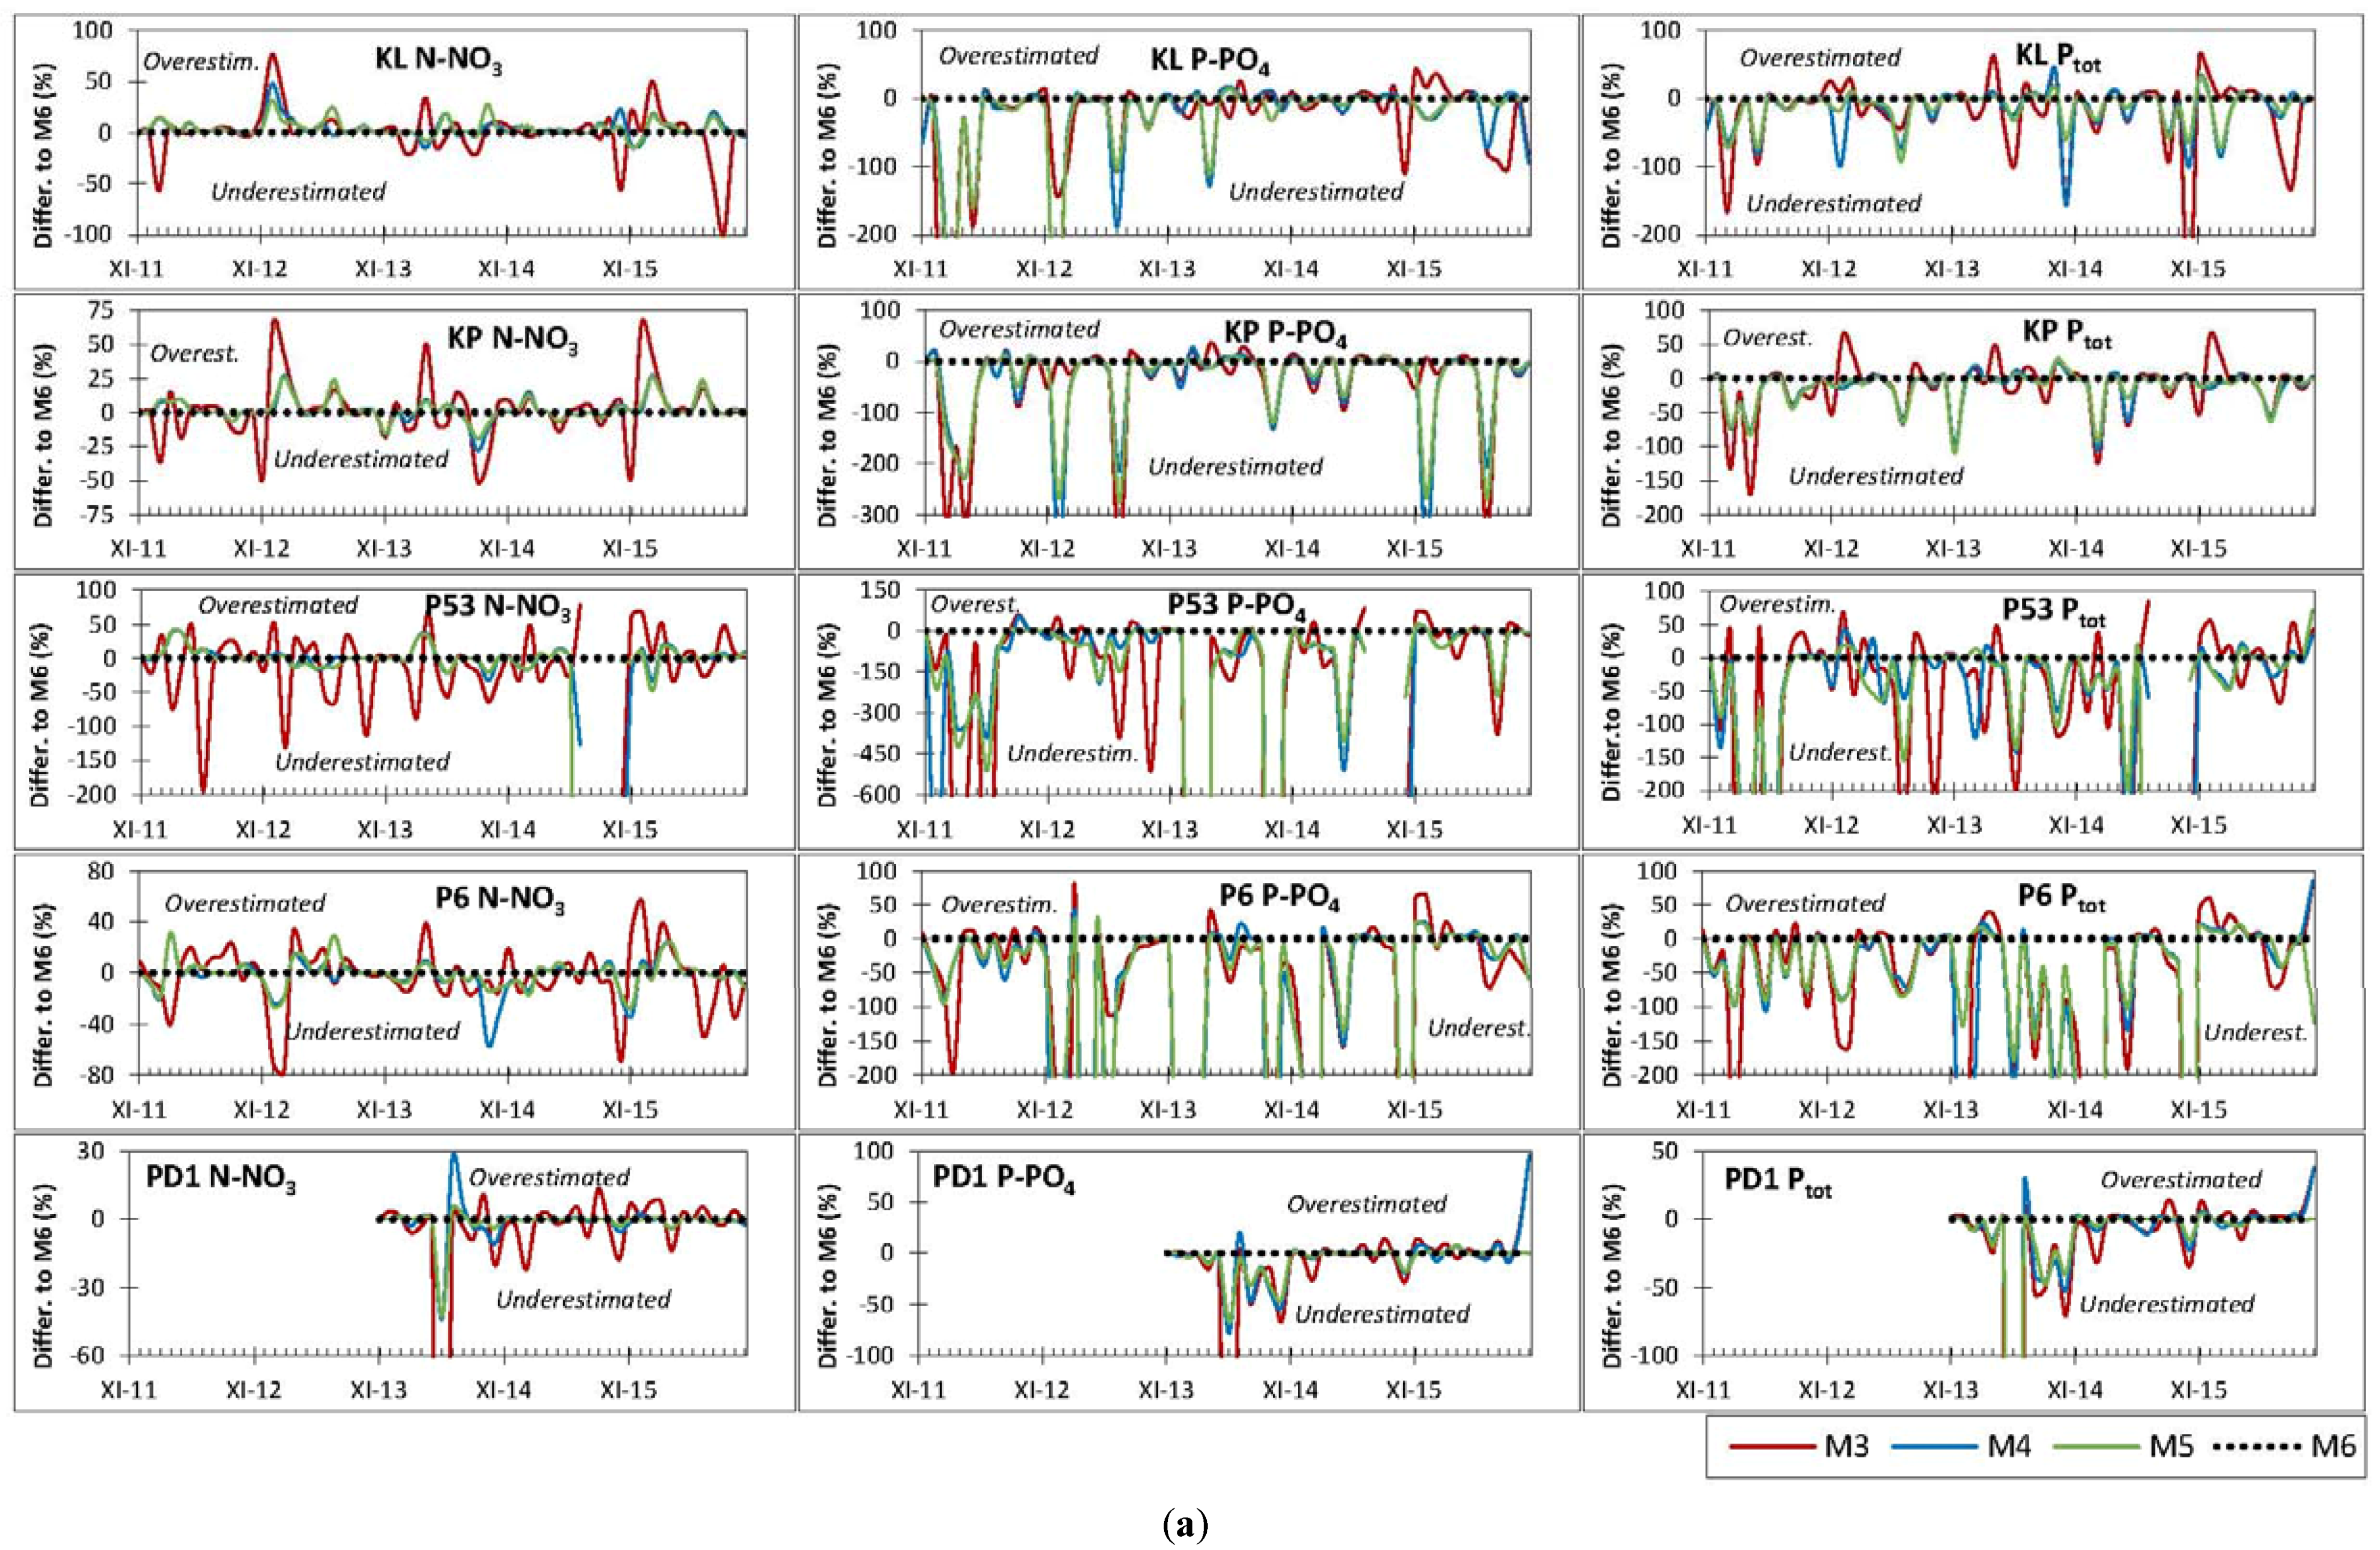
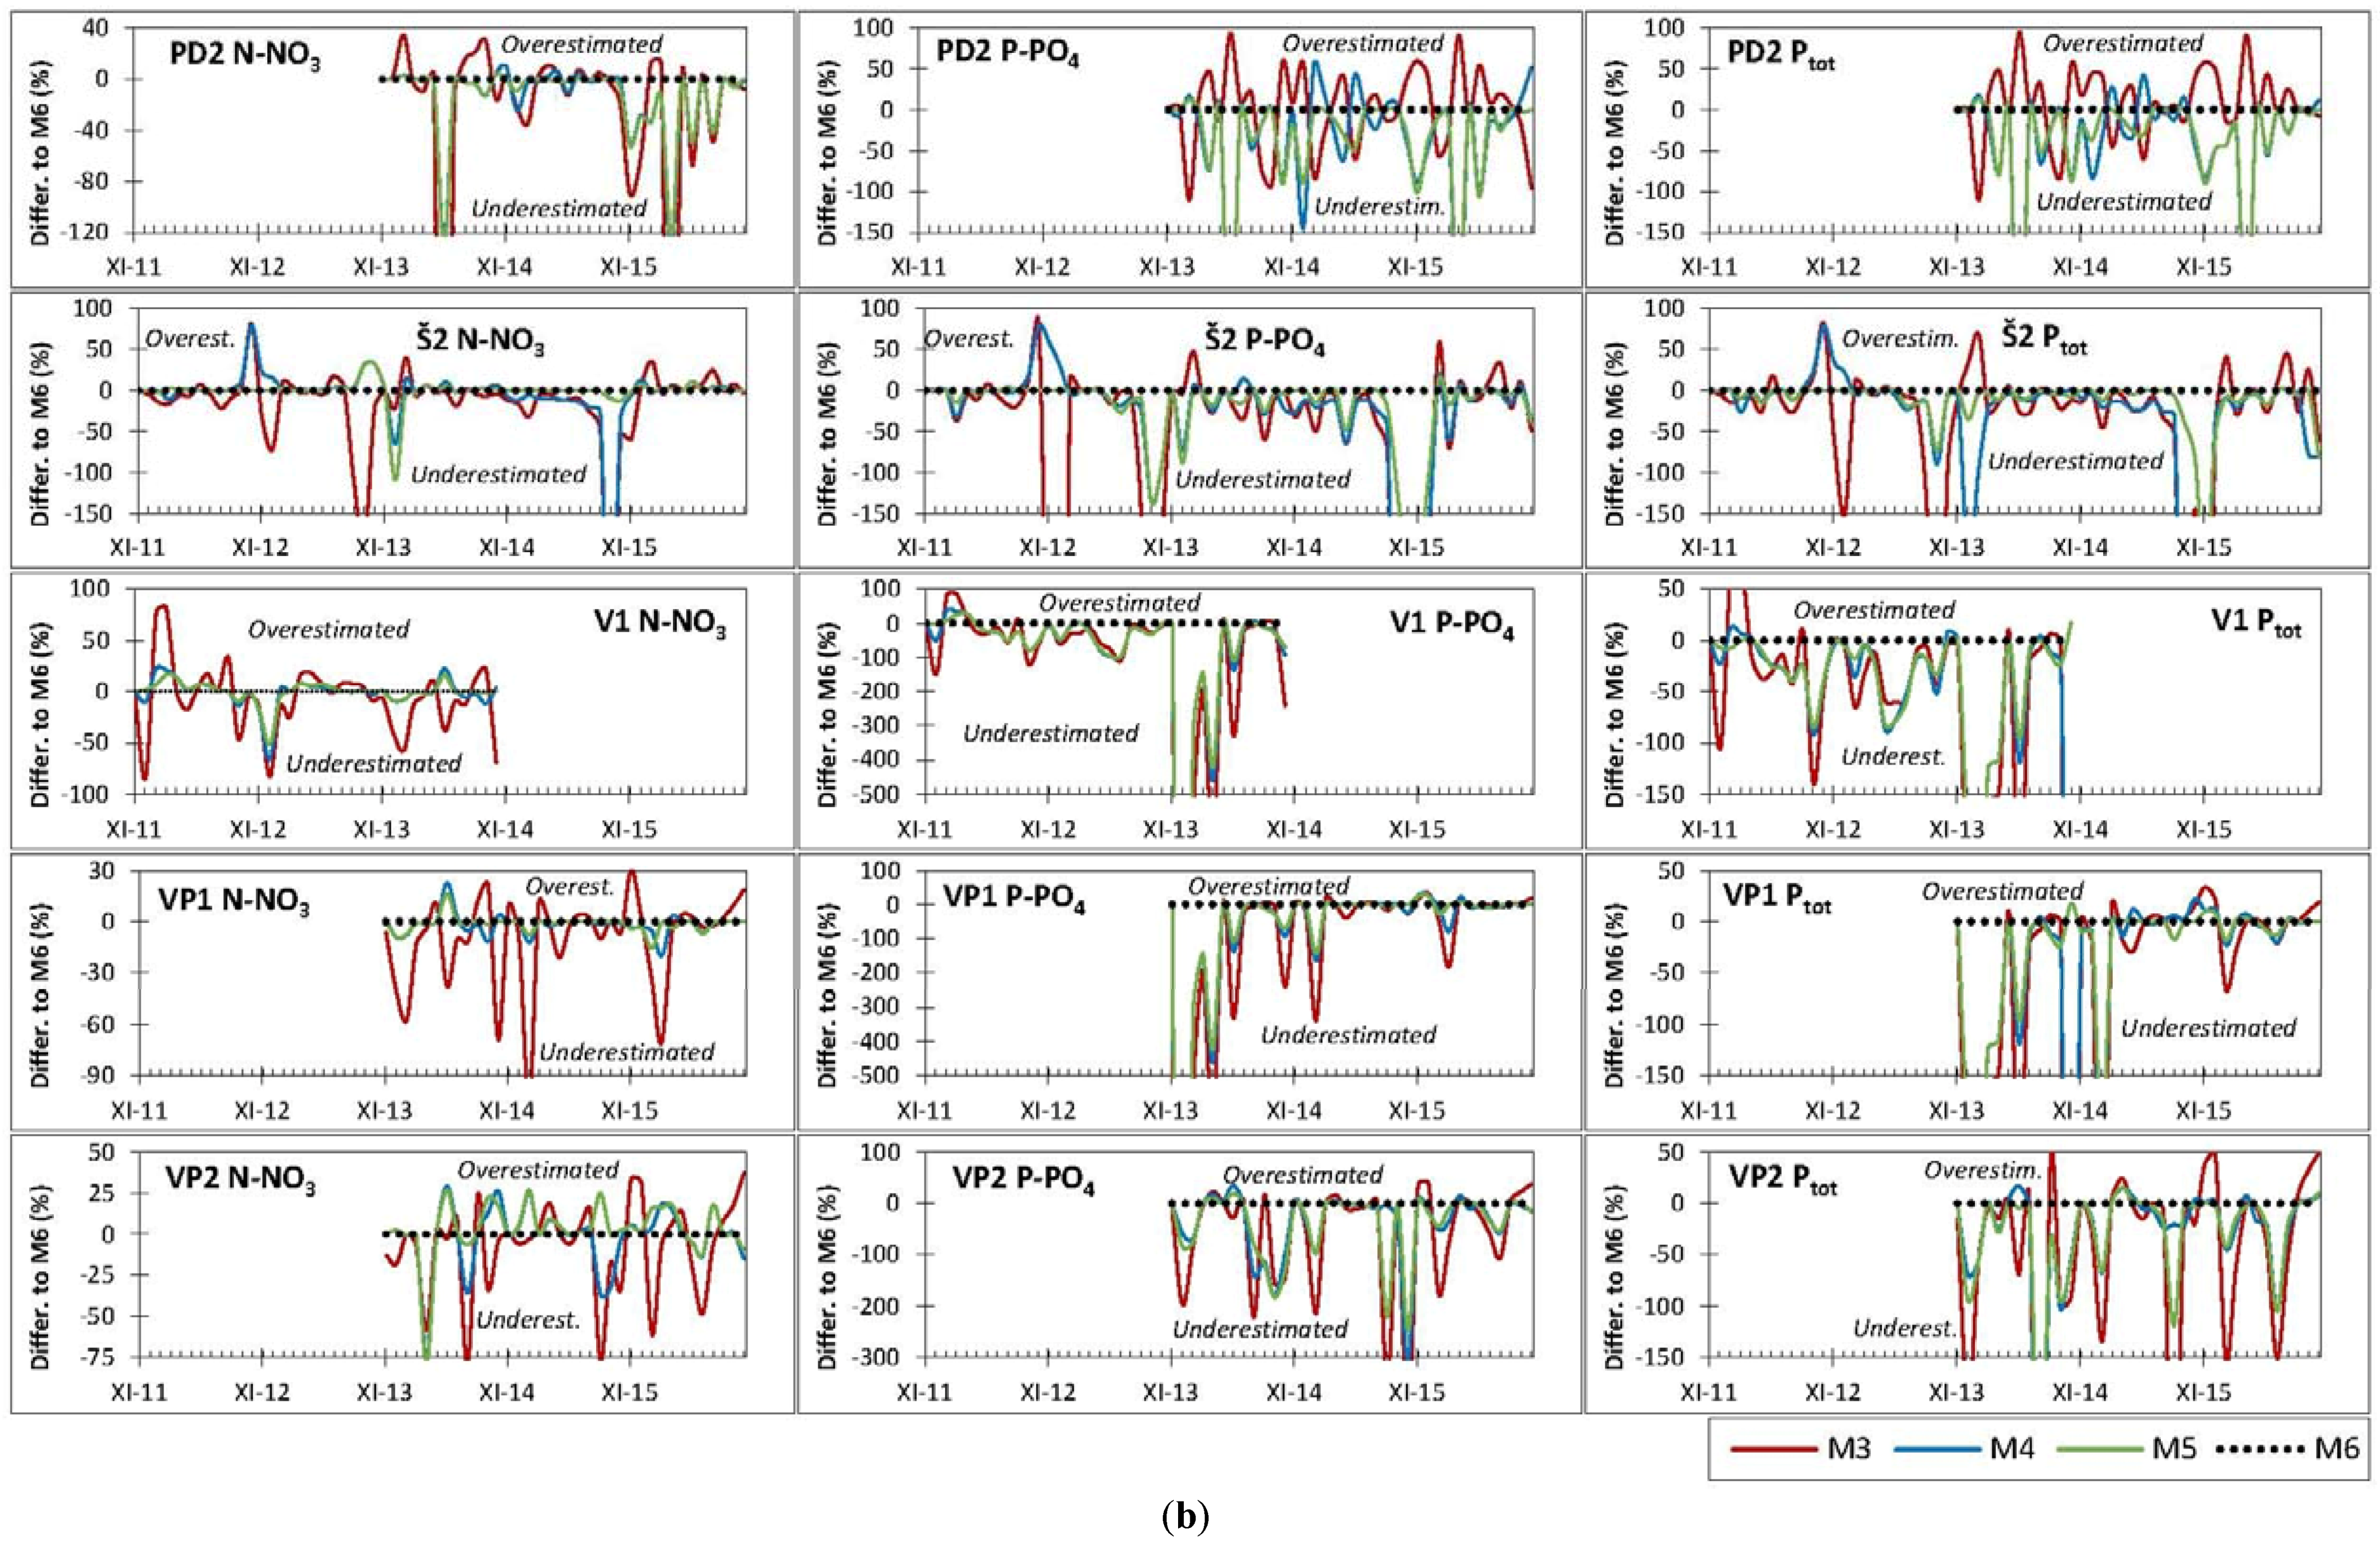
3.4. Monthly Load Schemes
4. Discussion
4.1. Dynamics of N and P Concentrations
4.2. Runoff Events and Their Proportion on Total Runoff, N and P Loads
4.3. Comparison of Load Assessment Methods
5. Conclusions
Acknowledgments
Author Contributions
Conflicts of Interest
References
- Rogger, M.; Agnoletti, M.; Alaoui, A.; Bathurst, J.C.; Bodner, G.; Borga, M.; Chaplot, V.; Gallart, F.; Glatzel, G.; Hall, J.; et al. Land use change impacts on floods at the catchment scale: Challenges and opportunities for future research. Water Resour. Res. 2017, 53. [Google Scholar] [CrossRef]
- Van Geer, F.C.; Kronvang, B.; Broers, H.P. High-resolution monitoring of nutrients in groundwater and surface waters: process understanding, quantification of loads and concentrations, and management applications. Hydrol. Earth Syst. Sci. 2016, 20, 3619–3629. [Google Scholar] [CrossRef]
- Dragon, K.; Kasztelan, D.; Gorski, J.; Najman, J. Influence of subsurface drainage systems on nitrate pollution of water supply aquifer (Tursko well-field, Poland). Environ Earth Sci. 2016, 75. [Google Scholar] [CrossRef]
- Fučík, P.; Hejduk, T.; Peterková, J. Quantifying Water Pollution Sources in a Small Tile-drained Agricultural Watershed. CLEAN 2014, 42, 698–709. [Google Scholar] [CrossRef]
- King, K.W.; Williams, M.R.; Macrae, M.L.; Fausey, N.R.; Frankenberger, J.; Smith, D.R.; Kleinman, P.J.A.; Brown, L.C. Phosphorus Transport in Agricultural Subsurface Drainage: A Review. J. Environ. Qual. 2015. [Google Scholar] [CrossRef] [PubMed]
- Kyllmar, K.; Bechmann, M.; Deelstra, J.; Iital, A.; Blicher-Mathiesen, G.; Jansons, V.; Koskiaho, J.; Povilaitis, A. Long-term monitoring of nutrient losses from agricultural catchments in the Nordic–Baltic region—A discussion of methods, uncertainties and future needs. Agric. Ecosyst. Environ. 2014, 198, 4–12. [Google Scholar] [CrossRef]
- Macrae, M. L.; English, M.C.; Schiff, S.L.; Stone, M. Capturing temporal variability for estimates of annual hydrochemical export from a first-order agricultural catchment in southern Ontario, Canada. Hydrol. Process. 2007, 21, 1651–1663. [Google Scholar] [CrossRef]
- Rozemeijer, J.C.; Visser, A.; Borren, W.; Winegram, M.; van der Velde, Y.; Klein, J.; Broers, H.P. High-frequency monitoring of water fluxes and nutrient loads to assess the effects of controlled drainage on water storage and nutrient transport. Hydrol. Earth Syst. Sci. 2016, 20, 347–358. [Google Scholar] [CrossRef]
- Smith, D.R.; King, K.W.; Johnson, L.; Francesconi, W.; Richards, P.; Baker, D.; Sharpley, A.N. Surface Runoff and Tile Drainage Transport of Phosphorus in the Midwestern United States. J. Environ. Qual. 2015, 44, 495–502. [Google Scholar] [CrossRef] [PubMed]
- Christianson, L.E.; Harmel, R.D.; Smith, D.; Williams, M.R.; King, K. Assessment and Synthesis of 50 Years of Published Drainage Phosphorus Losses. J. Environ. Qual. 2016, 45, 1467–1477. [Google Scholar] [CrossRef] [PubMed]
- Ernstsen, V.; Olsen, P.; Rosenbom, A.E. Long-term monitoring of nitrate transport to drainage from three agricultural clayey till fields. Hydrol. Earth Syst. Sci. 2015, 19, 3475–3488. [Google Scholar] [CrossRef]
- King, K.W.; Williams, M.R.; Fausey, N.R. Effect of crop type and season on nutrient leaching to tile drainage under a corn–soybean rotation. J. Soil Water Conserv. 2016, 71, 56–68. [Google Scholar] [CrossRef]
- Zhao, X.; Christianson, L.E.; Harmel, D.; Pittelkow, C.M. Assessment of drainage nitrogen losses on a yield-scaled basis. Field Crop. Res. 2016, 199, 156–166. [Google Scholar] [CrossRef]
- Exner-Kittridge, M.; Strauss, P.; Blöschl, G.; Eder, A.; Saracevic, E.; Zessner, M. The seasonal dynamics of the stream sources and input flow paths of water and nitrogen of an Austrian headwater agricultural catchment. Sci. Total Environ. 2016, 542, 935–945. [Google Scholar] [CrossRef] [PubMed]
- Fučík, P.; Zajíček, A.; Duffková, R.; Kvítek, T. Water Quality of Agricultural Drainage Systems in the Czech Republic—Options for Its Improvement. In Research and Practices in Water Quality; Lee, T.S., Ed.; InTech: Rijeka, Croatia, 2015; pp. 239–262. ISBN 978-953-51-2163-3. [Google Scholar]
- Monaghan, R.M.; Smith, L.C.; Muirhead, R.W. Pathways of contaminant transfers to water from an artificially-drained soil under intensive grazing by dairy cows. Agric. Ecosyst. Environ. 2016, 220, 76–88. [Google Scholar] [CrossRef]
- Zajíček, A.; Pomije, T.; Kvítek, T. Event water detection in tile drainage runoff using stable isotopes and a water temperature in small agricultural catchment in Bohemian-Moravian Highlands, Czech Republic. Environ. Earth Sci. 2016, 75. [Google Scholar] [CrossRef]
- Tiemeyer, B.; Kahle, P.; Lennartz, B. Designing monitoring programs for artificially drained catchments. Vadose Zone J. 2010, 9, 14–24. [Google Scholar] [CrossRef]
- Ulén, B.; von Brömssen, C.; Johansson, G.; Torstensson, G.; Forsberg, L.S. Trends in nutrient concentrations in drainage water from single fields under ordinary cultivation. Agric. Ecosyst. Environ. 2012, 161, 61–69. [Google Scholar] [CrossRef]
- Verma, S.; Markus, M.; Cooke, R.A. Development of error correction techniques for nitrate-N load estimation methods. J. Hydrol. 2012, 432, 12–25. [Google Scholar] [CrossRef]
- Vidon, P.; Hubbard, H.; Cuadra, P.E.; Hennessy, M. Storm Flow Generation in Artificially Drained Landscapes of the US Midwest: Matrix Flow, Macropore Flow, or Overland Flow. Water 2012, 4, 90–111. [Google Scholar]
- Kulhavý, Z.; Fučík, P. Adaptation Options for Land Drainage Systems Towards Sustainable Agriculture and the Environment: A Czech Perspective. Pol. J. Environ. Stud. 2015, 24, 1085–1102. [Google Scholar] [CrossRef]
- Tlapáková, L.; Žaloudík, J.; Kolejka, J. Thematic survey of subsurface drainage systems in the Czech Republic. J. Maps 2016, 13, 55–65. [Google Scholar] [CrossRef]
- Aulenbach, B.T.; Burns, D.A.; Shanley, J.B.; Yanai, R.D.; Bae, K.; Wild, A.D.; Yang, Y.; Yi, D. Approaches to stream solute load estimation for solutes with varying dynamics from five diverse small watersheds. Ecosphere 2016, 7. [Google Scholar] [CrossRef]
- Birgand, F.; Faucheux, C.; Gruau, G.; Augeard, B.; Moatar, F.; Bordenave, P. Uncertainties in assessing annual nitrate loads and concentration indicators: Part 1: Impact of sampling frequency and load estimation algorithms. ASABE 2010, 53, 437–446. [Google Scholar] [CrossRef]
- Harmel, R.D.; Smith, D.R.; King, K.W.; Slade, R.M. Estimating storm discharge and water quality data uncertainty: A software tool for monitoring and modeling applications. Environ. Model. Softw. 2009, 24, 832–842. [Google Scholar] [CrossRef]
- Jiang, Y.; Frankenberger, J.R.; Bowling, L.C.; Sun, Z. Quantification of uncertainty in estimated nitrate-N loads in agricultural watersheds. J. Hydrol. 2014, 519, 106–116. [Google Scholar] [CrossRef]
- Reynolds, K.N.; Loecke, T.D.; Burgin, A.J.; Davis, C.A.; Riveros-Iregui, D.; Thomas, S.A.; Clair, M.A.St.; Ward, A.S. Optimizing Sampling Strategies for Riverine Nitrate Using High-Frequency Data in Agricultural Watersheds. Environ. Sci. Technol. 2016. [Google Scholar] [CrossRef] [PubMed]
- Richards, R.P.; Baker, D.B.; Kramer, J.W.; Ewing, D.E.; Merryfield, B.J.; Miller, N.L. Storm discharge, loads, and average concentrations in Northwest Ohio Rivers, 1975–1995. J. Am. Water Resour. Assoc. 2001, 37, 423–438. [Google Scholar] [CrossRef]
- Guo, Y.; Markus, M.; Demissie, M. Uncertainty of nitrate-N load computations for agricultural watersheds. Water Resour. Res. 2002, 38, 1185. [Google Scholar] [CrossRef]
- Williams, M.R.; King, K.W.; Macrae, M.L.; Ford, W.; Van Esbroeck, Ch.; Brunke, R.I.; English, M.C.; Schiff, S.L. Uncertainty in nutrient loads from tile-drained landscapes: Effect of sampling frequency, calculation algorithm, and compositing strategy. J. Hydrol. 2015, 530, 306–316. [Google Scholar] [CrossRef]
- Cassidy, R.; Jordan, P. Limitations of instantaneous water quality sampling in surface-water catchments: Comparison with near-continuous phosphorus time-series data. J.Hydrol. 2011, 405, 182–193. [Google Scholar] [CrossRef]
- Defew, L.H.; May, L.; Heal, K.V. Uncertainties in estimated phosphorus loads as a function of different sampling frequencies and common calculation methods. Mar. Freshwater. Res. 2013, 64, 373–386. [Google Scholar] [CrossRef] [Green Version]
- Lam, W.V.; Macrae, M.L.; English, M.C.; O´Halloran, I.P.; Plach, J.M.; Wang, Y. Seasonal and event-based drivers of runoff and phosphorus export through agricultural tile drains under sandy loam soil in a cool temperate region. Hydrol. Process. 2016, 30, 2644–2656. [Google Scholar] [CrossRef]
- Campbell, J.M.; Jordan, P.; Arnscheidt, J. Using high-resolution phosphorus data to investigate mitigation measures in headwater river catchments. Hydrol. Earth Syst. Sci. 2015, 19, 453–464. [Google Scholar] [CrossRef]
- Bloodworth, J.W.; Holman, I.P.; Burgess, P.J.; Gillman, S.; Frogbrook, Z.; Brown, P. Developing a multi-pollutant conceptual framework for the selection and targeting of interventions in water industry catchment management schemes. J. Environ. Manag. 2015, 161, 153–162. [Google Scholar] [CrossRef] [PubMed] [Green Version]
- Knauer, K. Pesticides in surface waters: A comparison with regulatory acceptable concentrations (RACs) determined in the authorization process and consideration for regulation. Environ. Sci. Eur. 2016, 28. [Google Scholar] [CrossRef] [PubMed]
- Brauer, N.; O’Geen, A.T.; Dahlgren, R.A. Temporal variability in water quality of agricultural tailwaters: Implications for water quality monitoring. Agric. Water Manag. 2009, 96, 1001–1009. [Google Scholar] [CrossRef]
- Lenhart, C.; Gordon, B.; Gamble, J.; Current, D.; Ross, N.; Herring, L.; Nieber, J.; Peterson, H. Design and Hydrologic Performance of a Tile Drainage Treatment Wetland in Minnesota, USA. Water 2016, 8, 549. [Google Scholar] [CrossRef]
- Coyle, C.; Creamer, R.E.; Schulte, R.P.O.; O’Sullivan, L.; Jordan, P. A Functional Land Management conceptual framework under soil drainage and land use scenarios. Environ. Sci. Policy 2016, 56, 39–48. [Google Scholar] [CrossRef]
- USDA-NRSC. Soil Taxonomy, 2nd ed.; Govermnent Printing Office: Washington, DC, USA, 1999.
- Doležal, F.; Kvítek, T. The role of recharge zones, discharge zones, springs and tile drainage systems in peneplains of Central European highlands with regard to water quality generation processes. Phys. Chem. Earth 2004, 29, 775–785. [Google Scholar] [CrossRef]
- Herrmann, A.; Duncker, D. Runoff Formation in a Tile-drained Agricultural Basin of the Harz Mountain Foreland, Northern Germany. Soil Water Res. 2008, 3, 83–97. [Google Scholar]
- Bauwe, A.; Tiemeyer, B.; Kahle, P.; Lennartz, B. Classifying hydrological events to quantify their impact on nitrate leaching across three spatial scales. J. Hydrol. 2015, 531, 589–601. [Google Scholar] [CrossRef]
- Büttner, O.; Tittel, J. Uncertainties in dissolved organic carbon load estimation in a small stream. J. Hydrol. Hydromech. 2013, 61, 81–83. [Google Scholar] [CrossRef]
- Deelstra, J.; Iital, A.; Povilaitis, A.; Kyllmar, K.; Greipsland, I.; Blicher-Mathiesen, G.; Jansons, V.; Koskiaho, J.; Lagzdins, A. Reprint of ‘Hydrological pathways and nitrogen runoff in agricultural dominated catchments in Nordic and Baltic countries’. Agric. Ecosyst. Environ. 2014, 198, 211–219. [Google Scholar] [CrossRef]
- Fučík, P.; Kaplická, M.; Kvítek, T.; Peterková, J. Dynamics of Stream Water Quality during Snowmelt and Rainfall—Runoff Events in a Small Agricultural Catchment. CLEAN 2012, 40, 154–163. [Google Scholar] [CrossRef]
- Konečná, J.; Karásek, P.; Fučík, P.; Podhrázská, J.; Pochop, M.; Ryšavý, S.; Hanák, R. Integration of soil and water conservation measures in an intensively cultivated watershed – a case study of Jihlava River Basin (Czech Republic). Eur. Countryside 2017, 1, 17–28. [Google Scholar] [CrossRef]
- Nováková, E.; Karous, M.; Zajíček, A.; Karousová, M. Evaluation of ground penetrating radar and vertical electrical sounding methods to determine soil horizons and bedrock at the locality Dehtáře. Soil Water Res. 2013, 8, 105–112. [Google Scholar]
- Kennedy, C.D.; Bataille, C.; Liu, Z.; Ale, S.; VanDeVelde, J.; Roswell, C.R.; Bowling, L.C.; Bowen, G.J. Dynamics of nitrate and chloride during storm events in agricultural catchments with different subsurface drainage intensity (Indiana, USA). J. Hydrol. 2012, 466, 1–10. [Google Scholar] [CrossRef]
- Klaus, J.; Zehe, E.; Elsner, M.; Külls, C.; McDonnell, J.J. Macropore flow of old water revisited: Experimental insights from a tile-drained hillslope. Hydrol. Earth Syst. Sci. 2013, 17, 103–118. [Google Scholar] [CrossRef] [Green Version]
- Tachecí, P.; Žlábek, P.; Kvítek, T.; Peterková, J. Analysis of rainfall-runoff events in four subcatchments of the Kopaninský potok (Czech Republic). Bodenkultur 2013, 64, 105–111. [Google Scholar]
- Merz, R.; Bloschl, G.; Parajka, J. Spatio-temporal variability of event runoff coefficients. J. Hydrol. 2006, 331, 591–604. [Google Scholar] [CrossRef]
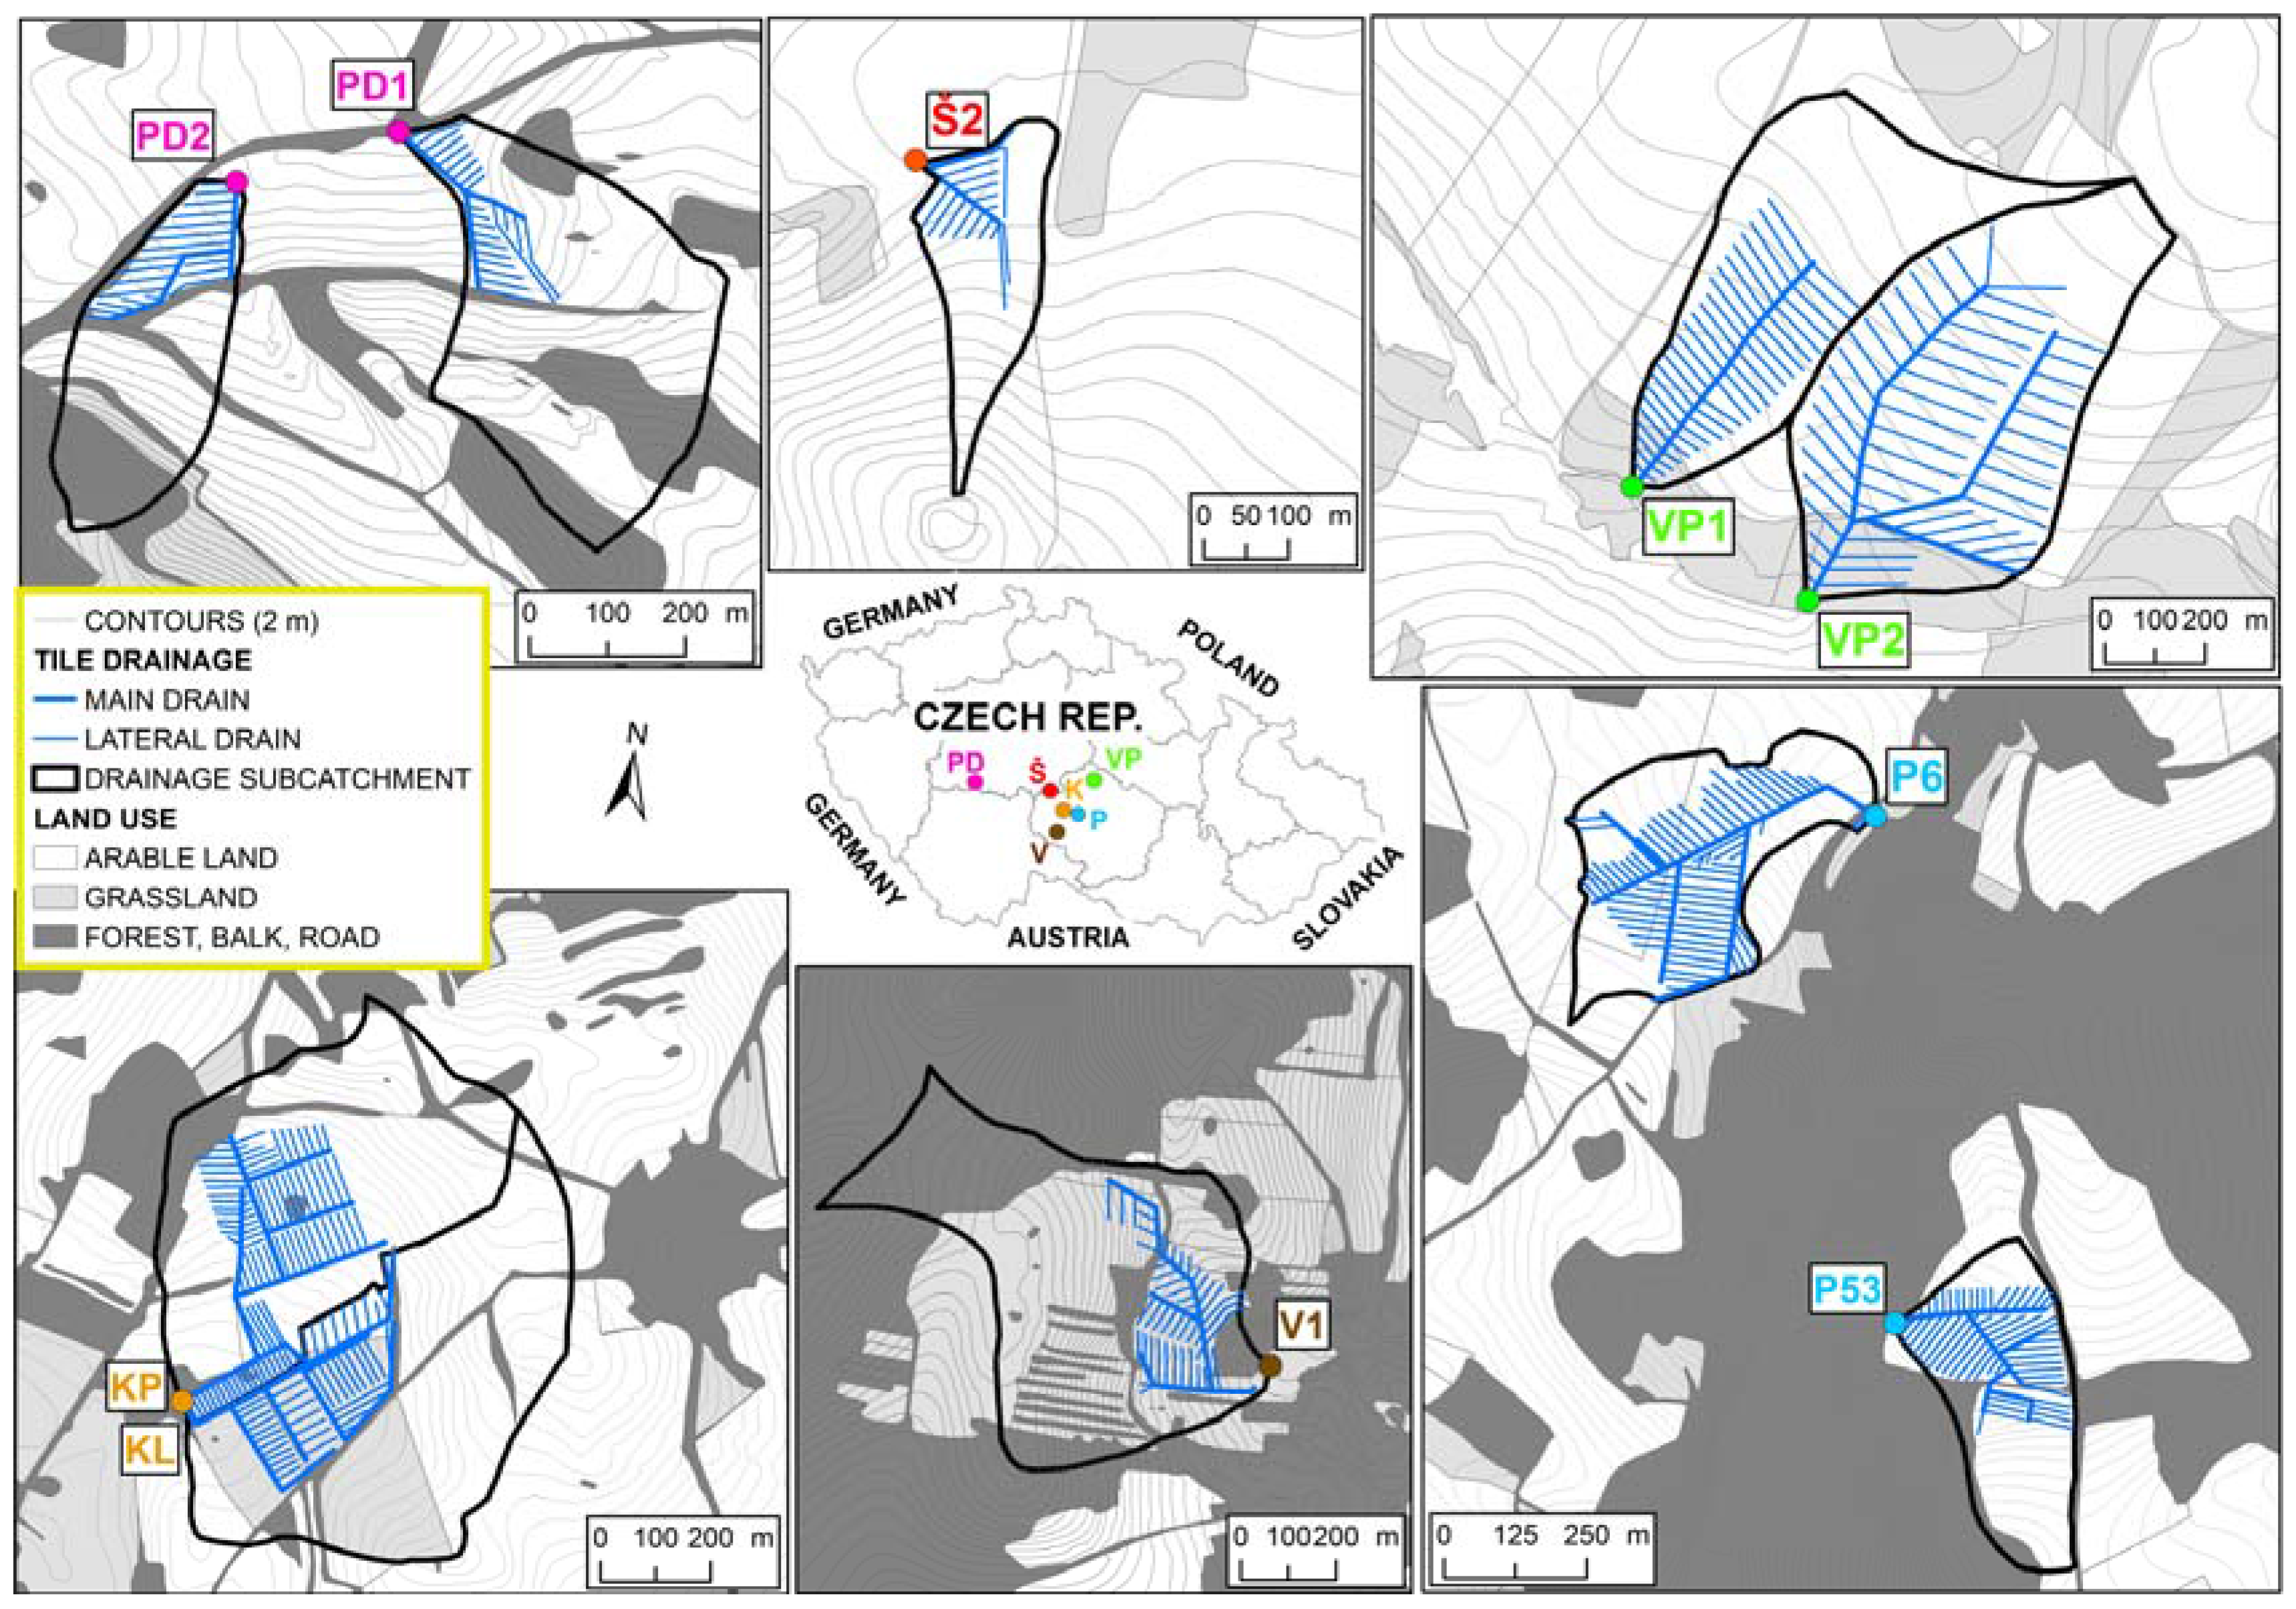

| Site | Mean Catchment Altitude (m a.s.l.) | Drained Area (ha) | Catchment Area (ha) | Primary Land Use | Avg. Discharge (l/s) | Specific Discharge (l/s/ha) | Fertilization/Management | Evaluated Period (HR) |
|---|---|---|---|---|---|---|---|---|
| KL | 550 | 6.51 | 29.6 | grassland | 0.219 | 0.007 | Digestate | 2012–2016 |
| KP | 550 | 9.51 | 28.3 | arable land | 1.265 | 0.044 | Mineral + manure | 2012–2016 |
| P53 | 565 | 5.46 | 14.86 | arable land | 0.045 | 0.003 | Mineral | 2012–2016 |
| P6 | 510 | 9.85 | 15.73 | arable land | 0.559 | 0.036 | Mineral | 2012–2016 |
| PD1 | 395 | 1.92 | 13.42 | arable land | 0.307 | 0.023 | Digestate | 2014–2016 |
| PD2 | 395 | 2.31 | 6.98 | arable land | 0.244 | 0.035 | Mineral | 2014–2016 |
| Š2 | 515 | 1.21 | 3.82 | arable land | 0.256 | 0.067 | Mineral | 2012–2016 |
| V1 | 655 | 5.85 | 37.9 | pasture | 0.993 | 0.026 | Cattle grazing | 2012–2014 |
| VP1 | 495 | 8.68 | 19.95 | arable land | 0.57 | 0.028 | Fugate + mineral | 2014–2016 |
| VP2 | 495 | 21.32 | 28.25 | arable land | 0.705 | 0.025 | Fugate + mineral | 2014–2016 |
| Method | Description | Equation |
|---|---|---|
| M1 | Load (a) = Mean year discharge × mean annual concentration (both from 14 day sampling values) | |
| M2 | Load (a) = Cumulative annual runoff volume (from 10 min data) × flow-weighted concentration (from 14 day sampling values) | |
| M3 | Load (a,m) = Actual discharge (from sampled days only) × concentration (from 14 day sampling values). For the unsampled days, a load of the previous/next sampling day is set. | |
| M4 | Load (a,m) = Mean daily discharge (from 10 min data in all days) × concentration (from 14 day sampling values). For the unsampled days, a concentration of the previous/next sampling day is set. | |
| M5 | Load (a,m) = Mean daily discharge (from 10 min data in all days) × concentration (from 14 day sampling values). For the unsampled days, a linear interpolation of the concentration is used from the consecutive sampled days | |
| M6 | Load (a,m) = M5 + loads during runoff eventsThis method was the only one to include runoff events, both sampled and unsampled (modelled). |
| Site | KL | KP | P53 | P6 | PD1 | PD2 | Š2 | V1 | VP1 | VP2 | |
|---|---|---|---|---|---|---|---|---|---|---|---|
| Evaluated Period (HR) | 12–16 | 12–16 | 12–16 | 12–16 | 14–16 | 14–16 | 12–16 | 12–14 | 14–16 | 14–16 | |
| Total | Number of RE (monitored) | 71 (29) | 65 (25) | 53 (22) | 78 (21) | 21 (8) | 36 (16) | 39 (14) | 56 (21) | 37 (17) | 56 (26) |
| Duration of RE days (%) | 133 (7.3) | 177 (9.7) | 168 (9.2) | 226 (12.4) | 46 (4.2) | 62 (5.7) | 51 (2.8) | 125 (11.4) | 61 (5.6) | 110 (10.0) | |
| Share of total runoff (%) | 24.8 | 27.6 | 62.8 | 34 | 16.1 | 21.7 | 14.8 | 28.2 | 19.6 | 28.1 | |
| Share of total load N-NO3 (%) | 12.3 | 21.1 | 57.7 | 34.2 | 24.4 | 37.5 | 10.1 | 22.1 | 17.0 | 18.5 | |
| Share of total load P-PO4 (%) | 37.8 | 38.3 | 83.6 | 61.4 | 31.7 | 53.5 | 19.3 | 43.1 | 47.6 | 47.8 | |
| Share of total load Ptot (%) | 36.6 | 40.5 | 74.4 | 73.2 | 53.9 | 52.1 | 20.3 | 39.5 | 46 | 50.7 | |
| Average per 1 HR | Number of RE (monitored) | 14 (6) | 13 (5) | 11 (4) | 16 (4) | 7 (3) | 12 (5) | 10 (4) | 19 (7) | 12 (6) | 18 (9) |
| Duration of RE (days) % | 26.6 (7.3) | 35.3 (9.7) | 33.6 (9.2) | 45.1 (12.4) | 15.4 (4.2) | 20.7 (5.7) | 17.9 (4.9) | 41.6 (11.4) | 20.2 (37.8) | 36.5 (10.0) | |
| Share of annual runoff (%) | 21.3 | 25.3 | 48.8 | 28.8 | 13.5 | 20.6 | 11.5 | 27.4 | 19.2 | 29.1 | |
| Share of annual load N-NO3 (%) | 10.8 | 22 | 50.9 | 30.8 | 20.8 | 35.4 | 8.6 | 22.8 | 16.9 | 19.5 | |
| Share of annual load P-PO4 (%) | 32.3 | 37.1 | 73.3 | 58.8 | 24.4 | 49.9 | 16.5 | 43 | 36.7 | 43.8 | |
| Share of annual load Ptot (%) | 30.9 | 36 | 62.8 | 49.7 | 36.1 | 48.6 | 17.1 | 37.7 | 37.2 | 46.7 | |
| N-NO3 | P-PO4 | Ptot | ||||||||||
|---|---|---|---|---|---|---|---|---|---|---|---|---|
| min | max | mean | median | min | max | mean | median | min | max | mean | median | |
| M1 | −27.5 | 64.5 | −3.2 | −6.9 | −93.3 | 47.5 | −27.9 | −27.8 | −78.2 | 4.2 | −28.2 | −23.6 |
| M2 | −24.8 | 46.1 | 3.2 | 0.3 | −92.0 | 16.1 | −20.5 | −15.0 | −79.9 | 17.8 | −17.8 | −11.9 |
| M3 | −48.7 | 74.1 | 1.3 | −2.8 | −79.5 | 89.4 | −18.8 | −22.2 | −80.9 | 34.1 | −18.2 | −12.7 |
| M4 | −38.4 | 39.8 | 1.4 | 2.3 | −74.6 | 10.6 | −22.5 | −17.8 | −80.1 | 18.5 | −21.7 | −16.9 |
| M5 | −37.3 | 41.7 | 1.4 | 2.1 | −74.7 | 6.0 | −24.6 | −18.7 | −79.7 | 20.5 | −21.9 | −14.5 |
| M3 | M4 | M5 | |||||||
|---|---|---|---|---|---|---|---|---|---|
| Site | N-NO3 | P-PO4 | Ptot | N-NO3 | P-PO4 | Ptot | N-NO3 | P-PO4 | Ptot |
| KL | 0.38 | −33.39 | −20.93 | 3.97 | −31.35 | −16.17 | 4.03 | −27.33 | −12.22 |
| KP | 1.91 | −37.20 | −12.48 | 2.17 | −39.78 | −12.66 | 2.48 | −37.35 | −12.63 |
| P53 | −12.35 | −962.19 | −88.09 | −8.58 | −445.31 | −51.30 | −21.91 | −473.09 | −59.06 |
| P6 | −2.80 | −145.51 | −96.26 | −2.42 | −140.96 | −88.37 | −0.65 | −126.26 | −75.83 |
| PD1 | −11.28 | −16.86 | −103.62 | −1.19 | −3.55 | −30.85 | −1.42 | −6.22 | −29.87 |
| PD2 | −38.87 | 0.29 | 8.41 | −14.62 | −33.72 | −37.27 | −14.42 | −35.68 | −37.38 |
| Š2 | −16.39 | −88.88 | −41.40 | −5.39 | −29.36 | −31.66 | −0.36 | −21.95 | −13.80 |
| V1 | −6.60 | −211.20 | −92.73 | −0.60 | −155.40 | −63.18 | −0.20 | −141.39 | −41.51 |
| VP1 | −10.67 | −207.78 | −88.58 | −1.83 | −144.03 | −52.79 | −1.43 | −128.40 | −32.07 |
| VP2 | −7.72 | −60.50 | −53.11 | −0.88 | −36.21 | −30.14 | 3.22 | −39.77 | −29.97 |
| average | −10.44 | −176.32 | −58.88 | −2.94 | −105.97 | −41.44 | −3.07 | −103.74 | −34.43 |
| M3 | M4 | M5 | |||||||
|---|---|---|---|---|---|---|---|---|---|
| Site | N-NO3 | P-PO4 | Ptot | N-NO3 | P-PO4 | Ptot | N-NO3 | P-PO4 | Ptot |
| KL | 23.58 | 90.87 | 61.16 | 9.98 | 81.77 | 37.59 | 8.90 | 77.27 | 26.96 |
| KP | 21.90 | 97.37 | 43.44 | 9.08 | 92.38 | 28.94 | 8.49 | 85.34 | 28.47 |
| P53 | 61.15 | 4126.42 | 278.01 | 63.97 | 1596.52 | 123.47 | 175.61 | 1841.11 | 177.04 |
| P6 | 24.43 | 382.84 | 288.40 | 13.28 | 343.94 | 259.29 | 10.92 | 329.51 | 224.72 |
| PD1 | 60.91 | 91.76 | 579.89 | 8.96 | 25.68 | 155.82 | 7.29 | 16.13 | 148.69 |
| PD2 | 140.71 | 50.32 | 43.11 | 35.40 | 84.58 | 86.69 | 34.43 | 77.05 | 85.87 |
| Š2 | 59.11 | 276.52 | 124.46 | 49.25 | 91.19 | 89.28 | 15.62 | 53.71 | 36.59 |
| V1 | 35.33 | 826.37 | 250.02 | 14.25 | 631.76 | 142.17 | 10.92 | 565.58 | 76.86 |
| VP1 | 29.96 | 827.53 | 255.65 | 6.56 | 631.46 | 144.63 | 4.81 | 565.06 | 79.65 |
| VP2 | 29.33 | 125.70 | 129.90 | 19.15 | 74.43 | 75.60 | 17.24 | 76.72 | 62.68 |
| mean | 48.64 | 689.57 | 205.40 | 22.99 | 365.37 | 114.35 | 29.42 | 368.75 | 94.75 |
© 2017 by the authors. Licensee MDPI, Basel, Switzerland. This article is an open access article distributed under the terms and conditions of the Creative Commons Attribution (CC BY) license (http://creativecommons.org/licenses/by/4.0/).
Share and Cite
Fučík, P.; Zajíček, A.; Kaplická, M.; Duffková, R.; Peterková, J.; Maxová, J.; Takáčová, Š. Incorporating Rainfall-Runoff Events into Nitrate-Nitrogen and Phosphorus Load Assessments for Small Tile-Drained Catchments. Water 2017, 9, 712. https://doi.org/10.3390/w9090712
Fučík P, Zajíček A, Kaplická M, Duffková R, Peterková J, Maxová J, Takáčová Š. Incorporating Rainfall-Runoff Events into Nitrate-Nitrogen and Phosphorus Load Assessments for Small Tile-Drained Catchments. Water. 2017; 9(9):712. https://doi.org/10.3390/w9090712
Chicago/Turabian StyleFučík, Petr, Antonín Zajíček, Markéta Kaplická, Renata Duffková, Jana Peterková, Jana Maxová, and Šárka Takáčová. 2017. "Incorporating Rainfall-Runoff Events into Nitrate-Nitrogen and Phosphorus Load Assessments for Small Tile-Drained Catchments" Water 9, no. 9: 712. https://doi.org/10.3390/w9090712
APA StyleFučík, P., Zajíček, A., Kaplická, M., Duffková, R., Peterková, J., Maxová, J., & Takáčová, Š. (2017). Incorporating Rainfall-Runoff Events into Nitrate-Nitrogen and Phosphorus Load Assessments for Small Tile-Drained Catchments. Water, 9(9), 712. https://doi.org/10.3390/w9090712


