Assessment of the Combined Effects of Threshold Selection and Parameter Estimation of Generalized Pareto Distribution with Applications to Flood Frequency Analysis
Abstract
1. Introduction
2. Materials and Methods
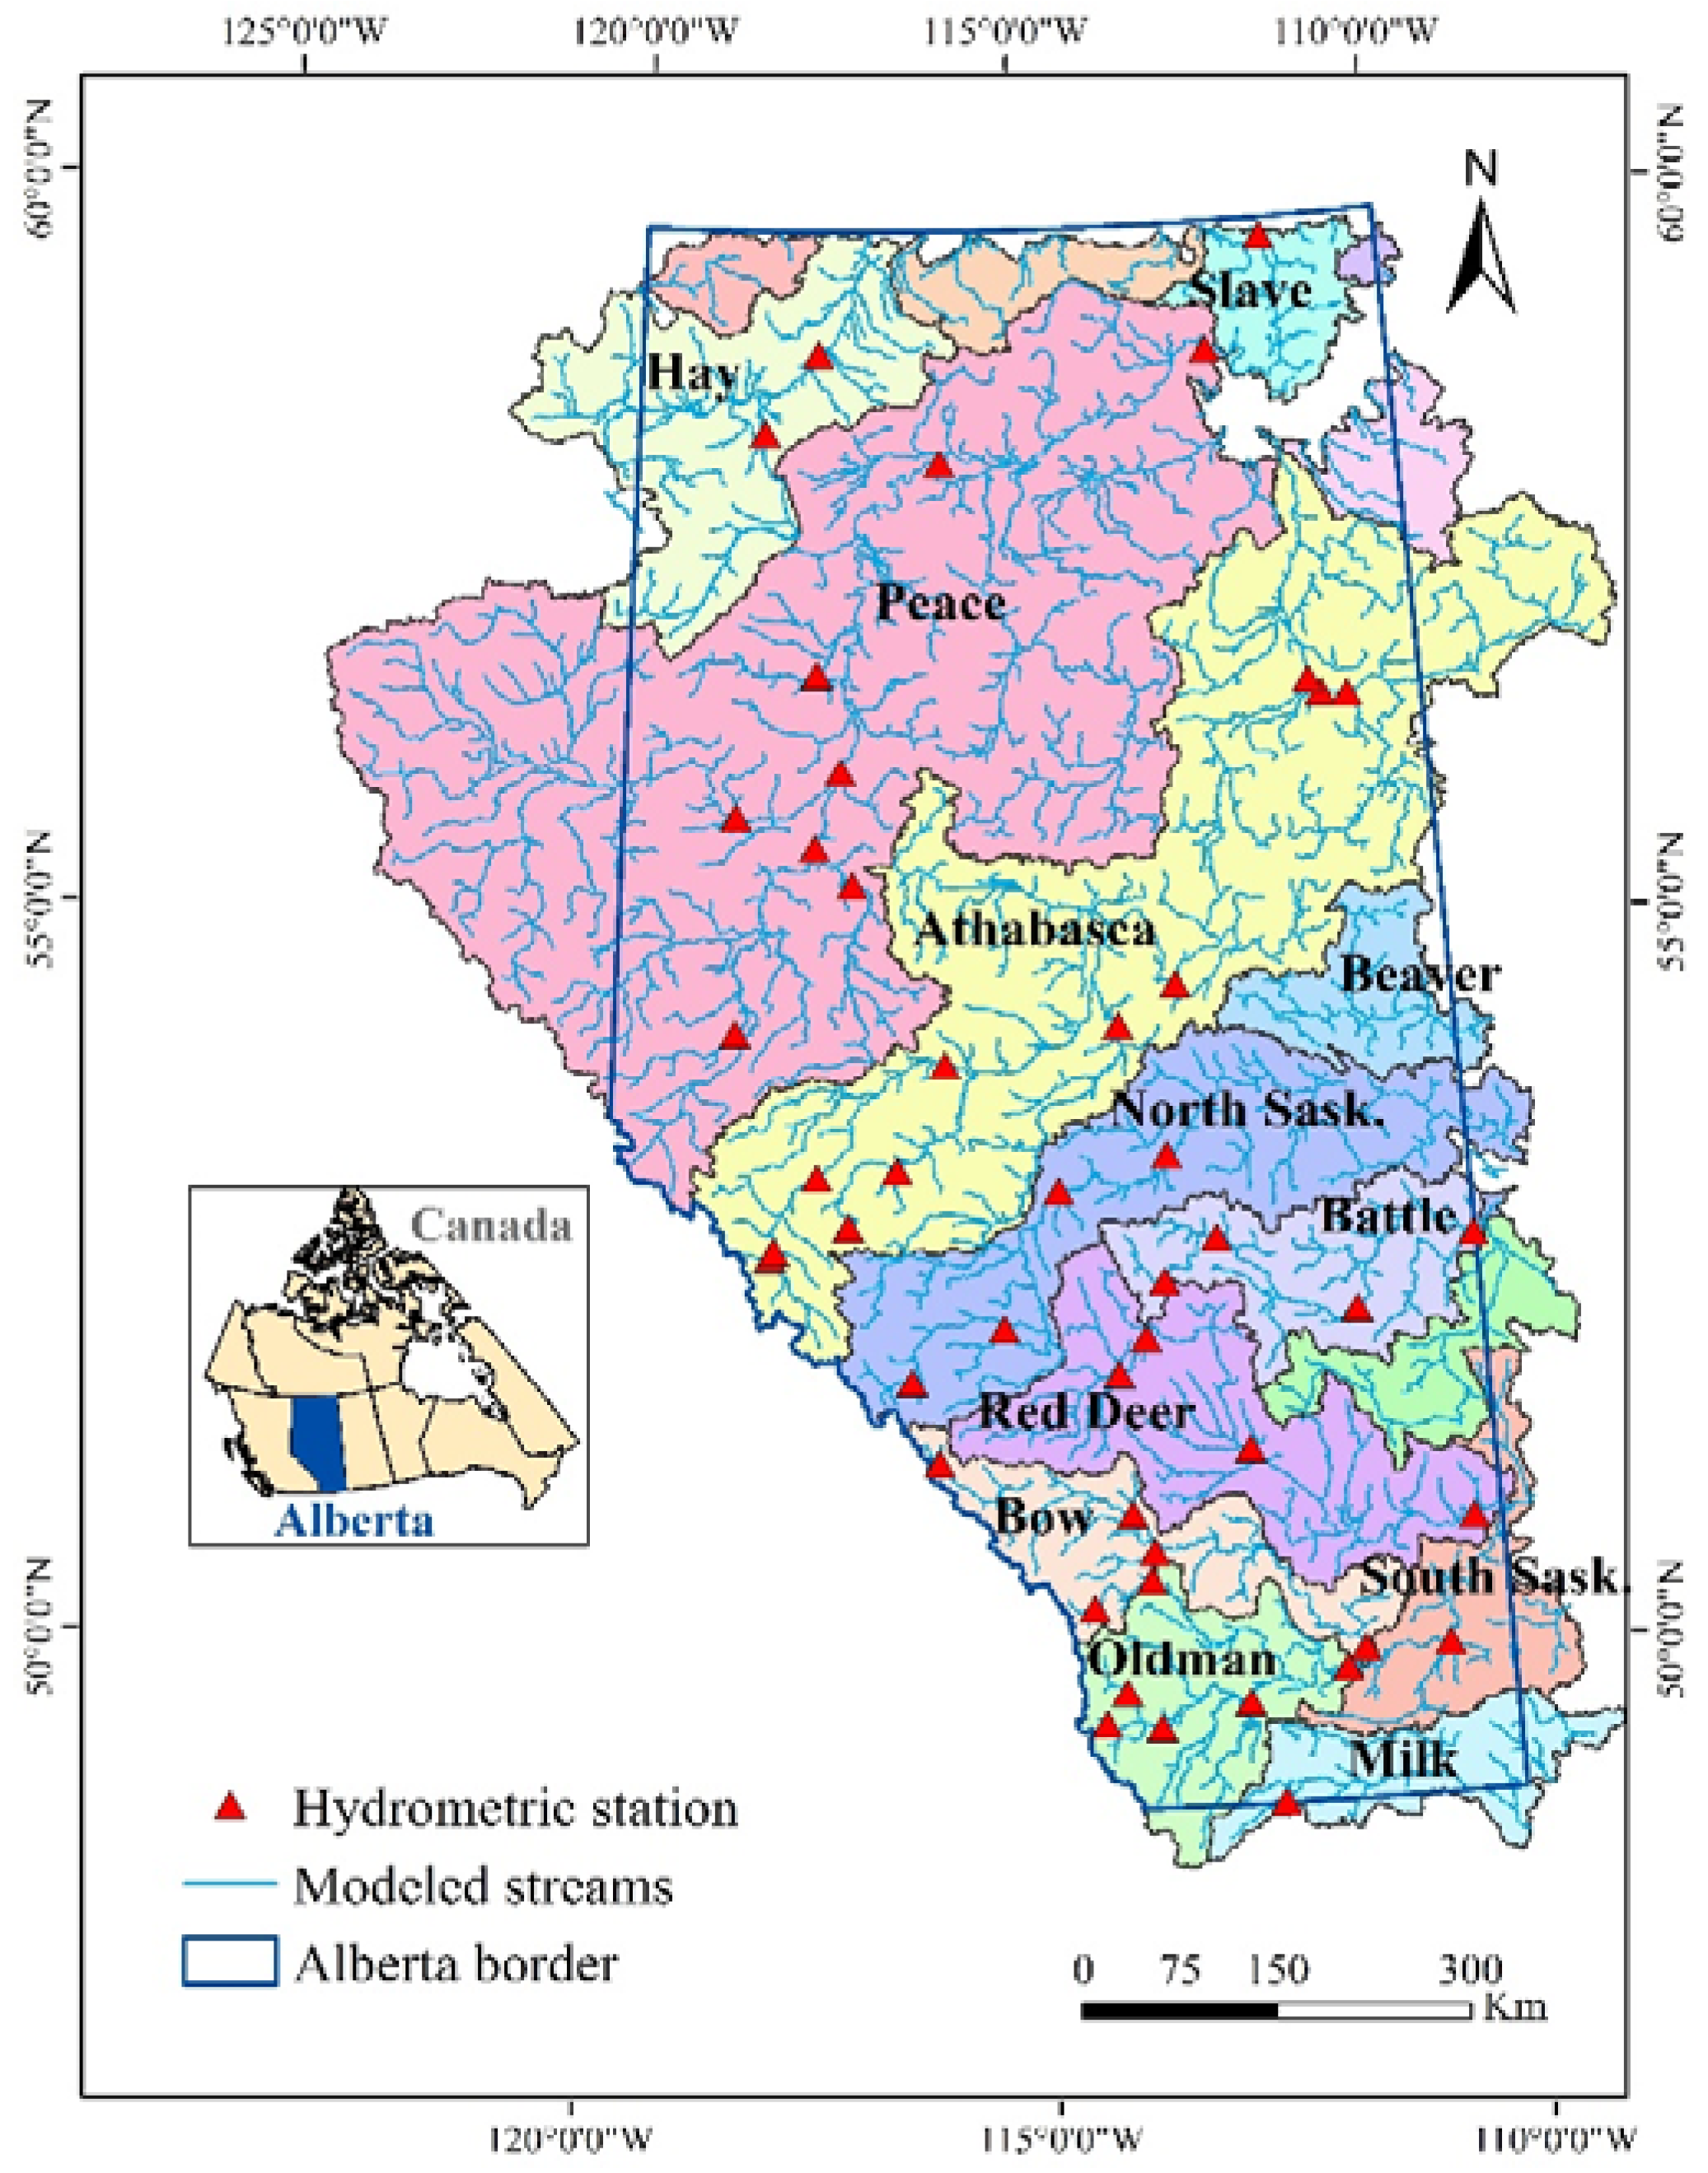
2.1. Study Area, Hydrologic Model, and Data Overview
2.2. Probability Modeling
2.2.1. GPD Parameter Estimators
- Maximum Likelihood Estimator (MLE): MLE is the most efficient method of parameter estimation, particularly for large streamflow sample sizes. It maximizes the likelihood function (L) for the sampled independent flood peaks (x), and is derived from,where . The estimated parameters are the values that maximize Equation (3). Although the algorithms used to compute MLE estimated parameters run into convergence problems, Ashkar and Tatsambon [36] argue that this behavior is simply due to incorrect choice of the numerical algorithm.
- Probability Weighted Moments Estimator (PWM): The PWM estimator has a lower bias and variance than the MLE estimator for sample sizes less than 500 [40]. The PWM of a sampled flood peak (x) with distribution function F is derived from the following equation:
- The Modified Likelihood Moment Estimator (NEWLME): The NEWLME method was proposed by Zhang and Stephens [42] to address complexities in the MLE numerical solution and to avoid computational problems. The method is similar to the Bayesian methods [37] and its solution is calculated as follows:where with is the profile log-likelihood function, and is a data-driven density function for [42]. This allows the parameters to be computed very efficiently [37].
- The Maximum Goodness of Fit–Anderson-Darling Estimator (MGFAD): Moharram et al. [52] proposed least-square type estimators, which are found by minimizing the sum of squared difference between the empirical and the model quantiles. Luceño [27] proposed an estimator with a similar approach, in which the estimates are obtained by minimizing the square differences between the empirical and the model distribution functions using various Goodness of Fit statistics. Luceño [27] included the Cramer-von Mises [30], the Anderson-Darling [30], and the right-tail weighted Anderson-Darling statistics [53]. The different statistics considered by Luceño [27] were found to have strong positive bias and high root-mean-square error (RMSE) in estimating high quantiles for small sample sizes [37]. Only the Maximum Goodness of Fit estimator with Anderson-Darling statistic (MGFAD) was considered in this study.
- The Nonlinear Weighted Least Squares Estimator (NWLS): A new estimator based on the nonlinear weighted least squares estimator (NWLS) was recently proposed by Song and Song [38], and revised and improved by Park and Kim [43]. The calculation of the NWLS estimator is a two-step procedure that is calculated using Equations (7) and (8) as follows:
2.2.2. Performance Analyses of the GPD Estimators and the Monte Carlo (MC) Sampling Experiments
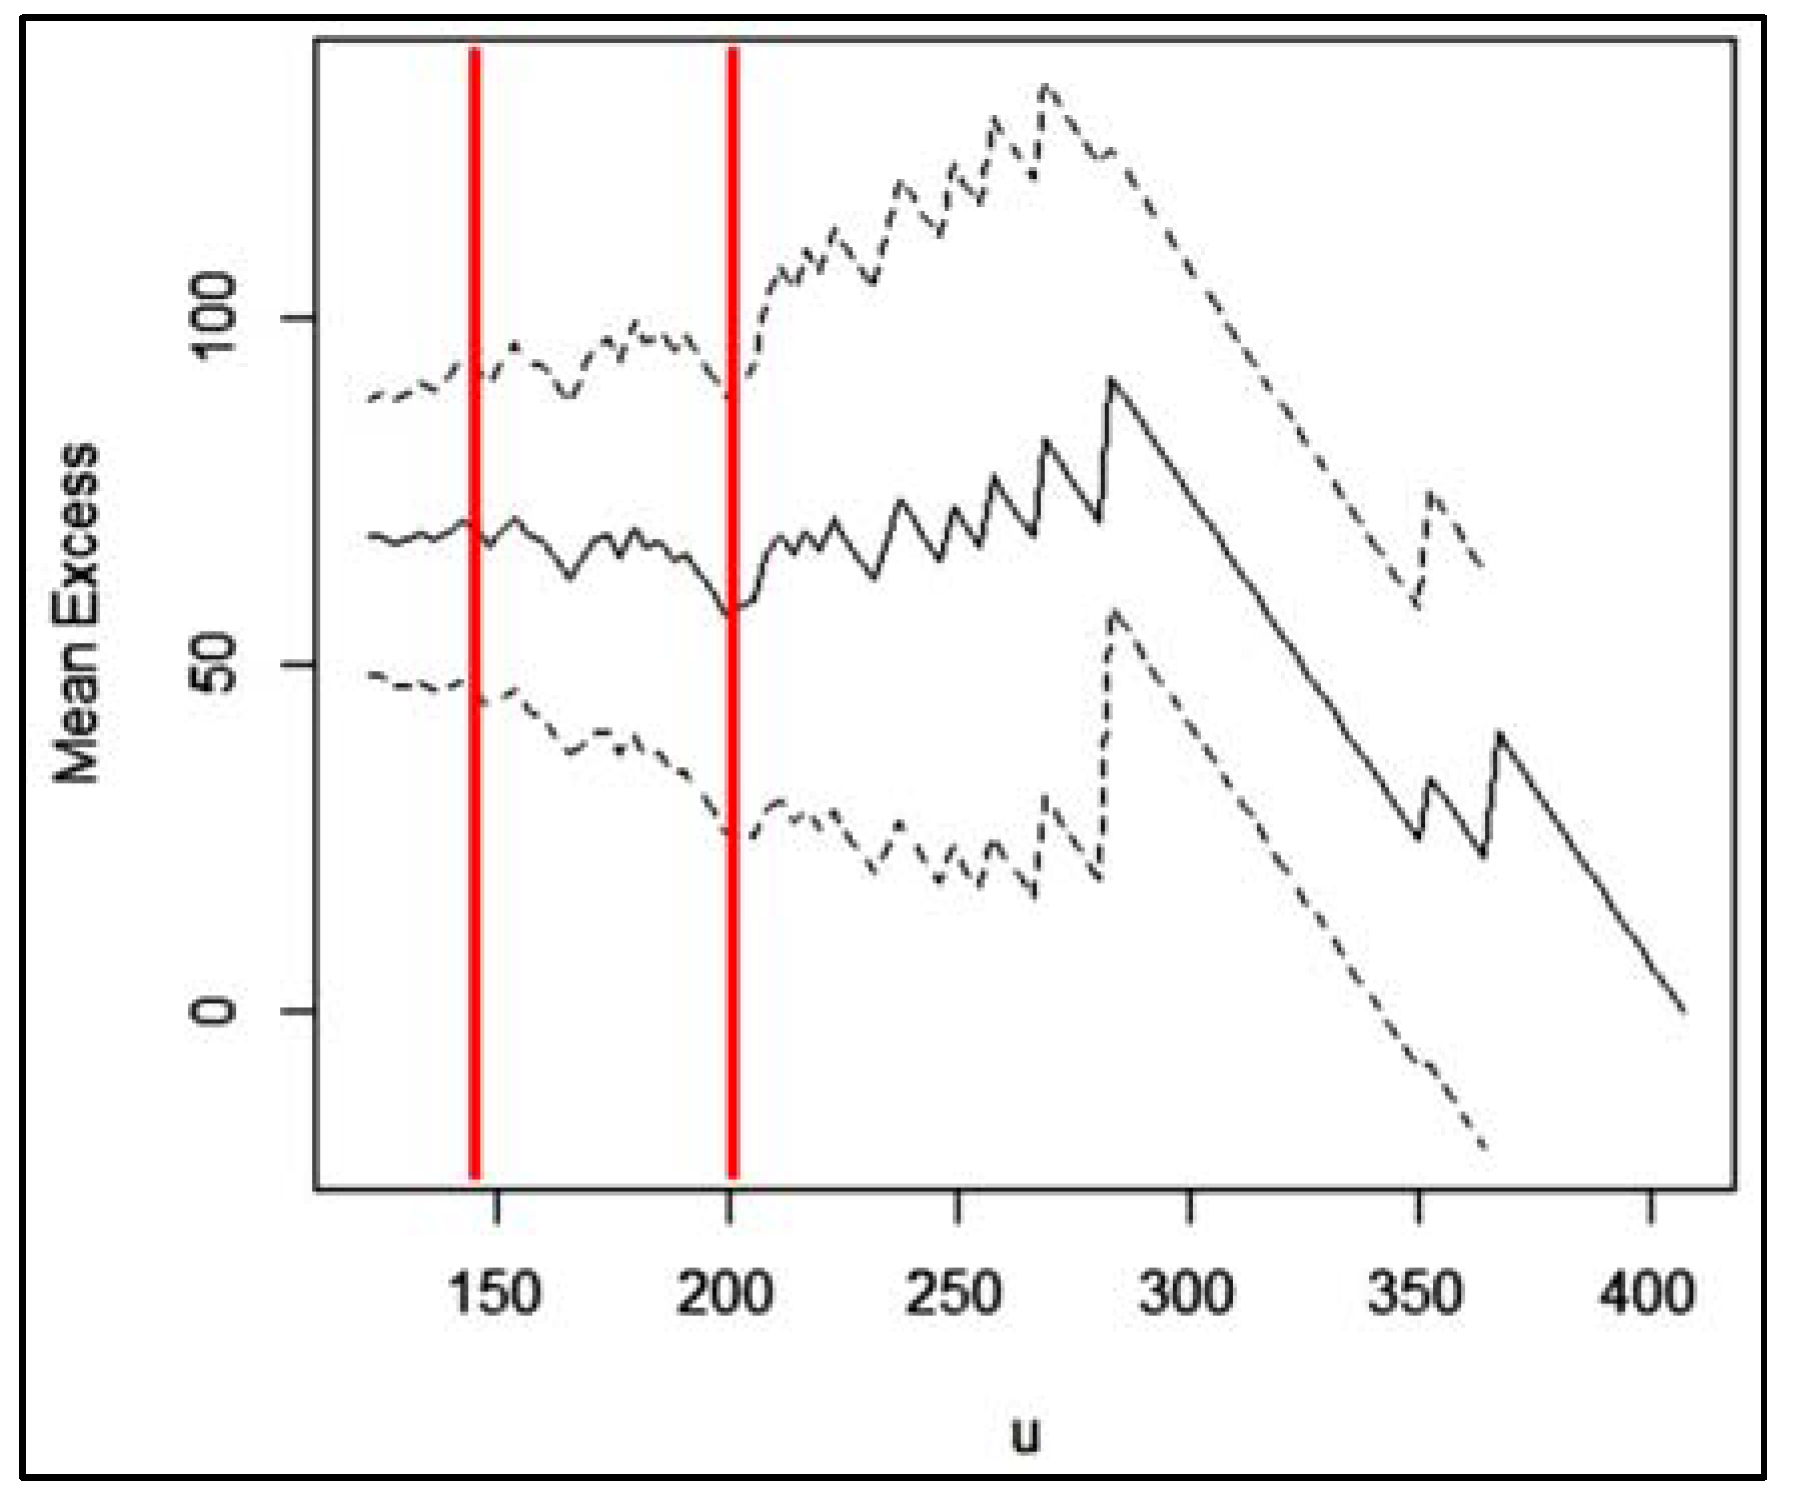
2.2.3. Threshold Selection Methods
- Let be m equally spaced increasing threshold candidates ( is the threshold corresponding to the minimum number of exceedances—the number of years in the record multiplied by 1.65 [24]). For , let be the estimates from any of the six parameter estimators employed in the study of the scale and shape parameters of the GPD underlying the exceedances over the threshold .
- Find , the number of exceedances over .
- Simulate independent samples of size from GPD with parameter .
- For each , and each , calculate the quantile of the th simulated sample compute Equation (9).
- For calculate the square error, , where is the observed quantile corresponding to the simulated quantile.
- The optimal threshold value is the value of minimum .
3. Results and Discussion
3.1. Performance Analyses Results of the GPD Estimators Using MC Sampling Data
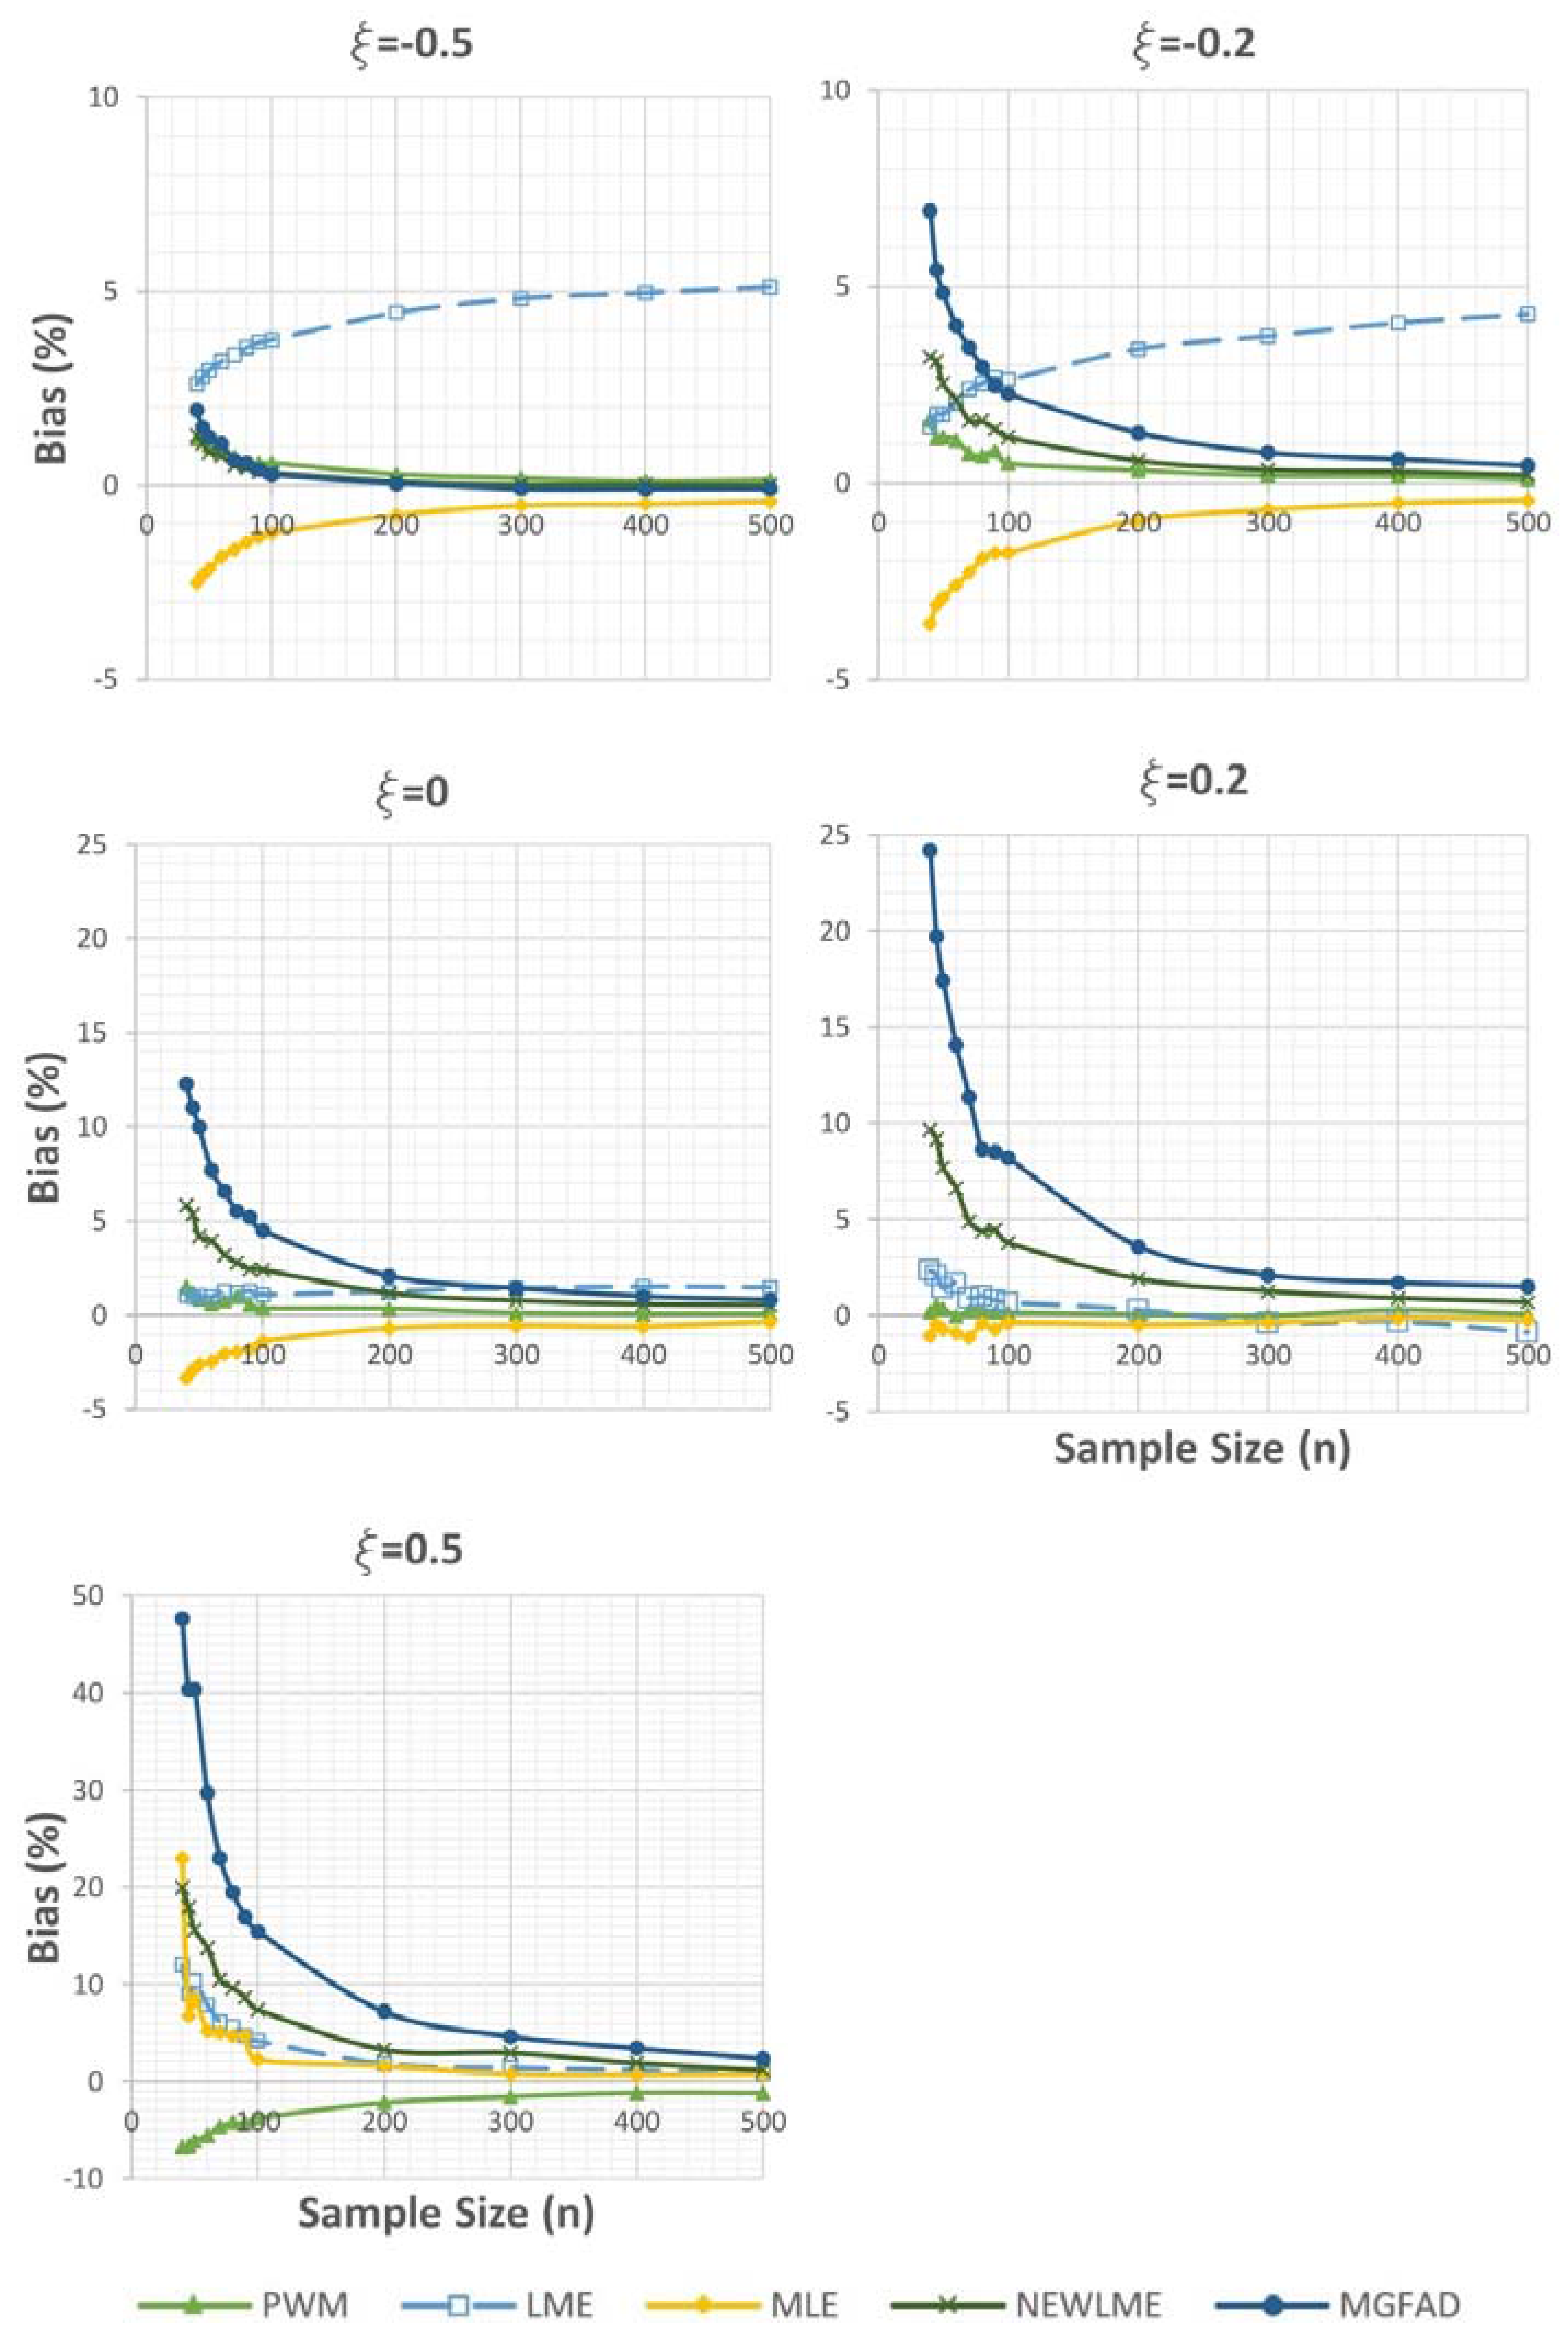
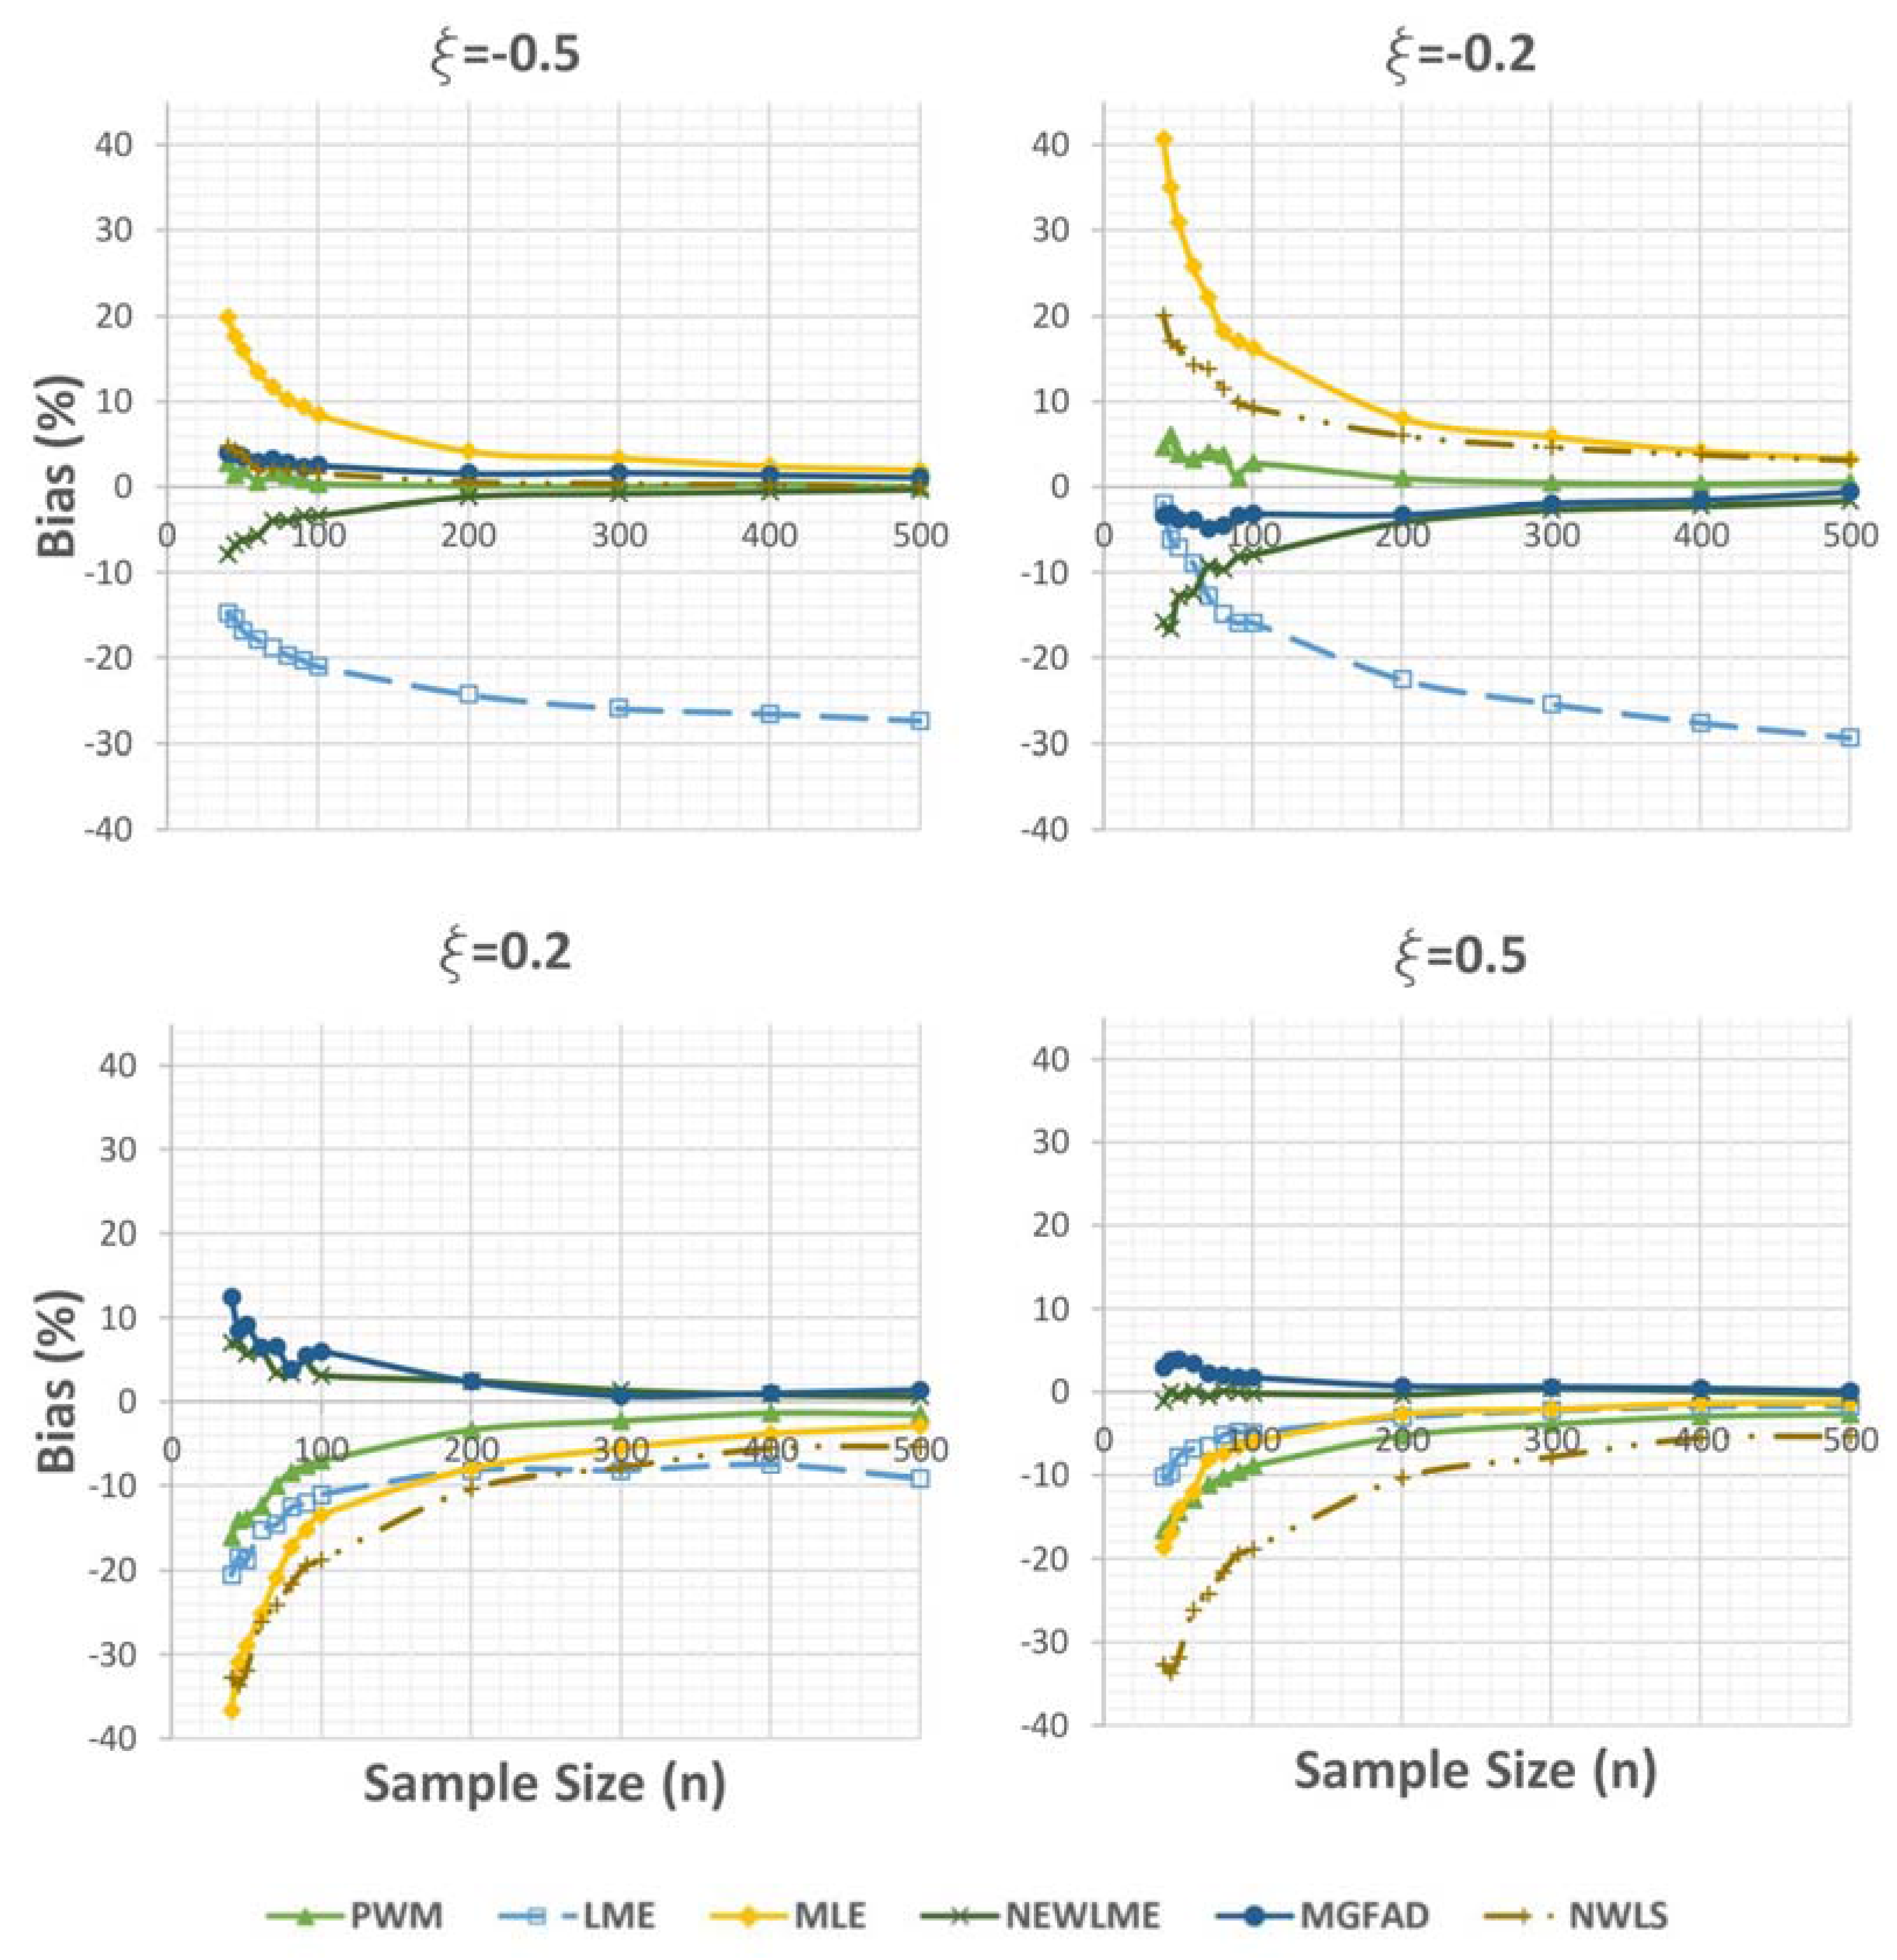
- Generally, the relative bias of estimated parameter values and the 99% quantile decreased with increasing sample size (n). However, for short tails ( < 0) the bias was still high in the case of MLE and LME, even if the sample size was increased to 300.
- PWM: Very consistent and among all methods the least sensitive to sample size (n). However, it had a medium sensitivity to the sample size and medium bias for heavy tails with respect to estimating the shape parameter.
- LME: For heavy tails, LME was among the parameter estimators that had the lowest bias and sensitivity to the sample size. However, for short tails the biases in estimating the 99% quantile and shape parameter were very high.
- MLE: Very accurate in estimating the 99% quantile. However, it had a high bias in estimating the shape parameter and was very sensitive to the sample size for heavy and short tailed distributions.
- NEWLME: Average performance in estimating the 99% quantile for heavy tails and the shape parameter for short tails. In contrast, NEWLME excelled when estimating the shape parameter for heavy tails and estimating the 99% quantile for short tails.
- MGFAD: The most accurate and the least sensitive to sample size in estimating the shape parameter. However, it had a very high bias and sensitivity to the sample size when estimating the 99% quantile.
- NWLS: No trend of decreasing bias with increasing sample size (n) in predicting the 99% quantile. However, it showed a similar trend in the case of shape parameter estimations with average bias compared to the other methods.
3.2. Application of POT to Observed Streamflows
4. Conclusions
Supplementary Materials
Acknowledgments
Author Contributions
Conflicts of Interest
References
- Salvadori, G.; De Michele, C.; Kottegoda, N.T.; Rosso, R. Extremes in Nature An Approach Using Copulas; Springer: Dordrecht, The Netherlands, 2007; ISBN 978-1-4020-4415-1. [Google Scholar]
- Dahlke, H.E.; Lyon, S.W.; Stedinger, J.R.; Rosqvist, G.; Jansson, P. Contrasting trends in floods for two sub-arctic catchments in northern Sweden—Does glacier presence matter? Hydrol. Earth Syst. Sci. 2012, 16, 2123–2141. [Google Scholar] [CrossRef]
- Mora, D.E.; Campozano, L.; Cisneros, F.; Wyseure, G.; Willems, P. Climate changes of hydrometeorological and hydrological extremes in the Paute basin, Ecuadorean Andes. Hydrol. Earth Syst. Sci. 2014, 18, 631–648. [Google Scholar] [CrossRef]
- Huang, S.; Krysanova, V.; Hattermann, F. Projections of climate change impacts on floods and droughts in Germany using an ensemble of climate change scenarios. Reg. Environ. Chang. 2014, 461–473. [Google Scholar] [CrossRef]
- Karl, T.R.; Melillo, J.M.; Peterson, T.C. Global Climate Change Impacts in the United States; Cambridge University Press: Cambridge, UK, 2009; Volume 54, ISBN 9780521144070. [Google Scholar]
- Milly, P.C.D.; Wetherald, R.T.; Dunne, K.A.; Delworth, T.L. Increasing risk of great floods in a changing climate. Nature 2002, 415, 514–517. [Google Scholar] [CrossRef] [PubMed]
- Apollonio, C.; Balacco, G.; Novelli, A.; Tarantino, E.; Piccinni, A. Land Use Change Impact on Flooding Areas: The Case Study of Cervaro Basin (Italy). Sustainability 2016, 8, 996. [Google Scholar] [CrossRef]
- Pomeroy, J.W.; Stewart, R.E.; Whitfield, P.H. The 2013 flood event in the South Saskatchewan and Elk River basins: Causes, assessment and damages. Can. Water Resour. J./Rev. Can. Ressour. Hydr. 2016, 41, 106–118. [Google Scholar] [CrossRef]
- Rice, D. U.S. had more floods in 2016 than any year on record. USA Today, 4 January 2017. Available online: https://www.usatoday.com/story/weather/2017/01/04/floods-natural-disasters-2016/96120150/ (accessed on 2 February 2017).
- In den Bäumen, H. S.; Többen, J.; Lenzen, M. Labour forced impacts and production losses due to the 2013 flood in Germany. J. Hydrol. 2015, 527, 142–150. [Google Scholar] [CrossRef]
- Bobée, B.; Rasmussen, P.F. Recent advances in flood frequency analysis. Rev. Geophys. 1995, 33, 1111–1116. [Google Scholar] [CrossRef]
- Mateo Lázaro, J.; Sánchez Navarro, J.Á.; García Gil, A.; Edo Romero, V. Flood Frequency Analysis (FFA) in Spanish catchments. J. Hydrol. 2016, 538, 598–608. [Google Scholar] [CrossRef]
- Vittal, H.; Singh, J.; Kumar, P.; Karmakar, S. A framework for multivariate data-based at-site flood frequency analysis: Essentiality of the conjugal application of parametric and nonparametric approaches. J. Hydrol. 2015, 525, 658–675. [Google Scholar] [CrossRef]
- Iacobellis, V.; Gioia, A.; Manfreda, S.; Fiorentino, M. Flood quantiles estimation based on theoretically derived distributions: Regional analysis in Southern Italy. Nat. Hazards Earth Syst. Sci. 2011, 11, 673–695. [Google Scholar] [CrossRef]
- Mkhandi, S.; Opere, A.; Willems, P. Comparison between annual maximum and peaks over threshold models for flood frequency prediction. In Proceedings of the International Conference of UNESCO Flanders FIT FRIEND/Nile Project—‘Towards a Better Cooperation’, Sharm El-Sheikh, Egypt, 12–14 November 2005; Volume 1, pp. 1–15. [Google Scholar]
- Engeland, K.; Hisdal, H.; Frigessi, A. Practical extreme value modelling of hydrological floods and droughts: A case study. Extremes 2005, 7, 5–30. [Google Scholar] [CrossRef]
- Coles, S.G. An Introduction to Statistical Modeling of Extreme Values; Springer: London, UK, 2001; pp. 74–83. ISBN 1852334592. [Google Scholar]
- Rao, A.R.; Hamed, K.H. Flood Frequency Analysis; CRC Press: Boca Raton, FL, USA, 1999; pp. 27–29. [Google Scholar]
- Lang, M.; Ouarda, T.B.M.J.; Bobée, B. Towards operational guidelines for over-threshold modeling. J. Hydrol. 1999, 225, 103–117. [Google Scholar] [CrossRef]
- Rosbjerg, D.; Madsen, H.; Rasmussen, P.F. Prediction in partial duration series with generalized pareto distributed exceedances. Water Resour. Res. 1992, 28, 3001–3010. [Google Scholar] [CrossRef]
- Rasmussen, P.F. The Partial Duration Series Approach to Flood Frequency Analysis; Series Paper; Institute of Hydrodynamics and Hydraulic Engineering, Technical University of Denmark: Lyngby, Denmark, 1991. [Google Scholar]
- Li, Z.; Wang, Y.; Zhao, W.; Xu, Z.; Li, Z. Frequency Analysis of High Flow Extremes in Northwest China. Water 2016, 8, 215. [Google Scholar] [CrossRef]
- Madsen, H.; Pearson, C.P.; Rosbjerg, D. Comparison of annual maximum series and partial duration series methods for modeling extreme hydrologic events: 1. At site modeling. Water Resour. Res. 1997, 33, 759. [Google Scholar] [CrossRef]
- Cunnane, C. A particular comparison of annual maxima and partial duration series methods of flood frequency prediction. J. Hydrol. 1973, 18, 257–271. [Google Scholar] [CrossRef]
- Zoglat, A.; El Adlouni, S.; Badaoui, F.; Amar, A.; Okou, C.G. Managing Hydrological Risks with Extreme Modeling: Application of Peaks over Threshold Model to the Loukkos Watershed, Morocco. J. Hydrol. Eng. 2014, 19, 5014010. [Google Scholar] [CrossRef]
- Smith, J.A. Estimating the Upper Tail of Flood Frequency Distributions. Water Resour. Res. 1987, 23, 1657–1666. [Google Scholar] [CrossRef]
- Luceño, A. Fitting the generalized Pareto distribution to data using maximum goodness-of-fit estimators. Comput. Stat. Data Anal. 2006, 51, 904–917. [Google Scholar] [CrossRef]
- Solari, S.; Losada, M.A. A unified statistical model for hydrological variables including the selection of threshold for the peak over threshold method. Water Resour. Res. 2012, 48, 1–15. [Google Scholar] [CrossRef]
- Dupuis, D.J. Exceedances over High Thresholds: A Guide to Threshold Selection. Extremes 1999, 1, 251–261. [Google Scholar] [CrossRef]
- Choulakian, V.; Stephens, M.A. Goodness-of-Fit Tests for the Generalized Pareto Distribution. Technometrics 2001, 43, 478–484. [Google Scholar] [CrossRef]
- Neves, C.; Alves, M.I.F. Reiss and Thomas’ automatic selection of the number of extremes. Comput. Stat. Data Anal. 2004, 47, 689–704. [Google Scholar] [CrossRef]
- Thompson, P.; Cai, Y.; Reeve, D.; Stander, J. Automated threshold selection methods for extreme wave analysis. Coast. Eng. 2009, 56, 1013–1021. [Google Scholar] [CrossRef]
- Wadsworth, J.L.; Tawn, J.A. Likelihood-based procedures for threshold diagnostics and uncertainty in extreme value modelling. J. R. Stat. Soc. Ser. B Stat. Methodol. 2012, 74, 543–567. [Google Scholar] [CrossRef]
- Zhang, X.; Ge, W. A new method to choose the threshold in the POT model. In Proceedings of the 2009 1st International Conference on Information Science and Engineering (ICISE), Nanjing, China, 26–28 December 2009; pp. 750–753. [Google Scholar]
- Davison, A.C.; Smith, R.L. Models for Exceedances over High Thresholds Published by: Wiley for the Royal Statistical Society. J. R. Stat. Soc. Ser. B Methodol. 1990, 52, 393–442. [Google Scholar]
- Ashkar, F.; Nwentsa Tatsambon, C. Revisiting some estimation methods for the generalized Pareto distribution. J. Hydrol. 2007, 346, 136–143. [Google Scholar] [CrossRef]
- MacKay, E.B.L.; Challenor, P.G.; Bahaj, A.S. A comparison of estimators for the generalised Pareto distribution. Ocean Eng. 2011, 38, 1338–1346. [Google Scholar] [CrossRef]
- Song, J.; Song, S. A quantile estimation for massive data with generalized Pareto distribution. Comput. Stat. Data Anal. 2012, 56, 143–150. [Google Scholar] [CrossRef]
- Pickands, J. Statistical Inference Using Extreme Order Statistics. Ann. Stat. 1975, 3, 119–131. [Google Scholar]
- Hosking, J.R.M.; Wallis, J.R. Parameter and Quantile Estimation for the Generalized Pareto Distribution. Technometrics 1987, 29, 339–349. [Google Scholar] [CrossRef]
- Zhang, J. Likelihood moment estimation for the generalized Pareto distribution. Aust. N. Z. J. Stat. 2007, 49, 69–77. [Google Scholar] [CrossRef]
- Zhang, J.; Stephens, M.A. A New and Efficient Estimation Method for the Generalized Pareto Distribution. Technometrics 2009, 51, 316–325. [Google Scholar] [CrossRef]
- Park, M.H.; Kim, J.H.T. Estimating extreme tail risk measures with generalized Pareto distribution. Comput. Stat. Data Anal. 2016, 98, 91–104. [Google Scholar] [CrossRef]
- De Zea Bermudez, P.; Kotz, S. Parameter estimation of the generalized Pareto distribution-Part I. J. Stat. Plan. Inference 2010, 140, 1353–1373. [Google Scholar] [CrossRef]
- Zhang, Y.; Cao, Y.; Dai, J. Quantification of statistical uncertainties in performing the peak over threshold method. J. Mar. Sci. Technol. 2015, 23, 717–726. [Google Scholar] [CrossRef]
- Beguería, S. Uncertainties in partial duration series modelling of extremes related to the choice of the threshold value. J. Hydrol. 2005, 303, 215–230. [Google Scholar] [CrossRef]
- Faramarzi, M.; Abbaspour, K.C.; Adamowicz, W.L.V.; Lu, W.; Fennell, J.; Zehnder, A.J.B.; Goss, G.G. Uncertainty based assessment of dynamic freshwater scarcity in semi-arid watersheds of Alberta, Canada. J. Hydrol. Reg. Stud. 2017, 9, 48–68. [Google Scholar] [CrossRef]
- Faramarzi, M.; Srinivasan, R.; Iravani, M.; Bladon, K.D.; Abbaspour, K.C.; Zehnder, A.J.B.; Goss, G.G. Setting up a hydrological model of Alberta: Data discrimination analyses prior to calibration. Environ. Model. Softw. 2015, 74, 48–65. [Google Scholar] [CrossRef]
- Jiang, R.; Gan, T.Y.; Xie, J.; Wang, N. Spatiotemporal variability of Alberta’s seasonal precipitation, their teleconnection with large-scale climate anomalies and sea surface temperature. Int. J. Climatol. 2014, 34, 2899–2917. [Google Scholar] [CrossRef]
- Jiang, R.; Gan, T.Y.; Xie, J.; Wang, N.; Kuo, C.C. Historical and potential changes of precipitation and temperature of Alberta subjected to climate change impact: 1900–2100. Theor. Appl. Climatol. 2015. [Google Scholar] [CrossRef]
- Beirlant, J.; Dierckx, G.; Guillou, A. Estimation of the extreme-value index and generalized quantile plots. Bernoulli 2005, 11, 949–970. [Google Scholar] [CrossRef]
- Moharram, S.H.; Gosain, A.K.; Kapoor, P.N. A comparative study for the estimators of the Generalized Pareto distribution. J. Hydrol. 1993, 150, 169–185. [Google Scholar] [CrossRef]
- Chernobai, A.; Rachev, S.T.; Fabozzi, F.J. Composite Goodness-of-Fit Tests for Left-Truncated Loss Samples. In Handbook of Financial Econometrics and Statistics; Lee, C.-F., Lee, J.C., Eds.; Springer: New York, NY, USA, 2015; pp. 575–596. ISBN 978-1-4614-7750-1. [Google Scholar]
- Kroese, D.P.; Brereton, T.; Taimre, T.; Botev, Z.I. Why the Monte Carlo method is so important today. Wiley Interdiscip. Rev. Comput. Stat. 2014, 6, 386–392. [Google Scholar] [CrossRef]
- Solari, S.; Egüen, M.; Polo, M.J.; Losada, M.A. Peaks Over Threshold (POT): Amethodology for automatic threshold estimation using goodness of fit p-value. Water Resour. Res. 2017, 53, 2833–2849, Received. [Google Scholar] [CrossRef]
- Brockwell, P.; Davis, R. Introduction to Time Series and Forecasting; Springer: New York, NY, USA, 2002; pp. 94–95. ISBN 0387953515. [Google Scholar]
- Ashkar, F.; Rousselle, J. The effect of certain restrictions imposed on the interarrival times of flood events on the Poisson distribution used for modeling flood counts. Water Resour. Res. 1983, 19, 481–485. [Google Scholar] [CrossRef]
- R Core Team. R: A Language and Environment for Statistical Computing; R Foundation for Statistical Computing: Vienna, Austria, 2016. [Google Scholar]
- Hyndman, R.J.; Khandakar, Y. Automatic time series forecasting: The forecast package for R. J. Stat. Softw. 2008, 27, 1–22. [Google Scholar] [CrossRef]
- Cunnane, C. A note on the Poisson assumption in partial duration series models. Water Resour. Res. 1979, 15, 489. [Google Scholar] [CrossRef]
- Önöz, B.; Bayazit, M. Effect of the occurrence process of the peaks over threshold on the flood estimates. J. Hydrol. 2001, 244, 86–96. [Google Scholar] [CrossRef]
- Zhang, J. Improving on Estimation for the Generalized Pareto Distribution. Technometrics 2010, 52, 335–339. [Google Scholar] [CrossRef]


| Parameter Estimator | Shape Parameter | 99% Quantile | ||
|---|---|---|---|---|
| > 0 | < 0 | > 0 | < 0 | |
| PWM | Medium | Low | Low | Low |
| LME | Low | High | Low | High |
| MLE | High | High | Low | Low |
| NEWLME | Low | Medium | Medium | Low |
| MGFAD | Low | Low | High | High |
| NWLS | High | Medium | High | High |
| Parameter Estimator | PWM | LME | MLE | NEWLME | MGFAD | NWLS | |
|---|---|---|---|---|---|---|---|
| Ξ | ξ > 0 | Low | Low | Low | Low | Medium | High |
| ξ < 0 | Low | Medium | High | Medium | High | Medium | |
| AD | ξ > 0.4 | Low | Low | Low | Low | Low | Low |
| 0.4 > ξ > 0.2 | Low | High | High | Low | Low | Low | |
| 0.2 > ξ > 0 | Low | Low | High | Low | Low | Low | |
| 0 > ξ > −0.15 | Low | Low | High | Medium | Medium | Low | |
| −0.15 > ξ > −0.25 | Low | Low | Low | High | Low | Low | |
| ξ < −0.25 | Medium | Low | Low | High | Medium | Medium | |
| RMSE | ξ > 0.4 | Low | Low | Low | Low | Low | Low |
| 0.4 > ξ > 0.2 | Low | Low | Low | Low | Low | Low | |
| 0.2 > ξ > 0 | Low | Low | Low | Low | Low | Low | |
| 0 > ξ > −0.15 | Low | Low | Low | Low | Low | Low | |
| −0.15 > ξ > −0.25 | Low | Low | Medium | Low | Low | Low | |
| ξ < −0.25 | Low | Low | Low | Low | Low | Low | |
| Parameter Estimator | PWM | LME | MLE | NEWLME | MGFAD | NWLS | |
|---|---|---|---|---|---|---|---|
| Ξ | ξ > 0 | Low | Low | Low | Low | Low | Low |
| ξ < 0 | Low | Low | Low | Low | Low | Low | |
| AD | ξ > 0.4 | Low | Low | Low | Low | Low | High |
| 0.4 > ξ > 0.2 | Low | Low | Low | Low | Low | Low | |
| 0.2 > ξ > 0 | Low | Low | Low | Low | Low | Low | |
| 0 > ξ > −0.15 | Low | Low | Low | Low | Low | Low | |
| −0.15 > ξ > −0.25 | Low | Low | Low | Medium | Low | Low | |
| ξ < −0.25 | High | Medium | Low | High | Medium | High | |
| RMSE | ξ > 0.4 | High | High | High | High | Medium | Low |
| 0.4 > ξ > 0.2 | High | High | High | Medium | High | High | |
| 0.2 > ξ > 0 | High | High | High | Low | Low | Low | |
| 0 > ξ > −0.15 | High | High | High | Medium | Medium | Medium | |
| −0.15 > ξ > −0.25 | High | High | High | Low | Medium | Medium | |
| ξ < −0.25 | Low | High | Medium | Medium | Medium | High | |
© 2017 by the authors. Licensee MDPI, Basel, Switzerland. This article is an open access article distributed under the terms and conditions of the Creative Commons Attribution (CC BY) license (http://creativecommons.org/licenses/by/4.0/).
Share and Cite
Gharib, A.; Davies, E.G.R.; Goss, G.G.; Faramarzi, M. Assessment of the Combined Effects of Threshold Selection and Parameter Estimation of Generalized Pareto Distribution with Applications to Flood Frequency Analysis. Water 2017, 9, 692. https://doi.org/10.3390/w9090692
Gharib A, Davies EGR, Goss GG, Faramarzi M. Assessment of the Combined Effects of Threshold Selection and Parameter Estimation of Generalized Pareto Distribution with Applications to Flood Frequency Analysis. Water. 2017; 9(9):692. https://doi.org/10.3390/w9090692
Chicago/Turabian StyleGharib, Amr, Evan G. R. Davies, Greg G. Goss, and Monireh Faramarzi. 2017. "Assessment of the Combined Effects of Threshold Selection and Parameter Estimation of Generalized Pareto Distribution with Applications to Flood Frequency Analysis" Water 9, no. 9: 692. https://doi.org/10.3390/w9090692
APA StyleGharib, A., Davies, E. G. R., Goss, G. G., & Faramarzi, M. (2017). Assessment of the Combined Effects of Threshold Selection and Parameter Estimation of Generalized Pareto Distribution with Applications to Flood Frequency Analysis. Water, 9(9), 692. https://doi.org/10.3390/w9090692


