Virtual Water Flows at the County Level in the Heihe River Basin, China


Abstract
1. Introduction
2. Study Area and Data
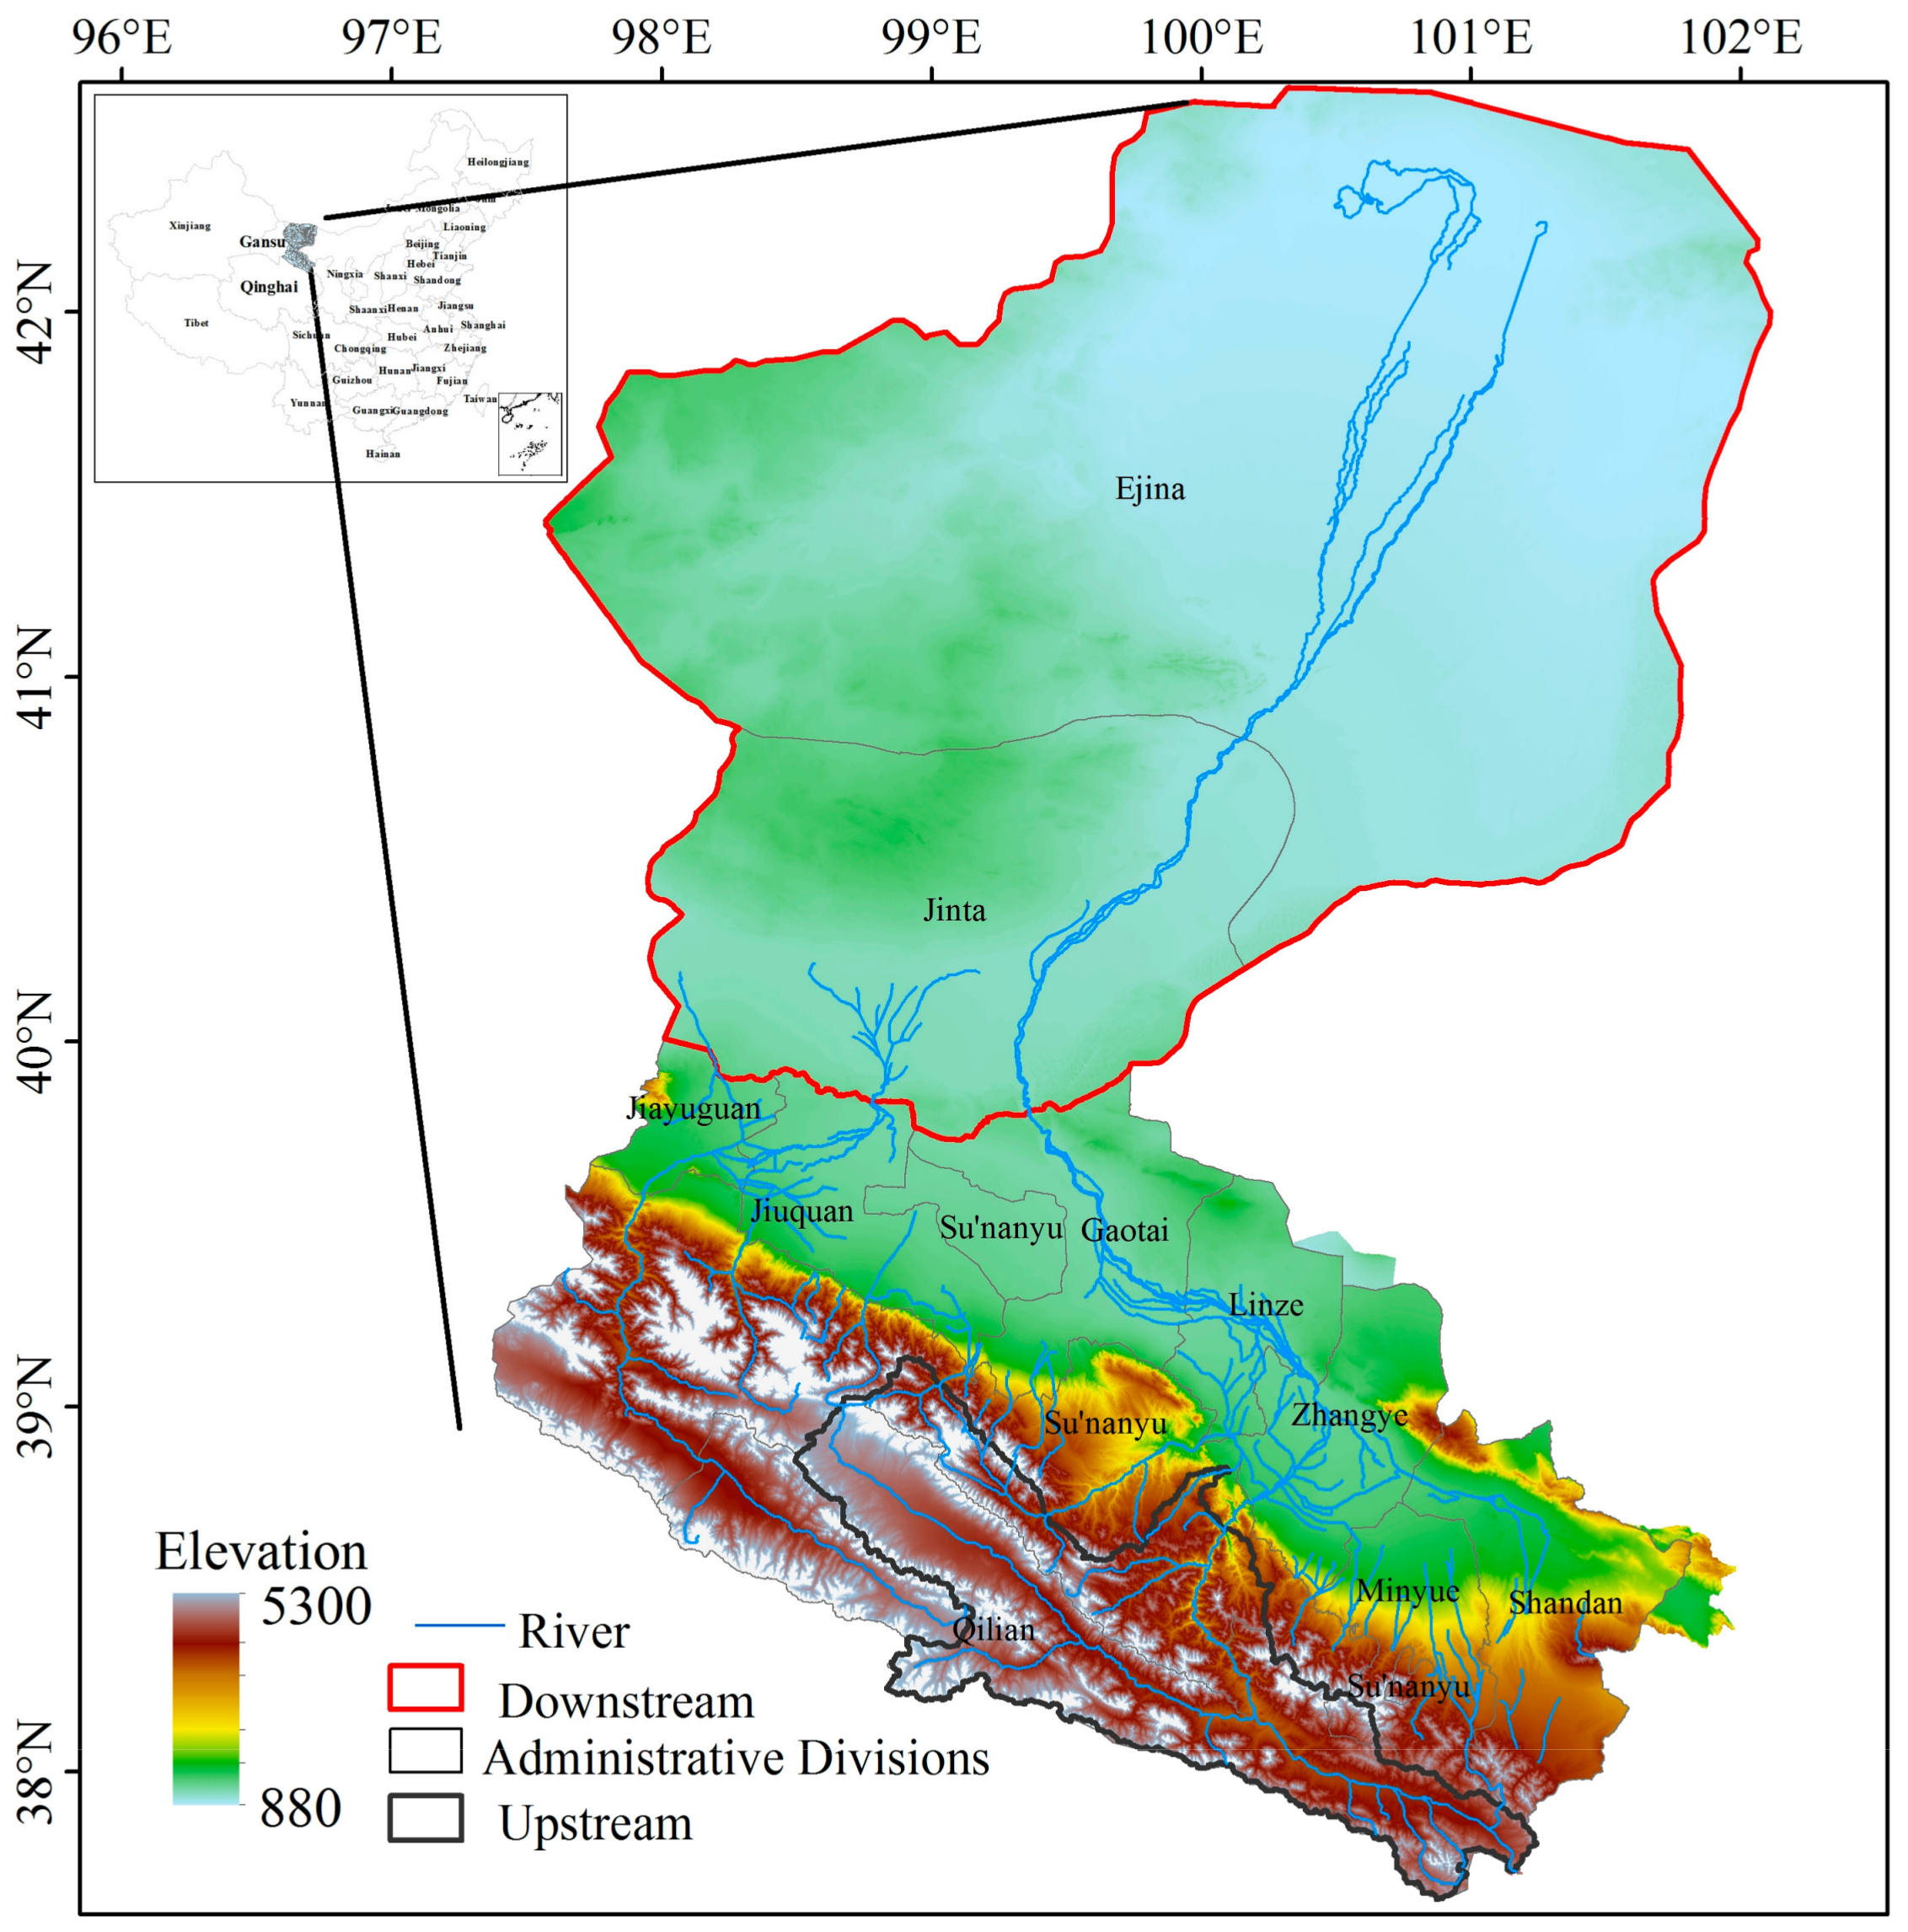
2.1. Study Area
2.2. Methods
2.2.1. Multi-Regional Input–Output Model
2.2.2. Water Stress Index
2.3. Data Sources
3. Results and Discussion
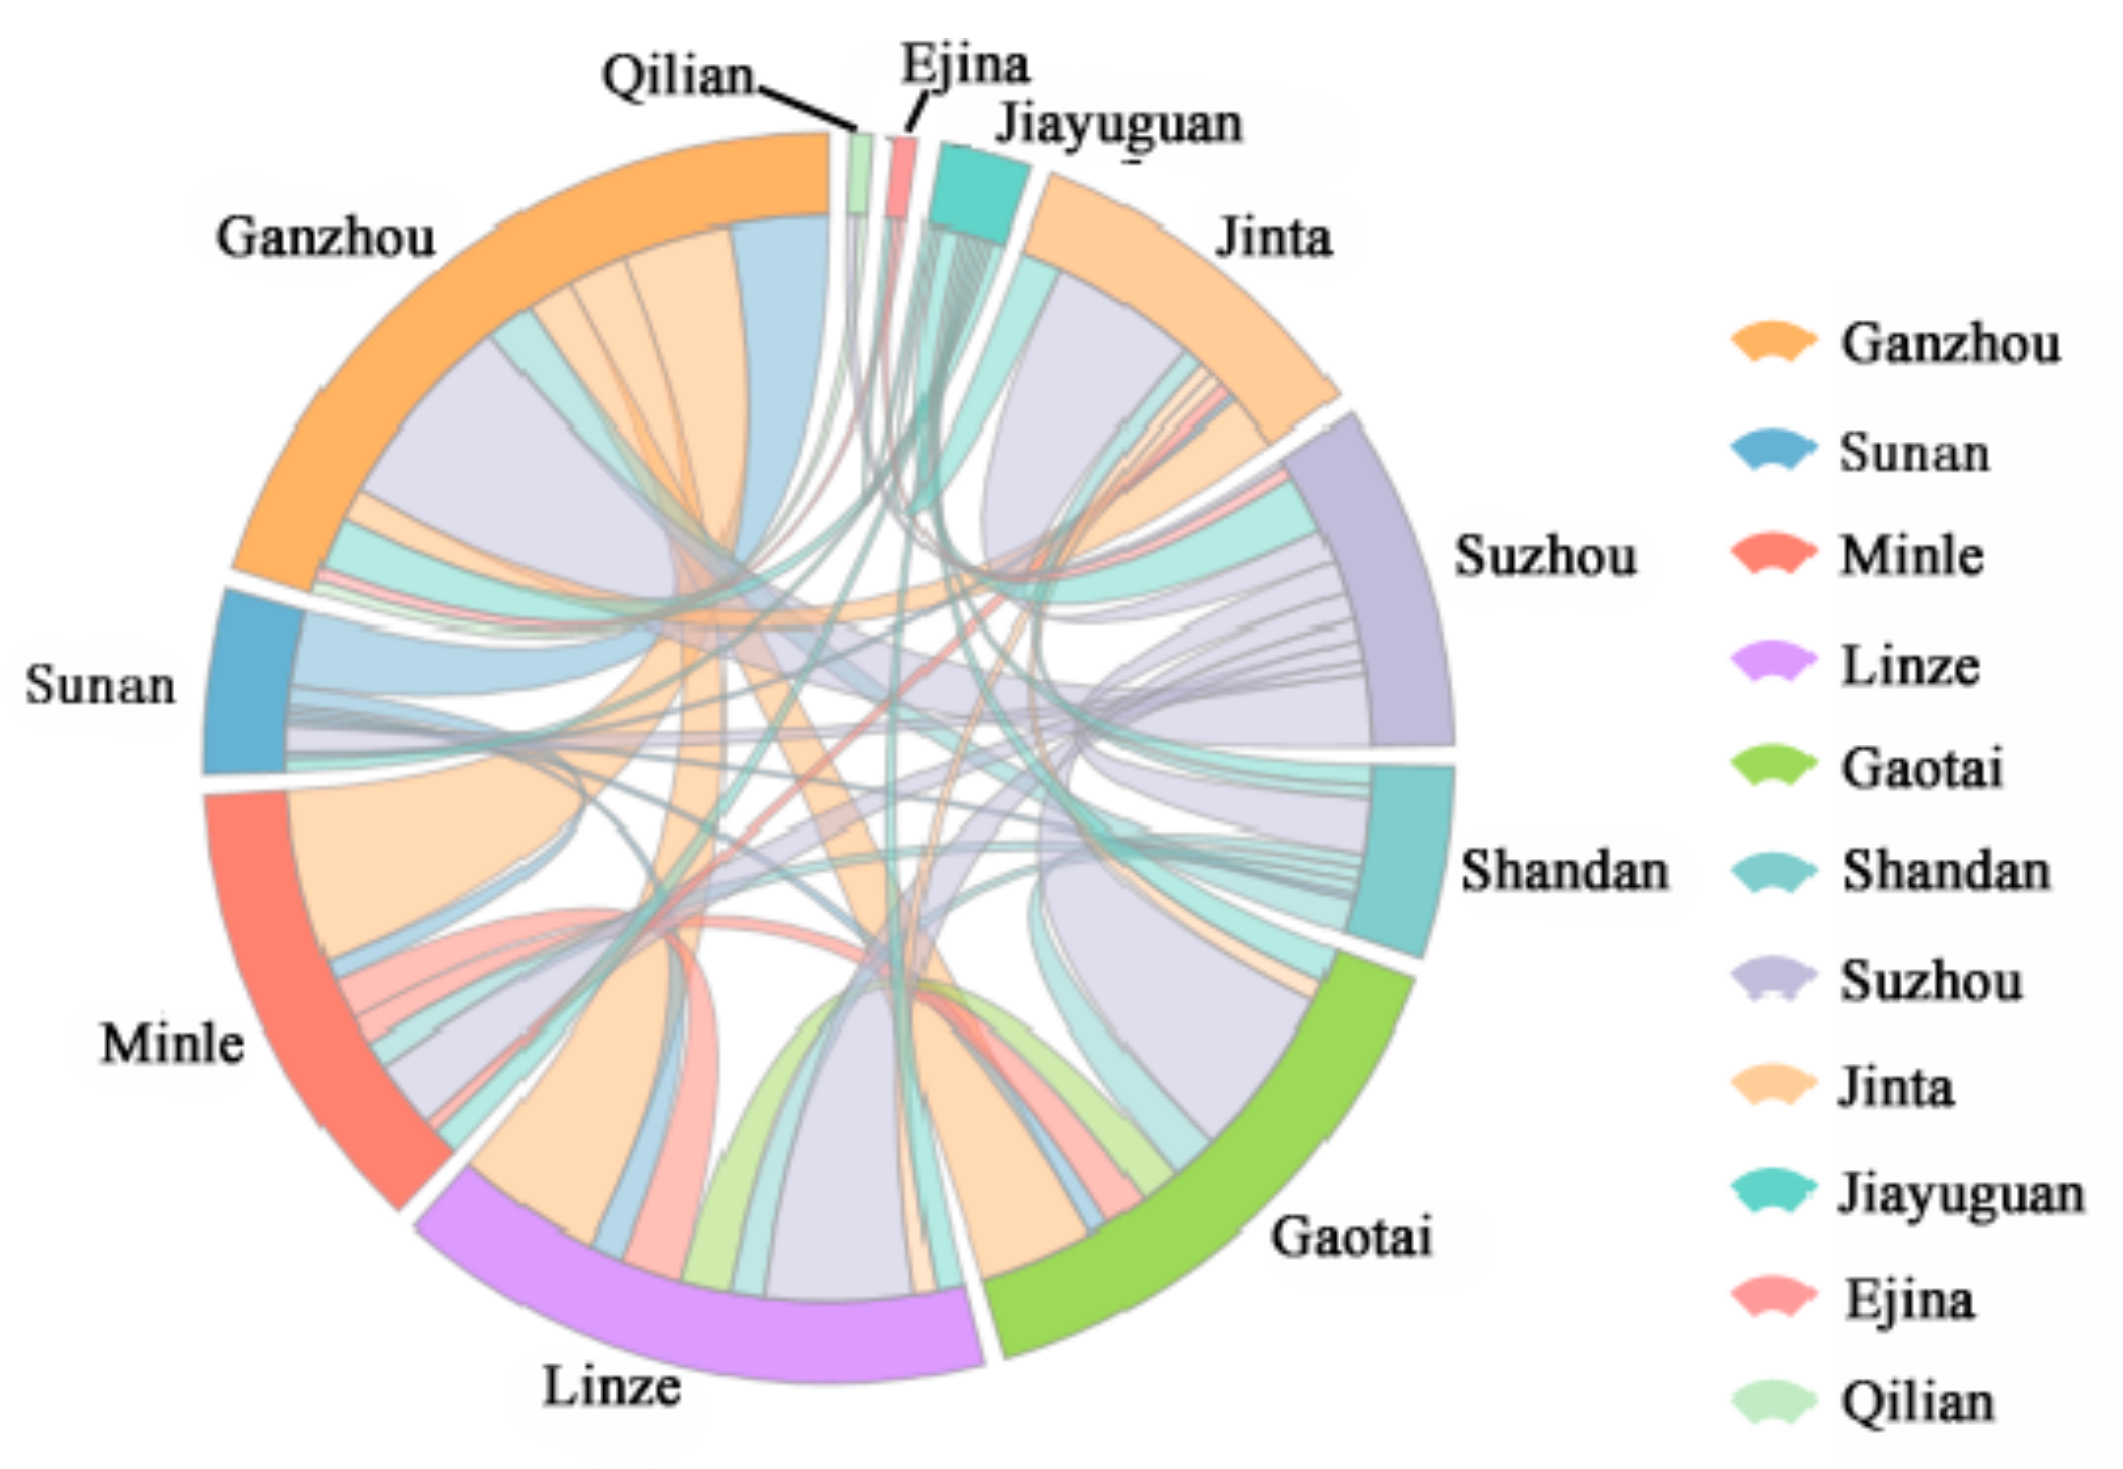
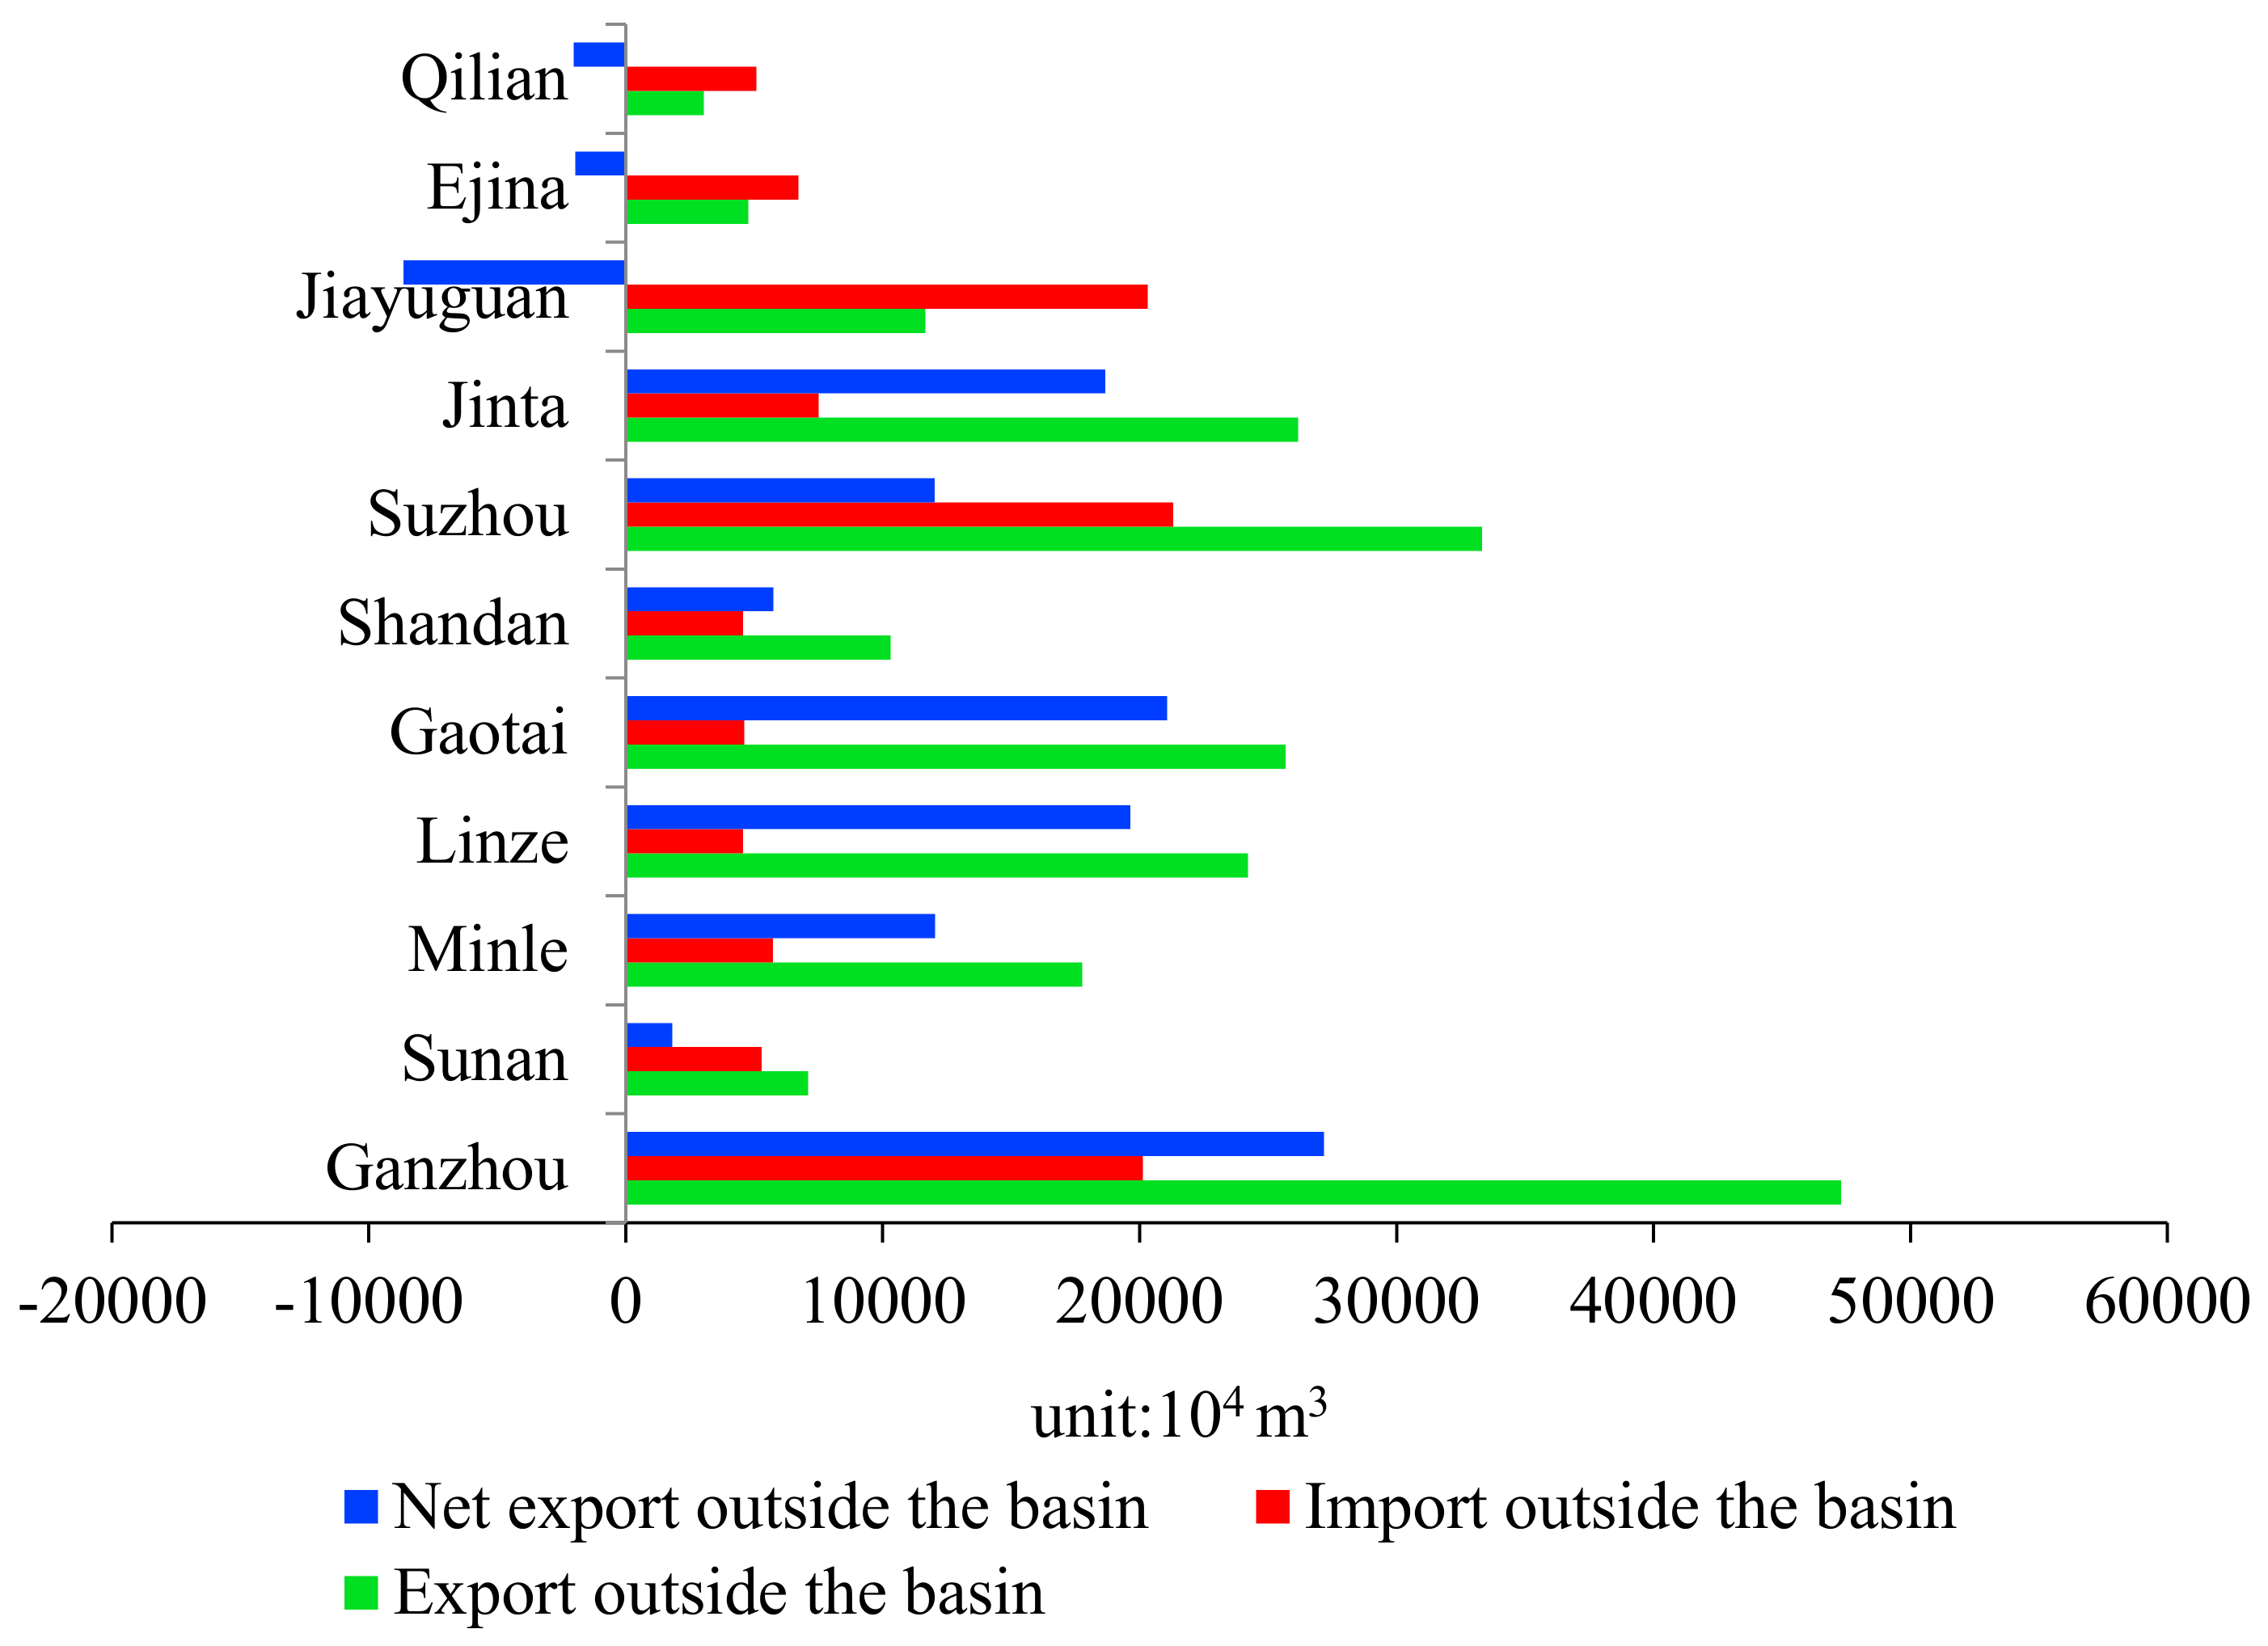
3.1. Virtual Water Import and Export at the County Level
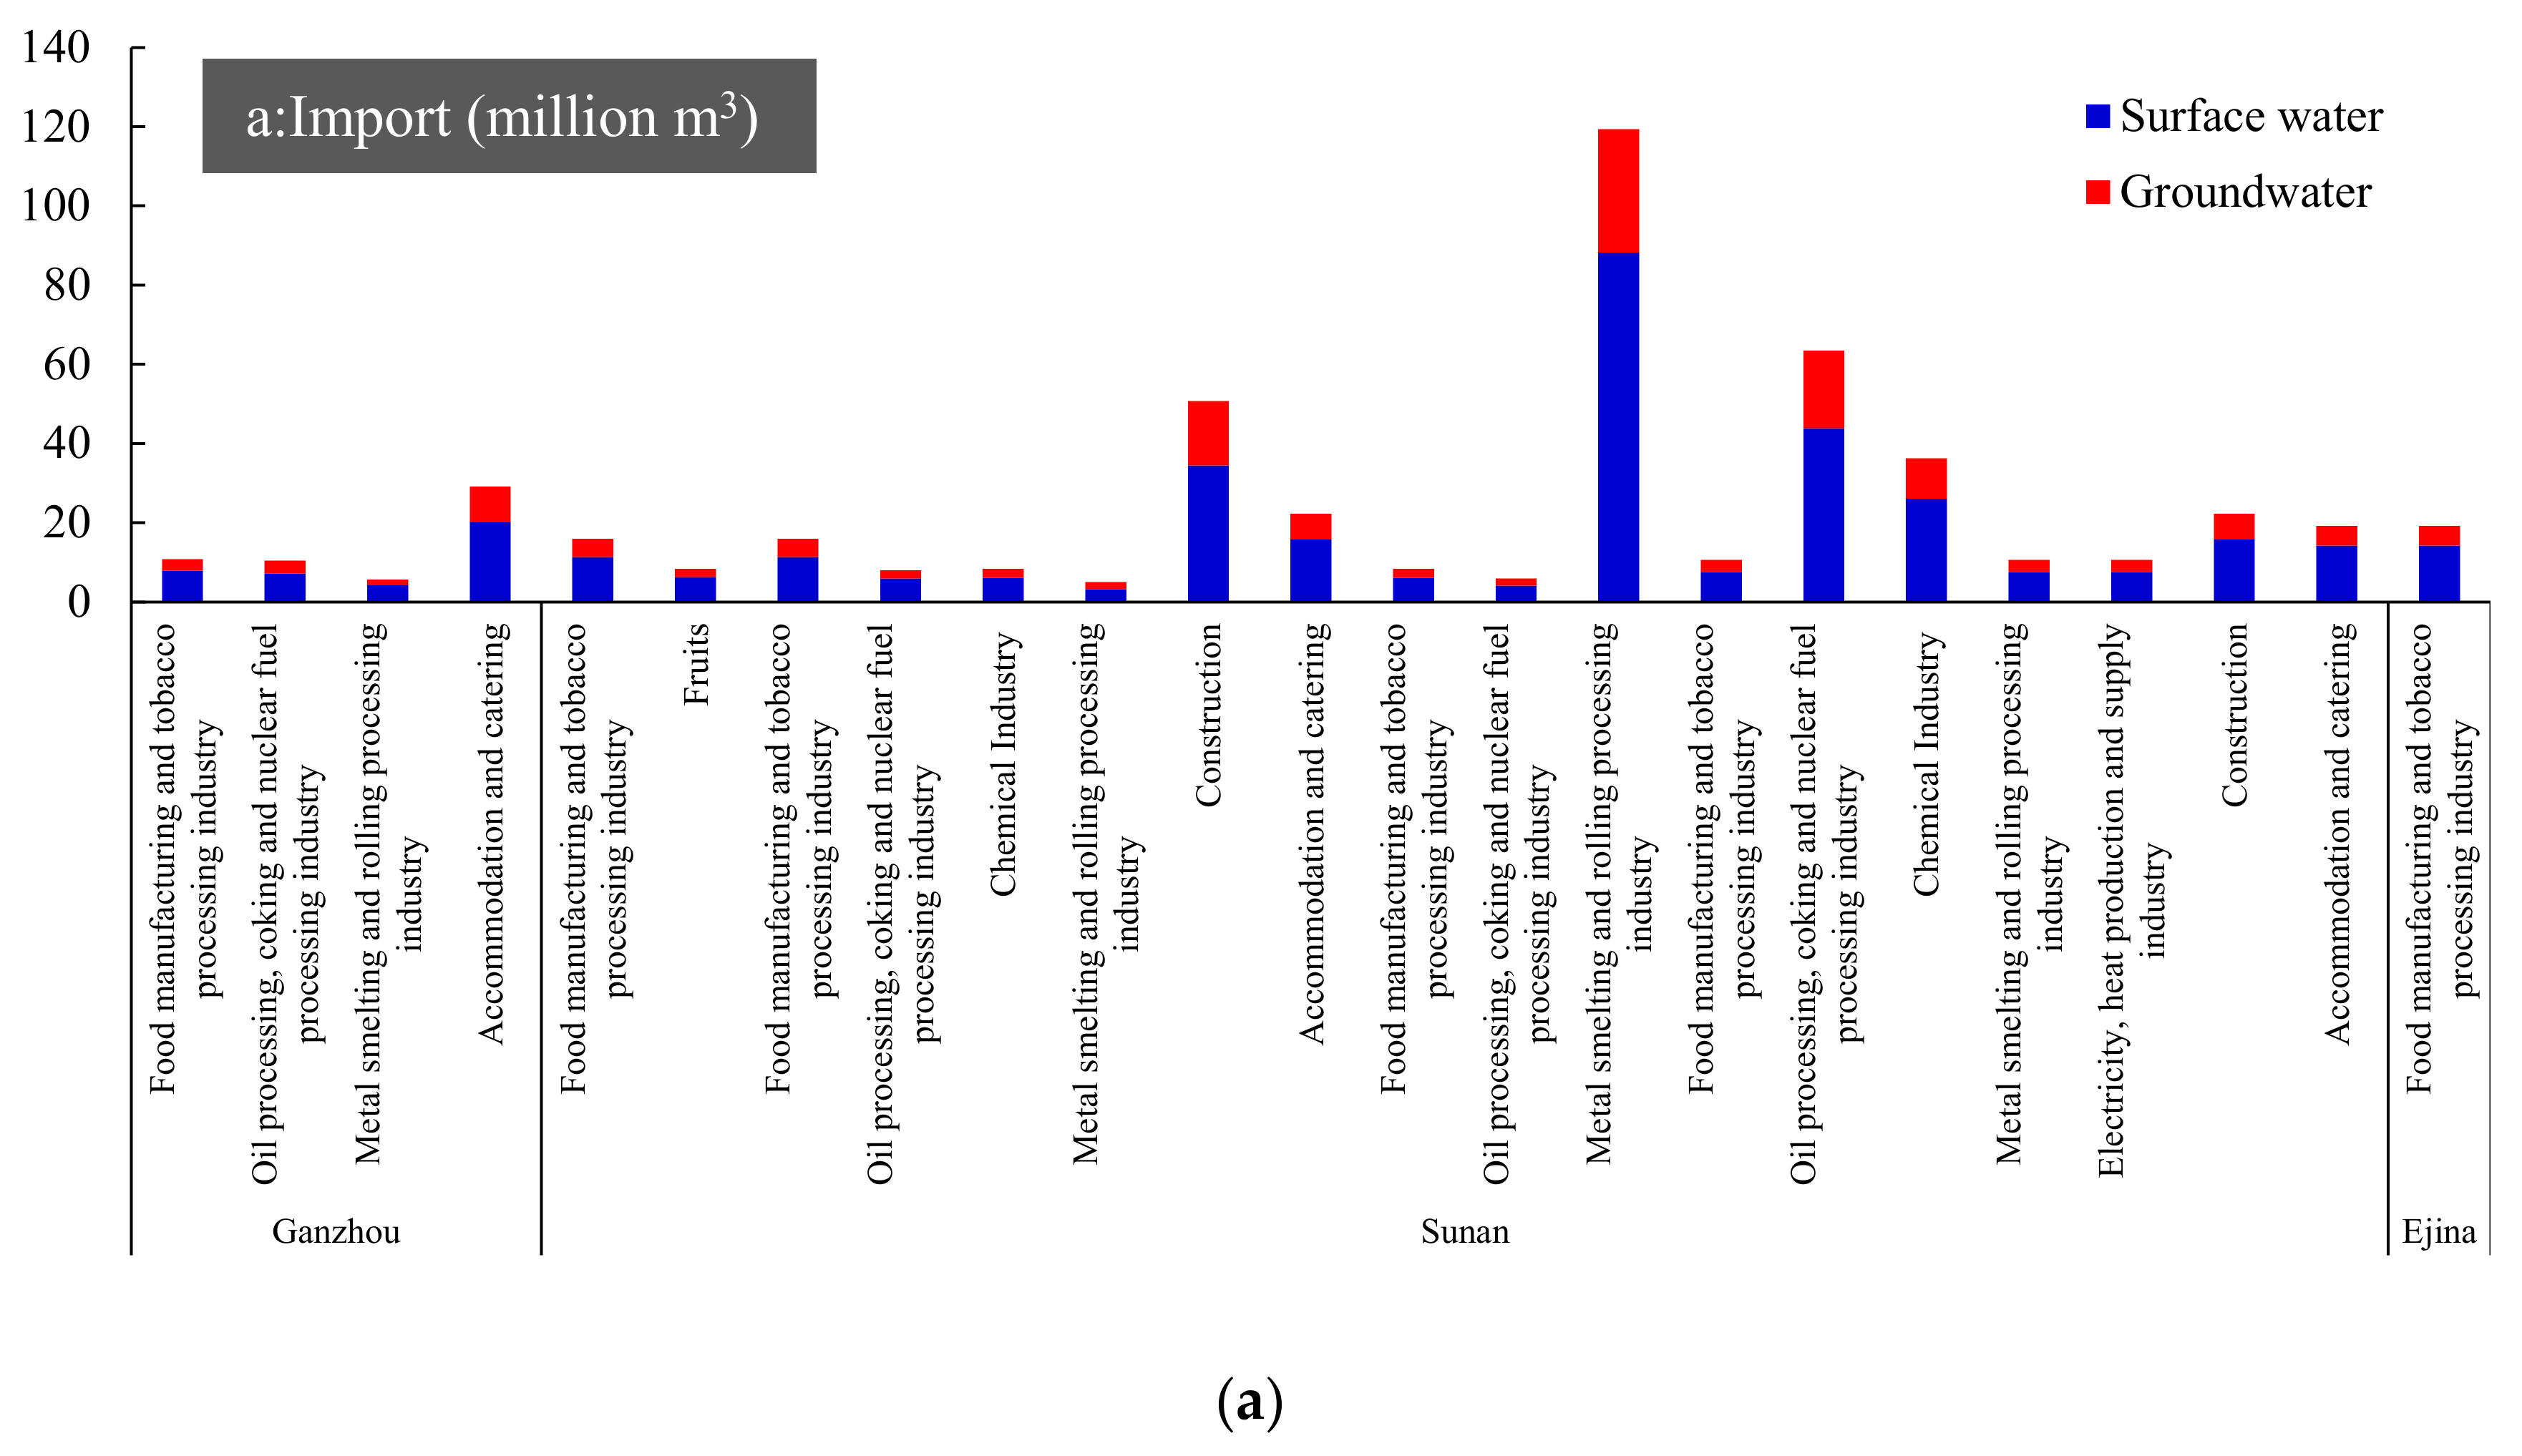
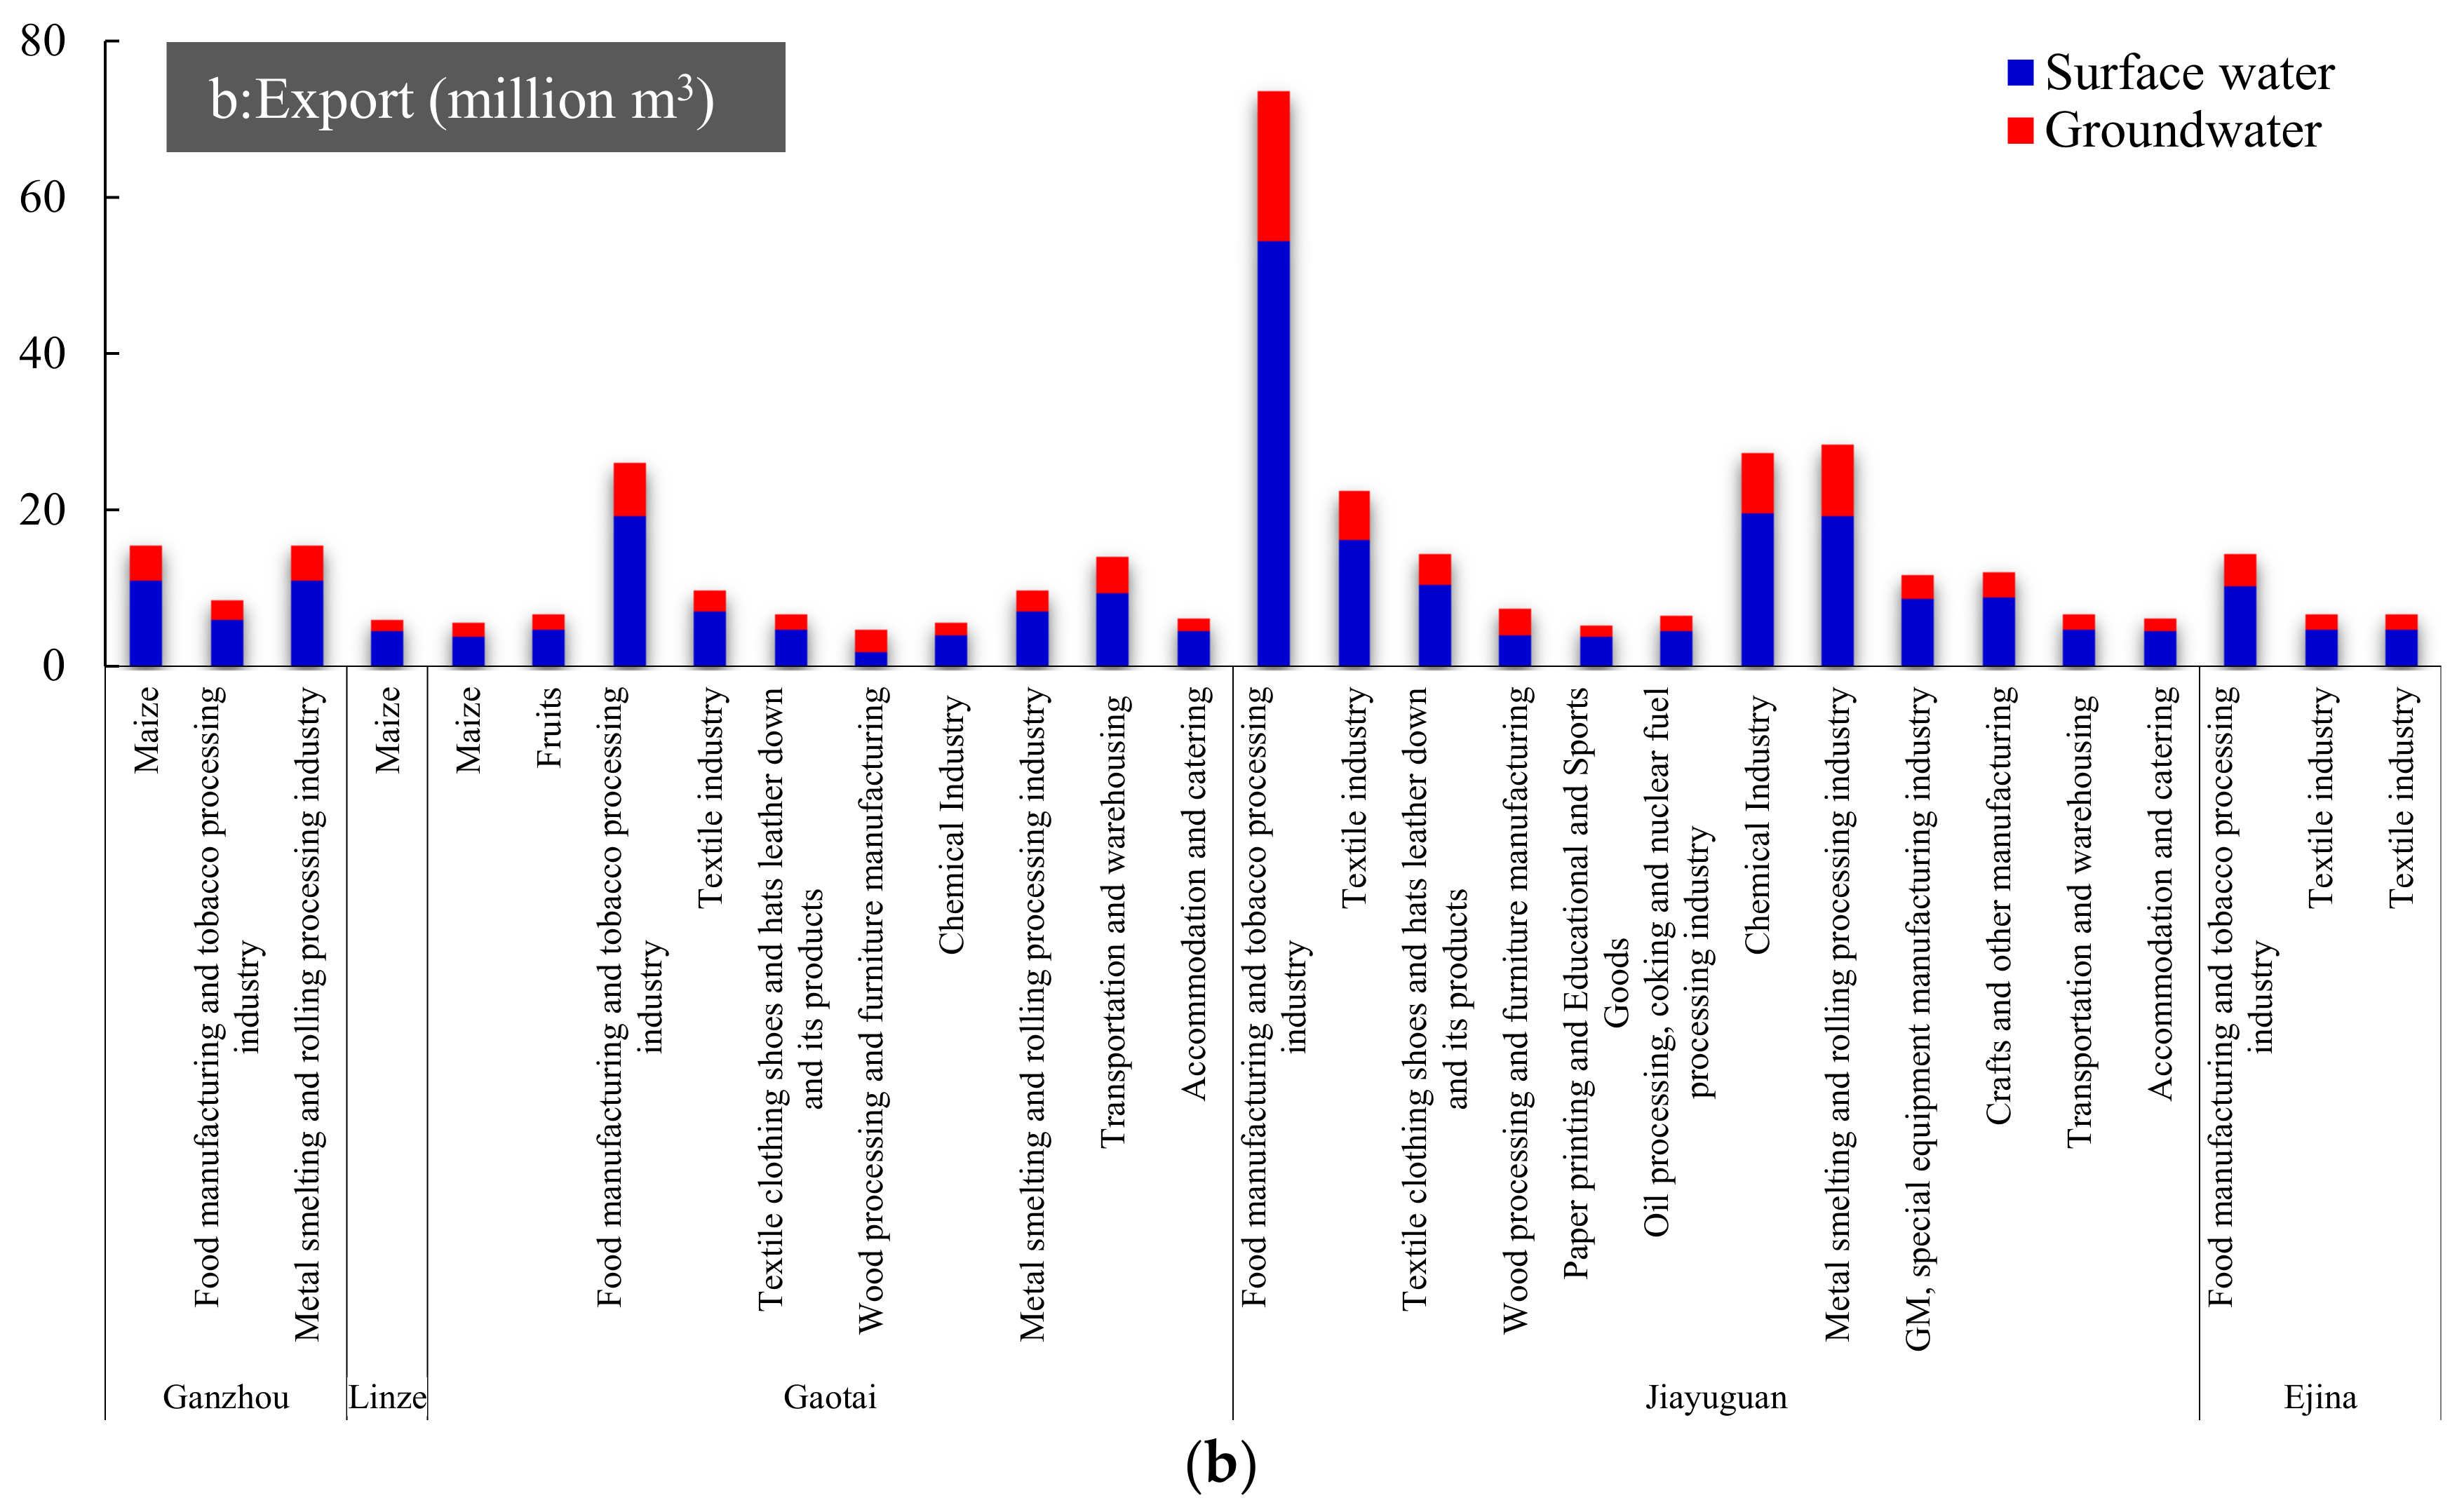
3.2. Virtual Water Flows by Sector
3.3. Water Stress and Virtual Water Strategy
4. Conclusions
Acknowledgments
Author Contributions
Conflicts of Interest
References
- Vörösmarty, C.J.; McIntyre, P.B.; Gessner, M.O.; Dudgeon, D.; Prusevich, A.; Green, P.; Glidden, S.; Bunn, S.E.; Sullivan, C.A.; Liermann, C.R. Global threats to human water security and river biodiversity. Nature 2010, 467, 555–561. [Google Scholar] [CrossRef] [PubMed]
- Palmer, M.A.; Liu, J.G.; Matthews, J.H.; Mumba, M.; D’Odorico, P. Manage water in a green way. Science 2015, 349, 584–585. [Google Scholar] [CrossRef] [PubMed]
- Allan, J.A. ‘Virtual Water’: A Long Term Solution for Water Short Middle Eastern Economies? School of Oriental and African Studies, University of London: London, UK, 1997. [Google Scholar]
- Ansink, E. Refuting two claims about virtual water trade. Ecol. Econ. 2010, 69, 2027–2032. [Google Scholar] [CrossRef]
- Antonelli, M.; Sartori, M. Unfolding the potential of the virtual water concept. What is still under debate? Environ. Sci. Policy 2015, 50, 240–251. [Google Scholar] [CrossRef]
- Jia, S.; Long, Q.; Liu, W. The fallacious strategy of virtual water trade. Int. J. Water Resour. Dev. 2017, 33, 340–347. [Google Scholar] [CrossRef]
- Dalin, C.; Konar, M.; Hanasaki, N.; Rinaldo, A.; Rodriguez-Iturbe, I. Evolution of the global virtual water trade network. Proc. Natl. Acad. Sci. USA 2012, 109, 5989–5994. [Google Scholar] [CrossRef] [PubMed]
- Chen, G.; Li, J. Virtual water assessment for Macao, China: Highlighting the role of external trade. J. Clean. Prod. 2015, 93, 308–317. [Google Scholar] [CrossRef]
- Hoekstra, A.Y.; Chapagain, A.K.; Oel, P.R. Advancing water footprint assessment research: Challenges in monitoring progress towards sustainable development goal 6. Water 2017, 9, 438. [Google Scholar] [CrossRef]
- Suweis, S.; Konar, M.; Dalin, C.; Hanasaki, N.; Rinaldo, A.; Rodriguez-Iturbe, I. Structure and controls of the global virtual water trade network. Geophys. Res. Lett. 2011, 38. [Google Scholar] [CrossRef]
- Ohlsson, L.; Turton, A.R. The turning of a screw: Social resource scarcity as a bottle-neck in adaptation to water scarcity. In Occasional Paper Series; School of Oriental and African Studies Water Study Group, University of London: London, UK, 1999. [Google Scholar]
- Wichelns, D. Virtual water: A helpful perspective, but not a sufficient policy criterion. Water Resour. Manag. 2010, 24, 2203–2219. [Google Scholar] [CrossRef]
- Hoekstra, A.Y. Human appropriation of natural capital: A comparison of ecological footprint and water footprint analysis. Ecol. Econ. 2009, 68, 1963–1974. [Google Scholar] [CrossRef]
- Cheng, G.; Li, X.; Zhao, W.; Xu, Z.; Feng, Q.; Xiao, S.; Xiao, H. Integrated study of the water–ecosystem–economy in the Heihe River Basin. Natl. Sci. Rev. 2014, 1, 413–428. [Google Scholar] [CrossRef]
- Dalin, C.; Qiu, H.; Hanasaki, N.; Mauzerall, D.L.; Rodrigueziturbe, I. Balancing water resource conservation and food security in China. Proc. Natl. Acad. Sci. USA 2015, 112, 4588–4593. [Google Scholar] [CrossRef] [PubMed]
- White, D.J.; Feng, K.; Sun, L.; Hubacek, K. A hydro-economic MRIO analysis of the Haihe River Basin’s water footprint and water stress. Ecol. Model. 2015, 318, 157–167. [Google Scholar] [CrossRef]
- Mubako, S.; Lahiri, S.; Lant, C. Input–output analysis of virtual water transfers: Case study of California and Illinois. Ecol. Econ. 2013, 93, 230–238. [Google Scholar] [CrossRef]
- Pfister, S.; Koehler, A.; Hellweg, S. Assessing the environmental impacts of freshwater consumption in LCA. Environ. Sci. Technol. 2009, 43, 4098–4104. [Google Scholar] [CrossRef] [PubMed]
- Chen, W.; Wu, S.; Lei, Y.; Li, S. Virtual water export and import in china’s foreign trade: A quantification using input-output tables of China from 2000 to 2012. Resour. Conserv. Recycl. 2017. Available online: http://www.sciencedirect.com/science/article/pii/S0921344917300654 (accessed on 6 September 2017).
- Bulsink, F.; Hoekstra, A.; Booij, M.J. The water footprint of Indonesian provinces related to the consumption of crop products. Hydrol. Earth Syst. Sci. 2010, 14, 119–128. [Google Scholar] [CrossRef]
- Zhang, Z.; Yang, H.; Shi, M.; Zehnder, A.; Abbaspour, K. Analyses of impacts of China’s international trade on its water resources and uses. Hydrol. Earth Syst. Sci. 2011, 15, 2871. [Google Scholar] [CrossRef]
- Liu, J.; Wang, Y.; Yu, Z.; Cao, X.; Tian, L.; Sun, S.; Wu, P. A comprehensive analysis of blue water scarcity from the production, consumption, and water transfer perspectives. Ecol. Indic. 2017, 72, 870–880. [Google Scholar] [CrossRef]
- Wang, P.; Li, Z.; Gao, W.; Yan, D.; Bai, J.; Li, K.; Wang, L. Glacier changes in the heihe river basin over the past 50 years in the context of climate change. Resour. Sci. 2011, 33, 399–407. [Google Scholar]
- Zhang, C.; Anadon, L.D. A multi-regional input–output analysis of domestic virtual water trade and provincial water footprint in China. Ecol. Econ. 2014, 100, 159–172. [Google Scholar] [CrossRef]
- Jin, C.; Huang, K.; Yu, Y.; Zhang, Y. Analysis of influencing factors of water footprint based on the stirpat model: Evidence from the beijing agricultural sector. Water 2016, 8, 513. [Google Scholar] [CrossRef]
- Gleeson, T.; Wada, Y.; Bierkens, M.F.; van Beek, L.P. Water balance of global aquifers revealed by groundwater footprint. Nature 2012, 488, 197–200. [Google Scholar] [CrossRef] [PubMed]
- Dong, B.; Mao, Z.; Brown, L.; Chen, X.; Peng, L.; Wang, J. Irrigation ponds: Possibility and potentials for the treatment of drainage water from paddy fields in Zhanghe irrigation system. Sci. China Ser. E Technol. Sci. 2009, 52, 3320–3327. [Google Scholar] [CrossRef]
- Zhang, Z.; Shi, M.; Yang, H. Understanding Beijing’s water challenge: A decomposition analysis of changes in Beijing’s water footprint between 1997 and 2007. Environ. Sci. Technol. 2012, 46, 12373–12380. [Google Scholar] [CrossRef] [PubMed]
- Wang, Z.; Huang, K.; Yang, S.; Yu, Y. An input–output approach to evaluate the water footprint and virtual water trade of Beijing, China. J. Clean. Prod. 2013, 42, 172–179. [Google Scholar] [CrossRef]
- Guan, D.; Hubacek, K. Assessment of regional trade and virtual water flows in China. Ecol. Econ. 2007, 61, 159–170. [Google Scholar] [CrossRef]
- Deng, X.Z.; Zhang, F.; Wang, Z.; Li, X.; Zhang, T. An extended input output table compiled for analyzing water demand and consumption at county level in China. Sustainability 2014, 6, 3301–3320. [Google Scholar] [CrossRef]
- Feng, K.; Siu, Y.L.; Guan, D.; Hubacek, K. Assessing regional virtual water flows and water footprints in the yellow river basin, china: A consumption based approach. Appl. Geogr. 2012, 32, 691–701. [Google Scholar] [CrossRef]
- Hoekstra, A.Y.; Mekonnen, M.M.; Chapagain, A.K.; Mathews, R.E.; Richter, B.D. Global monthly water scarcity: Blue water footprints versus blue water availability. PLoS ONE 2012, 7, e32688. [Google Scholar] [CrossRef] [PubMed]
- Deng, X.; Zhao, C. Identification of water scarcity and providing solutions for adapting to climate changes in the Heihe River Basin of China. Adv. Meteorol. 2015, 2015, 1–13. [Google Scholar] [CrossRef]
- Fracasso, A.; Sartori, M.; Schiavo, S. Determinants of virtual water flows in the mediterranean. Sci. Total Environ. 2016, 543, 1054–1062. [Google Scholar] [CrossRef] [PubMed]


| Counties | Total Water Consumption | Agricultural Sector | Corn Production | Wheat Production |
|---|---|---|---|---|
| Qilian | 1694.21 | 1416.75 | 594.46 | 6.47 |
| Ganzhou | 82,351.67 | 79,302.18 | 5972.51 | 44,906.67 |
| Sunan | 11,780.58 | 11,434.79 | 4248.49 | 5050.66 |
| Minle | 26,248.54 | 25,456.54 | 9865.74 | 1891.69 |
| Linze | 40,860.99 | 40,027.45 | 721.33 | 23,529.22 |
| Gaotai | 42,757.56 | 42,029.49 | 5656.42 | 18,328.82 |
| Shandan | 14,949.32 | 13,731.75 | 6664.54 | 419.14 |
| Suzhou | 19,267.03 | 16,484.47 | 3087.09 | 1572.70 |
| Jinta | 10,337.30 | 2925.42 | 548.73 | 278.52 |
| Jiayuguan | 14,355.89 | 13,655.25 | 2556.02 | 1301.01 |
| Ejina | 1617.38 | 1010.80 | 114.83 | 376.62 |
| Counties | Other Counties in the Basin (Exporters) | Other Counties in the Basin (Receivers) | Export Outside the Basin | Import Outside the Basin | Net Export Outside the Basin |
|---|---|---|---|---|---|
| Qilian | 2.36 | 6.89 | 3043.54 | 5077.05 | −2033.51 |
| Ganzhou | 91.19 | 92.57 | 47,302.46 | 20,123.45 | 27,179.01 |
| Sunan | 22.74 | 28.07 | 7096.40 | 5285.61 | 1810.79 |
| Minle | 54.77 | 37.96 | 17,769.94 | 5735.70 | 12,034.24 |
| Linze | 70.77 | 27.68 | 24,215.79 | 4571.68 | 19,644.11 |
| Gaotai | 66.12 | 26.08 | 25,678.01 | 4614.42 | 21,063.59 |
| Shandan | 21.87 | 30.24 | 10,309.50 | 4558.34 | 5751.16 |
| Suzhou | 42.10 | 112.98 | 33,327.96 | 21,301.00 | 12,026.96 |
| Jinta | 43.63 | 20.02 | 26,163.75 | 7503.92 | 18,659.84 |
| Jiayuguan | 9.73 | 37.93 | 11,665.25 | 20,318.16 | −8652.91 |
| Ejina | 0.65 | 8.49 | 4763.28 | 6727.54 | −1964.26 |
| Counties | Population (104) | Urbanization Rate | GDP (Billion Yuan) | Industry Structure (Primary Industry: Secondary Industry: Tertiary Industry) |
|---|---|---|---|---|
| Qilian | 4.70 | -- | 0.52 | 24:38:38 |
| Ganzhou | 51.60 | 37.00 | 7.67 | 25:36:40 |
| Sunan | 3.64 | 30.80 | 0.94 | 21:61:18 |
| Minle | 24.00 | 13.90 | 1.92 | 37:33:31 |
| Linze | 14.70 | 16.00 | 2.18 | 32:43:25 |
| Gaotai | 15.80 | 16.00 | 2.09 | 41:37:22 |
| Shandan | 19.80 | 34.80 | 2.22 | 22:42:36 |
| Suzhou | 40.64 | 43.50 | 6.20 | 13:54:34 |
| Jinta | 14.70 | 23.80 | 2.40 | 30:30:40 |
| Jiayuguan | 18.59 | 88.90 | 14.40 | 1:82:17 |
| Ejina | 1.65 | 70.00 | 2.04 | 3:61:36 |
| Streams | Counties | Renewable Freshwater Resources (Billion m3) | WSI |
|---|---|---|---|
| Upstream | Qilian | 0.02 | 1.69 |
| Midstream | Ganzhou | 0.80 | 0.69 |
| Sunan | 0.03 | 3.02 | |
| Minle | 0.40 | 0.36 | |
| Linze | 0.43 | 0.49 | |
| Gaotai | 0.34 | 0.63 | |
| Shandan | 0.13 | 0.70 | |
| Suzhou | 0.65 | 0.11 | |
| Jinta | 0.36 | −0.23 | |
| Jiayuguan | 0.11 | 2.17 | |
| Downstream | Ejina | 0.41 | 0.09 |
© 2017 by the authors. Licensee MDPI, Basel, Switzerland. This article is an open access article distributed under the terms and conditions of the Creative Commons Attribution (CC BY) license (http://creativecommons.org/licenses/by/4.0/).
Share and Cite
Zhang, Y.; Zhou, Q.; Wu, F. Virtual Water Flows at the County Level in the Heihe River Basin, China. Water 2017, 9, 687. https://doi.org/10.3390/w9090687
Zhang Y, Zhou Q, Wu F. Virtual Water Flows at the County Level in the Heihe River Basin, China. Water. 2017; 9(9):687. https://doi.org/10.3390/w9090687
Chicago/Turabian StyleZhang, Yali, Qing Zhou, and Feng Wu. 2017. "Virtual Water Flows at the County Level in the Heihe River Basin, China" Water 9, no. 9: 687. https://doi.org/10.3390/w9090687
APA StyleZhang, Y., Zhou, Q., & Wu, F. (2017). Virtual Water Flows at the County Level in the Heihe River Basin, China. Water, 9(9), 687. https://doi.org/10.3390/w9090687