Phosphate Removal from Agricultural Tile Drainage with Iron Enhanced Sand


1
St. Anthony Falls Laboratory, Department of Civil, Environmental, and Geo-Engineering, University of Minnesota, Minneapolis, MN 55455, USA
2
Department of Civil Engineering, Valparaiso University, Valparaiso, IN 46383, USA
*
Author to whom correspondence should be addressed.
Water 2017, 9(9), 672; https://doi.org/10.3390/w9090672
Submission received: 14 July 2017
/
Revised: 25 August 2017
/
Accepted: 29 August 2017
/
Published: 6 September 2017
(This article belongs to the Special Issue Additives in Stormwater Filters for Enhanced Pollutant Removal)
Abstract
:Can iron enhanced sand filtration capture total phosphorus and soluble phosphorus (phosphate) from agricultural tile drainage? A monitoring study measured the total phosphorus and phosphate capture performance of an iron enhanced sand filter (IESF) installed to treat agricultural tile drainage in Wright County, MT, USA. Overall, for natural rainfall-induced tile drainage events monitored between June and November 2015 and again in 2016, the IESF captured 66% ± 7% (α = 0.05, n = 21) of the influent total phosphorus mass and 64% ± 8% (α = 0.05, n = 31) of the influent phosphate mass. Removal of total phosphorus and phosphate was approximately uniform for large and small rainfall-induced tile drainage events and varied from 42% to 95% for total phosphorus and 9% to 87% for phosphate. The IESF treated 290 m of treated depth since installation, and results indicate that performance is similar or better than constructed wetlands or other IESFs, though not as good as laboratory experiments of IESFs. Routine and non-routine maintenance was performed throughout the project to ensure adequate phosphorus capture and flow rate through the IESF.
Keywords:
phosphate; phosphorus; soluble; dissolved; iron; stormwater; agricultural; tile drainage; filtration; rainfall1. Introduction
Rainfall and snowmelt on urban or agricultural landscapes typically produces enough water to generate flow over the surface of the landscape, which is called stormwater runoff. In agricultural watersheds, there are often buried perforated pipes called drain tiles that collect soil moisture and discharge it downstream, which allow the soils to be farmed. The flow from these drain tiles, called tile drainage, has important characteristics such as volume and rate as well as water quality characteristics such as temperature, pH, and pollutant concentrations. One such pollutant of concern is phosphorus, which can be either particulate (≥0.45 µm in size) or soluble (dissolved and <0.45 µm). In stormwater runoff, tile drainage, and surface water bodies, soluble phosphorus is most often in the form of phosphate (PO43−) [1]. Though many terms such as dissolved phosphorus, soluble reactive phosphorus, and ortho-phosphate have been used, this article will use the term “phosphate” to describe the soluble reactive phase of phosphorus.
In agricultural watersheds, phosphate sources include natural organic matter, crop biodegradation, natural and synthetic fertilizers, and livestock waste, among others. Phosphate is more bioavailable than particulate phosphorus [2], and thus typically limits biological growth in temperate non-marine surface water ecosystems [3,4,5]. When in excess, however, phosphate often generates nuisance algae blooms and eutrophic conditions in these ecosystems [6].
Sedimentation (i.e., particle settling) and filtration (i.e., sieving) are two mechanisms used by typical urban stormwater control measures (SCMs) such as wet ponds, dry ponds, and sand filters to capture particulate forms of phosphorus. Phosphate, however, is often not captured by most SCMs because a chemical or biological process is necessary to do so. For example, sand filters capture approximately 80% of total suspended solids [7] by filtration. Particulate phosphorus, which is about 55% of total phosphorus [7], will also be captured but phosphate remains untreated.
Many phosphate-controlling strategies have been proposed and utilized for agricultural runoff, including optimizing fertilizer P use-efficiency, refining animal feed rations, using feed additives to increase P absorption by the animal, treating manure to lower its soluble P content, moving manure from surplus to deficit areas, managing soil P levels, finding alternative uses for manure other than land application [8,9]. Other strategies include conservation practices for critical areas of P export from a watershed, such as reduced tillage, buffer strips, terracing, and cover crops [8,9].
Constructed wetlands have been used to capture phosphorus from agricultural drainage with removal rates of 2% to 44% for total phosphorus [10,11,12,13,14]. One study of 17 intensively studied constructed wetlands reported total phosphorus capture of 1 to 88% and dissolved reactive phosphorus (DRP) capture of −19 to 89% [15]. The large capture range for both total phosphorus and DRP was found to be due to variations in soluble fraction, runoff volume, wetland age, surface area to contributing area ratio, and other site-specific factors. Particulate capture in these constructed wetlands were reported to be predictable based on flow and settling characteristics, but capture of DRP was less predictable, likely due to uncontrolled transformations within the wetlands. These studies suggest the need for a treatment system that consistently captures both particulate phosphorus and phosphate.
SCMs must be improved to capture soluble pollutants such as phosphate [16]. Previous studies have found that adding metals such as steel wool or elemental iron to sand filter media resulted in significant removal of phosphate [17,18,19] from synthetic and natural stormwater. As stormwater passes through the sand mixed with iron filter media, the elemental iron rusts to form iron oxides, which binds with phosphate via surface adsorption. These iron enhanced sand filters (IESFs) are substantially different than constructed wetlands. Constructed (and natural) wetland systems rely on shallow water depth (typically < 30 cm) and long residence time to capture pollutants through settling of particles and bio-chemical interactions with vegetation, the soil, and organisms within the water and soil. IESFs, however, use the physical process of filtration to capture particles and a chemical sorption reaction with iron to capture phosphate [17,18]. Thus, IESFs typically have a shorter residence time and deeper water depth (typically 30–180 cm) because the water is treated quickly by the IESF media.
With this knowledge, Wright Soil and Water Conservation District (SWCD) installed an IESF in 2012 to limit the total phosphorus and phosphate load from an agricultural subwatershed. A drain tile was intercepted and re-routed away from an existing ditch system and into the IESF. The performance of this IESF was assessed by monitoring natural rainfall-induced tile drainage events for two rainy seasons. The main objectives of this study were to: (1) assess the performance of a three- to four-year-old IESF with regards to the capture of total phosphorus and phosphate from agricultural tile drainage; (2) investigate maintenance requirements; and (3) compare measured data to previously published performance of IESFs.
2. Materials and Methods
2.1. Site Location
The site was located in Wright County, MT, USA. Wright SWCD installed the IESF to treat water from approximately 7.45 ha of farmland (90% corn and soybean crops and 10% pasture) that drains toward a shallow wetland and into a tile drainage system. The extent and quality of the clay tile in the watershed was unknown at the time of study. The extent to which the shallow wetland interacts with the tile drainage system was also unknown, and thus it was not known how the wetland hydrology and water quality may have affected the results of this study. The wetland has been identified as a Palustrine, Emergent, Persistent, Temporary Flooded, and Farmed (PEM1Af) according to the Minnesota Department of Natural Resources National Wetland Inventory [20].
2.2. Iron-Enhanced Sand Filter Design
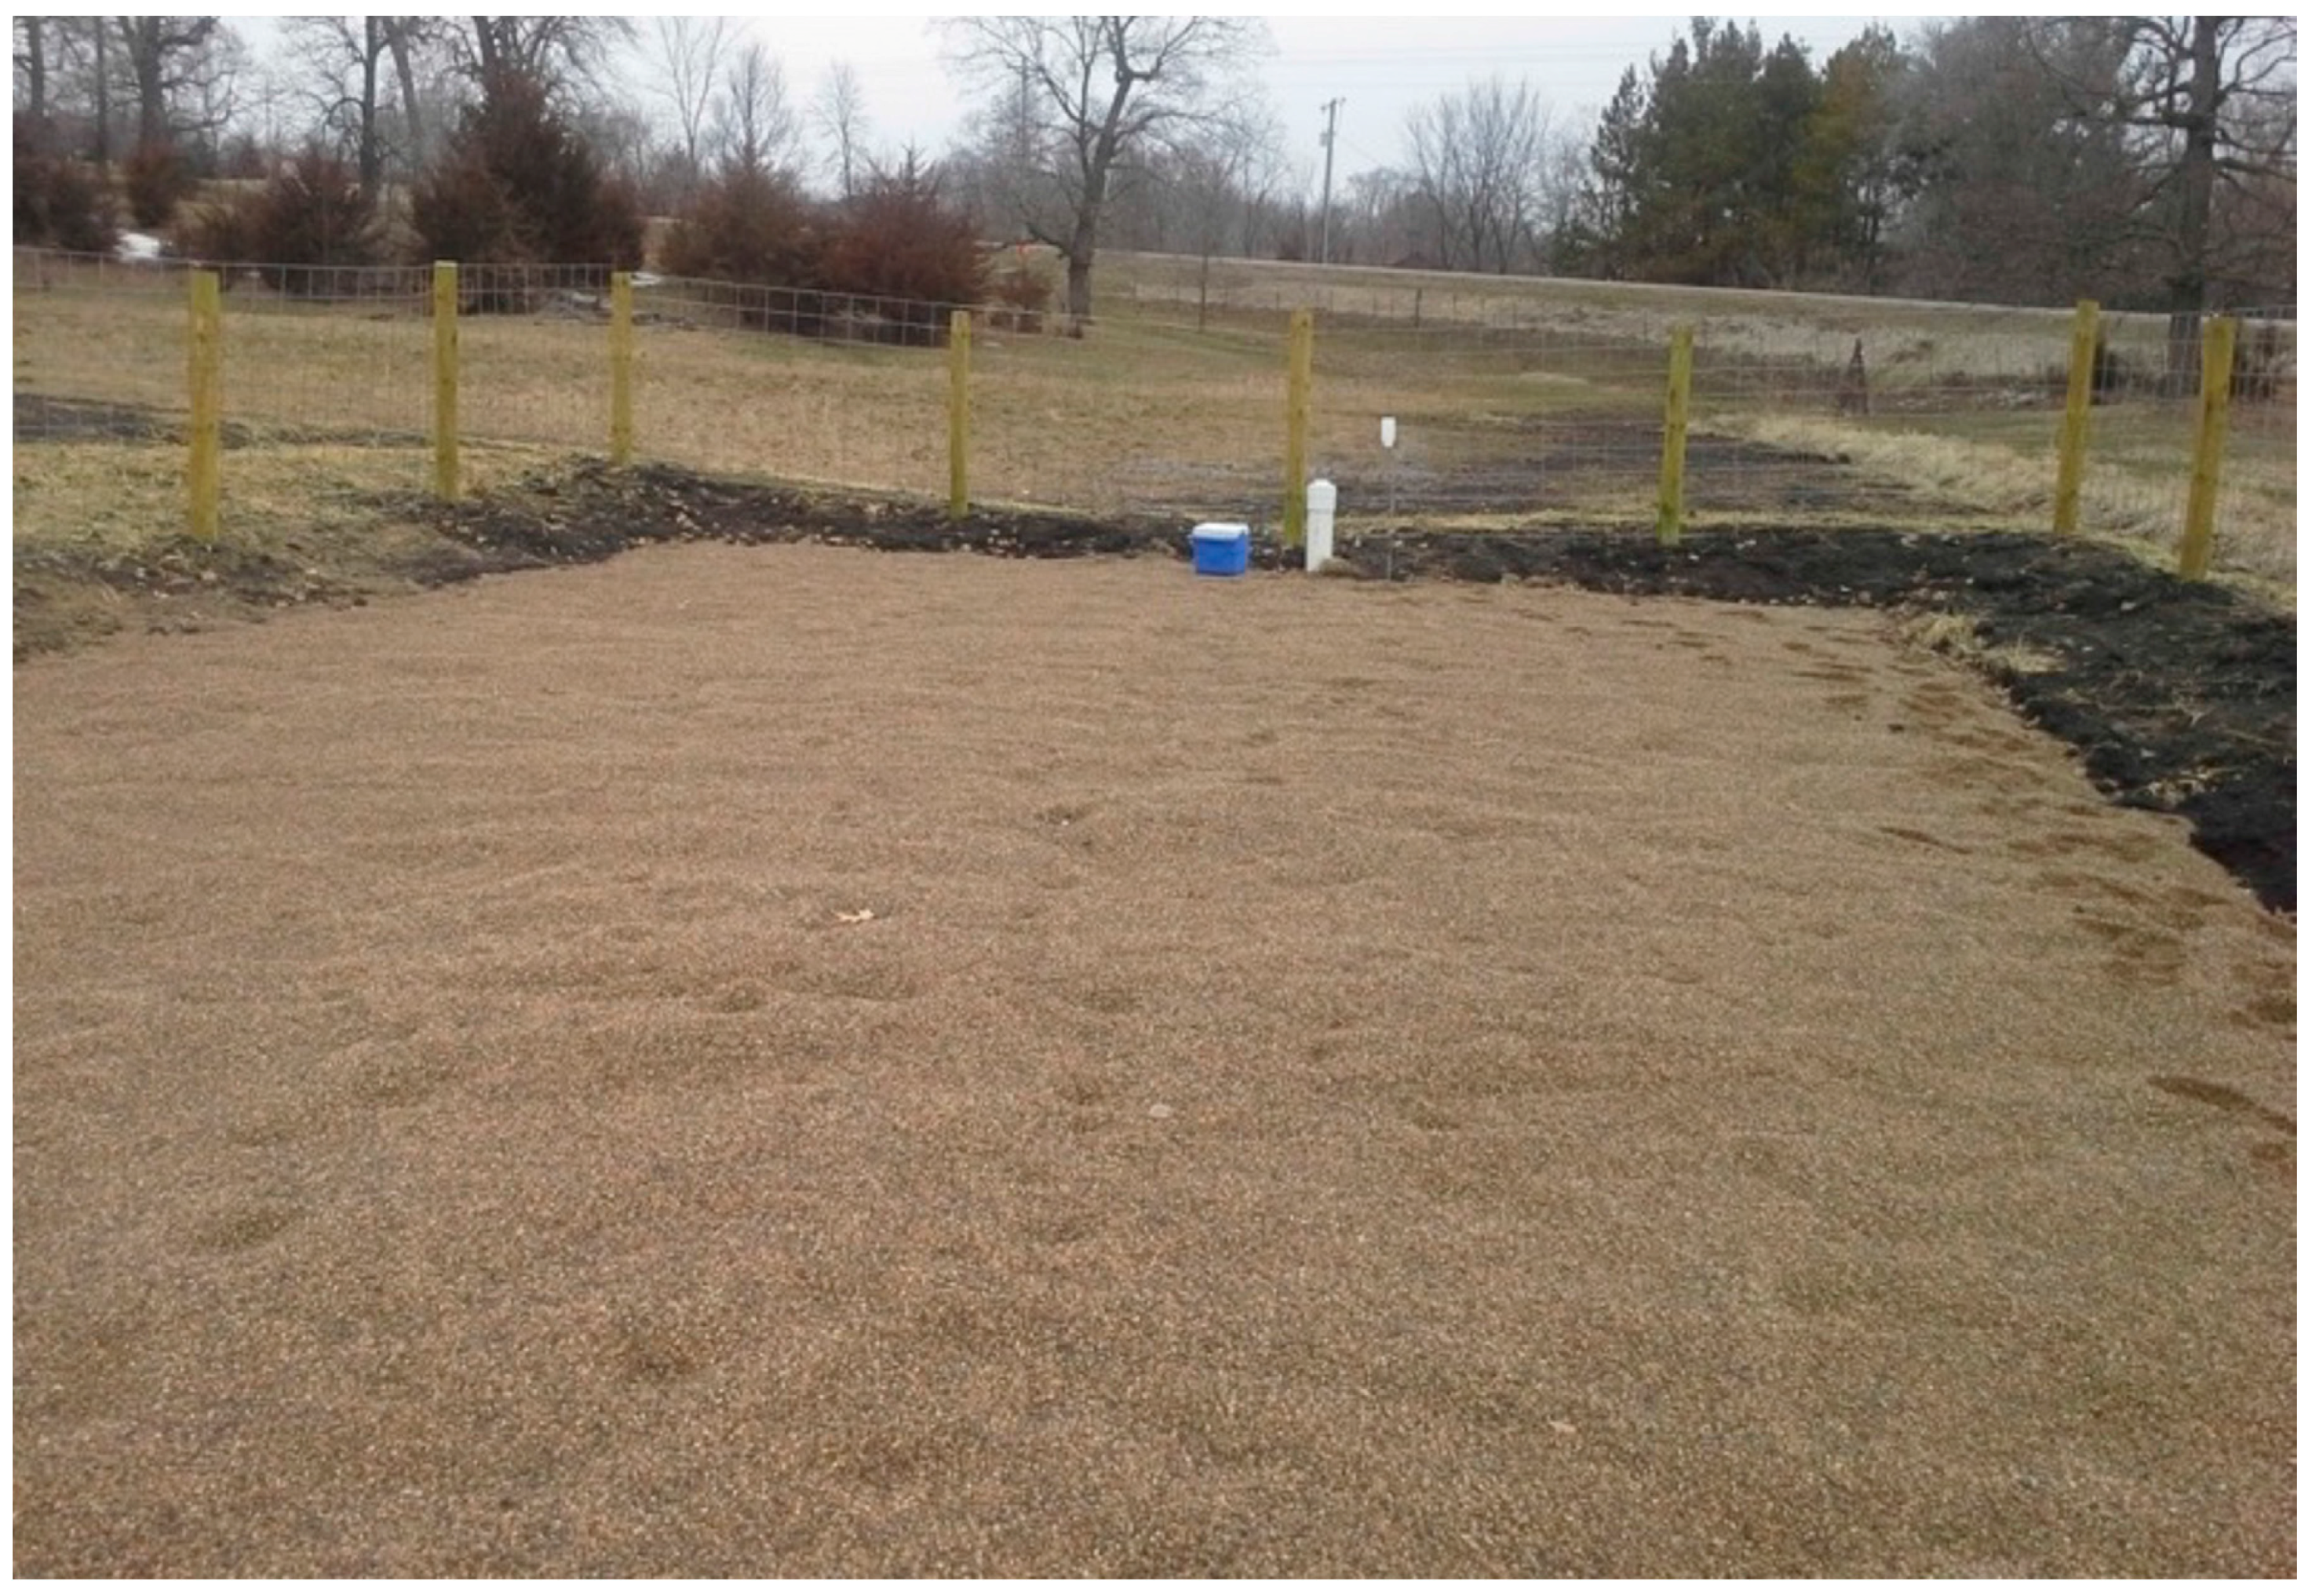
The IESF was designed with the filter media surface up to 30 cm below the natural topography. The intercepted drain tile discharged onto the surface of the IESF, and berms were installed around the IESF to provide storage volume up to approximately 30 cm above the IESF surface. The berms also prevented overland flow from entering the IESF from the surrounding areas and the nearby ditch. A photo of the IESF shortly after construction is provided in Figure 1.
At the time of construction, the IESF media bed was approximately 6.1 m wide, 15.2 m long, 30 cm thick and contained 94% ASTM C-33 concrete sand [21] and 6% iron filings by weight. Below the IESF media was a layer of approximately 15 cm of pea gravel encompassing a 15-cm diameter PVC perforated pipe underdrain system designed to collect water after filtration. This underdrain system consisted of two longitudinally-oriented pipes along the length of the IESF (from influent to effluent). This system connected to a single 20-cm diameter outlet pipe and to a vertical pipe extending above the IESF surface to allow for cleanout access and sample collection (white vertical pipe visible in Figure 1 and illustrated in Figure 2). The IESF was lined with an impermeable liner such that water only enters the IESF through the surface. After water was filtered by the media and collected by the underdrain system, it was routed through a 20-cm diameter solid pipe for roughly 61 m to be discharged into the nearby ditch.
Previous studies have recommended that IESF media oxidize (i.e., rust) to allow for creation of sorption sites [17,18]. For this site, the underdrain outlet was rarely submerged from downstream, which allowed water to freely drain by gravity and atmospheric oxygen to reach the bottom of the IESF media through the underdrains. When there was no ponding, atmospheric oxygen also penetrated the surface of the IESF. The impermeable liner prevented adjacent groundwater from saturating the media between rainfall-induced tile drainage events. This seemed to be sufficient for oxidation of the IESF media.
2.3. Measurements
Natural rainfall-induced tile drainage events were monitored beginning 26 June 2015 and continued until 20 November 2015. Monitoring equipment was removed for the winter and reinstalled on 14 May 2016 where it remained until 7 November 2016. It is important to note that several precipitation events occurred during December through May, outside the periods when monitoring equipment was installed, and are not discussed in this Article.
Parameters were measured at the site including rainfall, tile drainage volume, flow rate out of the IESF, and concentration of total phosphorus and phosphate in water samples. For each rainfall-induced tile drainage event, water samples were collected from the influent and effluent of the IESF (described in Section 2.3.2). Rainfall, air temperature, and flow rate data were stored on a Campbell Scientific CR1000 data logger and were either downloaded directly from the data logger or transmitted by a Raven XT model V2227-VD cellular modem (Sierra Wireless, Richmond, BC, Canada). Samples were collected by ISCO automatic samplers (described in Section 2.3.2). Rainfall and air temperature were measured by a TR-525I tipping bucket rain gauge (Texas Electronics, Dallas, TX, USA; measured in 0.25 mm increments) and by a shielded air temperature sensor (RM Young, Traverse City, MI, USA), respectively. All equipment was powered by 12-Volt deep-cycle marine batteries which were charged by 50-Watt, 12-Volt Polycrystalline solar panels (Renogy, Ontario, CA, USA) using Wanderer 30-Amp PWM charge controllers (Renogy, Ontario, CA, USA).
2.3.1. Flow Rate Measurement
Influent flow rate was not measured due to minimal elevation change, (i.e., low available head) that prevented the use of a weir or flume, and low velocity and flow rate values that prevented the use of a flow meter. Because the IESF has an impermeable liner, however, it was assumed that all water that entered the IESF from the surface would also exit through the underdrain collection system. Evapotranspiration from the IESF was assumed to be negligible during sampling because (1) vegetation was removed from the IESF during routine maintenance, and (2) the ponding time on top of the IESF was less than 24–48 h for most rainfall-induced tile drainage events. Thus, effluent flow rate from the IESF was measured and assumed to be similar to the influent flow rate.
The effluent flow rate was measured with a V-notch weir that was fabricated, calibrated, and installed within an Agri Drain flow control structure (20 cm pipe connection, 60 cm tall, 29.5 cm wide, 30 cm long) located at the end of the 20-cm diameter discharge pipe (Figure 2). Measuring the flow rate near the discharge location minimized the potential for water surcharging into the underdrains and maximized the allowable water depth over the weir. Because the water level in the downstream culvert could affect flow rate over the weir, the water level upstream and downstream of the weir was measured using two separate Campbell Scientific CS450 pressure sensors. These sensors were fixed in elevation and protected from debris by encapsulating them in 2.5-cm PVC pipes. The flow rate was calculated using Equation (1),
where Q = discharge (m3/s), Cdv = weir discharge coefficient (Cdv = 0.601), θ = angle of V-notch (36.9° = 0.644 rads), g = acceleration of gravity (9.81 m/s2), H1 = total upstream head (i.e., water depth) above the lowest point of the V-notch weir (m), and H2 = total downstream head (i.e., water depth) above the lowest point of the V-notch weir (m) [22,23]. The accuracy of Equation (1) was tested in the laboratory by measuring flow rate and comparing the measured value to the predicted flow rate based on Equation (1). The Root Mean Square Error was 0.22 L/s for 634 flow rate calibration measurements, up to a maximum of 6 L/s. It can be noted that Equation (1) simplifies to the V-notch equation [22] when the downstream head (H2) is zero.
2.3.2. Water Sample Collection and Storage
Water samples were collected from within the inlet pipe (influent samples) and also where the underdrain system below the IESF connected to the discharge pipe (effluent samples), as shown in Figure 2. Automatic water samplers (model 6712, ISCO, Lincoln, NE, USA) were used to collect volume-weighted composite samples, one each from the influent and effluent, for each rainfall-induce tile drainage event. Sample collection began when rainfall exceeded a minimum threshold of 0.05 cm and flow rate exceeded 0.28 L/s. Sampling continued until the flow rate decreased to below 0.28 L/s. During sampling, the automatic samplers collected an aliquot of 90 mL for every 5.66 m3 of tile drainage volume over the weir, and added the 90-mL aliquot to the composite sample bottle stored within the sampler. Influent and effluent samples were collected simultaneously because influent flow rate was not measured (see Section 2.3.1). The residence time between influent and effluent sample locations during sampling was expected to be approximately 15 min based on IESF media depth and previous IESF studies [17,18,19]. While samples are stored within the automatic samples, it was assumed that biological transformations between particulate phosphorus and phosphate are minimized in these samples because (1) the samples are not exposed to natural sunlight, and thus photosynthetic activity was minimal, and (2) non-photosynthetic biological activity (e.g., bacterial growth) was not visible in the samples.
Automatically-collected water samples were retrieved from the site within 8 h 45 min from the time that the last aliquot was added to the composite sample. Upon retrieval, samples were transported approximately 45 min to the laboratory where a portion of each sample (typically three separate ~45 mL sub-samples) was immediately separated and labeled for total phosphorus analysis. Another portion (typically one ~45 mL sub-sample) was immediately filtered through a 0.45-micron filter in preparation for analysis of phosphate. Samples were frozen immediately after subsampling and filtering if they could not be analyzed immediately.
2.4. Analysis
2.4.1. Water Sample Analysis
Volume-weighted composite samples were analyzed at St. Anthony Falls Laboratory, Minneapolis, MN, USA. Total phosphorus analysis followed standard methods section 4500-P B5—Persulfate Digestion method [24] and phosphate was measured according to standard methods section 4500-P E—Ascorbic Acid [24] with a minimum detection level of 10 µg P/L. The only deviation from these methods was that samples were not acidified prior to storage because they were either analyzed or frozen immediately after delivery to the laboratory.
2.4.2. Statistical Analysis
For some calculations of average values (e.g., volume-weighted average concentration, average load capture efficiency), the 95% confidence interval of the average was also calculated using
where t = student t value for α = 0.05, α = level of significance, s = standard deviation, and n = number of measurements or samples [25]. Student t values were used because most values of n were near or below 30, and the standard deviation was calculated from the number of available measurements (n). Whenever values are reported with a “±” symbol (e.g., 2.23 ± 0.70 cm), these values are the average ± the 95% confidence interval of the average as given by Equation (2).
2.4.3. Event and Baseflow Separation
For the periods in which monitoring equipment was installed (generally May to November), flow rate data were compiled and separated into rainfall-induced tile drainage “events” and “baseflow,” with baseflow defined as periods with flow rate < 0.28 L/s. In addition, equipment failure occurred during some events and thus samples were not collected properly. For these events, the flow rate was considered “non-sampled” rainfall-induced tile drainage events. For other events, equipment malfunction or extreme flow rate conditions resulted in unreliable flow rate data. These events are not reported and considered “missed.” Finally, total phosphorus was not measured in samples collected in 2015. With this grouping of events, the performance of the IESF was assessed for a total of 33 rainfall-induced tile drainage events (13 in 2015 and 20 in 2016) in which rainfall was measured for 30 events (11 in 2015 and 19 in 2016), total phosphorus performance for 20 events (all in 2016), and phosphate performance for 31 events (13 in 2015 and 18 in 2016).
2.4.4. Calculations
The concentration of volume-weighted composite samples is equivalent to the event mean concentration (EMC) [26]. The volume-weighted average EMC is equivalent to the total influent load (e.g., 1273 g) divided by the total tile drainage volume (5891 m3) for all the rainfall-induced events. The total phosphorus capture performance can be expressed as the percent reduction in load between the influent and effluent [26].
A common metric for understanding the longevity of IESFs is the depth of water treated [17,18]. This depth represents the amount of water that has passed through the IESF since its construction, and indirectly represents the amount of phosphate that has been captured by the IESF. To calculate the treated depth, the total volume of water treated by the IESF from the time it was constructed is divided by its surface area. The total volume of water treated can be estimated from the hydraulic loading rate, historical rainfall and flow data, computer modeling of hydrologic processes, or some combination thereof.
3. Results and Discussion
The performance of the IESF for capturing total phosphorus and phosphate from agricultural tile drainage was assessed by monitoring natural rainfall-induced tile drainage events during 2015 and 2016. Routine and non-routine maintenance performed since installation of the IESF resulted in a reduction between influent and effluent total phosphorus and phosphate loads on the receiving water body for all rainfall-induced events measured during this study. The performance results of the IESF based on monitoring is discussed in the following sections, though all data and results, which includes some information based on grab samples, are reported in [27].
3.1. Rainfall Event Performance and Continuous Monitoring
3.1.1. Rainfall and Tile Drainage Volume
Rainfall depth varied from 0.05 to 7.32 cm per event with an average of 2.23 ± 0.70 (α = 0.05, n = 30) cm. As is typical for rainfall, the average (2.23 cm) was greater than the median (1.82 cm) for the rainfall depth, which was also true for the rainfall duration, average rainfall intensity and tile drainage volume because several large rainfall events skew the average towards larger values and many small events skew the median towards smaller values. Annual precipitation measured at a municipal airport (Buffalo, MN; KCFE) approximately 8.7 km northwest of the IESF was 53.7 cm for the 2015 water year (1 October 2014–30 September 2015) and was 82.4 cm for the 2016 water year (1 October 2015–30 September 2016). The total measured rainfall depth at the IESF site in 2015 was 29.97 cm and was 37.1 cm in 2016, which are approximately 50% of the average annual precipitation because it excludes precipitation that occurred during non-sampled rainfall events and several snowmelt and rainfall events that occurred outside the monitoring periods. Multiplying the total measured rainfall (66.95 cm) by the contributing watershed (~7.45 ha) results in a total rainfall volume of approximately 49,878 m3. Tile drainage per event varied from 28.2 to 487 m3 with an average of 178.5 ± 48.4 (α = 0.05) m3 and a total tile drainage volume of 5891 m3. Dividing the tile drainage (5891 m3) by the rainfall volume (49,878 m3) results in a tile drainage “runoff coefficient” of approximately 0.12. To determine if this agricultural watershed was representative of the region, the rainfall and tile drainage volume were compared [27] to other agricultural sites monitored by Discovery Farms Minnesota (DFM). The monitored rainfall depth at the IESF site was 10–25% less than the average rainfall measured at the DFM sites because equipment failure at the IESF site prevented measurement of some rainfall events during the monitoring period of June through November in both 2015 and 2016. The tile drainage “runoff coefficient” for the IESF (0.12) was similar to the average “runoff coefficient” measured at the nine DFM sites (0.125) [27]. This suggests that tile drainage characteristics of the IESF site are consistent with other agricultural sites in a similar climate for the time period between 2011 and 2016.
3.1.2. Rainfall-Induced Flow vs. Baseflow
Agricultural watersheds produce tile drainage whenever there is excess soil moisture. When monitoring equipment was operational, tile drainage was almost continuous. It is unclear whether this was typical, or if rainfall and runoff characteristics for 2015 and 2016 were unusual. It is also unclear if or to what extent the upstream wetland affected the tile drainage conditions during the monitoring study.
The tile drainage measured from 26 June to 20 November 2015 was 3167 m3. Of this volume, approximately 2489 m3 was rainfall-induced tile drainage in which samples were collected, approximately 221 m3 was non-sampled rainfall-induced tile drainage, and approximately 457 m3 was baseflow. This corresponds to approximately 86% rainfall-induced tile drainage (7% non-sampled) and 14% baseflow. The tile drainage measured from 14 May to 7 November in 2016 was 6388 m3. Of this volume, approximately 3653 m3 was sampled rainfall-induced tile drainage; 2282 m3 was non-sampled rainfall-induced tile drainage; and approximately 454 m3 was baseflow. This corresponds to approximately 93% rainfall-induced tile drainage (36% non-sampled) and 7% baseflow. Overall for 2015 and 2016, 90% of the tile drainage was rainfall-induced (26% non-sampled) and 10% was baseflow. Approximately twice as much volume was measured in 2016 compared to 2015, though the baseflow amount was nearly identical (457 m3 in 2015 vs. 454 m3 in 2016). This was expected because the increase in tile drainage was in response to additional rainfall.
3.1.3. Total Phosphorus
Summary statistics for total phosphorus are shown in Figure 3 and reported in detail in [27]. Analysis of volume-weighted composite samples collected as part of this project revealed that the influent total phosphorus Event Mean Concentration (EMC) varied from 138 to 1516 μg/L with a volume-weighted average EMC of 370 ± 168 (α = 0.05, n = 20) μg/L. Capture of total phosphorus by the IESF was the combination of particulate phosphorus captured on or within the IESF by filtration and capture of phosphate within the IESF media through sorption with iron. Effluent total phosphorus EMC varied from 56 to 343 μg/L with a volume-weighted average EMC of 125 ± 30 (α = 0.05) μg/L. The total phosphorus load was reduced by 66.3% from 1274 g to 429 g. The arithmetic average (sum divided by n) influent and effluent load was 63.7 ± 22.1 g and 21.5 ± 9.6 g, respectively. Because the influent volume is assumed to equal the effluent volume for every rainfall-induced tile drainage event, the total load reduction percent was mathematically equivalent to the average load reduction (66.3%). The 95% confidence interval of the average as given by (2) was calculated based on the standard deviation of percent load reduction for 20 events. Thus, the total phosphorus load decreased by 66.3% ± 6.7% (α = 0.05, n = 20).
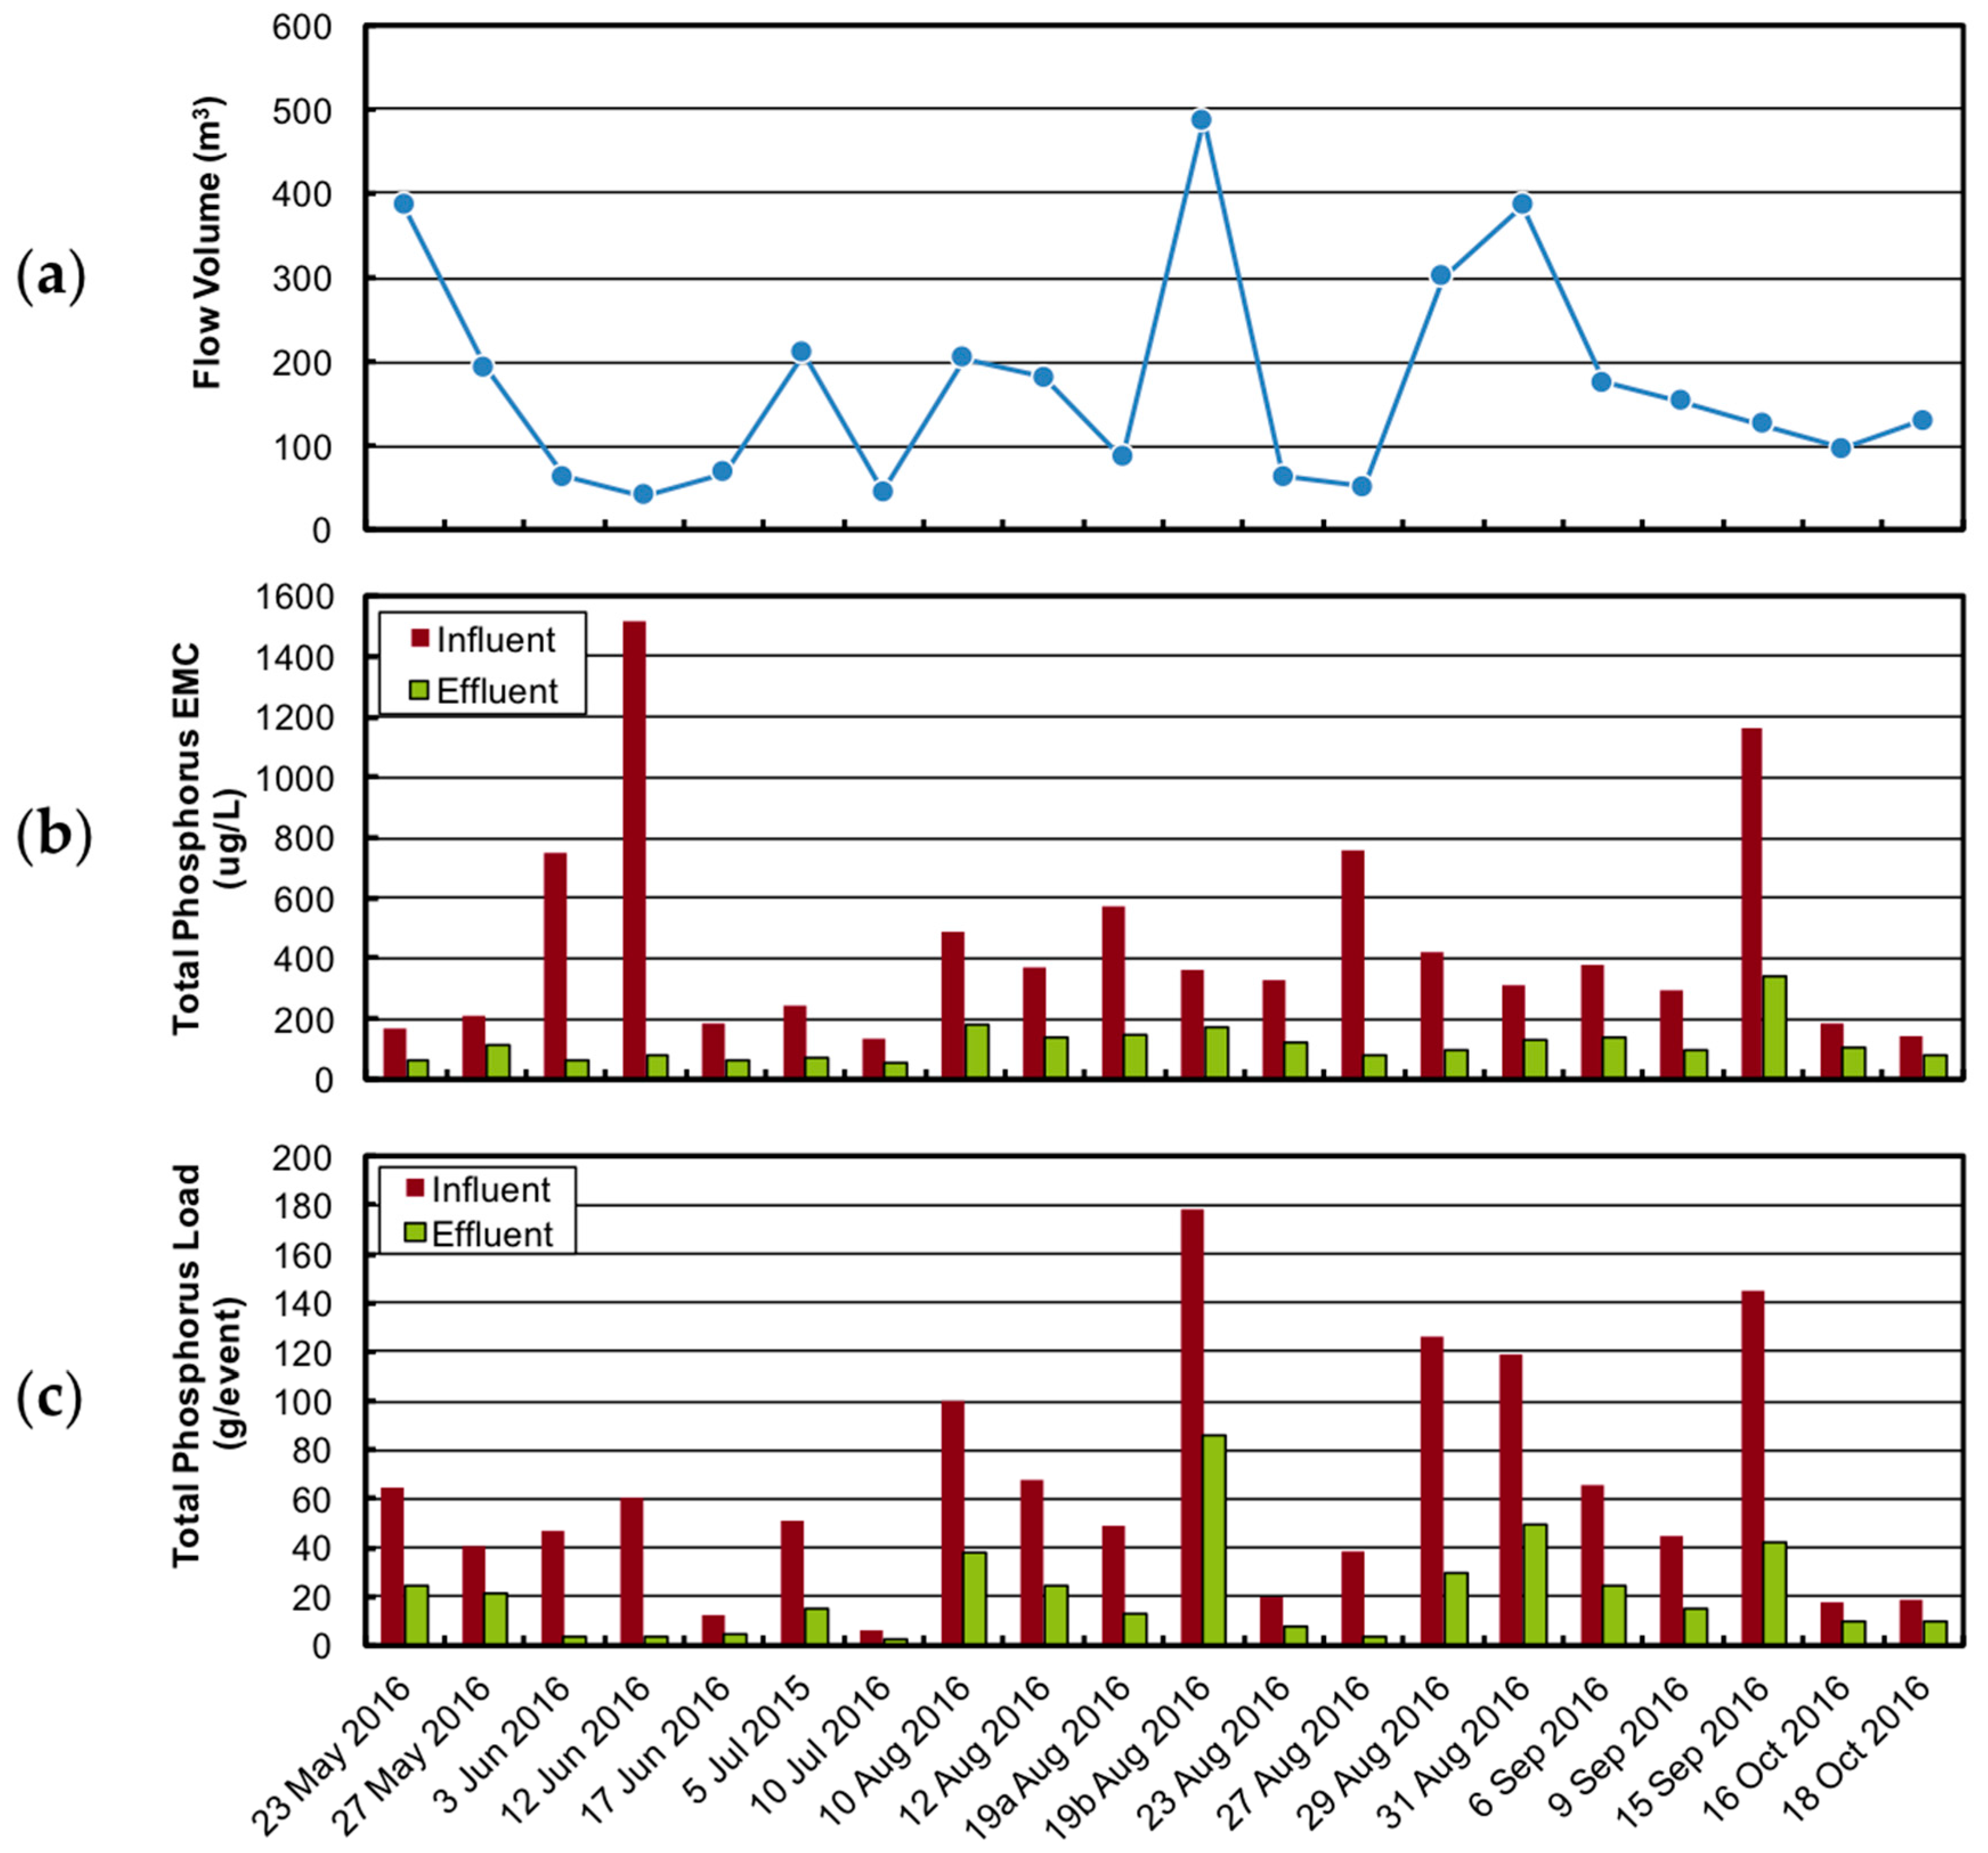
Rainfall-induced tile drainage, total phosphorus EMC and load for each event in 2016 are shown in Figure 4. All events exhibited positive total phosphorus capture (i.e., effluent EMC < influent EMC). Two events had influent EMCs greater than 1000 μg/L, but 13 of the 20 events had influent EMCs between 200 and 800 μg/L. By contrast, only one event had an effluent EMC greater than 200 μg/L and 9 of the 20 events had effluent EMCs less than 100 μg/L for total phosphorus. Thus, the total phosphorus EMC was reduced for all events.
The total phosphorus load reduction for each event varied from 42% to 95% with an overall total phosphorus load reduction of 66.3% ± 6.7% (α = 0.05, n = 20). A substantial portion of the influent total phosphorus load (323.6 g, 25%) was contributed by two events: 19 August 2016 (178.3 g) and 15 September 2016 (145.3 g), as shown in Figure 4. These two events contributed approximately 17.8% of the rainfall-induced tile drainage in 2016. Three other events each contributed between 100 and 130 g of total phosphorus load, which accounts for approximately 344.6 g (27%) of the overall influent total phosphorus load and 26% of the tile drainage. Thus, five of the 20 events (25%) contributed approximately 52.5% of the influent total phosphorus load and 43.7% of the tile drainage. This shows that a relatively small number of events with large tile drainage can contribute most of the total phosphorus load and tile drainage in a region where thunderstorms are common.
Total phosphorus was not measured in samples from 2015, but the total phosphorus influent load for all 2016 events was 1274 g. If this load is attributed to the entire 7.45-ha contributing watershed, the total phosphorus load per land area is approximately 171 g per ha (g/ha). This load only represents tile drainage between June and November 2016, and excludes any load that may have been contributed by non-sampled events. By comparison, ten Discovery Farms Minnesota (DFM) sites reported total phosphorus loads for the entire 2016 water year ranging from 11.2 to 157 g/ha for tile drainage [28]. The tile drainage at the IESF site appears to contain more total phosphorus load per area in six months than the annual load at DFM sites.
3.1.4. Phosphate
Summary statistics for phosphate are shown in Figure 5 and reported in detail in [27]. The influent total phosphorus EMC varied from 18 to 358 μg/L with a volume-weighted average EMC of 162 ± 33 (α = 0.05) μg/L. All events exhibited positive capture (i.e., effluent EMC < influent EMC) of phosphate, likely due to sorption with iron oxide surfaces in the IESF [17,18]. As a result, the effluent EMC varied from 8 to 127 μg/L with a volume-weighted average EMC of 57 ± 13 (α = 0.05) μg/L. The phosphate load was reduced by 63.9% from 956 g to 345 g. The arithmetic average (sum divided by n) influent and effluent load was 30.8 ± 13.9 g and 11.1 ± 5.1 g, respectively, and the 95% confidence interval of the average as given by (2) was calculated for 31 events. Thus, the phosphate load decreased by 63.9% ± 7.7% (α = 0.05, n = 31).
Rainfall-induced tile drainage, phosphate EMC and load for each event in 2015 and 2016 are shown in Figure 6. While the influent phosphate EMC appears to increase from 2015 to 2016, the volume-weighted average EMCs were 158 ± 37 μg/L and 165 ± 54 μg/L, respectively. The volume-weighted effluent phosphate EMCs were also similar in 2015 and 2016; 56 ± 18 μg/L and 60 ± 19 μg/L, respectively. Thus, there was minimal, if any, change in EMC from 2015 to 2016.
The influent phosphate load varied from 2.8 to 157 g per event with an average load of 31 ± 14 (α = 0.05, n = 31) grams per event and a total influent load of 956.1 g (Figure 5). The effluent load varied from 0.4 to 61.7 g per event with a volume-weighted average of 15.6 (α = 0.05) grams per event and a total effluent load of 345.1 g. The load reduction for each event varied from 9% to 87% with an overall phosphate load reduction of 63.9% ± 7.7% (α = 0.05, n = 31).
The influent phosphate load for all events in 2015 and 2016 was 956.1 g. A substantial portion of that load (271.9 g, 28%) was contributed by two events: 19 August 2016 (157 g) and 16 July 2015 (114.8 g), as shown in Figure 6. These two events contributed 16.5% of the tile drainage. Seven other events each contributed between 50 and 80 g of phosphate load in 2015 and 2016, which accounts for approximately 461 g (48%) of the overall influent phosphate load and 36.7% of the tile drainage. Thus, nine of the 31 events (29%) contributed approximately 76.7% of the influent phosphate load and 53.1% of the tile drainage. This further shows that a relatively small number of events with large tile drainage can contribute most of the phosphate load and tile drainage in an area where thunderstorms are common.
3.2. Soluble Fraction
A pollutant can either exist in soluble phase (e.g., aqueous) or in particulate phase (e.g., attached to a mineral or incorporated into organic matter). The total concentration is the sum of the soluble concentration and particulate concentration, where the soluble portion is defined as smaller than 0.45 μm [24]. The soluble fraction can be calculated by dividing the soluble concentration by the total concentration. Calculating the soluble fraction can provide insight into the relative performance of the different treatment mechanisms. For sand filters, a portion of the particulates are captured by filtration on the surface and within the media. The IESF also captures a portion of the soluble phase of phosphorus (phosphate) through adsorption with iron.
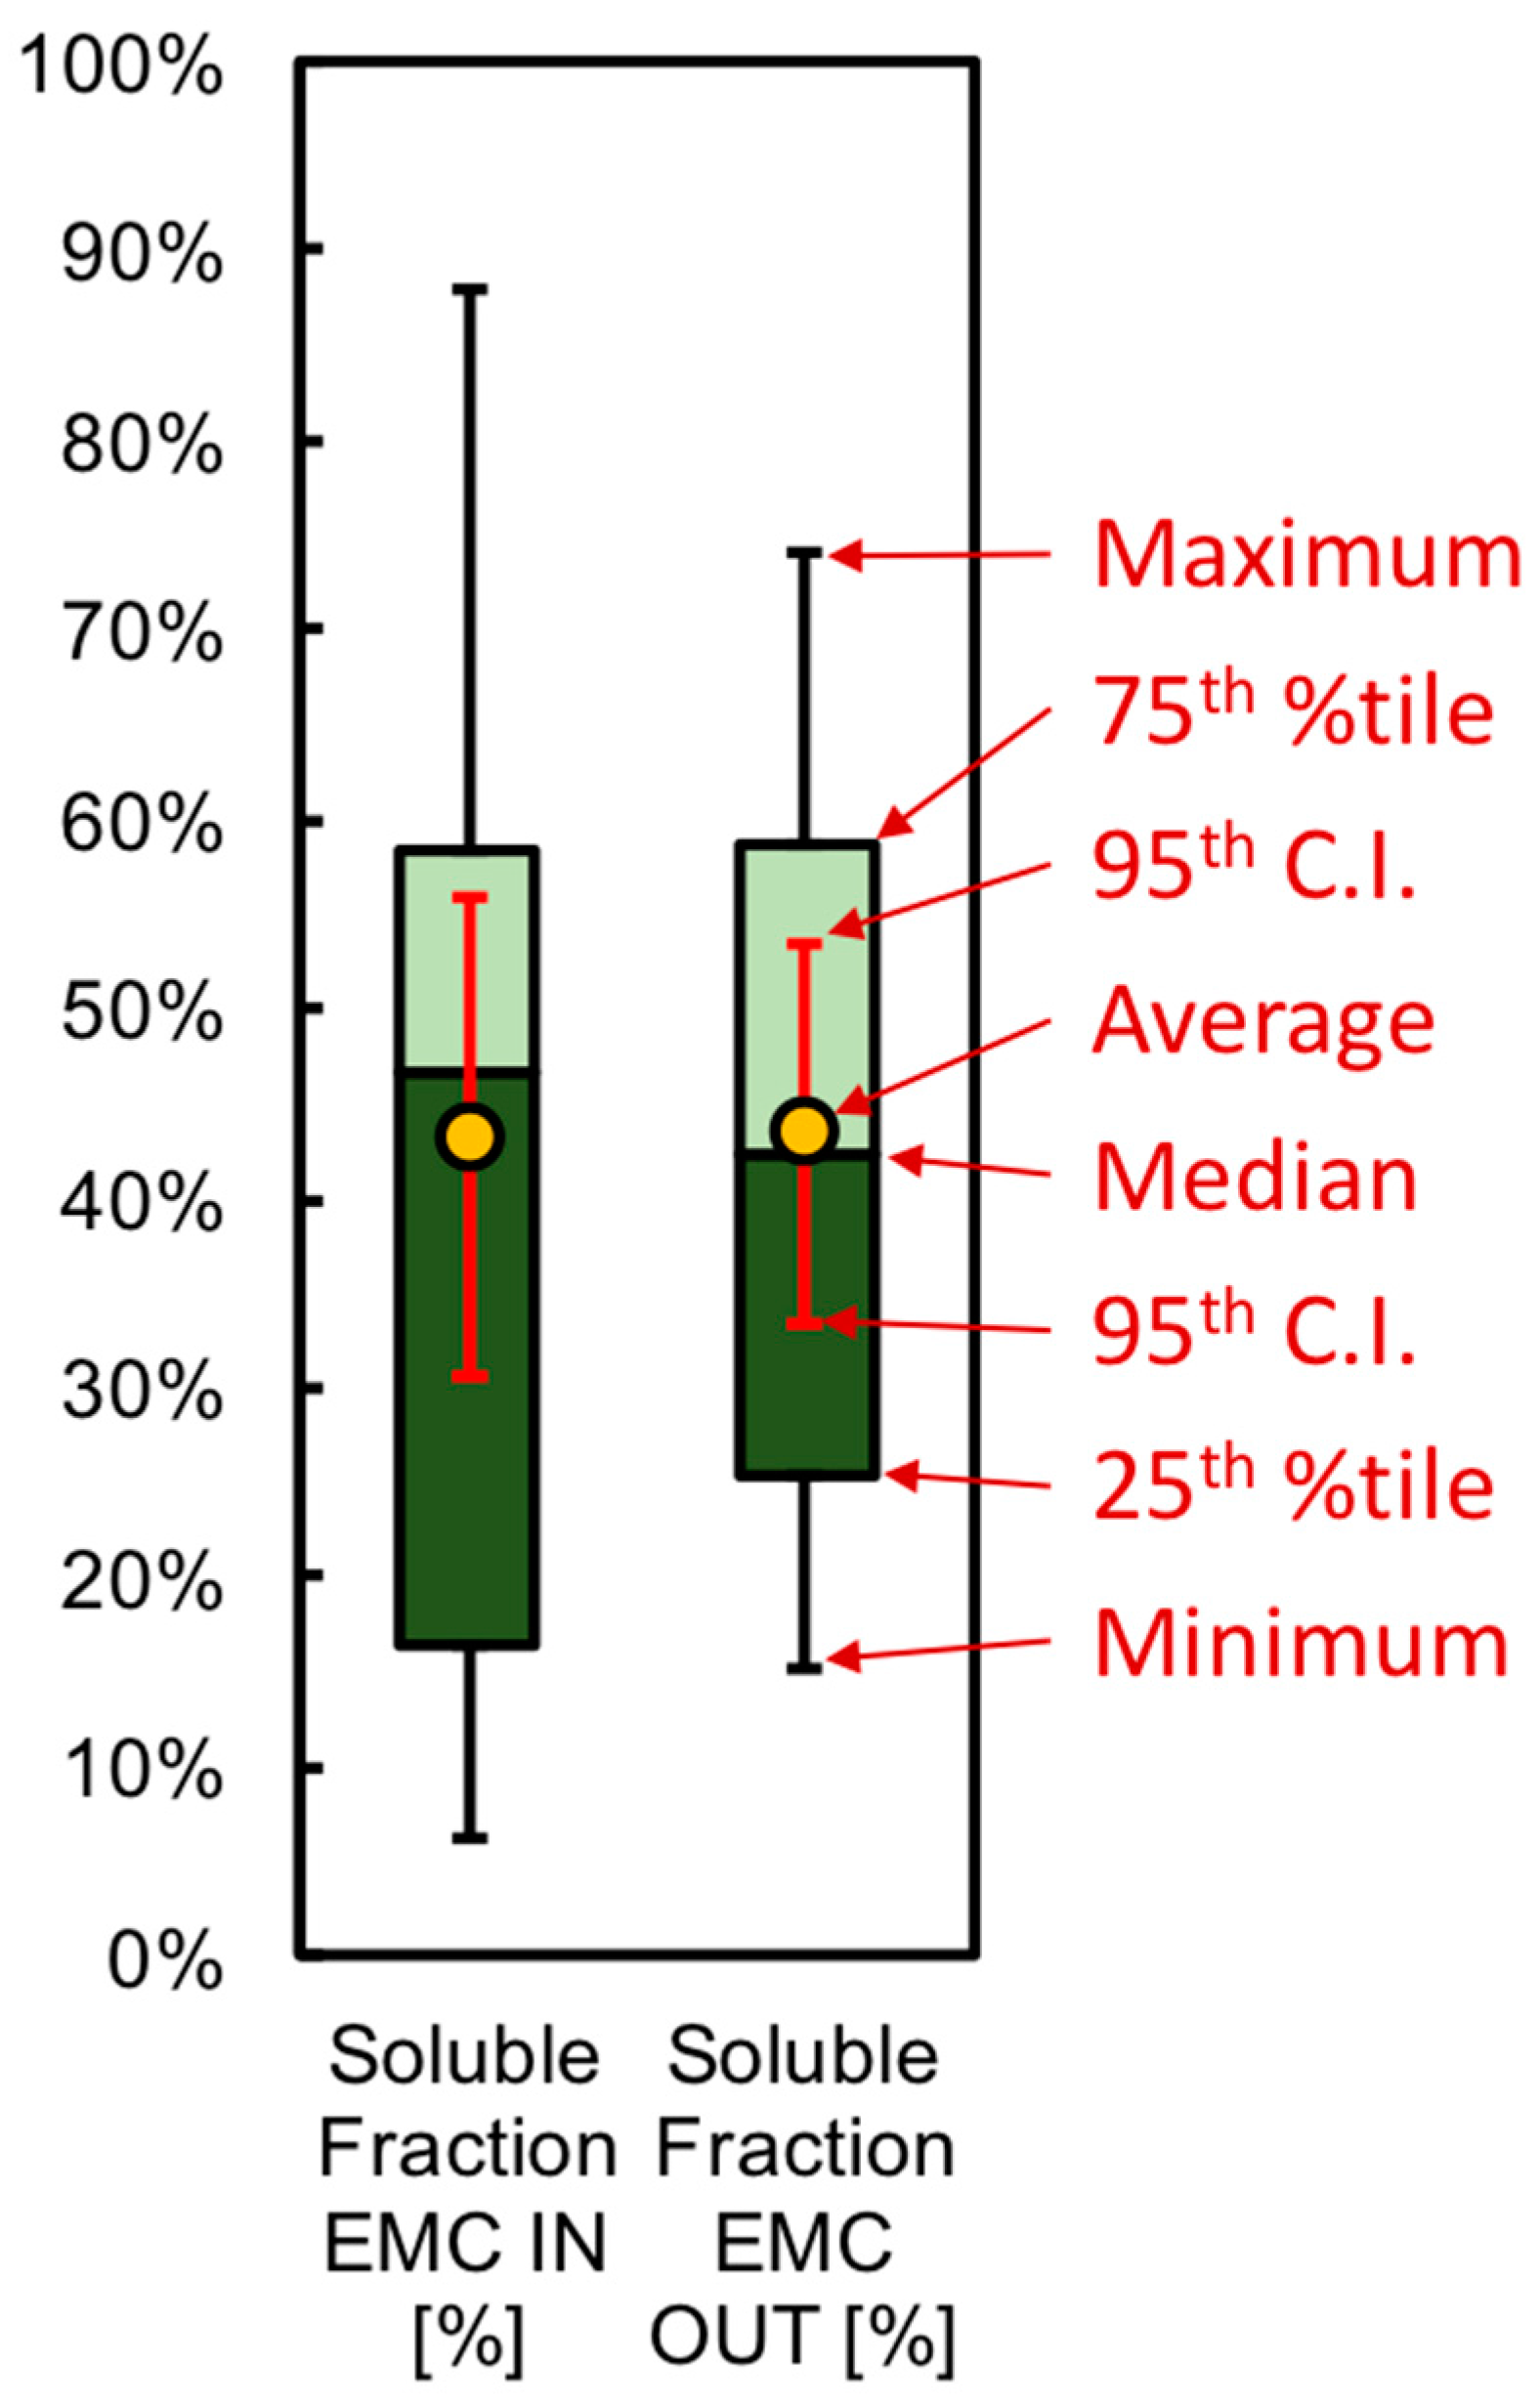
The soluble fraction of phosphorus (%) for the rainfall event samples collected throughout this project are presented in Figure 7. The influent soluble fraction varied from approximately 5% to 90%, with an average of 43.2% ± 12.6% (α = 0.05, n = 18), which is similar to values measured in urban stormwater [17,18]. The effluent soluble fraction varied from approximately 15% to 75% with an average of 43.5% ± 10.0% (α = 0.05, n = 18). For comparison, nine Discovery Farms Minnesota (DFM) sites reported an average of 60% soluble fraction for tile drainage samples collected between 2011 and 2016. The soluble fraction reported by DFM is expected because tile drainage has already been filtered by the soil. For unknown reasons, the 2015–2016 influent to the IESF had an unusually high percentage of particulate phosphorus.
Performance data previously discussed in Section 3.1 show that phosphate and total phosphorus were captured by the IESF at approximately the same rate and the average soluble fraction of influent and effluent were similar (i.e., 43% and 44%, respectively). Thus, particulate phosphorus and soluble phosphate are captured at roughly the same level of performance. Relative to sand filters in urban settings, the particulate phosphorus capture performance was low, likely due to the smaller size of particulates in the agricultural tile drainage.
3.3. Hydraulic and Phosphate Loading Rate
The IESF in this study was constructed in October 2012. Rainfall and flow rate data were not collected at the IESF until June 2015. Rainfall, however, is measured at a municipal airport (KCFE, Buffalo, MT, USA) approximately 8.7 km northwest of the IESF. The rainfall data measured at KCFE was correlated (R2 = 0.869) to the rainfall data measured at the IESF during this project [27], as
where RainIESF = precipitation measured at the IESF site, RainKCFE = precipitation measured at the Buffalo Municipal Airport (KCFE). Using Equation (3), the precipitation at the IESF can be predicted from historical rainfall data at KCFE for the periods when precipitation was not measured at the IESF. Approximately 253.6 cm of precipitation fell at KCFE between 30 October 2012 and 18 October 2016, which can be extrapolated to total precipitation depth of approximately 301.2 cm at the IESF using Equation (3).
Multiplying the contributing area (7.45 ha) by the rainfall depth (301 cm) yields a predicted rainfall volume of approximately 224,500 m3. Given an estimated tile drainage “runoff coefficient” of 0.12, the estimated tile drainage was 27,000 m3, which corresponds to the total volume of water treated by the IESF since it was constructed. Dividing the volume treated (27,000 m3) by the surface area of the IESF (92.9 m2) yields a depth treated of approximately 290 m.
Overall, the performance of the IESF in this study (63.9% phosphate and 66.3% total phosphorus load reduction) is comparable to other agricultural treatment practices and studies of IESFs. The IESF captures more phosphorus than constructed wetlands, for both total phosphorus (2–44%, [10,11,12,13,14]) and phosphate (9%, [12]), though the data falls within the upper range reported for a study of 17 intensively studied constructed wetlands (TP = 1–88%; DRP = −19 to 89%, [15]). Laboratory experiments of IESFs in previous studies found an average of 88% phosphate capture with a total treated depth of 200 m [18]. The amount of tile drainage water treated by the IESF in this study from October 2012 to October 2016 was approximately 290 m of treated depth, which exceeds previously investigated treated depths (200 m) [17,18]. An IESF trench after less than one year of operation exhibited an average of 60% phosphate load reduction for 7.2% iron by weight, and 78.8% phosphate load reduction for 10.7% iron by weight [29]. The measured performance is also expected to be less in field studies compared to laboratory studies due to ion competition with phosphate of natural stormwater and tile drainage compared to laboratory synthetic stormwater.
3.4. Maintenance
Regular, routine maintenance began within one or two years of construction and consisted of Wright SWCD staff visiting the site once or twice per month to (1) remove vegetation, iron ochre, and algae from the IESF, and (2) scrape and level the surface as needed. These activities occurred during the months of May through September of each year and required one or two individuals less than approximately one hour each to complete per site visit. In addition, non-routine maintenance was needed in May 2016 to remove a substantial accumulation of vegetation, iron ochre, and algae from the surface and required two individuals for approximately 2 h each.
Iron ochre is a waste product from bacteria that oxidize dissolved minerals such as iron and was visible on the IESF as a rust colored sludge when wet and as a rust colored thin crust/cake when dry. It is likely that the dissolved iron in the water from the tile drainage was sufficient to support bacteria that produce iron ochre. The accumulation of iron ochre and subsequent biofouling reduced the hydraulic capacity of the IESF in locations near the inlet to near zero, resulting in small pools of water between rainfall-induced tile drainage events. Algae sometimes grew within standing water on the IESF surface, and was also removed during routine maintenance. The combination of iron ochre, algae, and biofouling caused “creeping failure” on the surface of the IESF, moving slowly from the inlet towards the outlet. If vegetation, iron ochre, and algae were not removed during routine maintenance, accumulation would begin to clog the entire IESF surface and prevent treatment. These maintenance activities are recommended as part of the management of other, similar IESF systems.
4. Application to Other Locations
The objective of this project was to measure the performance of an IESF with regards to the capture of total phosphorus and phosphate from agricultural tile drainage. The performance of this IESF is specific to this design, this location, and the period of time over which it was monitored. It is feasible, however, that an IESF could be installed in other locations to capture total phosphorus and phosphate. To aid designers, several important design considerations are listed in the following section and an example design calculation is provided in [27].
IESF Design Considerations:
- The IESF must be allowed to drain, and therefore the outlet of the underdrain system below the IESF must be placed above the high-water elevation of the downstream conveyance system and/or waterbody. This will prevent inundation of the IESF from downstream flooding.
- Intermittent flow onto the IESF is recommended. As the current study has shown, however, near-continuous flow may be feasible if the underdrain system of the IESF allows atmospheric oxygen to reach the IESF media and the surface is not continuously inundated.
- The IESF should be designed with 8% or less of iron by weight. Iron content greater than 8% may cause clogging and prevent flow through the system [18,29]. Many IESF systems, including the one studied in this project, have used 5% iron by weight. In addition, it is recommended that the iron be mixed thoroughly with clean washed sand such as ASTM C-33 [21]. Too little or too much mixing may cause stratification of iron within the sand due to density and size differences, so it is important to regularly inspect the media during the mixing process. Previous installations have found that roto-tilling the iron into the sand in layers of approximately 5–10 cm deep adequately mixes the iron into the sand.
- The iron used in the IESF should be high purity (90%+ elemental iron) with little or no toxic impurities (e.g., copper, cadmium, lead, etc.). In addition, the iron should be reactive with phosphate. Iron and impurity content should be verified independently of the supplier to ensure purity and prevent the leaching of contaminants into the filtered runoff.
- For maintenance considerations, a filtration rate of 10 cm/h through the IESF media can be used to estimate the IESF surface area needed to treat a known or estimated (peak) flow rate. The smaller the IESF surface area, the greater the frequency of required maintenance.
- For lifetime capacity considerations, a sorption capacity of 5 mg phosphate per gram iron [18] can be used to estimate the amount of iron needed to treat a known or estimated phosphate load.
- Recommended maintenance of the IESF consists of (1) removal of vegetation, iron ochre, and algae and (2) leveling and scraping of the IESF surface. If vegetation, iron ochre, and algae are not removed during routine maintenance, accumulation will clog the IESF surface and prevent treatment.
5. Conclusions
An iron enhanced sand filter (IESF) was installed in Wright County, MT, USA to reduce soluble phosphate and total phosphorus loads from agricultural tile drainage. For this study, monitoring equipment was installed to collect volume-weighted composite samples during rainfall-induced tile drainage events of 2015 and 2016. Approximately 90% of the measured tile drainage corresponded to rainfall-induced events and approximately 10% corresponded to baseflow. During the study period, 33 rainfall events were monitored and IESF capture performance was determined for phosphate and total phosphorus.
The rainfall depth of events measured from approximately June through November in 2015 and 2016 varied from 0.05 to 7.32 cm per event with an average of 2.23 ± 0.70 (α = 0.05, n = 30) cm, a total of 66.95 cm, and an effective tile drainage “runoff coefficient” of 0.12. The total phosphorus load reduction varied from 42% to 95% with a volume-weighted average reduction of 66.3% ± 6.7% (α = 0.05, n = 20) in 2016. The phosphate load reduction varied from 9% to 87% with a volume-weighted average reduction of 63.9% ± 7.7% (α = 0.05, n = 31) in 2015 and 2016. The total phosphorus load reduction (66.3%) was similar to the phosphate load reduction (63.9%) because the IESF removed both particulate phosphorus and soluble phosphate. In addition, the influent soluble fraction varied from approximately 5% to 90% with an average of 43.2% ± 12.6% (α = 0.05, n = 18) and effluent soluble fraction varied from approximately 15% to 75% with an average of 43.5% ± 10.0% (α = 0.05, n = 18). The average influent and effluent soluble fractions are similar, thus suggesting that particulate phosphorus and soluble phosphate are captured at approximately the same level of performance for agricultural tile drainage.
Maintenance of the IESF consisted of: (1) removal of vegetation, iron ochre and algae; and (2) leveling and scraping of the IESF surface. This occurred approximately once or twice per month during the growing season (May to September) of each year and each occurrence required typically less than one hour per person for one or two people. Routine and non-routine maintenance performed since installation of the IESF resulted in reduction of total phosphorus and phosphate loads on the receiving water body for all rainfall-induced tile drainage events measured during this study. If vegetation, iron ochre, and algae were not removed during routine maintenance, accumulation would clog the IESF surface and prevent treatment. This level of maintenance was satisfactory to ensure proper flow rate and contact between the water and the IESF media and is expected to continue throughout the life of the IESF. These maintenance activities are also recommended as part of the management of other, similar IESF systems.
Acknowledgments
This project was funded by the Minnesota Pollution Control Agency through the Federal Clean Water Act Section 319 grant program, SWIFT Contract No. 66692; Award No. 44095, with David Wall as Project Manager. David’s assistance and support throughout this project was greatly appreciated. The Wright Soil and Water Conservation District provided in-kind match and assistance throughout the project. Support from the Wright Soil and Water Conservation District including Joe Jacobs, Dan Nadeau, Alicia O’Hare, Kerry Saxton, and summer support staff was greatly appreciated. In addition, the assistance and support from St. Anthony Falls Laboratory (SAFL) staff and students including Peter Corkery, Jenni Snyder, David Liddell, Tyler Olsen, Poornima Natarajan, Rob Gabrielson, Ben Erickson, Dick Christopher, Seth Strelow, and Raphael Martins was appreciated. Comments from anonymous reviewers and timely response from the journal editors were also greatly appreciated. Participation by volunteer industry professionals to become members of the Technical Advisory Panel was appreciated. Funds were not received for covering the costs associated with publishing this article in an open access journal.
Author Contributions
All authors worked on all portions of the conception, experiments, analysis, as well as drafting and reviewing the paper.
Conflicts of Interest
The authors declare no conflict of interest.
References
- Stumm, W.; Morgan, J.J. Aquatic Chemistry: An Introduction Emphasizing Chemical Equilibria in Natural Waters, 2nd ed.; Wiley: New York, NY, USA, 1981; p. 780. [Google Scholar]
- Sharpley, A.N.; Smith, S.J.; Jones, O.R.; Berg, W.A.; Coleman, G.A. The Transport of Bioavailable Phosphorus in Agricultural Runoff. J. Environ. Q. 1992, 21, 30–35. [Google Scholar] [CrossRef]
- Aldridge, K.T.; Ganf, G.G. Modification of sediment redox potential by three contrasting macrophytes: Implications for phosphorus adsorption/desorption. Mar. Freshw. Res. 2003, 54, 87–94. [Google Scholar] [CrossRef]
- U.S. EPA. Preliminary Data Summary of Urban Storm Water Best Management Practices; U.S. Environmental Protection Agency: Washington, DC, USA, 1999. Available online: https://www.epa.gov/environmental-topics/water-topics (accessed on 01 May 2007).
- Schindler, D.W. Evolution of phosphorus limitation in lakes: Natural mechanisms compensate for deficiencies of nitrogen and carbon in eutrophied lakes. Science 1977, 195, 260–262. [Google Scholar] [CrossRef] [PubMed]
- Carpenter, S.R. Phosphorus control is critical to mitigating eutrophication. Proc. Natl. Acad. Sci. USA 2008, 105, 11039–11040. [Google Scholar] [CrossRef] [PubMed]
- Weiss, P.T.; Gulliver, J.S.; Erickson, A.J. Cost and pollutant removal of storm-water treatment practices. J. Water Resour. Plan. Manag. ASCE 2007, 133, 218–229. [Google Scholar] [CrossRef]
- Sharpley, A.; Foy, B.; Withers, P. Practical and Innovative Measures for the Control of Agricultural Phosphorus Losses to Water: An Overview. J. Environ. Q. 2000, 29, 1–9. [Google Scholar] [CrossRef]
- Sharpley, A.N.; Daniel, T.; Gibson, G.; Bundy, L.; Cabrera, M.; Sims, T.; Stevens, R.; Lemunyon, J.; Kleinman, P.; Parry, R. Best Management Practices to Minimize Agricultural Phosphorus Impacts on Water Quality; Agricultural Research Service Report ARS-163; U.S. Department of Agriculture: Ames, IA, USA, 2006; p. 52.
- Braskerud, B.C. Factors affecting phosphorus retention in small constructed wetlands treating agricultural non-point source pollution. Ecol. Eng. 2002, 19, 41–61. [Google Scholar] [CrossRef]
- Kovacic, D.A.; David, M.B.; Gentry, L.E.; Starks, K.M.; Cooke, R.A. Effectiveness of constructed wetlands in reducing nitrogen and phosphorus export from agricultural tile drainage. J. Environ. Q. 2000, 29, 1262–1274. [Google Scholar] [CrossRef]
- Kynkäänniemi, P.; Ulén, B.; Torstensson, G.; Tonderski, K.S. Phosphorus retention in a newly constructed wetland receiving agricultural tile drainage water. J. Environ. Q. 2013, 42, 596–605. [Google Scholar] [CrossRef] [PubMed]
- Reinhardt, M.; Gächter, R.; Wehrli, B.; Müller, B. Phosphorus retention in small constructed wetlands treating agricultural drainage water. J. Environ. Q. 2005, 34, 1251–1259. [Google Scholar] [CrossRef] [PubMed]
- Tonderski, K.S.; Arheimer, B.; Pers, C.B. Modeling the impact of potential wetlands on phosphorus retention in a Swedish catchment. AMBIO J. Hum. Environ. 2005, 34, 544–551. [Google Scholar] [CrossRef]
- Braskerud, B.C.; Tonderski, K.S.; Wedding, B.; Bakke, R.; Blankenberg, A.G.; Ulén, B.; Koskiaho, J. Can constructed wetlands reduce the diffuse phosphorus loads to eutrophic water in cold temperate regions? J. Environ. Q. 2005, 34, 2145–2155. [Google Scholar] [CrossRef] [PubMed]
- LeFevre, G.H.; Paus, K.H.; Natarajan, P.; Gulliver, J.S.; Novak, P.J.; Hozalski, R.M. A Review of Dissolved Pollutants in Urban Stormwater and their Removal and Fate in Bioretention Cells. J. Environ. Eng. 2015, 141. [Google Scholar] [CrossRef]
- Erickson, A.J.; Gulliver, J.S.; Weiss, P.T. Enhanced sand filtration for storm water phosphorus removal. J. Environ. Eng. 2007, 133, 485–497. [Google Scholar] [CrossRef]
- Erickson, A.J.; Gulliver, J.S.; Weiss, P.T. Capturing phosphates with iron enhanced sand filtration. Water Res. 2012, 46, 3032–3042. [Google Scholar] [CrossRef] [PubMed]
- Erickson, A.J.; Gulliver, J.S.; Weiss, P.T. Monitoring an Iron-Enhanced Sand Filter Trench for the Capture of Phosphate from Stormwater Runoff; St. Anthony Falls Laboratory Project Report #575; University of Minnesota: Minneapolis, MN, USA, September 2015; Available online: http://hdl.handle.net/11299/175078 (accessed on 27 October 2015).
- Minnesota Department of Natural Resources. National Wetland Inventory for Minnesota. Available online: http://mndnr.maps.arcgis.com/apps/OnePane/basicviewer/index.html?appid=7132a264fcd449deb8521268c0698046 (accessed on 10 July 2017).
- American Society for Testing and Materials. C 33-02a: Standard Specification for Concrete Aggregates. In Annual Book of American Society for Testing and Materials (ASTM) Standards; American Society for Testing And Materials: West Conshohocken, PA, USA, 2002; Volume 4. [Google Scholar]
- Franzini, J.B.; Finnemore, E.J. Fluid Mechanics with Engineering Applications, 9th ed.; McGraw Hill: New York, NY, USA, 1997; p. 807. [Google Scholar]
- Villemonte, J. Submerged Weir Discharge Studies. Eng. News Record 1947, 139, 54–56. [Google Scholar]
- American Public Health Association (APHA). 4500-P Phosphorus. In Standard Methods for the Examination of Water and Wastewater, 20th ed.; American Public Health Association: Washington, DC, USA, 1998. [Google Scholar]
- Wadsworth, H.M. Handbook of Statistical Methods for Engineers and Scientists, 2nd ed.; McGraw-Hill: New York, NY, USA, 1998. [Google Scholar]
- Erickson, A.J.; Weiss, P.T.; Gulliver, J.S. Optimizing Stormwater Treatment Practices: A Handbook of Assessment and Maintenance, 1st ed.; Springer: New York, NY, USA, 2013. [Google Scholar]
- Erickson, A.J.; Gulliver, J.S.; Weiss, P.T. Monitoring an Iron-Enhanced Sand Filter for Phosphorus Capture from Agricultural Tile Drainage; St. Anthony Falls Laboratory Project Report #581; University of Minnesota: Minneapolis, MN, USA, June 2017; Available online: http://hdl.handle.net/11299/188974 (accessed on 27 July 2017).
- Discovery Farms Minnesota (DFM). 2016 Year in Review, Discovery Farms Minnesota. Available online: http://www.discoveryfarmsmn.org/ (accessed on 28 April 2017).
- Erickson, A.J.; Gulliver, J.S. Performance Assessment of an Iron-Enhanced Sand Filtration Trench for Capturing Dissolved Phosphorus; St. Anthony Falls Laboratory Project Report #549, Prepared for the City of Prior Lake; University of Minnesota: Minneapolis, MN, USA, 2010. [Google Scholar]
Figure 1.
Site photo of Iron Enhanced Sand Filter (IESF) shortly after construction.

Figure 2.
Iron enhanced sand filter (IESF) schematic with relative location of Agri Drain and V-notch weir (not to scale).
Figure 2.
Iron enhanced sand filter (IESF) schematic with relative location of Agri Drain and V-notch weir (not to scale).
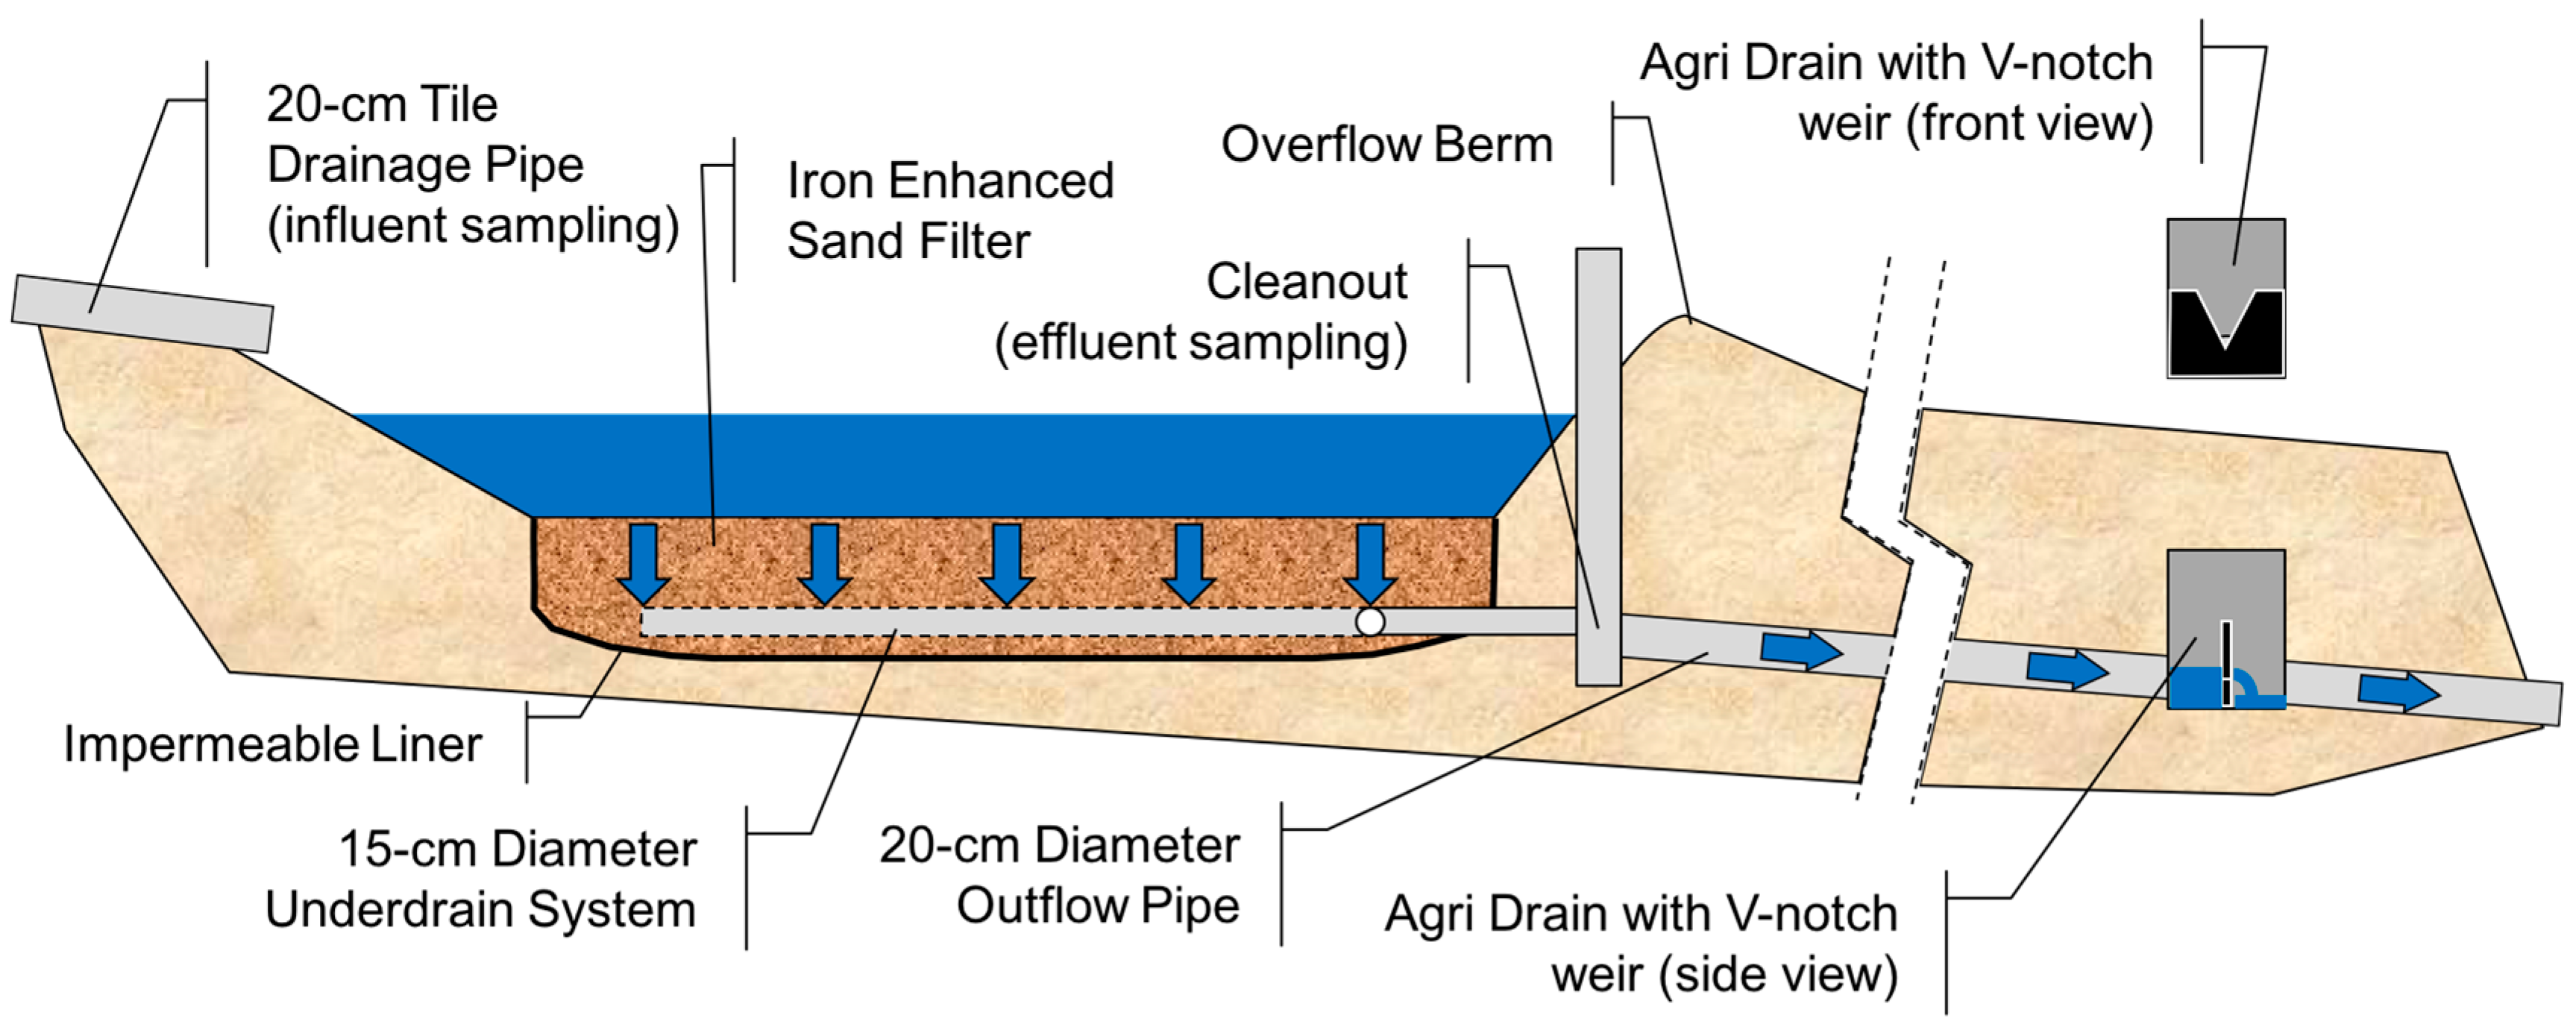
Figure 3.
Total phosphorus (TP) statistics for n = 20 events in 2016 for (a) influent (IN) and effluent (OUT) EMC; (b) influent (IN) and effluent (OUT) load; and (c) load capture (%). Note: %tile = percentile and 95th C.I. = 95% confidence interval of the average.
Figure 3.
Total phosphorus (TP) statistics for n = 20 events in 2016 for (a) influent (IN) and effluent (OUT) EMC; (b) influent (IN) and effluent (OUT) load; and (c) load capture (%). Note: %tile = percentile and 95th C.I. = 95% confidence interval of the average.
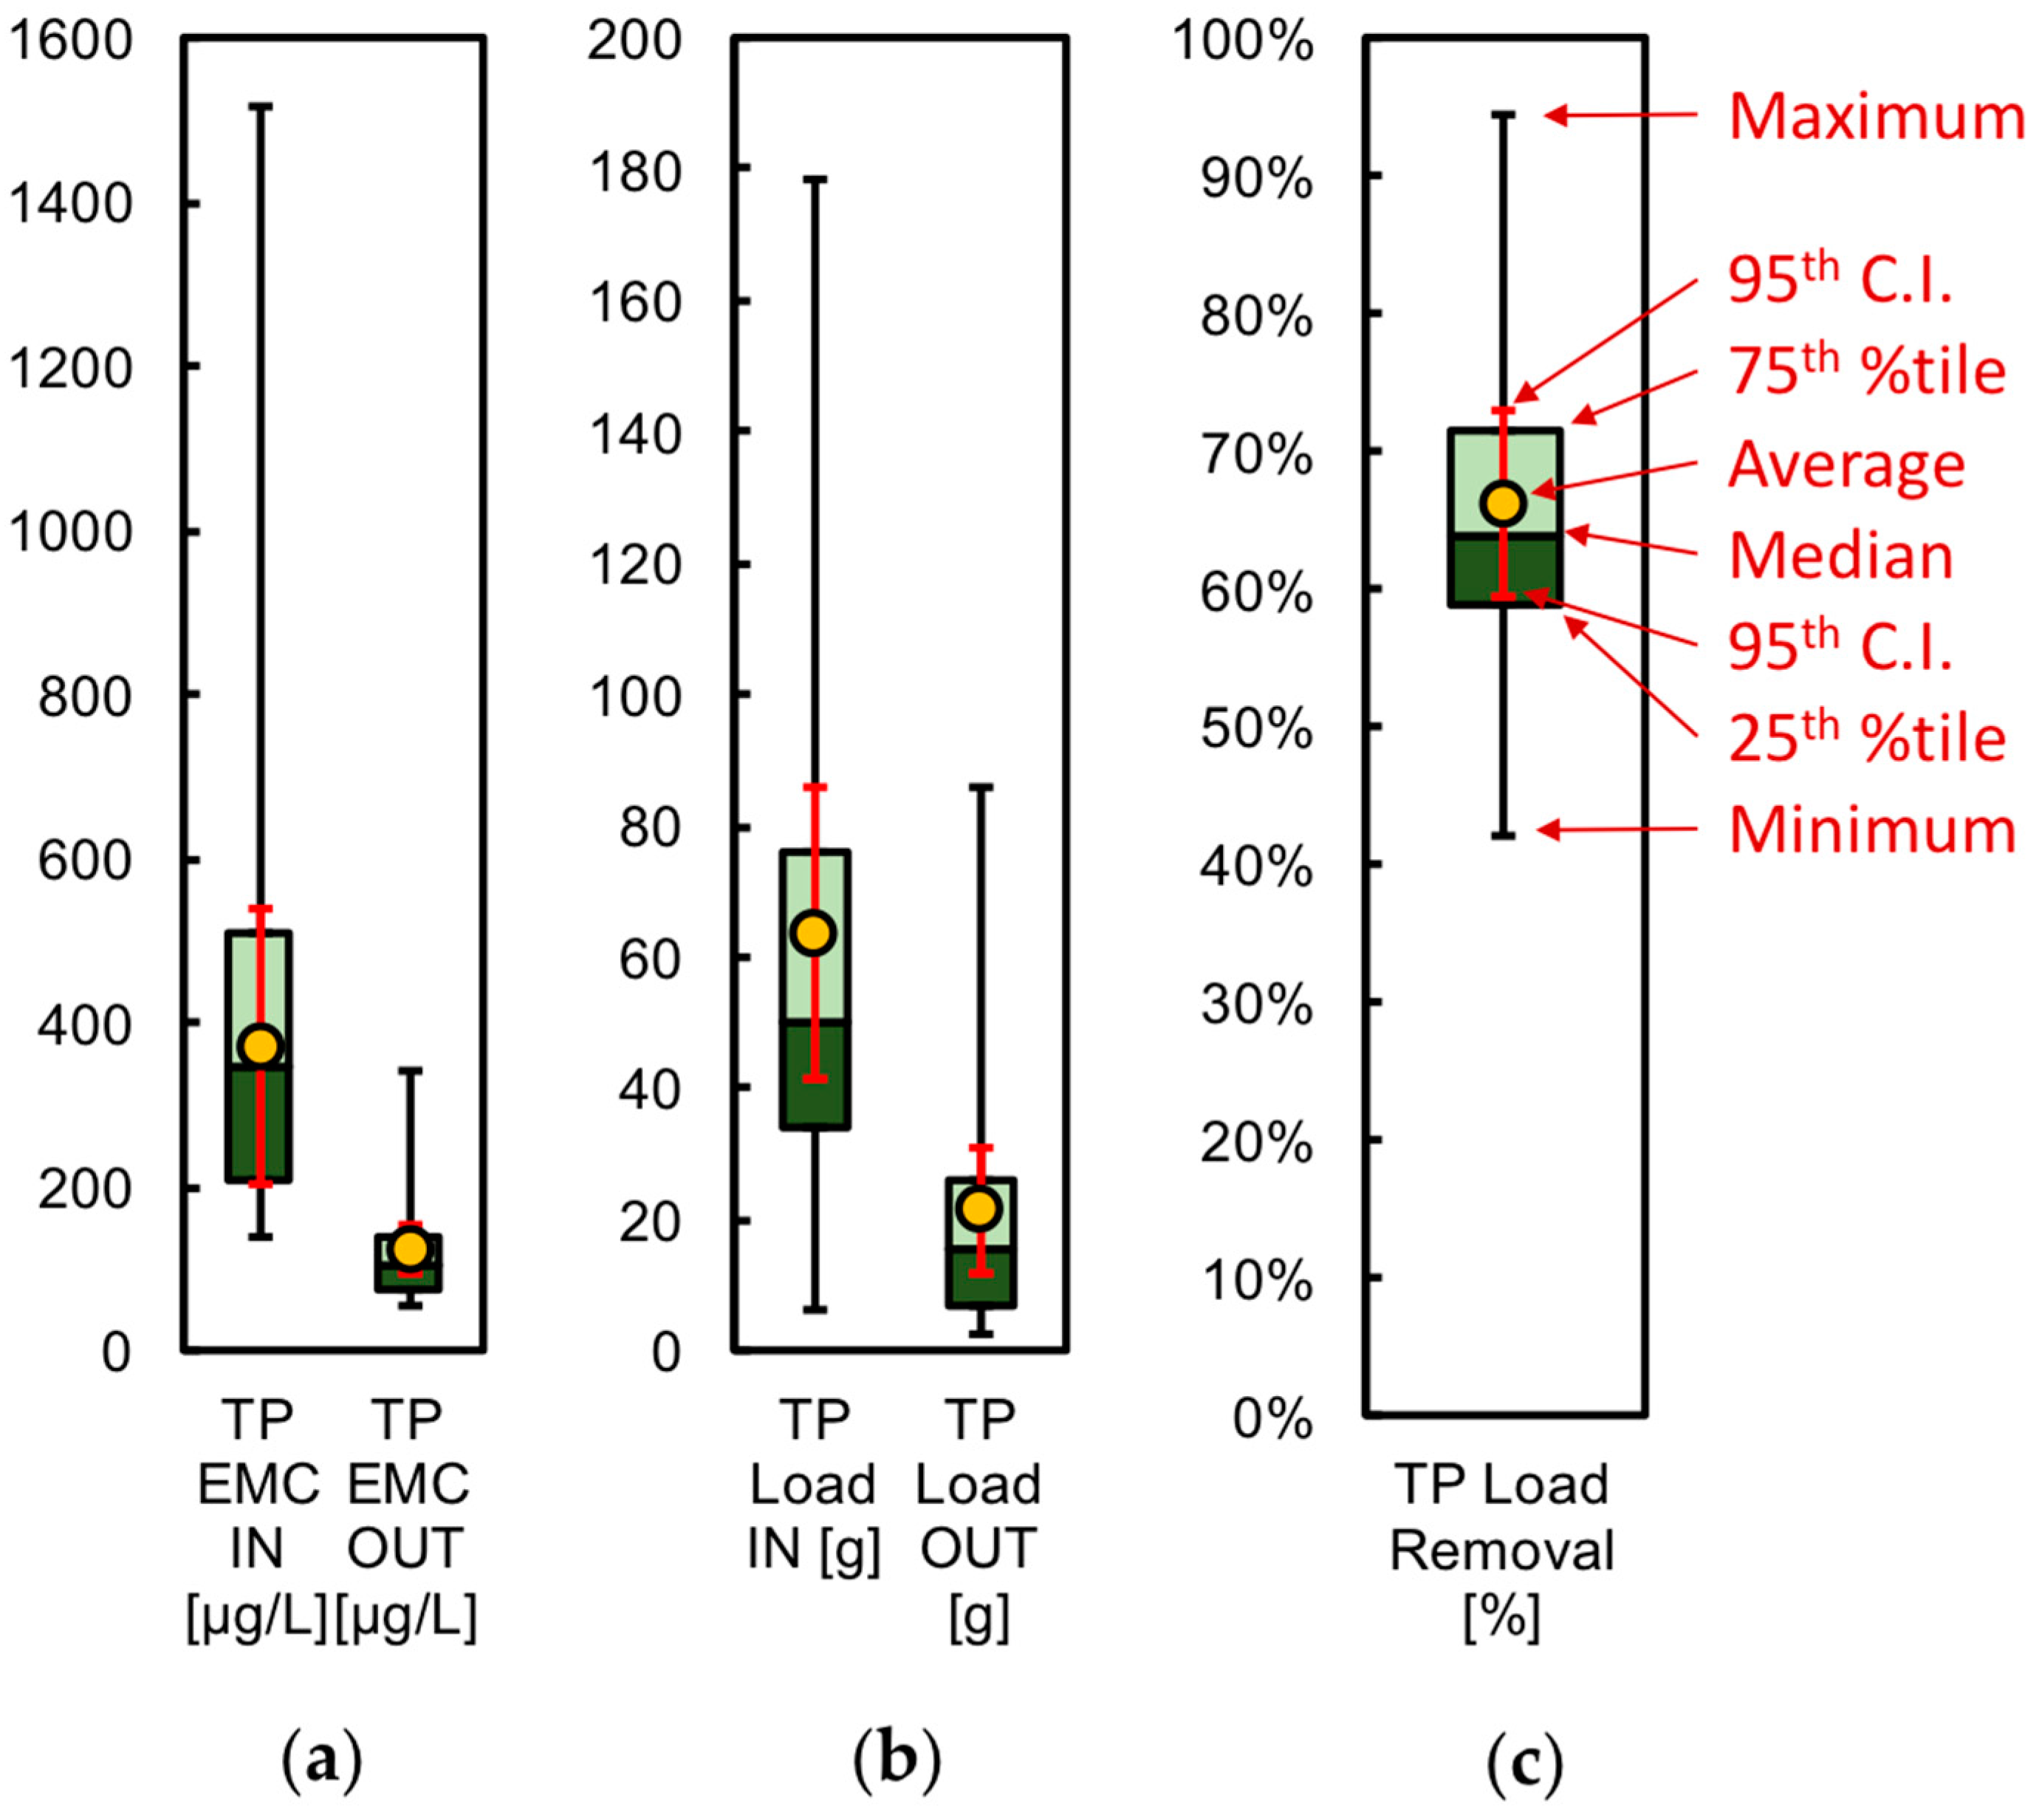
Figure 4.
(a) Rainfall-induced tile drainage, total phosphorus influent and effluent (b) EMC, and (c) load for 2016.
Figure 4.
(a) Rainfall-induced tile drainage, total phosphorus influent and effluent (b) EMC, and (c) load for 2016.

Figure 5.
Phosphate statistics for n = 31 events in 2015 and 2016 for (a) influent (IN) and effluent (OUT) EMC; (b) influent (IN) and effluent (OUT) load; and (c) load capture (%). Note: %tile = percentile and 95th C.I. = 95% confidence interval.
Figure 5.
Phosphate statistics for n = 31 events in 2015 and 2016 for (a) influent (IN) and effluent (OUT) EMC; (b) influent (IN) and effluent (OUT) load; and (c) load capture (%). Note: %tile = percentile and 95th C.I. = 95% confidence interval.
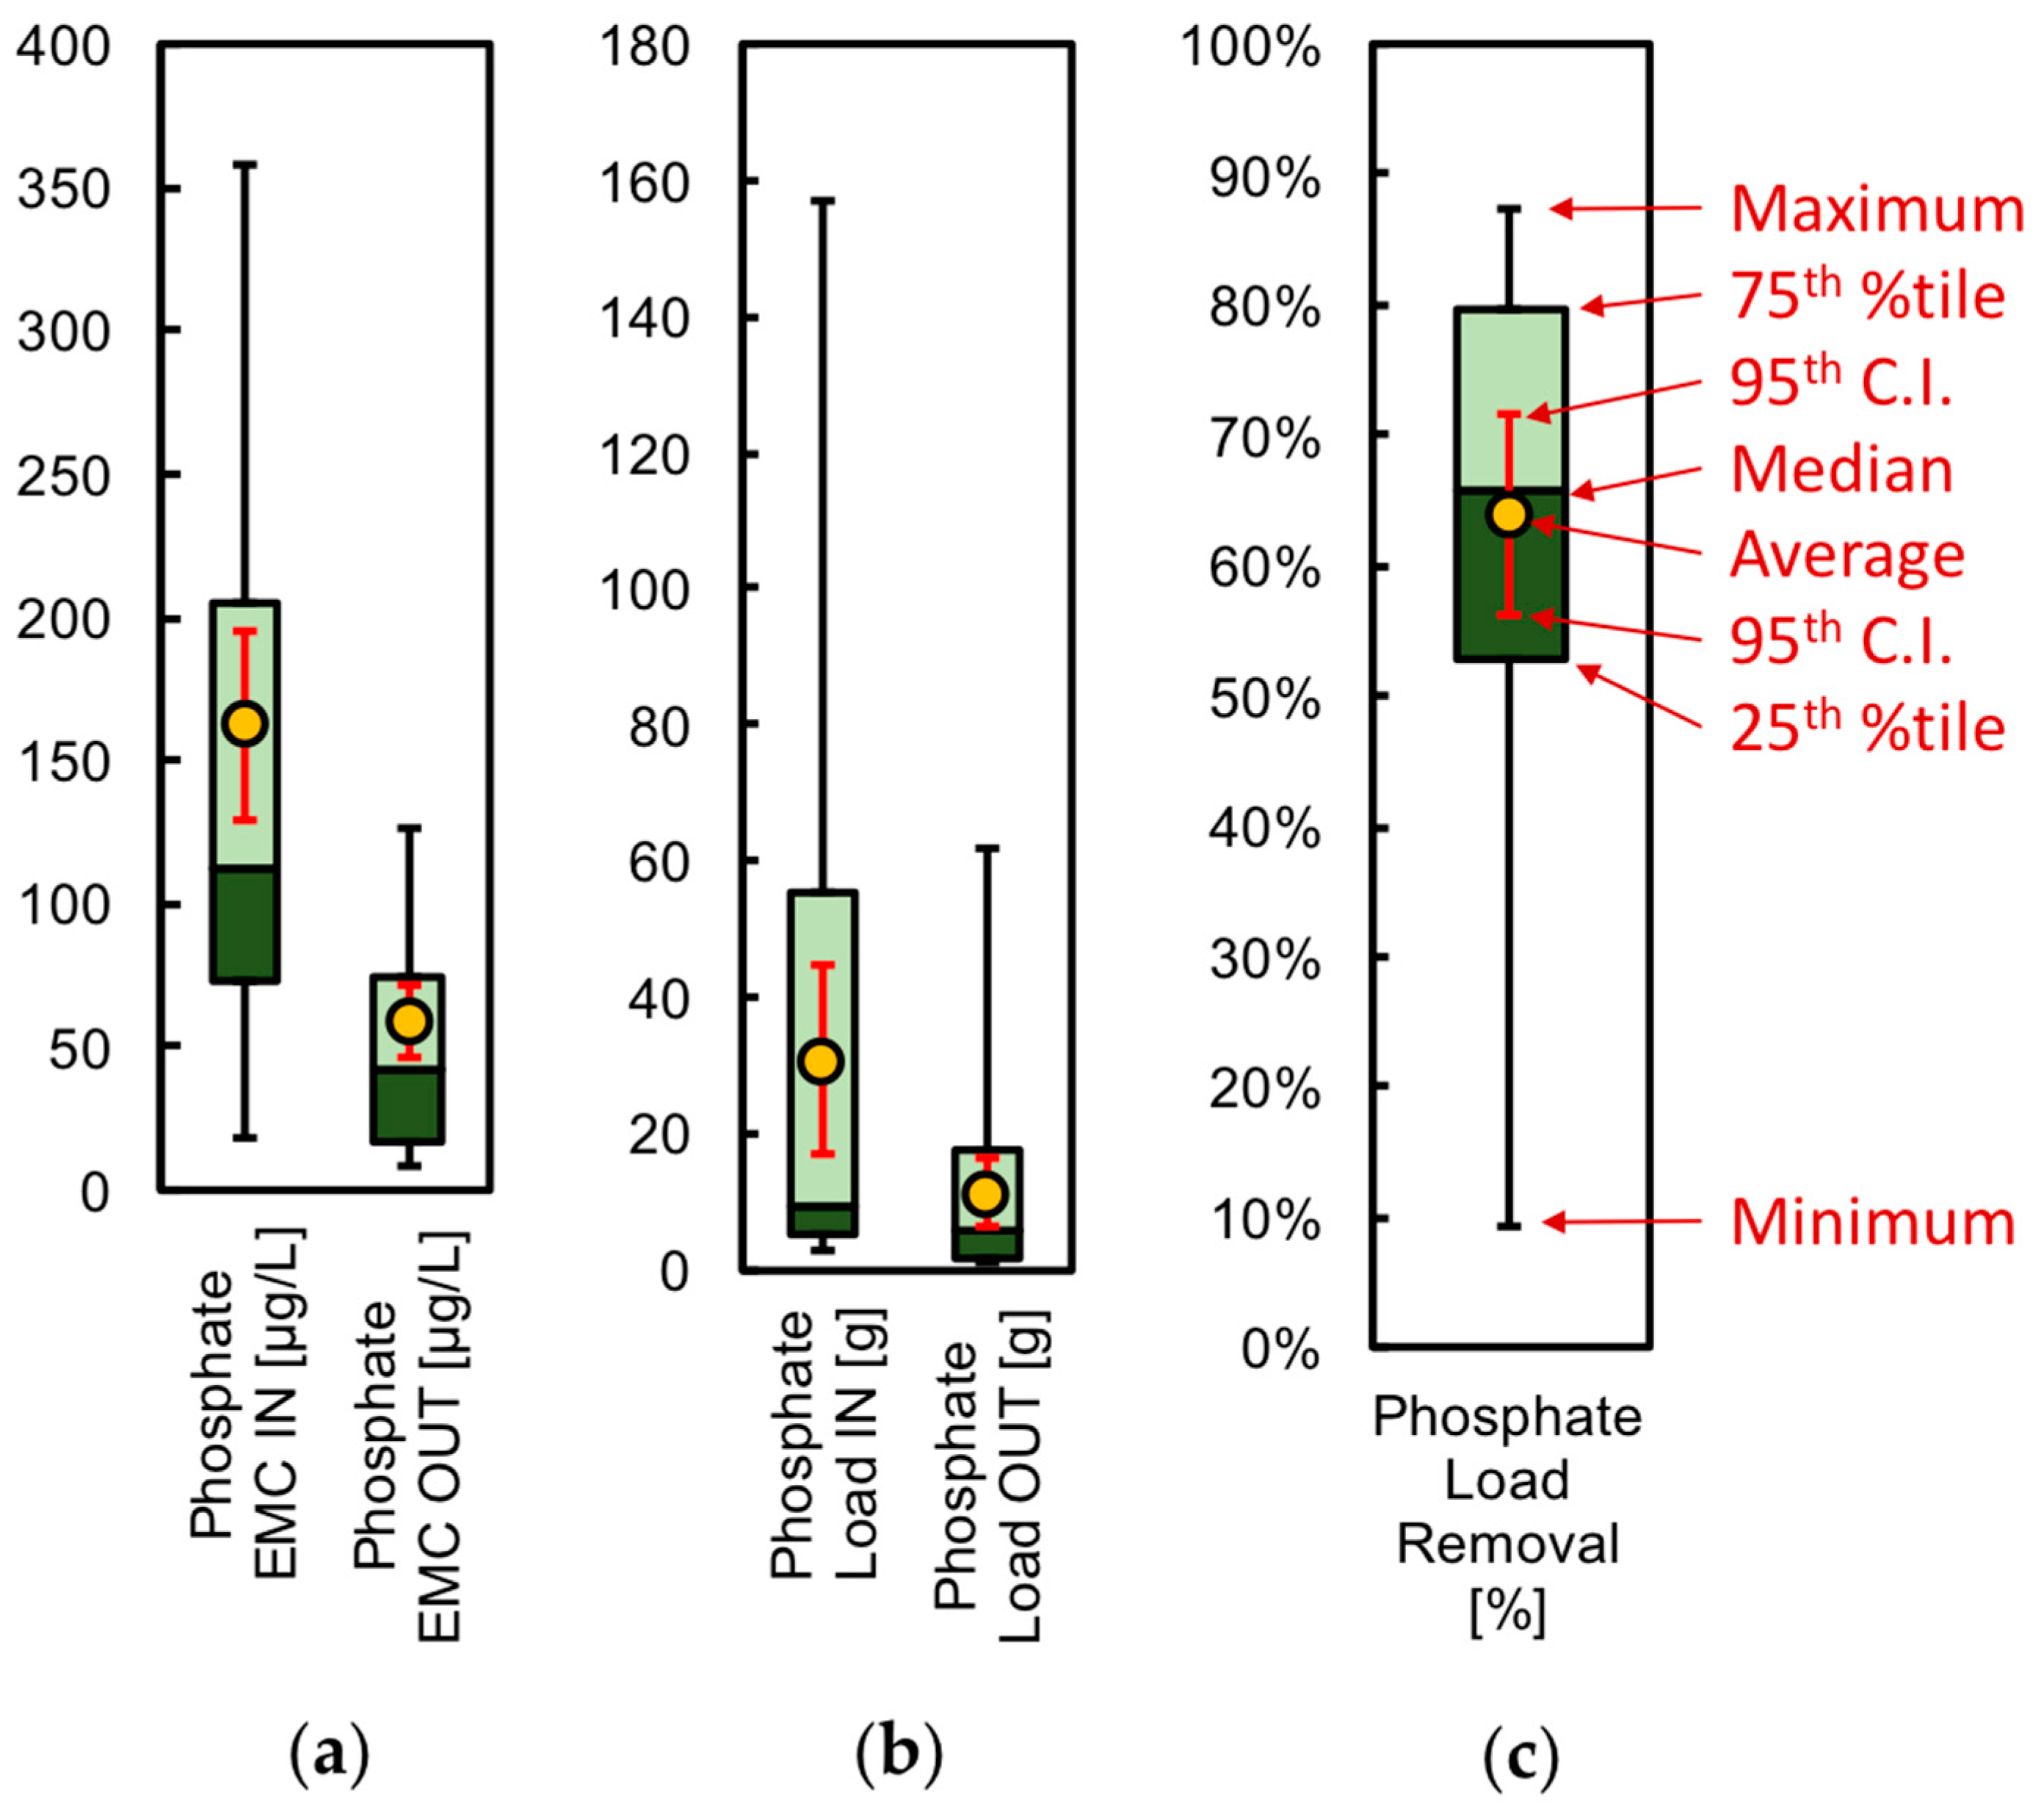
Figure 6.
(a) Rainfall-induced tile drainage, phosphate influent and effluent (b) EMC and (c) load for 2015 and 2016.
Figure 6.
(a) Rainfall-induced tile drainage, phosphate influent and effluent (b) EMC and (c) load for 2015 and 2016.
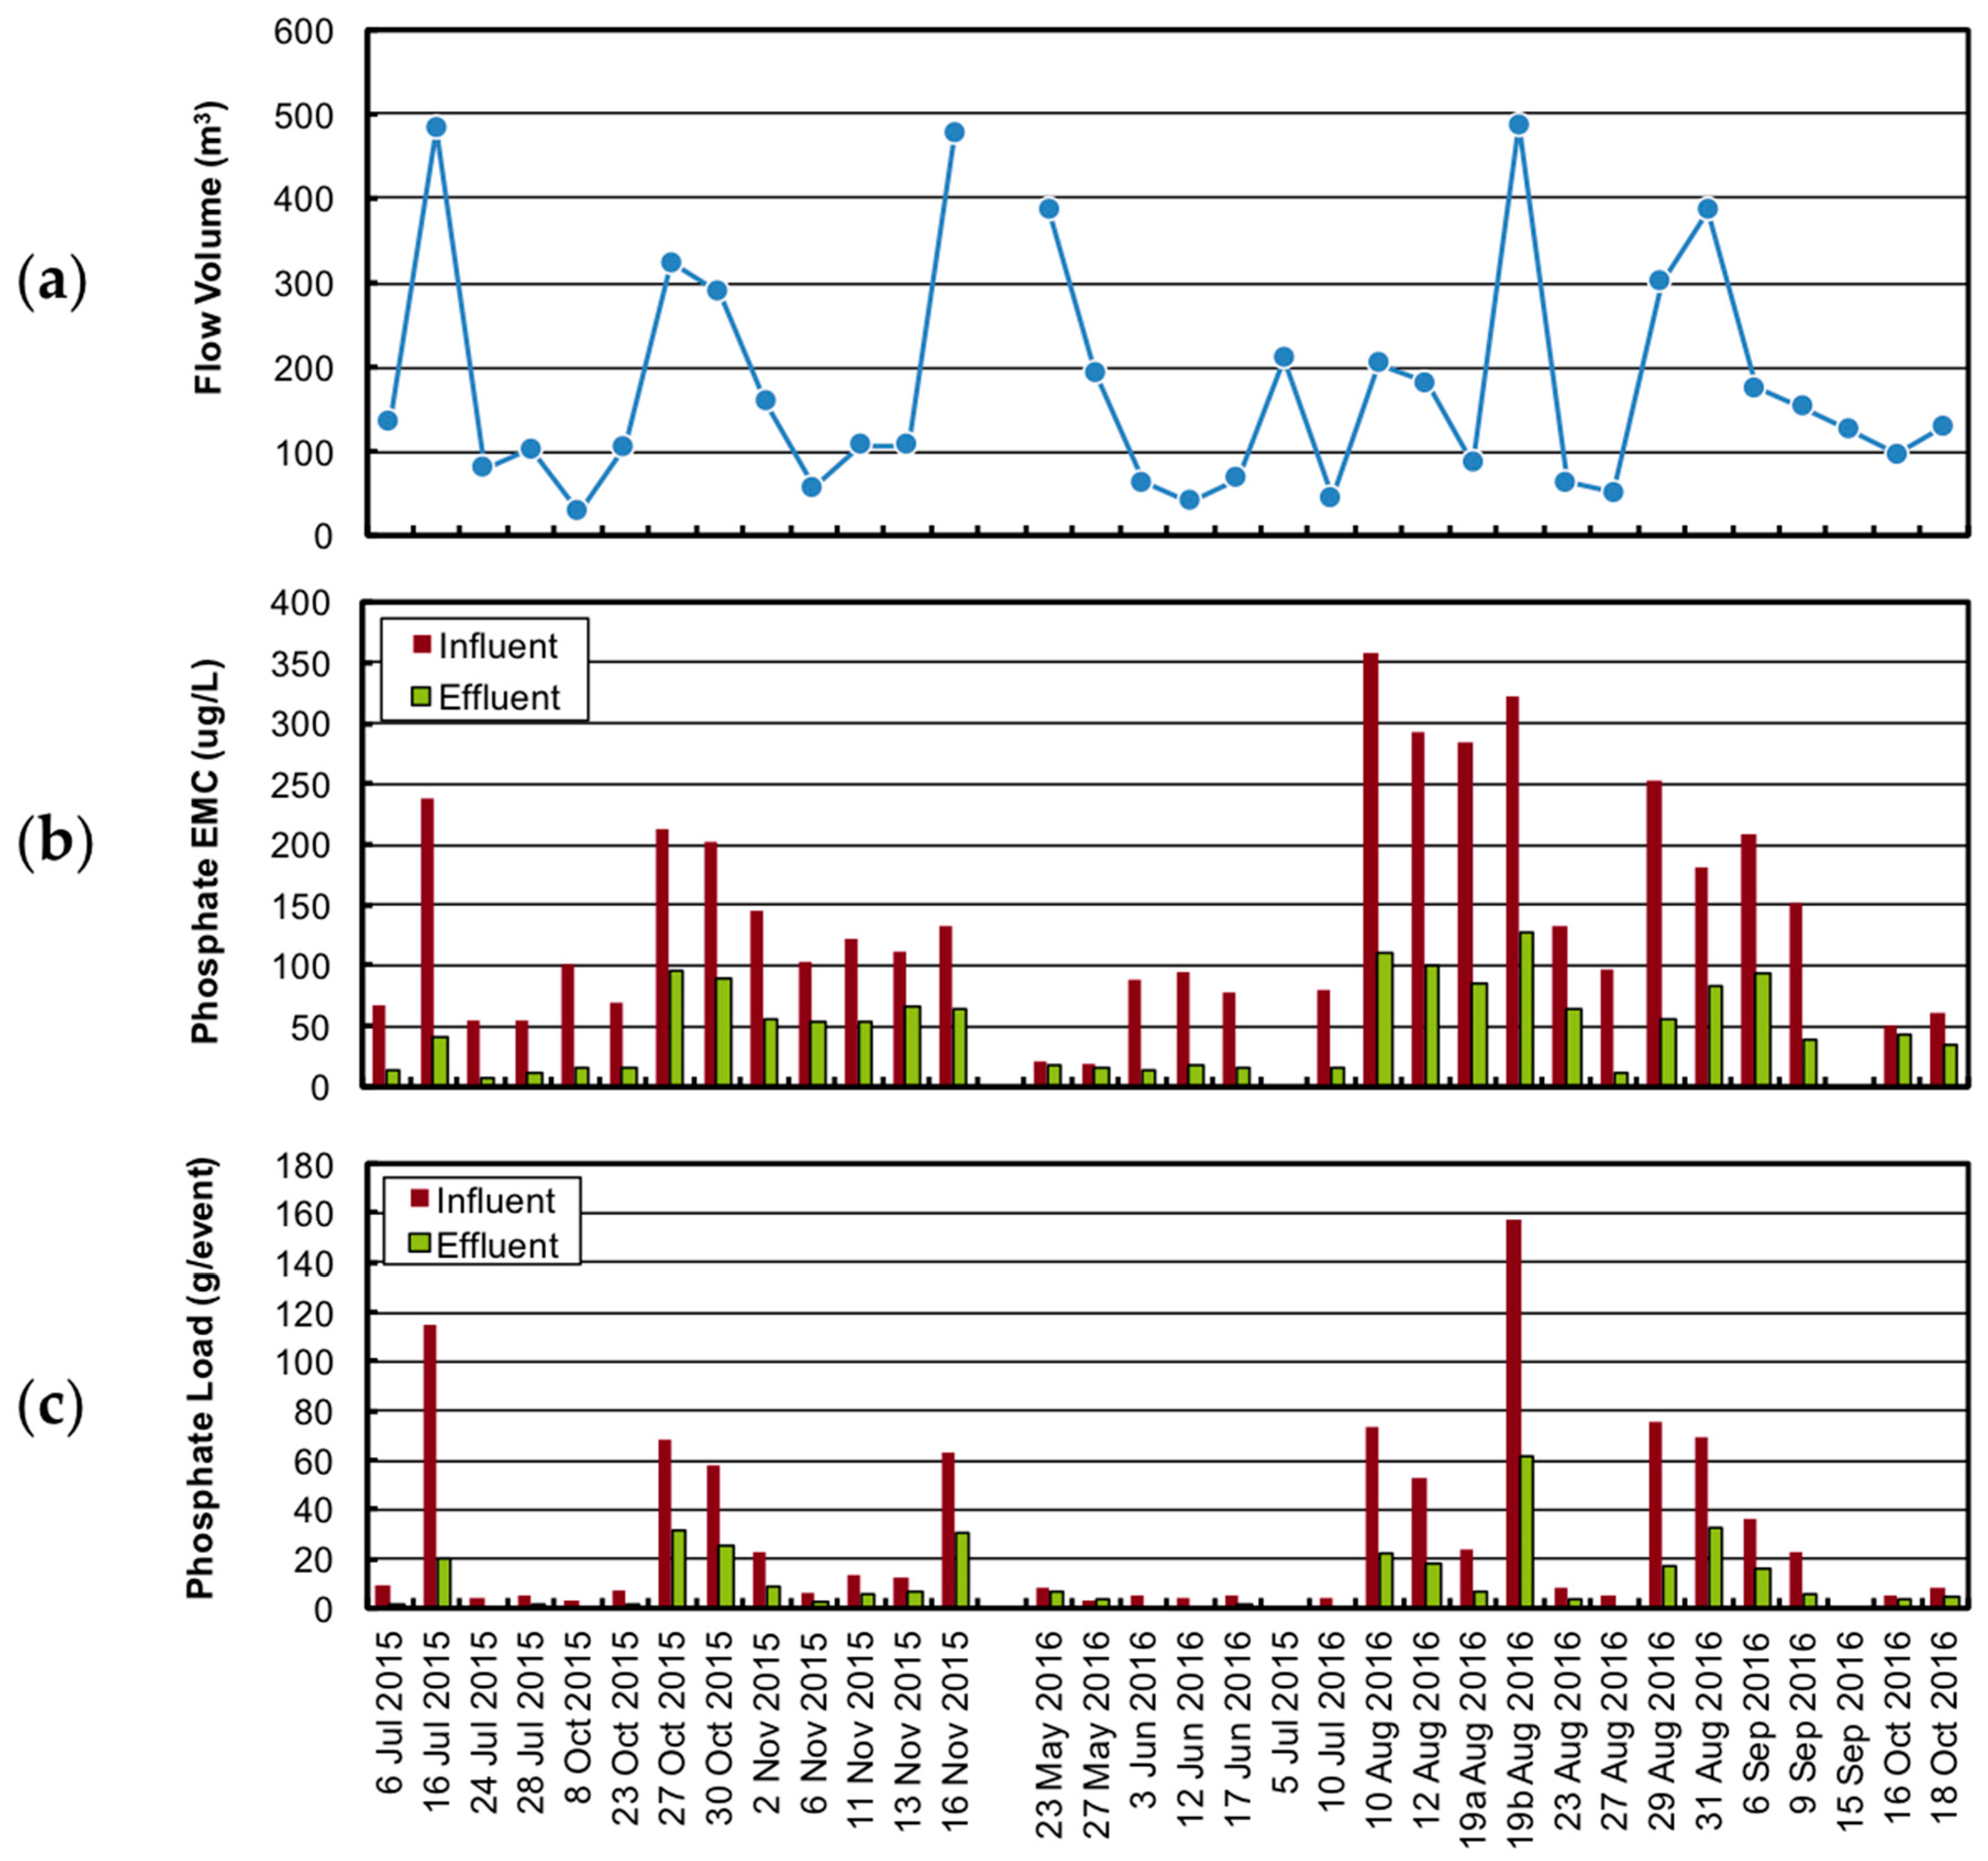
Figure 7.
Soluble phosphorus fraction = phosphate/total concentration of rainfall event sample data for n = 18 influent (IN) and effluent (OUT) events in 2016. Note: %tile = percentile and 95th C.I. = 95% confidence interval.
Figure 7.
Soluble phosphorus fraction = phosphate/total concentration of rainfall event sample data for n = 18 influent (IN) and effluent (OUT) events in 2016. Note: %tile = percentile and 95th C.I. = 95% confidence interval.
© 2017 by the authors. Licensee MDPI, Basel, Switzerland. This article is an open access article distributed under the terms and conditions of the Creative Commons Attribution (CC BY) license (http://creativecommons.org/licenses/by/4.0/).
Share and Cite
MDPI and ACS Style
Erickson, A.J.; Gulliver, J.S.; Weiss, P.T. Phosphate Removal from Agricultural Tile Drainage with Iron Enhanced Sand. Water 2017, 9, 672. https://doi.org/10.3390/w9090672
AMA Style
Erickson AJ, Gulliver JS, Weiss PT. Phosphate Removal from Agricultural Tile Drainage with Iron Enhanced Sand. Water. 2017; 9(9):672. https://doi.org/10.3390/w9090672
Chicago/Turabian StyleErickson, Andrew J., John S. Gulliver, and Peter T. Weiss. 2017. "Phosphate Removal from Agricultural Tile Drainage with Iron Enhanced Sand" Water 9, no. 9: 672. https://doi.org/10.3390/w9090672
Note that from the first issue of 2016, this journal uses article numbers instead of page numbers. See further details here.