1. Introduction
Estimating the total discharge is important to understanding the hydrological cycle and to effectively cope with water-related disasters such as drought and floods [
1]. The total discharge is usually estimated with the aid of hydrological models, which require reliable and continuous hydrometeorological data, such as temperature, humidity, and wind speed, for calibration and validation. Therefore, it is difficult to estimate the discharge in ungauged areas, where observation data are insufficient and sparse. The northern region of the Korean Peninsula is an example: North Korea has become vulnerable to floods and drought due to poor water management based on unreliable and inaccurate data [
2,
3]. The trans-boundary waters, the Imjin River and the North Han River crossing the border between North and South Korea, cannot be properly managed, due to the lack of hydrological data and separate water management schemes [
4].
The Gravity Recovery and Climate Experiment (GRACE) satellite has provided global terrestrial water storage (TWS) information since 2002, which can be quantified for water budget analyses [
5,
6]. In particular, changes in TWS (TWSC) data can be a useful source of information in water resources assessment. Lee et al. [
7] checked the applicability of the GRACE-based TWSC in the Korean Peninsula. Lee et al. [
8] applied a hydrological simulation approach to estimate the TWSC in the Han River Basin in South Korea. They compared the results with the GRACE-based TWSC, and suggested the need for a correction factor in the rainy season. Seo and Lee [
9] estimated the groundwater storage changes in South Korea using GRACE, land surface models (LSMs), and ground observations. Their results showed good correlation with the observed groundwater data. The task of estimating discharge for the entire Korean Peninsula has never previously been attempted.
Many studies have been conducted to estimate the total discharge, including surface and subsurface water, based on water balance using monthly TWSC and other hydrological observations, such as precipitation and evapotranspiration. Syed et al. [
10] estimated the total discharge of the Amazon and Mississippi river basins based on the water balance method, using the GRACE-based TWSC, observed precipitation, and simulated evapotranspiration. The results were compared to streamflow discharge observations, and showed good correlation. The water balance approach to estimate total discharge was applied to the Yangtze River Basin in China [
11], Rufiji Basin in Tanzania [
12], East Africa Rift Valley [
13], Lake Eyre Basin in Australia [
14], and Yellow River Basin in China [
15].
Also, several studies have conducted basin scale terrestrial water balance analysis based on combined satellite data [
16,
17,
18].
In this study, we use the water balance approach to estimate the monthly total discharge for the Korean Peninsula. All hydrological components are obtained from satellites. Three satellite products are used: the Tropical Rainfall Measuring Mission (TRMM) satellite precipitation data, Moderate resolution Imaging Spectroradiometer (MODIS) products for evapotranspiration, and GRACE-based TWSC.
2. Study Area
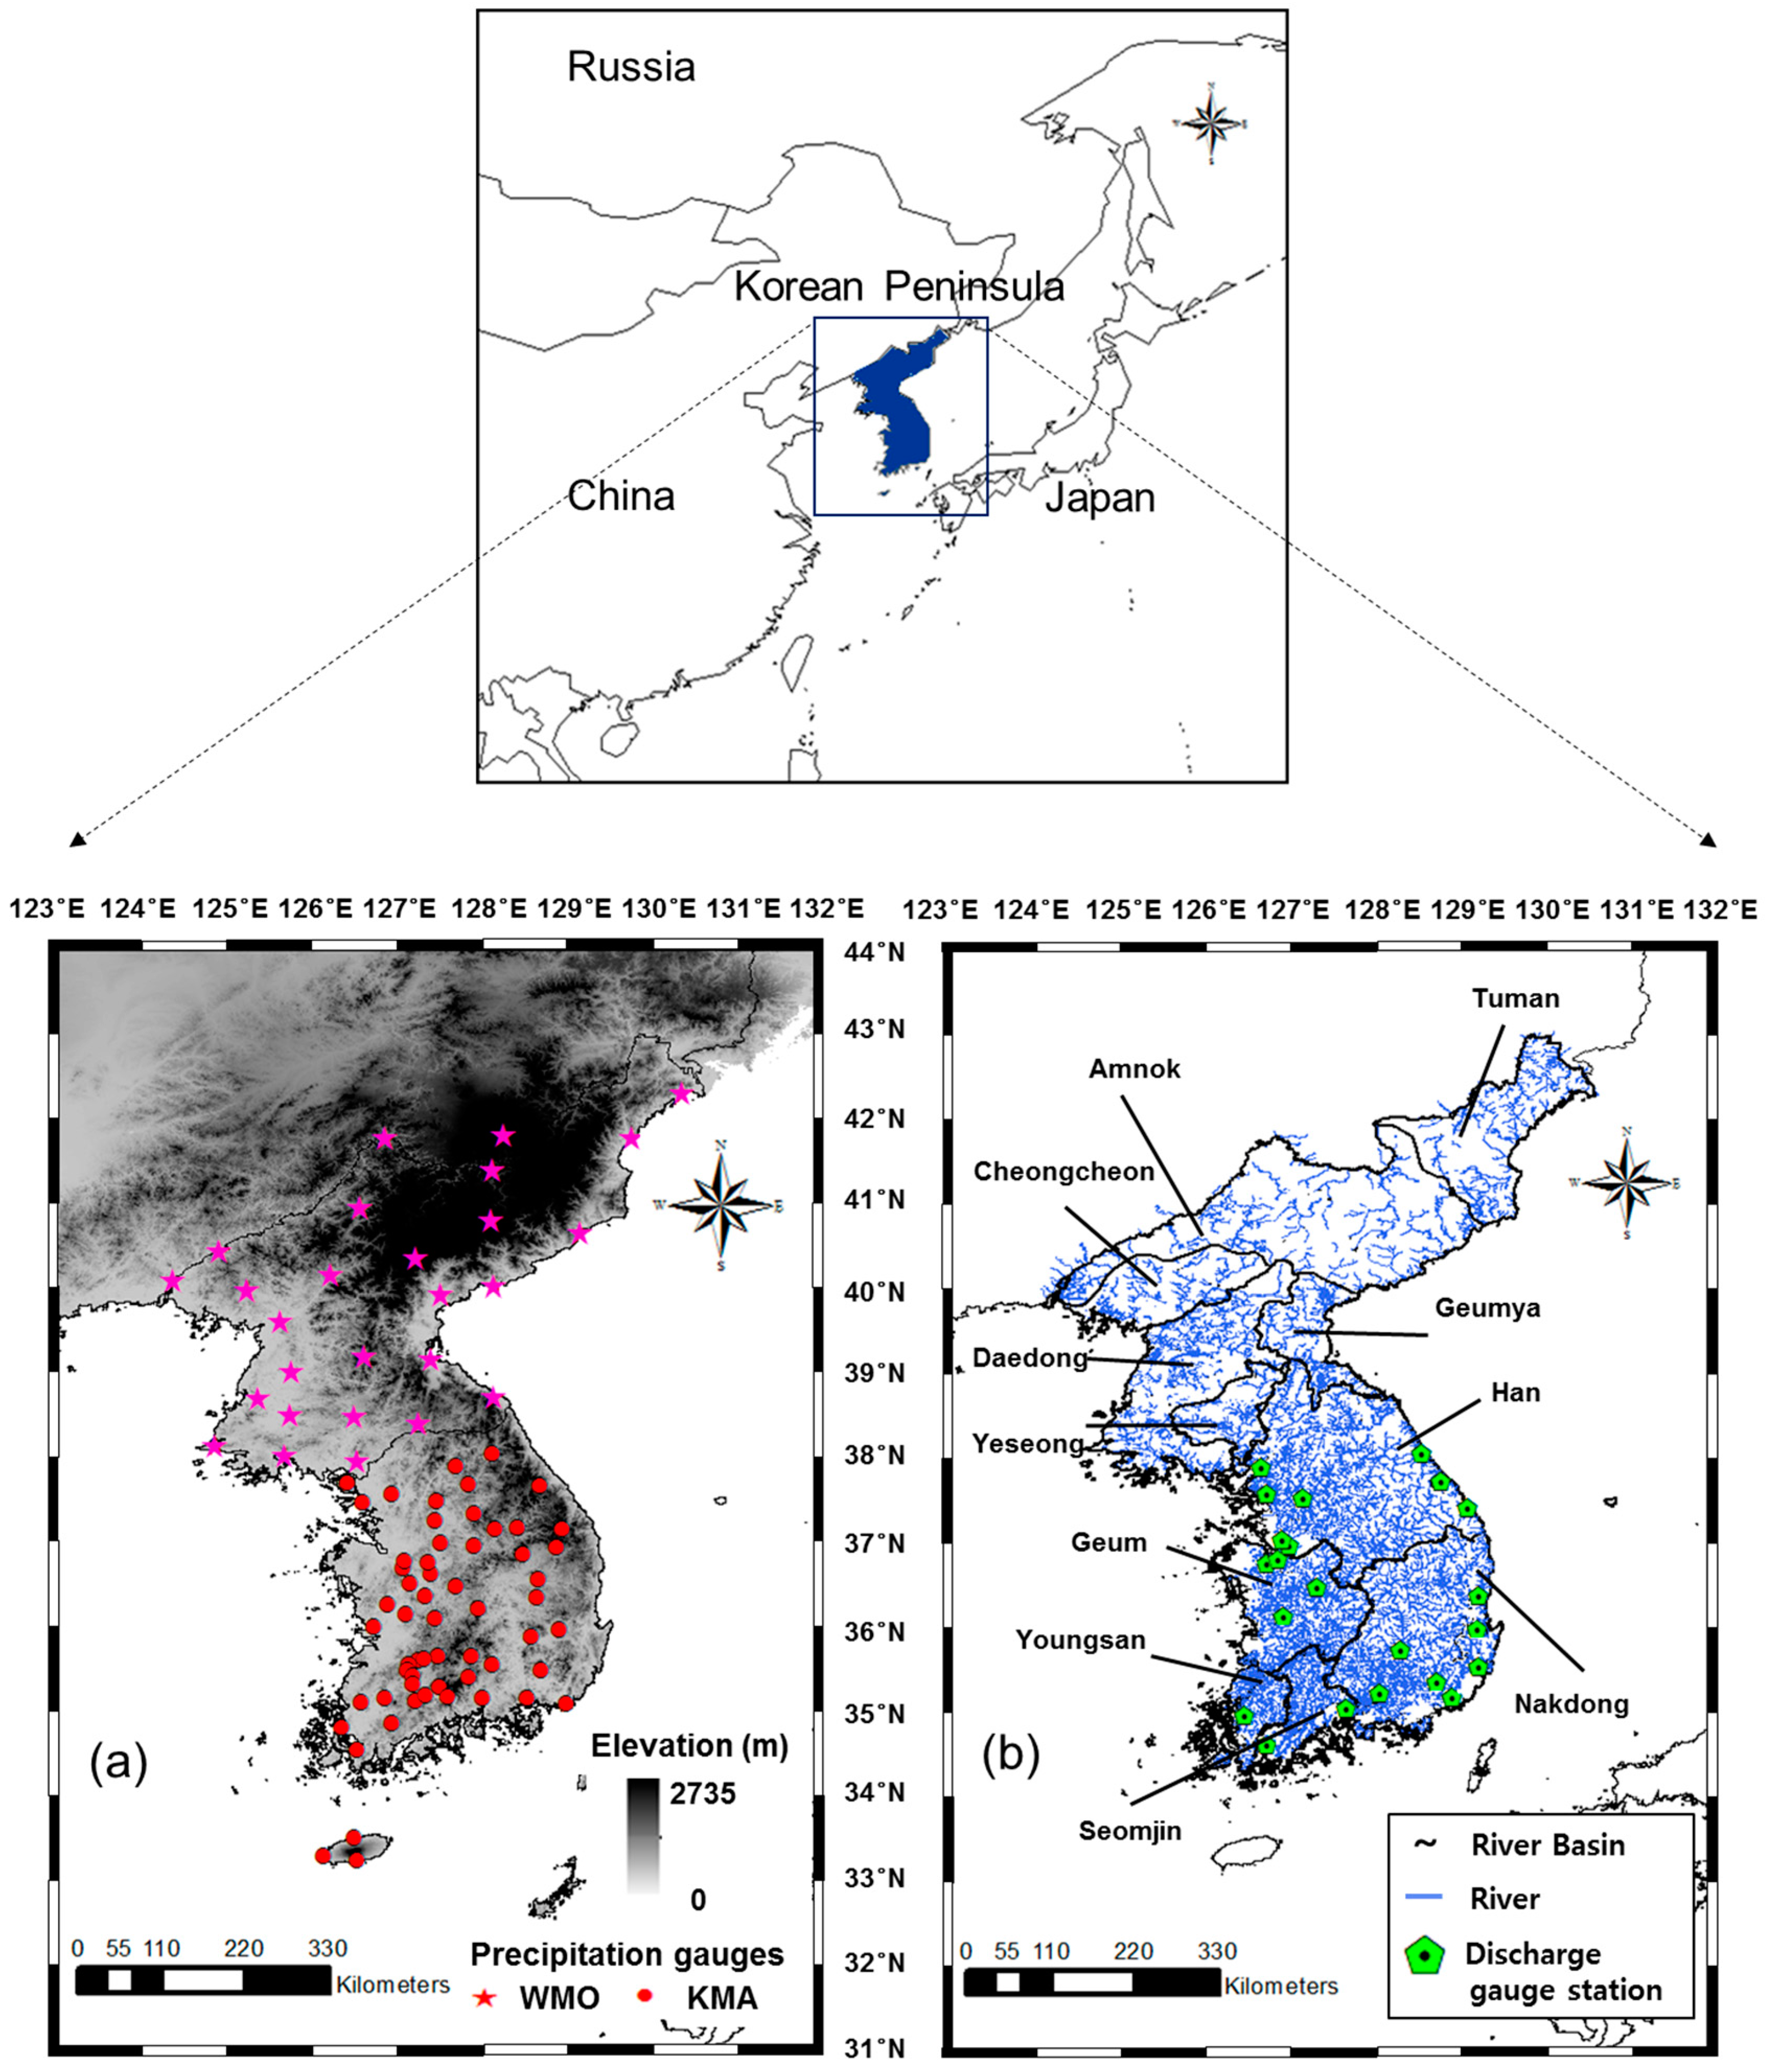
The Korean Peninsula (124° E–131° E, 33° N–42° N) is known for its mountainous terrain, with high plateaus in the northern and eastern regions, while low hills prevail in the south-western regions (
Figure 1a). The river distribution in the Korean Peninsula is dense (0.2–0.5 km/km
2;
Figure 1b), having relatively short reaches and steep channel slopes (
Table 1). There are six major river basins (79,439.10 km
2) in North Korea, and five major river basins (68,207.24 km
2) in South Korea. The Tuman and Amnok rivers are transboundary between North Korea and China, while the Han River is transboundary between North and South Korea.
The peninsula belongs to the monsoon climate zone with the precipitation of the summer season accounting for about 60% of the annual precipitation. In the summer season, flash floods occur frequently, and because of topographic and climate characteristics, peak flood discharges are enormous. The annual mean precipitation is approximately 1300 mm in South Korea, and approximately 900 mm in North Korea (KMA,
http://web.kma.go.kr/eng/index.jsp).
The only available hydrological data for North Korea is the precipitation data at 27 stations (
Figure 1a) provided by the World Meteorological Organization (WMO). As can be seen in the figure, the North Korea’s precipitation stations are sparse compared to the Korea Meteorological Administration (KMA) weather stations of South Korea (
Figure 1a). Furthermore, data from the North Korean stations is frequently incomplete and less reliable, due to poor maintenance and the deterioration of facilities. Evapotranspiration data is not available in North Korea. In South Korea, in situ evapotranspiration from some flux towers is measured, but the data so far is insufficient and unreliable [
19]. North Korea’s discharge data is not available at all. In South Korea, there are 723 discharge gauge stations for measuring discharge. The daily discharge data was provided by the Ministry of Land, Infrastructure and Transport of the South Korean government, and
Figure 1b shows the discharge gauging stations at the outlets of five major river basins (Han, Nakdong, Guem, Seomjin, and Youngsan Rivers).
3. Methodology and Datasets
3.1. Methodology
Equation (1) expresses the total discharge estimates using the water balance equation in continental scales [
15,
20].
where,
is the total discharge (mm/month), which includes surface and subsurface water [
10], or the net surface and subsurface water outflow [
15],
is the surface water outflow,
is the subsurface water outflow,
is the surface water inflow,
is the subsurface water inflow,
is the precipitation (mm/month),
is the actual evapotranspiration (mm/month), and
is the TWSC (mm/month).
Products from GRACE, MODIS, and TRMM were integrated to compute the monthly total discharge for the period between 2002 and 2014 in the Korean Peninsula (
Table 2). For comparison of the results, we used Global Land Data Assimilation System (GLDAS) products. For discharge results in South Korea, we used the sum of the total discharge data of five river basins based on the Precipitation-Runoff Modeling System (PRMS) and discharge gauging station data (
Figure 1b).
Table 2 shows the characteristics of the data used in this study.
3.2. Satellite Data
3.2.1. GRACE
The GRACE mission is a joint project between the National Aeronautics and Space Administration (NASA) and the German Aerospace Center (DLR), with the object of observations of Earth’s gravity changes. GRACE Level-2 RL05 [
21] (
http://grace.jpl.nasa.gov) provides gravity anomaly data that can be used to infer the water storage changes on Earth via three institutes, Centre for Space Research (CSR), Jet Propulsion Laboratory (JPL), and German Research Centre for Geosciences (GFZ). Each time-variable gravity field is truncated up to 60 degrees and orders in terms of spherical harmonic coefficients. Gaussian filtering (300 km) and the C
20 coefficient from Satellite Laser Ranging (SLR) are applied to reduce noise [
22,
23]. The GRACE RL05 gravity anomaly can be recovered based on surface mass changes in terms of equivalent water thickness, and it may be expressed as the terrestrial water storage anomaly (TWSA; Equation (2)). The GRACE gridded TWSA products need to be multiplied by scale factors derived from the Community Land Model (CLM) v4.0 to restore the signal amplitude [
24]. Then, the TWSC of the
ith month is computed using the central difference method (Equation (3)) [
25], and applied to the water balance equation (Equation (1)).
3.2.2. MODIS
The MODIS sensor was launched by NASA for the Earth Observing System with Terra (land) and Aqua (ocean) satellites. The MOD16 product [
26] (
http://www.ntsg.umt.edu/project/mod16) is estimated from MODIS products and the Global Meteorological Assimilation Office (GMAO) climate data, based on the Penman-Monteith equation [
26]. The MOD16 product provides the global Evapotranspiration (ET), potential ET (PET), latent heat flux (LE), and potential LE (PLE) at 1 km spatial resolution. The MOD16 ET data were validated at 17 flux tower locations in Asia including the Korean Peninsula, and in previous studies has shown reasonable accuracy [
27,
28].
3.2.3. TRMM
TRMM is a joint mission between NASA and the Japan Aerospace Exploration Agency (JAXA), and was designed to monitor precipitation in tropical regions. The TRMM satellite produces several precipitation products, such as TRMM Multi-satellite Precipitation Analysis (TMPA). TMPA3B43V7 (
http://trmm.gsfc.nasa.gov) monthly precipitation data is estimated by merging the multi-satellite (SSMI, SSMIS, MHS, AMSU-B, and AMSR E) precipitation data and global rain gauge data (Global Precipitation Climatology Project; GPCP) produced by National Oceanic and Atmospheric Administration (NOAA)’s Climate Prediction Center and Global Precipitation Climatology Center (GPCC) [
29]. TMPA3B43V7 monthly precipitation data for the Korean Peninsula has been validated in previous research [
30,
31]. Kim et al. [
32] assessed precipitation data from satellites for Korea; TMPA, GSMaP, and CMORPH (CRC MORPHing technique). The TMPA data was closer to the ground-gauged precipitation than those of GSMaP and CMORPH in space and time.
3.3. Reference Data
3.3.1. GLDAS
The GLDAS ingests surface fluxes and energy through the common land model (CLM), the Mosaic, the Noah, and the variable infiltration capacity (VIC) models [
33]. The GLDAS provides LSMs outputs, which were calculated by forcing the multi-satellite data and ground-based measurements. LSM’s version is CLM2.0, Mosaic1, Noah2.7, and VIC4.0.4. Detailed information on the GLDAS forcing data and model description are available at
http://ldas.gsfc.nasa.gov/gldas. In this study, monthly GLDAS CLM, Mosaic, Noah and VIC LSMs data at the spatial resolution of 1.0° were used to match with GRACE spatial resolution. We obtained monthly evapotranspiration, and surface and subsurface water discharge data from January 2003 to December 2014.
Table 3 shows the GLDAS v1 products description.
3.3.2. PRMS and in situ Discharge in South Korea
The South Korea government’s Water Resources Management Information System (WAMIS;
http://wamis.go.kr/) provides long-term discharge data from 1966 to 2014 over South Korea. The total discharge data, including surface and subsurface information, was an accomplishment of the national watershed research project in South Korea, and was calculated using the Precipitation-Runoff Modeling System (PRMS) developed by the U.S. Geological Survey [
34]. The PRMS simulates the total discharge of the watershed based on the water balances of each hydrologic response unit. The PRMS model has been used for estimating discharge researches in several regions around South Korea [
35,
36]. Bae et al. [
36] assessed the spatial and temporal variabilities of precipitation observations and total discharge from PRMS models for 139 basins in South Korea. Yoon and Lee [
37] analyzed the hydrological variability using PRMS-based total discharge data from WAMIS.
Also, we obtained long-term discharge data from WAMIS, and in situ discharge data at 22 outlet stations (
Figure 1b) of watersheds from the Ministry of Land, Infrastructures, and Transport of the South Korea government.
3.4. Decomposition of Time Series
To characterize the seasonal variability of hydrological components from satellites, models, and ground observation, hydrological components were decomposed into trends, annual and semi-annual amplitudes (seasonal term) and residual term using linear harmonic (sines and cosines) regression models (Equation (4)). Such an approach has been applied in various studies for the analysis of seasonal and inter-annual variations in hydrological components (e.g., precipitation [
38], groundwater [
39], NDVI [
40]). Each time series of hydrological components can be best fitted to a sine wave having an annual and semi-annual cycle.
where
is a series of each hydrological component at time
,
is the trend,
is the number of harmonics (
= 1 is for the annual variation and
= 2 is for the semi-annual variation),
is the amplitude,
is the phase,
is frequency, and
is the residual term.
3.5. Principal Component Analysis (PCA)
To analyze the relationship between the estimated discharge and precipitation, Principal Component Analysis (PCA) was performed. PCA, also called the Empirical Orthogonal Function (EOF) method, can be used to identify the spatio-temporal variability in geophysical and meteorological data [
41], and to analyze relationships within a set of variables.
Firstly, the TMPA3B43V7 precipitation or satellite-based discharge anomaly (
) is calculated by removing the time average from each data at times
(
months) and grid points
(
).
Table 4 shows the number of grid points (
) at 1.0° and time period (
) for TMPA3B43 precipitation and satellite-based discharge. These anomaly data can be arranged in a
matrix
(Equation (5)). Each column in
shows a time series for a given grid point
, while each row represents spatial data at time
.
can be represented as a linear combination of the principal components (PC;
) and empirical orthogonal function (EOF; (
) as Equation (6). EOF is the major factors of the temporal variations of Z, and PC is the principal components of the amplitude of each EOF varying with time. More detailed information about the EOF method can be found in Refs. [
42,
43].
where,
is the transpose matrix of
.
3.6. Satistical Analysis
To evaluate the performance of the estimated discharge, the satellite-based discharge was compared with the model-based discharge (CLM, Mosaic, Noah, VIC, and PRMS) and with in situ discharge data of South Korea. Four statistical indicators-bias (Equation (7)), correlation coefficient (
r; Equation (8)), root mean square error (RMSE; Equation (9)), and Nash-Sutcliffe efficiency (NSE; Equation (10)) were used.
where
is the satellite-based discharge,
is the model-based discharge output or in situ discharge,
i is the time step,
N is the total number of time steps,
is the average of satellite-based discharge, and
is the average of model-based discharge output or in situ discharge.
4. Results and Discussions
4.1. Evaluation of Hydrological Components
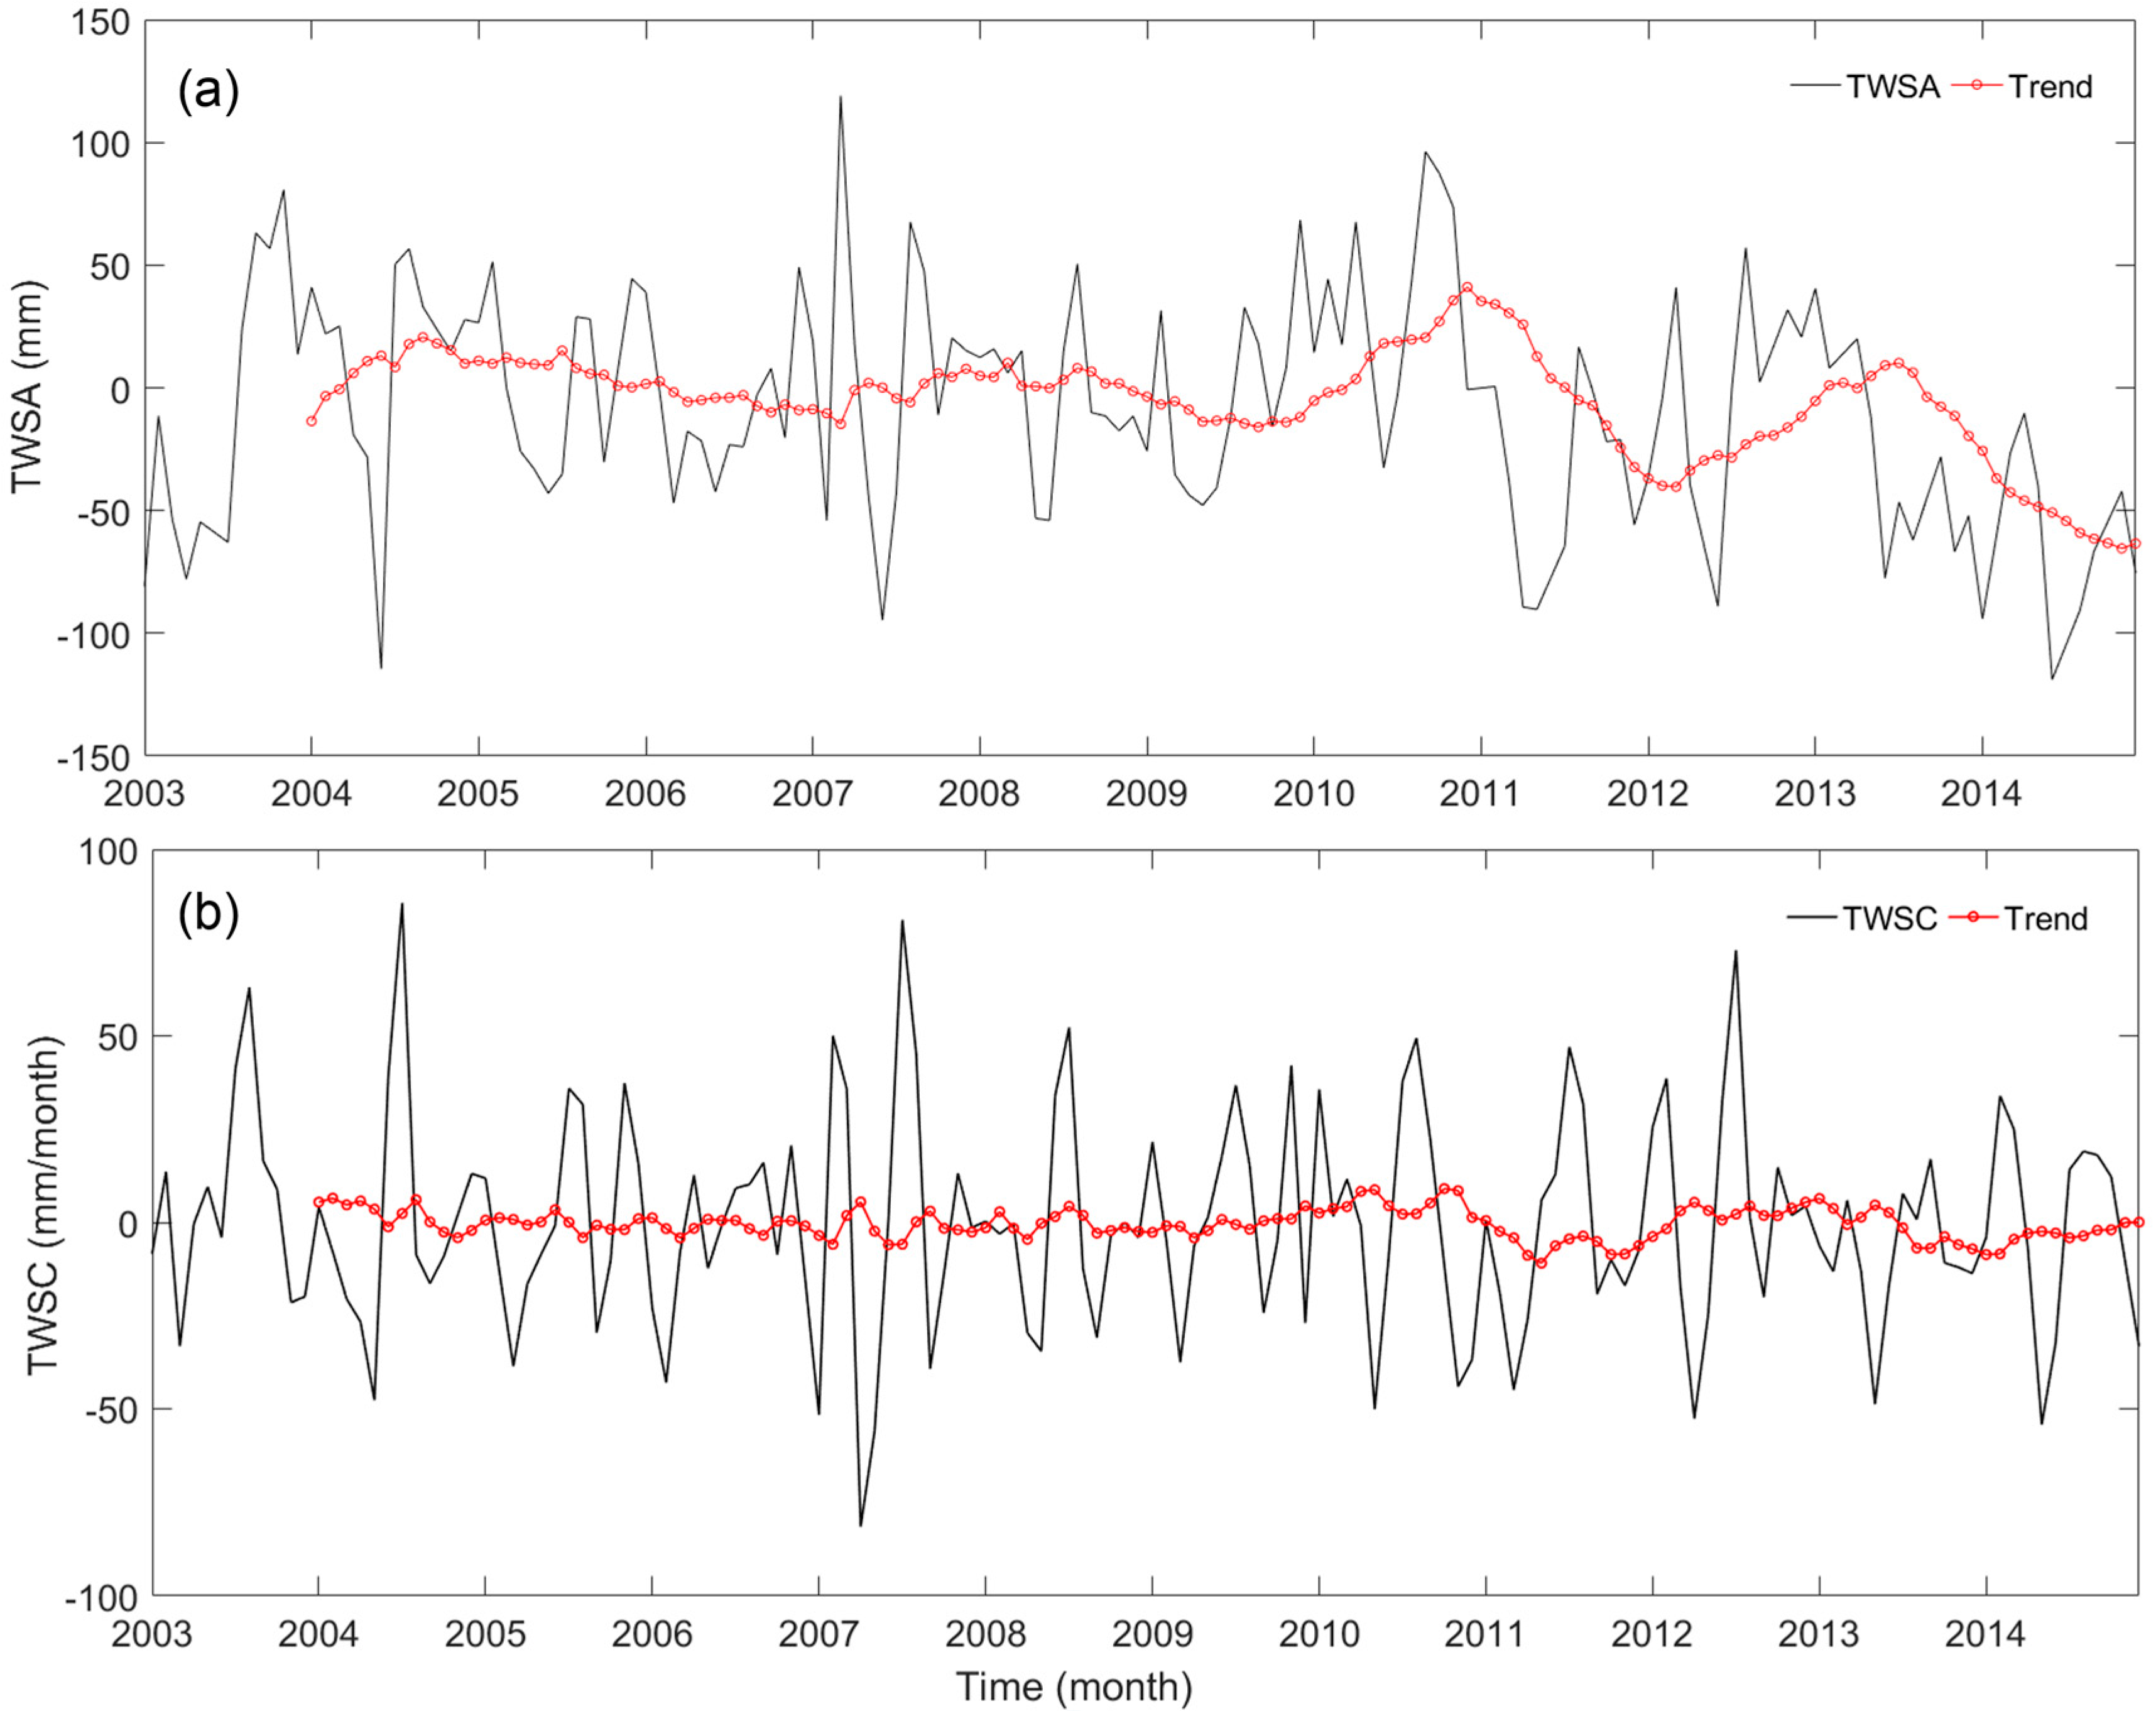
Figure 2a,b shows the GRACE-based TWSA and TWSC with trends during the study period. The GRACE-based TWSA of the Korean Peninsula sharply declined by 81.4 mm during late 2010 and early 2012, and by 74.6 mm between the summer of 2013 and the winter of 2014 (see the trends in
Figure 2a). As for the monthly GRACE-based TWSC, the response to heavy precipitation in the summer (June to September) can be found in a distinct pattern (
Figure 2b).
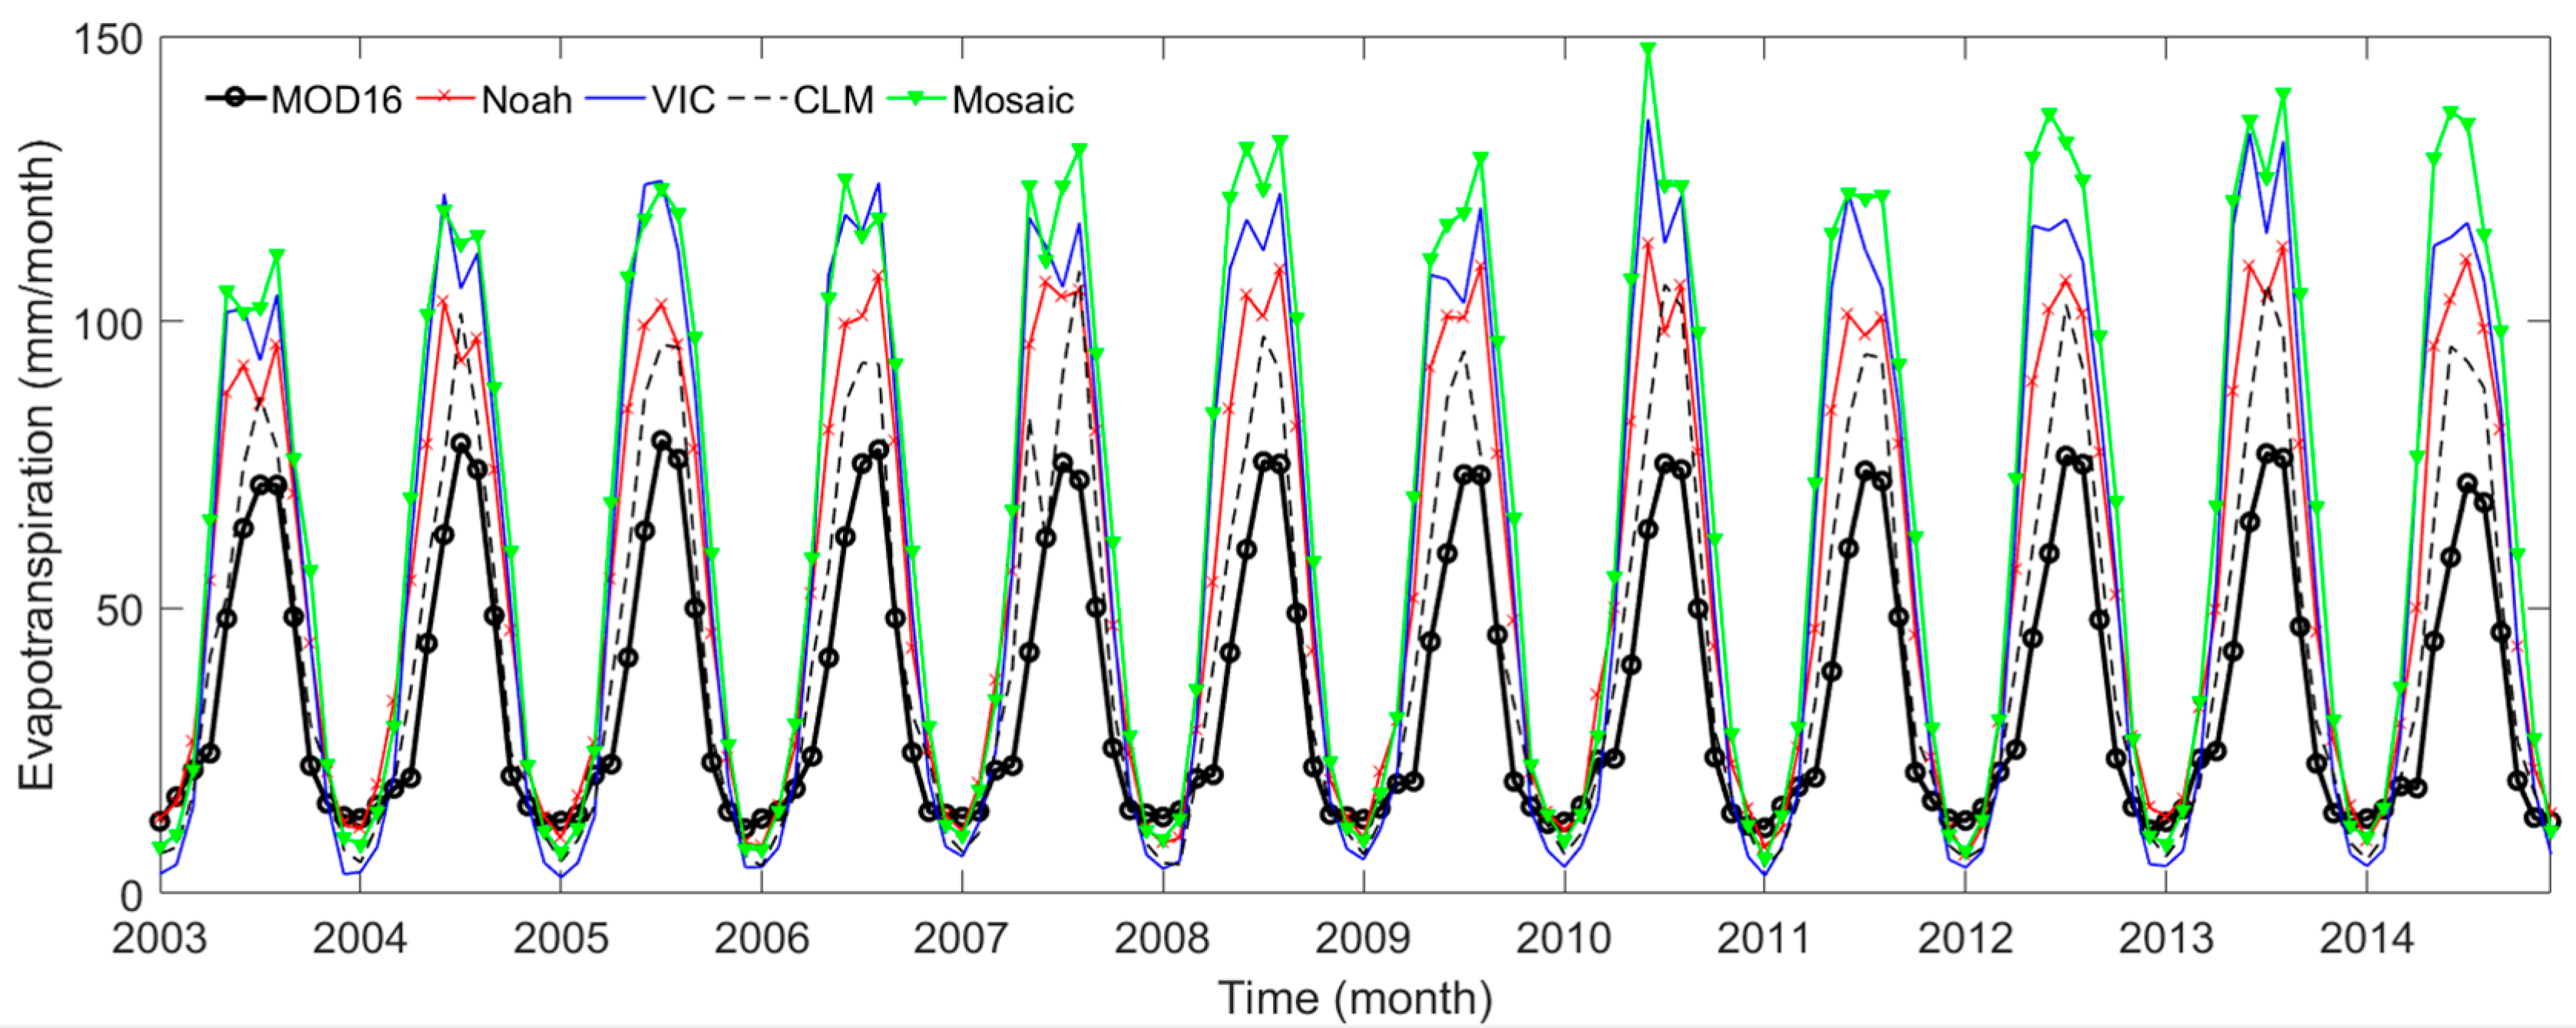
For evapotranspiration, we resampled the MOD16 product to match the GRACE data at 1.0° spatial resolution using the area-weighted average method. In this study, GLDAS 1.0° products of version 1 were used and we extracted the monthly evapotranspiration from the CLM, Mosaic, Noah, and VIC outputs. The MOD16-derived ET was compared with the GLDAS LSMs products. Their seasonal behavior turned out to be similar to each other; however, there is a discrepancy among the five products, especially in summer (
Figure 3). The CLM has the highest correlation with MOD16 (
r = 0.97), followed by Noah (
r = 0.94), VIC (
r = 0.92), and Mosaic (
r = 0.91).
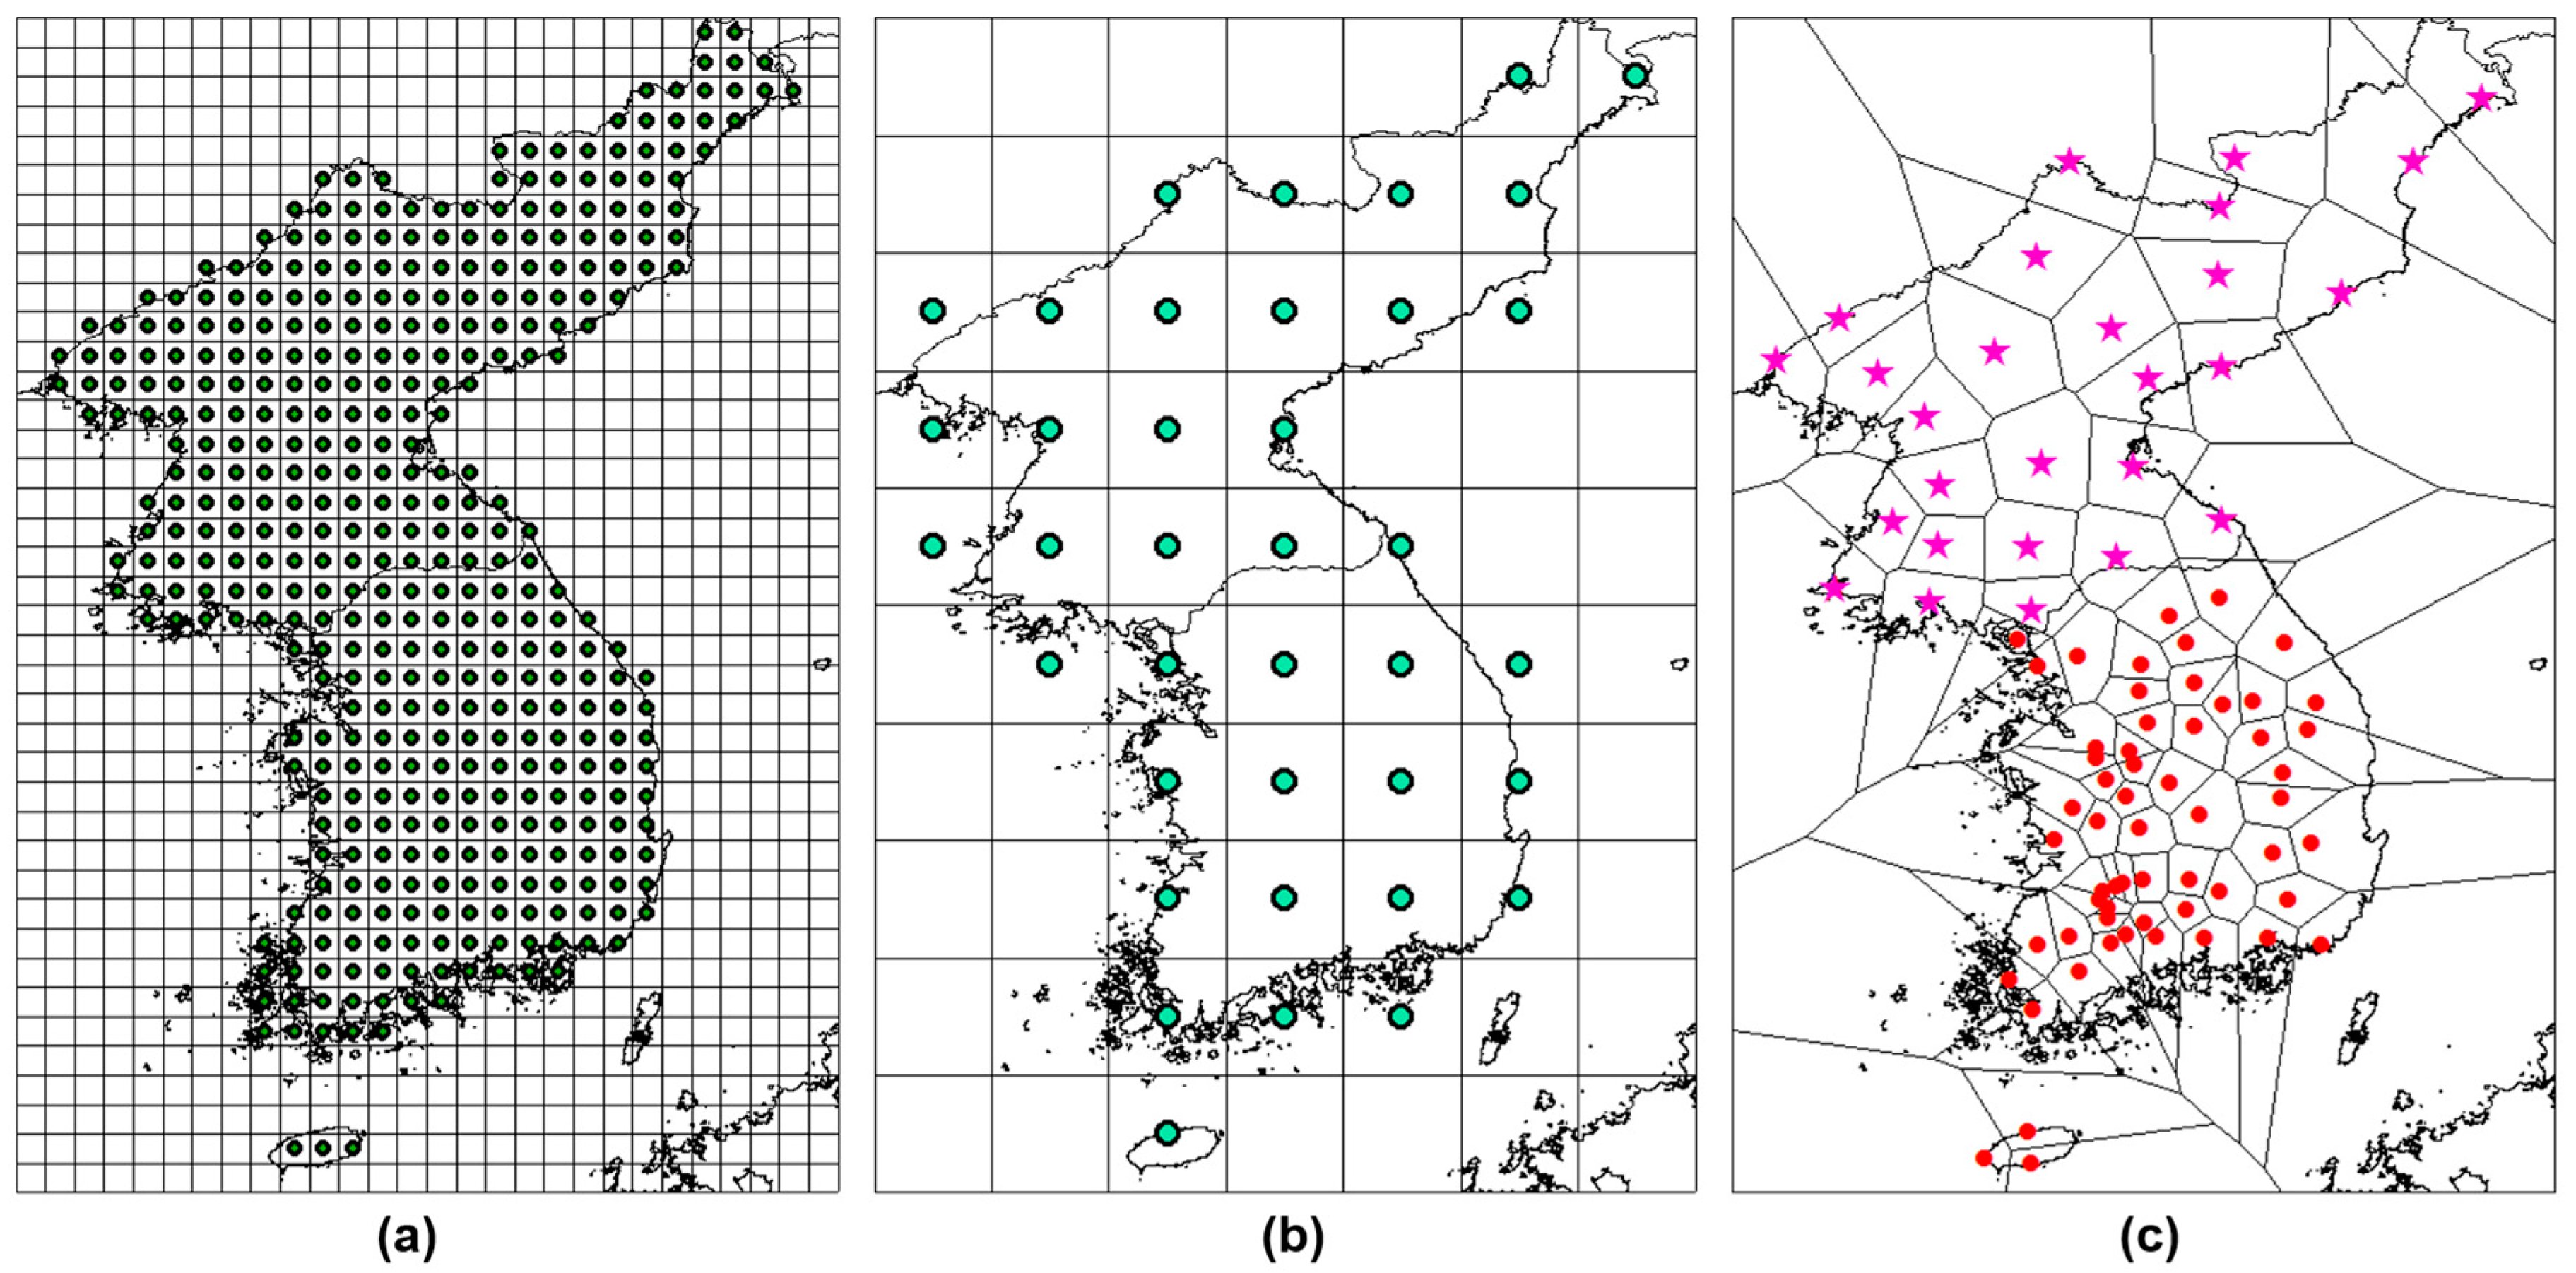
As we did for the evapotranspiration, we resampled TMPA3B43V7 to match the GRACE data at 1.0° spatial resolution using the weighted average method based on relative-gauge weight (
Figure 4a,b). The precipitation from resampled TMPA3B43V7 data was compared with the ground observation data. The average precipitation was calculated by the Thiessen Polygon method for the 59 South Korean gauge stations and the 27 stations in North Korea (
Figure 4c).
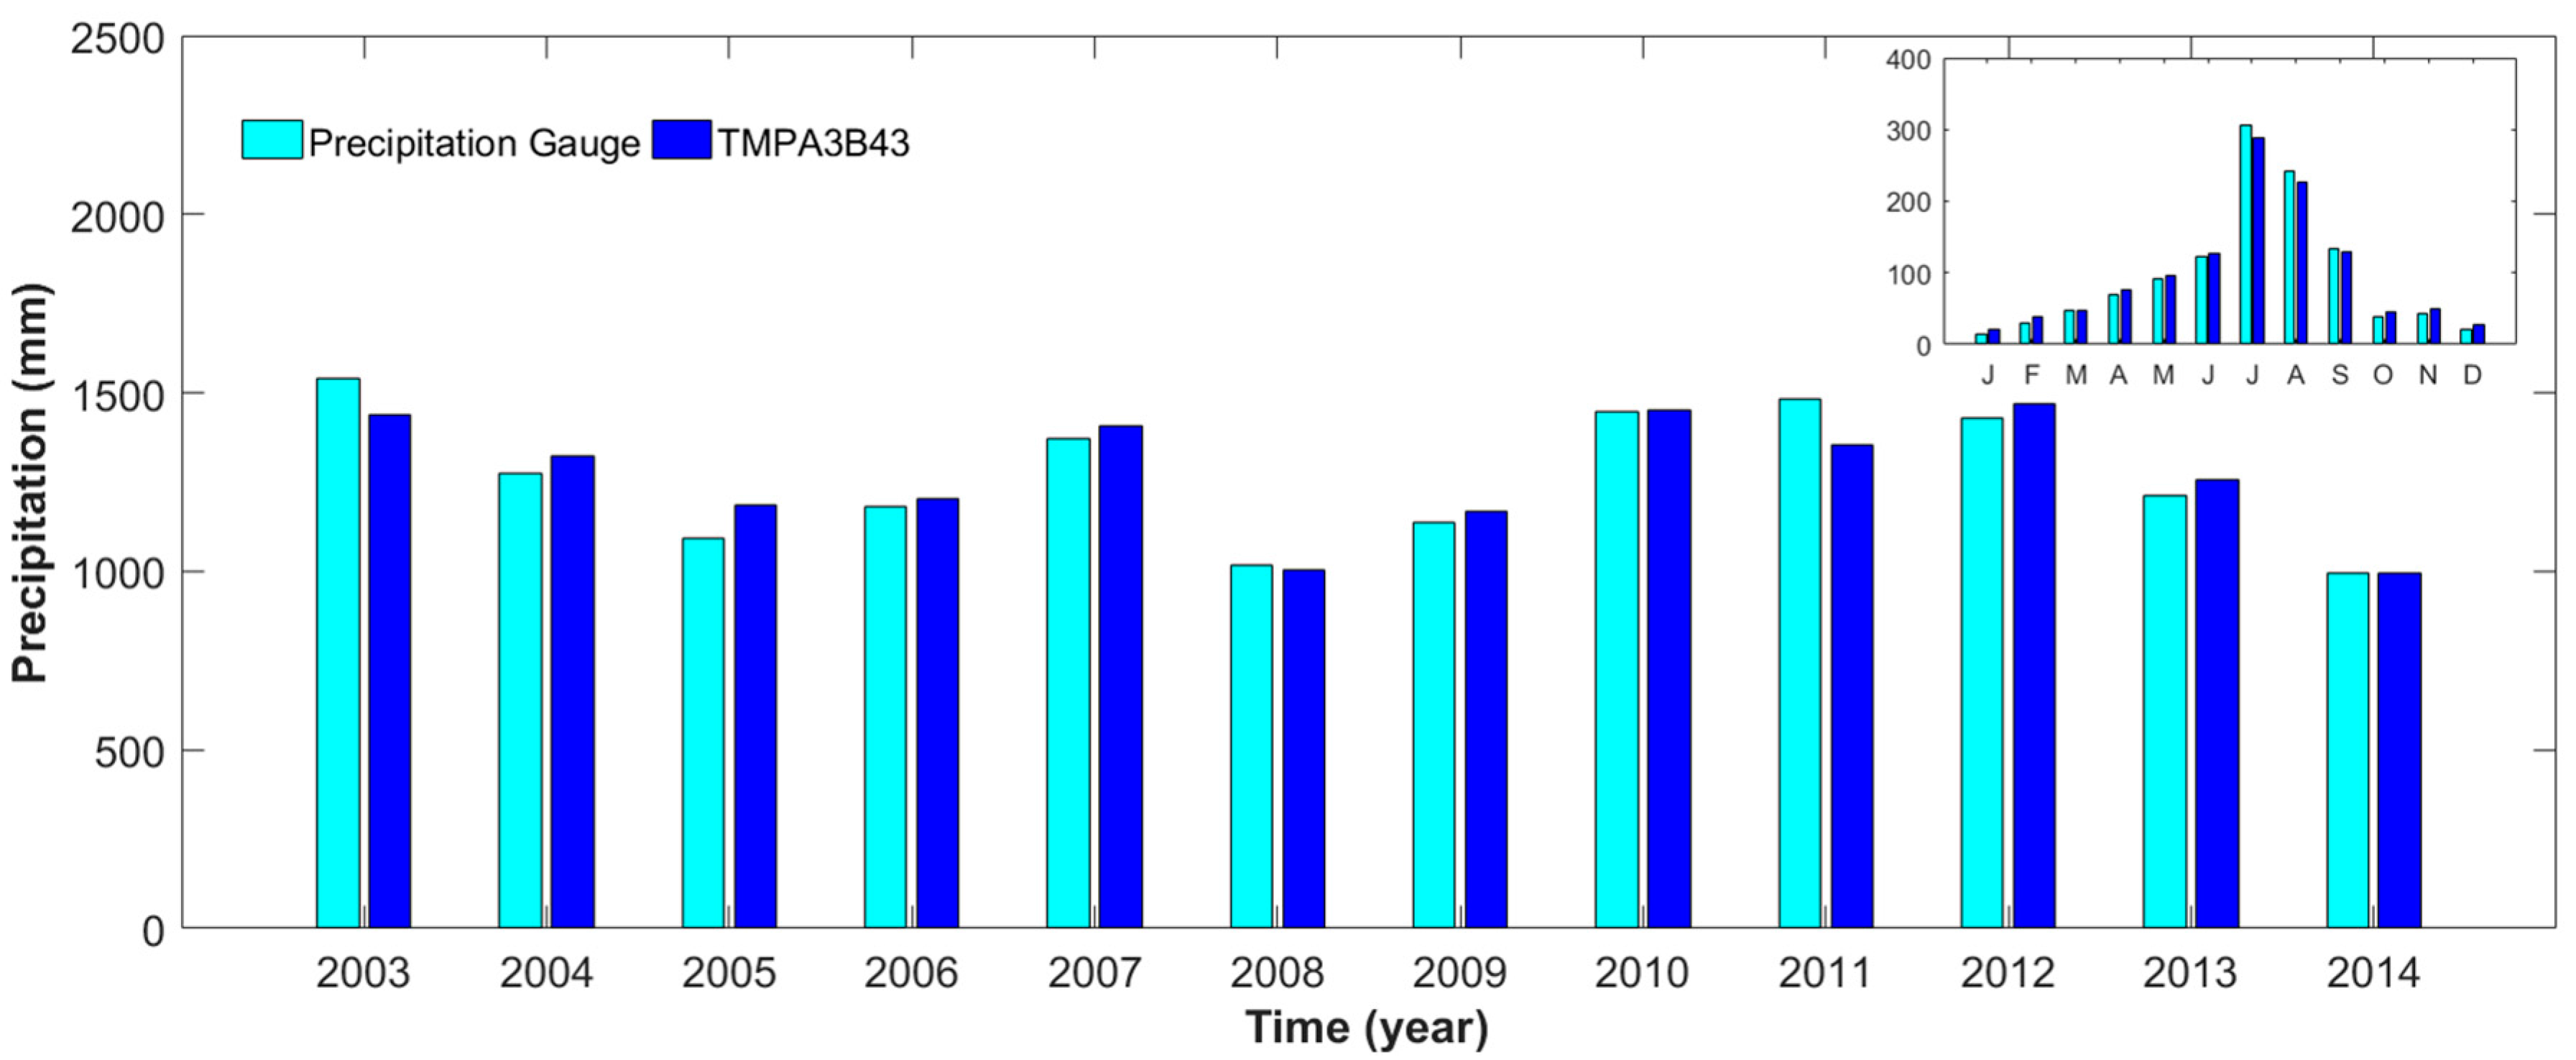
Figure 4 shows both the annual precipitation from TMPA3B43V7, and the averaged ground observation. TMPA3B43V7 and ground observation precipitation showed good agreement with a correlation coefficient (
r = 0.98). The inset of
Figure 5 shows the seasonal cycle of two precipitation results. The seasonal patterns of TMPA3B43V7 and observations are similar to each other. During the summer season (July–September), precipitation observations from gauges results were slightly higher than those from TMPA3B43V7, whereas in other seasons, the TMPA 3B43V7 results were higher than the gauge observations.
Table 5 lists trends, annual amplitudes (1 cycle/year), and semi-annual amplitudes (2 cycles/year) of the hydrological components explained in previous sections. The table also lists the goodness of fit that was measured by
r2. The trends of GRACE-based TWSA and TWSC are negative for the Korean Peninsula during the study period (−9.29 mm and −0.43 mm/month, respectively). The magnitude of semi-annual amplitudes is about 20% of annual amplitudes. The
r2 value of TWSA is 0.34, indicating a match by 34% between the original TWSA and the decomposed signal. TWSC and the decomposed signal matched by 29%. Regarding evapotranspiration, the trend is 35.17 mm/month for MOD16, and the average trend of four LSMs is 55.96 mm/month. Trends, and annual and semi-annual amplitudes from LSMs are all larger than those of MOD16 (7.95–31.55 mm/month, 13.27–33.39 mm/month, and 0.32–1.66 mm/month, respectively). CLM and MOD16 show the most similar trends and amplitudes in evapotranspiration. Also, we obtain an
r2 value of 0.87–0.97, which explains the good match in the evapotranspiration results. For precipitation, TMPA3B4V7 and gauges observations show good agreement in trends (104.78 vs. 105.97 mm/month) and amplitudes (105.62 vs. 114.41 mm/month for annual, 5.07 vs. 7.89 mm/month for semi-annual). The goodness of fit shows about 60% and 56% in the TMPA3B43V7 and gauge observations, respectively.
4.2. Estimation of Satellite-Based Discharge in the Korean Peninsula
Figure 6 shows a monthly time series of the satellite-based total discharge derived from GRACE, TMPA3B43V7 and MOD16 data. The monthly variation of discharge resembles the precipitation pattern. In general, 60–70% of the annual precipitation occurs during June to September, and the satellite-based discharge begins to increase in June and peaks in July to August.
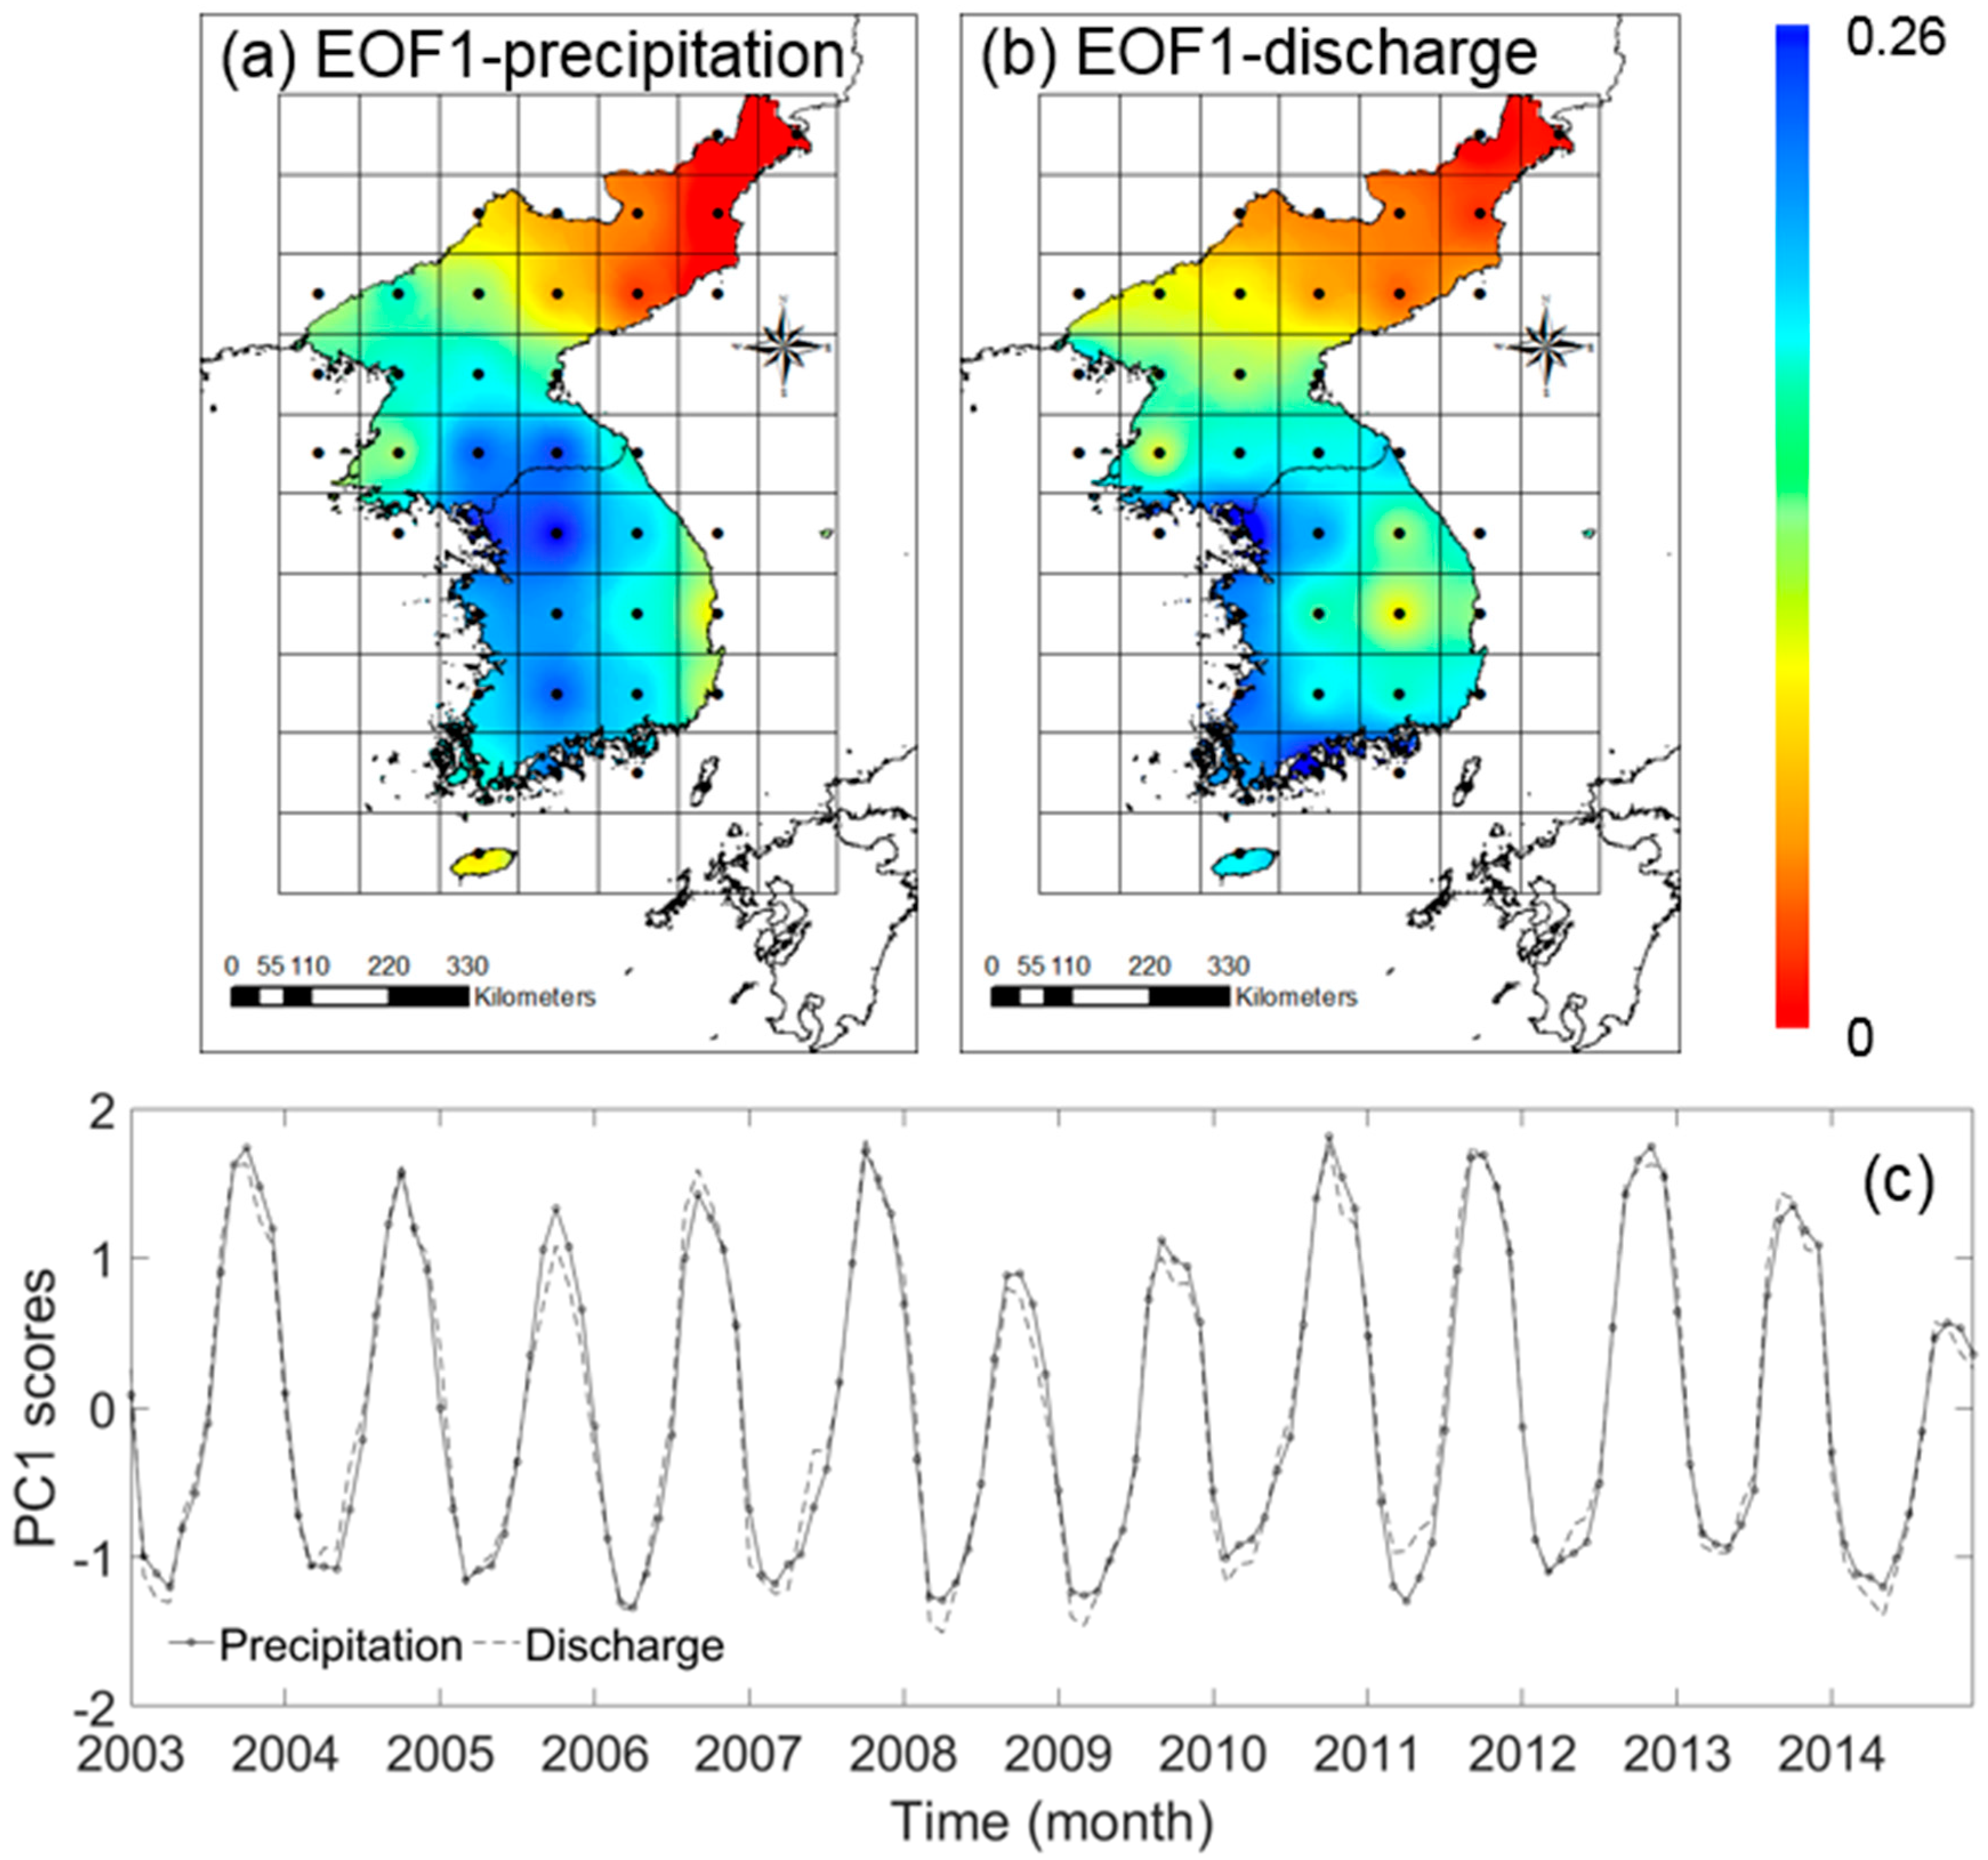
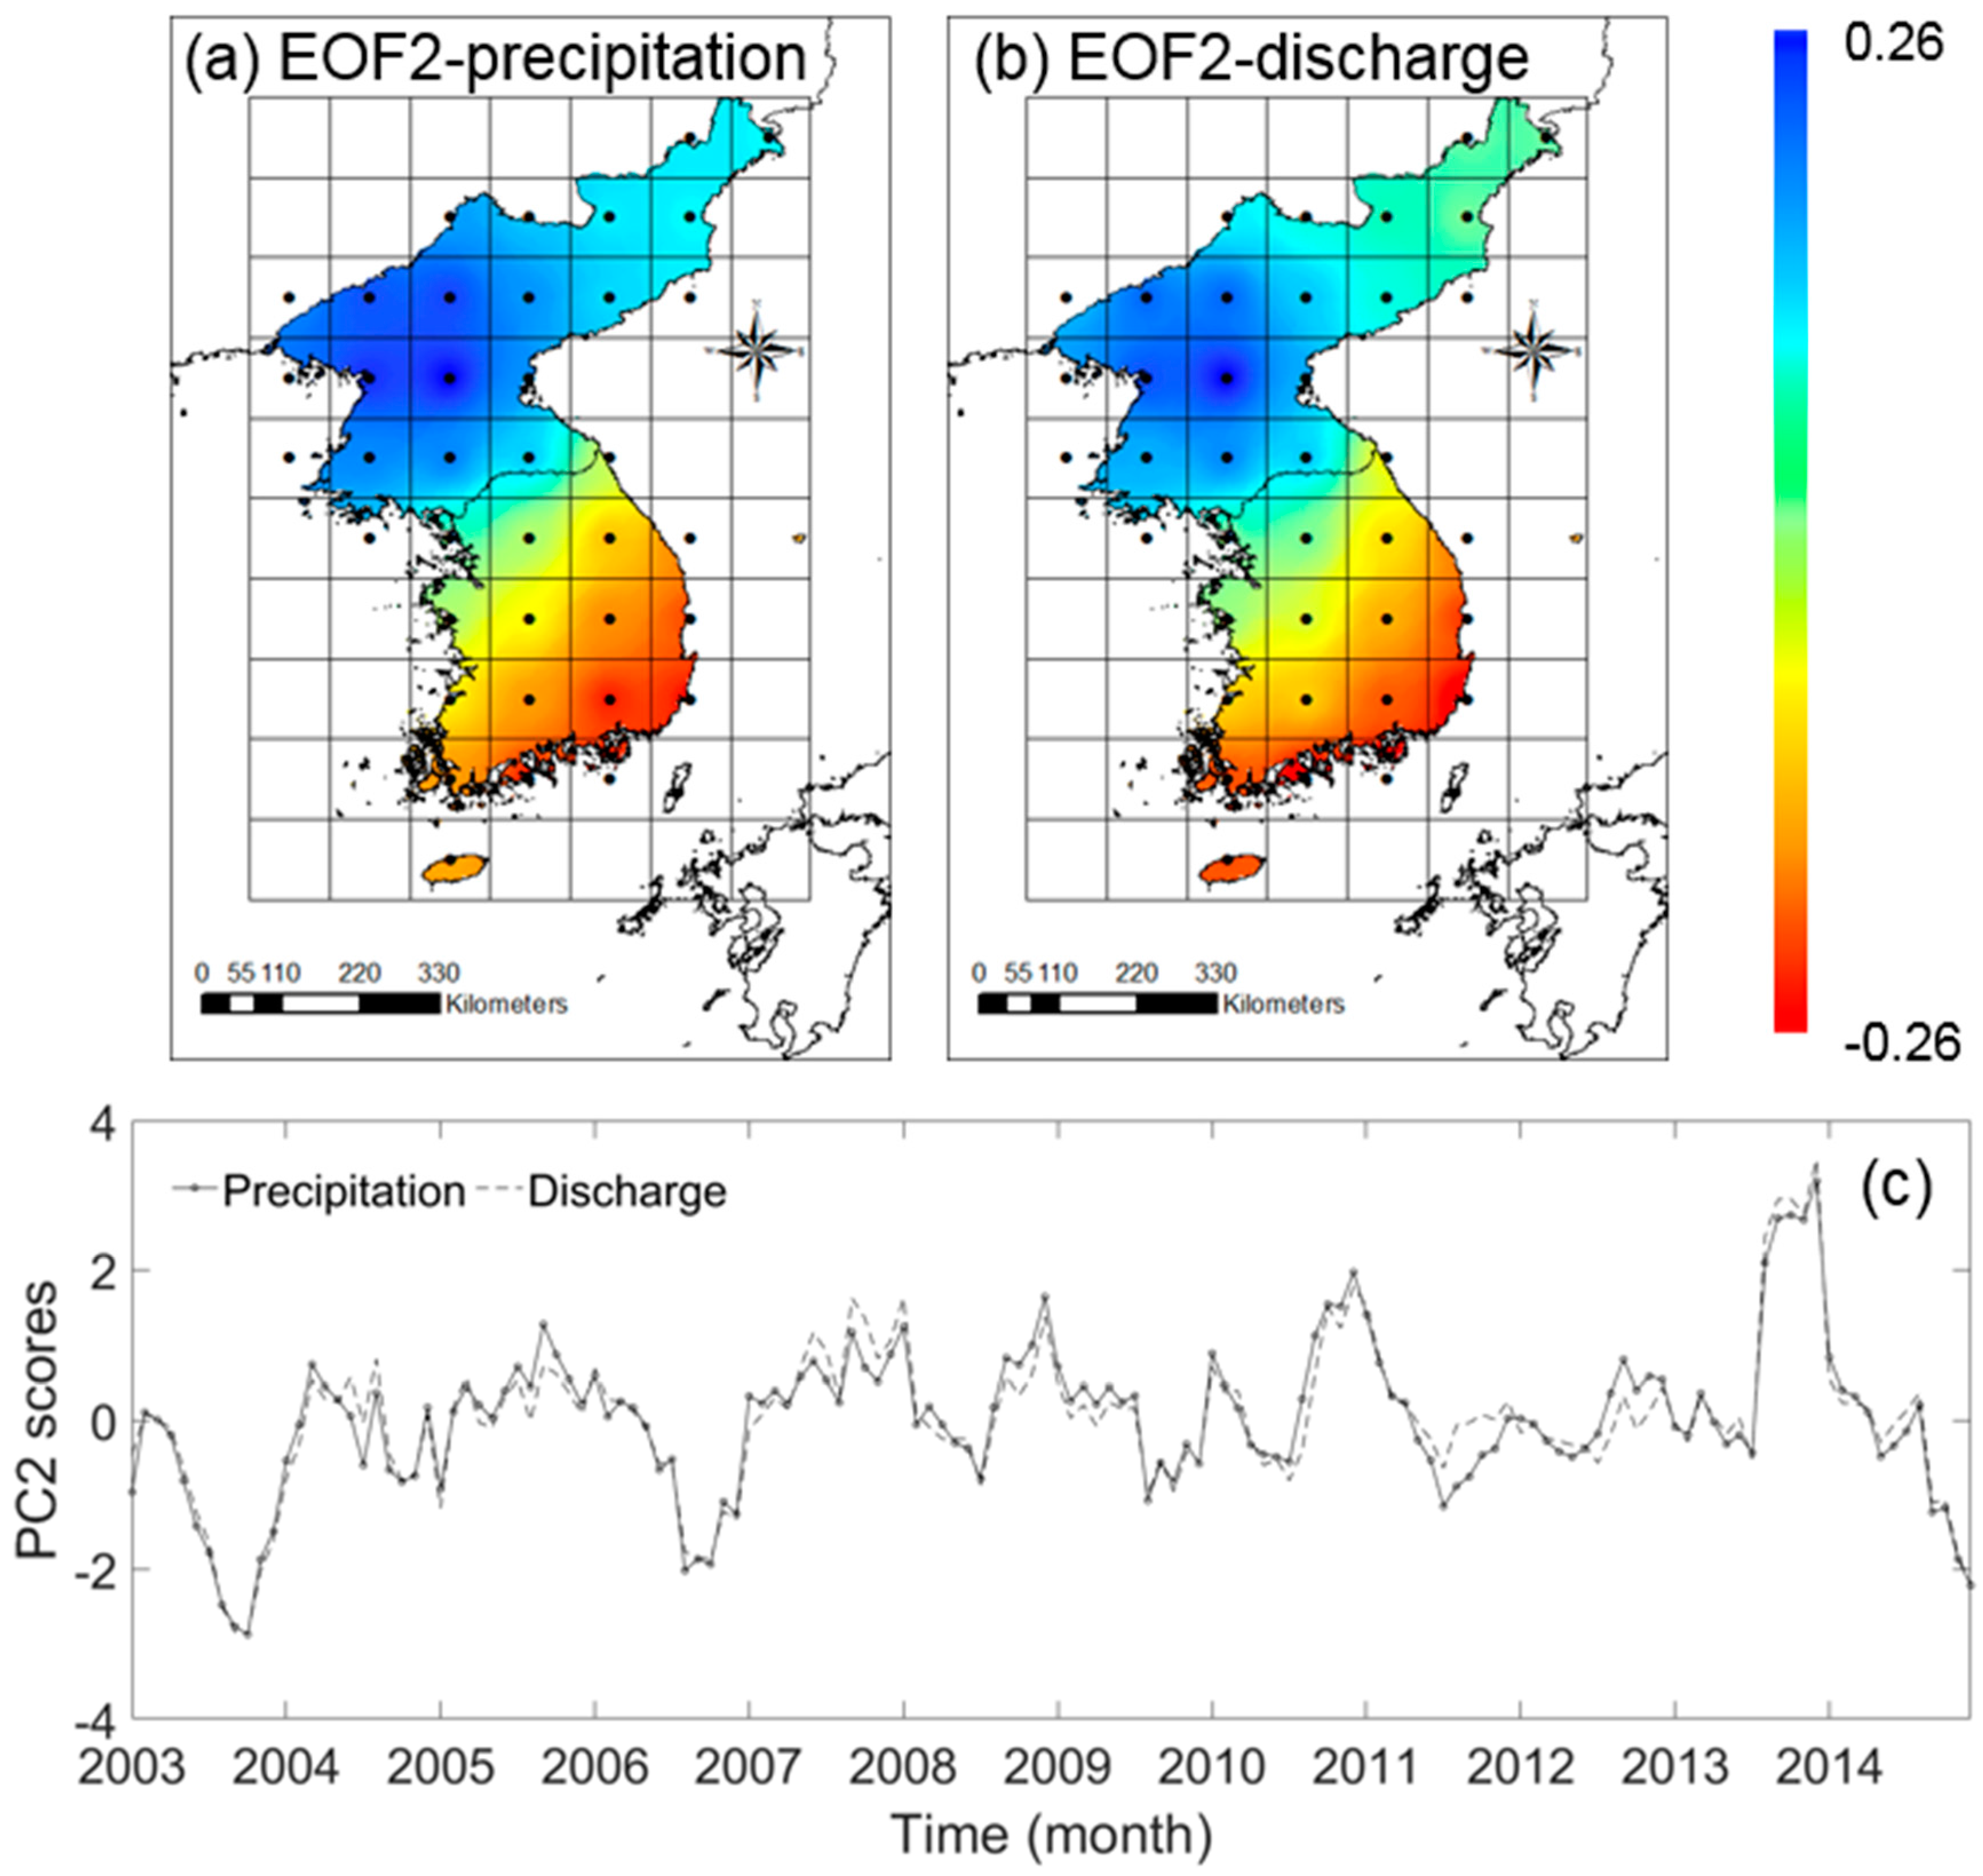
Figure 7 and
Figure 8 show the EOF distributions and PC scores of precipitation and discharge. The EOFs reveal regions of coherent variability. The patterns of PC1 and PC2 loadings are similar to the relations between the satellite-based precipitation and discharge. The first mode (EOF1), which represents the largest variance, explains 85.2% and 73.8% of the total variance of precipitation and discharge, respectively. The EOF1 results (
Figure 7a,b) of the northern region (red color in
Figure 7a,b) which are mountainous areas, show lower values relative to the other regions. Since South Korea has more precipitation, flatter plains and higher seasonal variability than North Korea, the EOF1 results of precipitation and discharge in North Korea show lower values. The second mode (EOF2) accounted for 6.4% and 10.6% of the total variance of precipitation and discharge, respectively. Both EOF2 results of precipitation and discharge (
Figure 8a,b) show a north-south dipole pattern compared to EOF1. These EOF2 modes represent the north to south variability of precipitation and discharge in the Korean Peninsula. A comparison of PC1 and PC2 score time series for precipitation and discharge (
Figure 7c and
Figure 8c) indicates significant correlation (
r = 0.99 for PC1 and 0.97 for PC2). Similar phenomena regarding the dominant EOF patterns in precipitation and discharge have been reported in previous studies for other regions; some examples are Northwest Mexico [
44], West Africa [
45], China [
46,
47,
48], and the Amazon River basin [
49].
4.3. Validation of the Estimated Total Discharge
4.3.1. Total Discharge in the Korean Peninsula
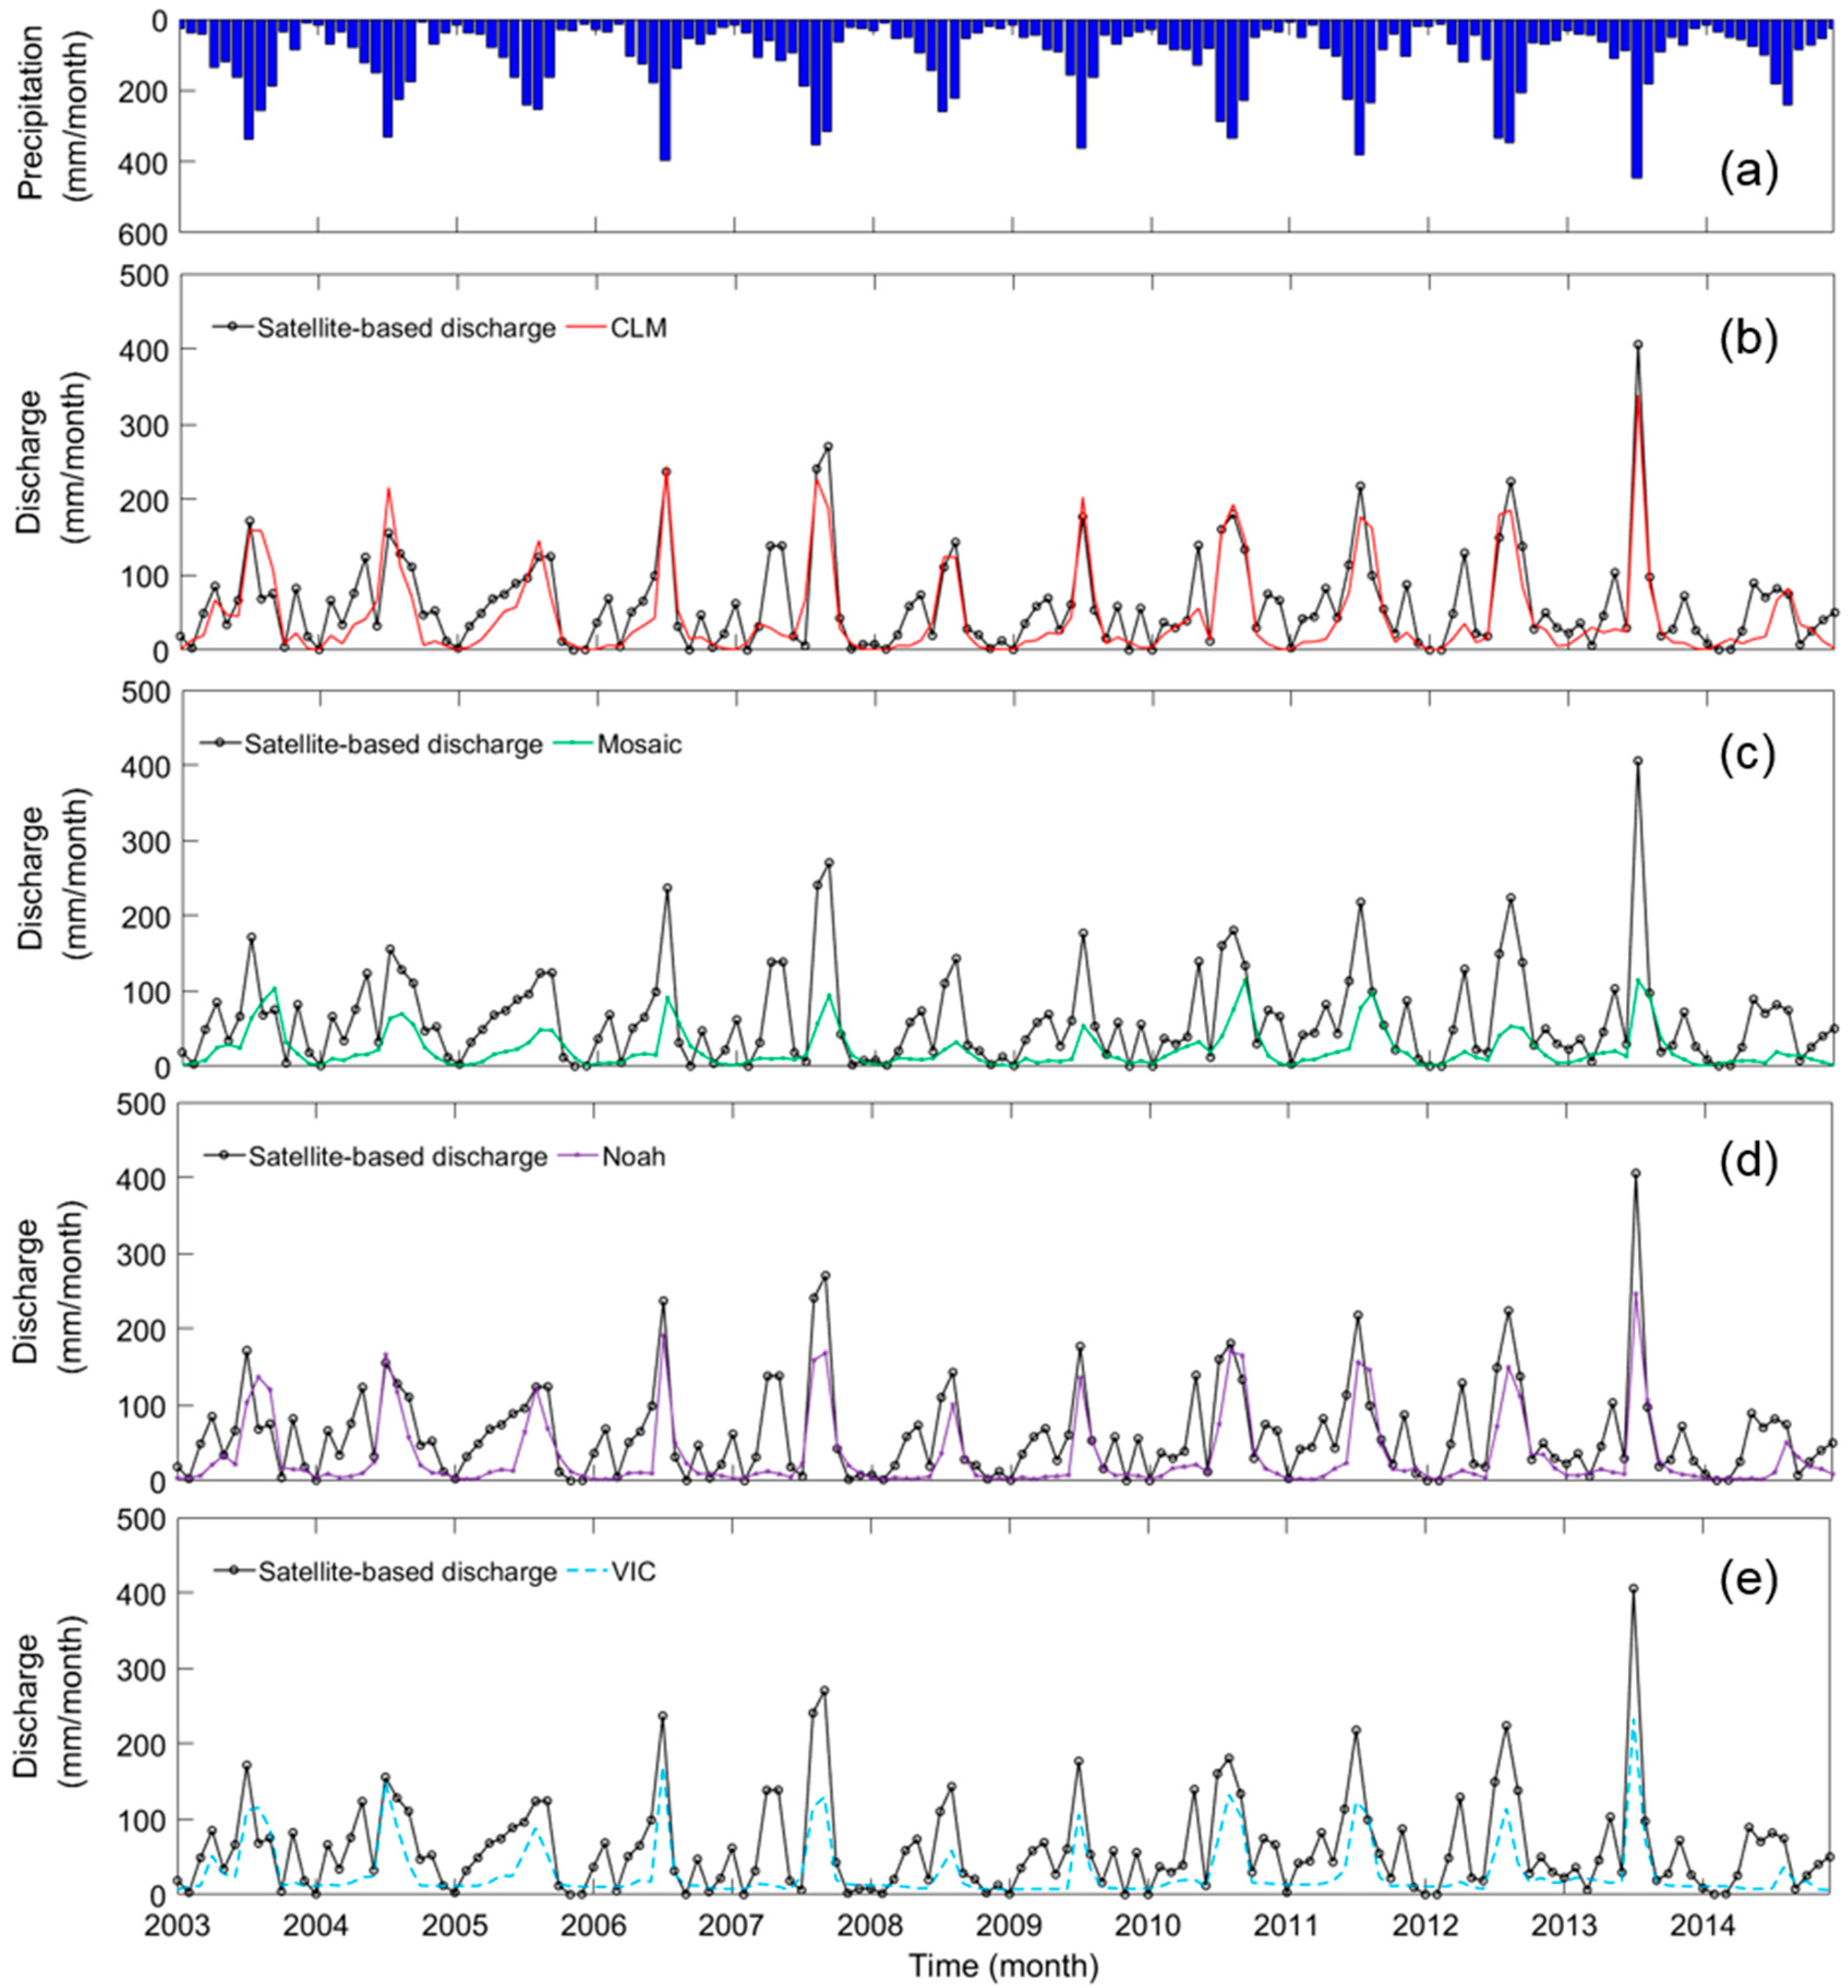
Figure 9 shows the time series of satellite-based and LSMs monthly discharge, along with the precipitation from TMPA3B43V7 in the Korean Peninsula. The satellite-based discharge shows a similar pattern to the LSM total (surface + subsurface) discharge responding to the precipitation. The maximum discharge during the study period turned out to be 406.06, 338.97, 114.48, 246.75, and 233.58 mm/month, according to the satellite, CLM, Mosaic, Noah, and VIC, respectively. They all occurred in July 2013. The satellite-based approach overestimated discharge by 17.23, 39.08, 29.13, and 32.76 mm/year compared to CLM-, Mosaic-, Noah-, and VIC-based results, respectively. In general, discrepancies were observed in dry conditions of winter and spring.
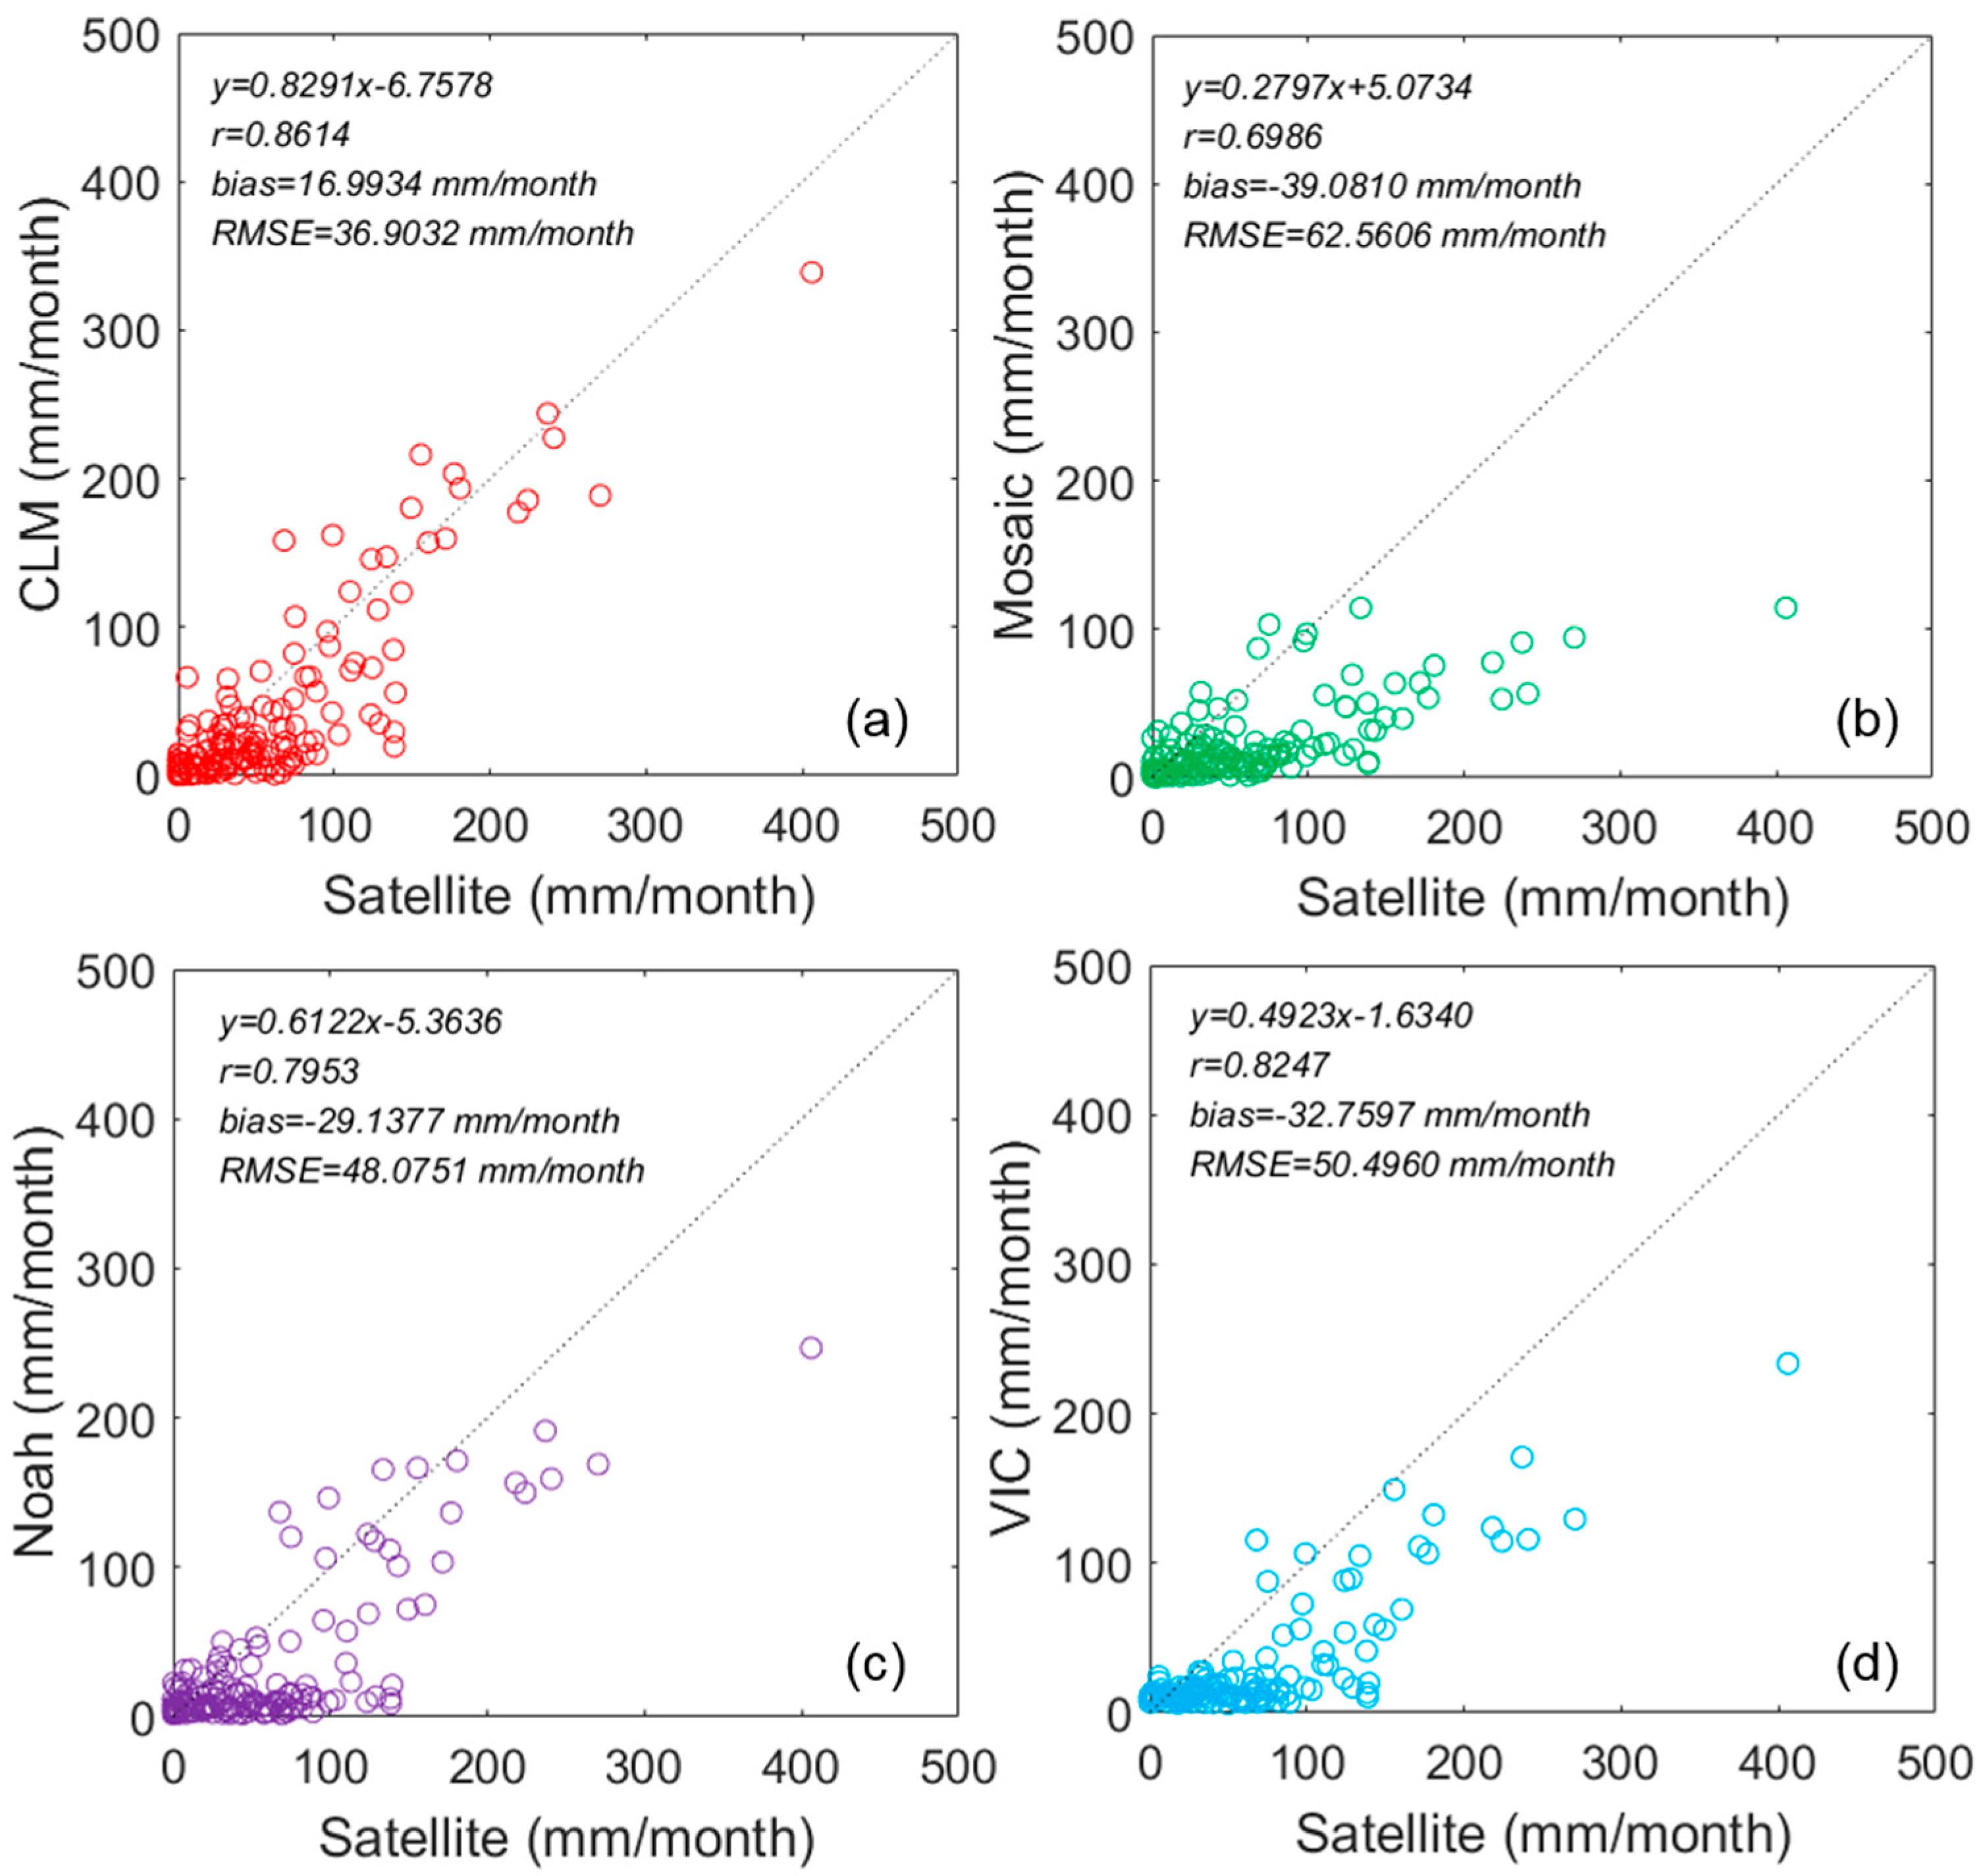
Statistically, the satellite-based discharges are in reasonable agreement with the LSM results (
Figure 10); the correlation coefficient (
r) was 0.86, 0.82, 0.79, and 0.70 for CLM, Noah, VIC, and Mosaic, respectively (
Table 6). For annual and semi-annual discharge variations (
Table 7), the CLM-based discharge amplitudes and phases showed good agreement with the satellite-based discharge, while the Mosaic-based discharge showed the worst performance. The magnitudes of the semi-annual amplitudes are about 6–10% of annual amplitudes. In general, the annual and semi-annual phase results showed a negative phase shift, whereas the semi-annual phase of Mosaic and VIC showed a positive phase shift.
4.3.2. Evaluation of Satellite-Based Discharge in South Korea
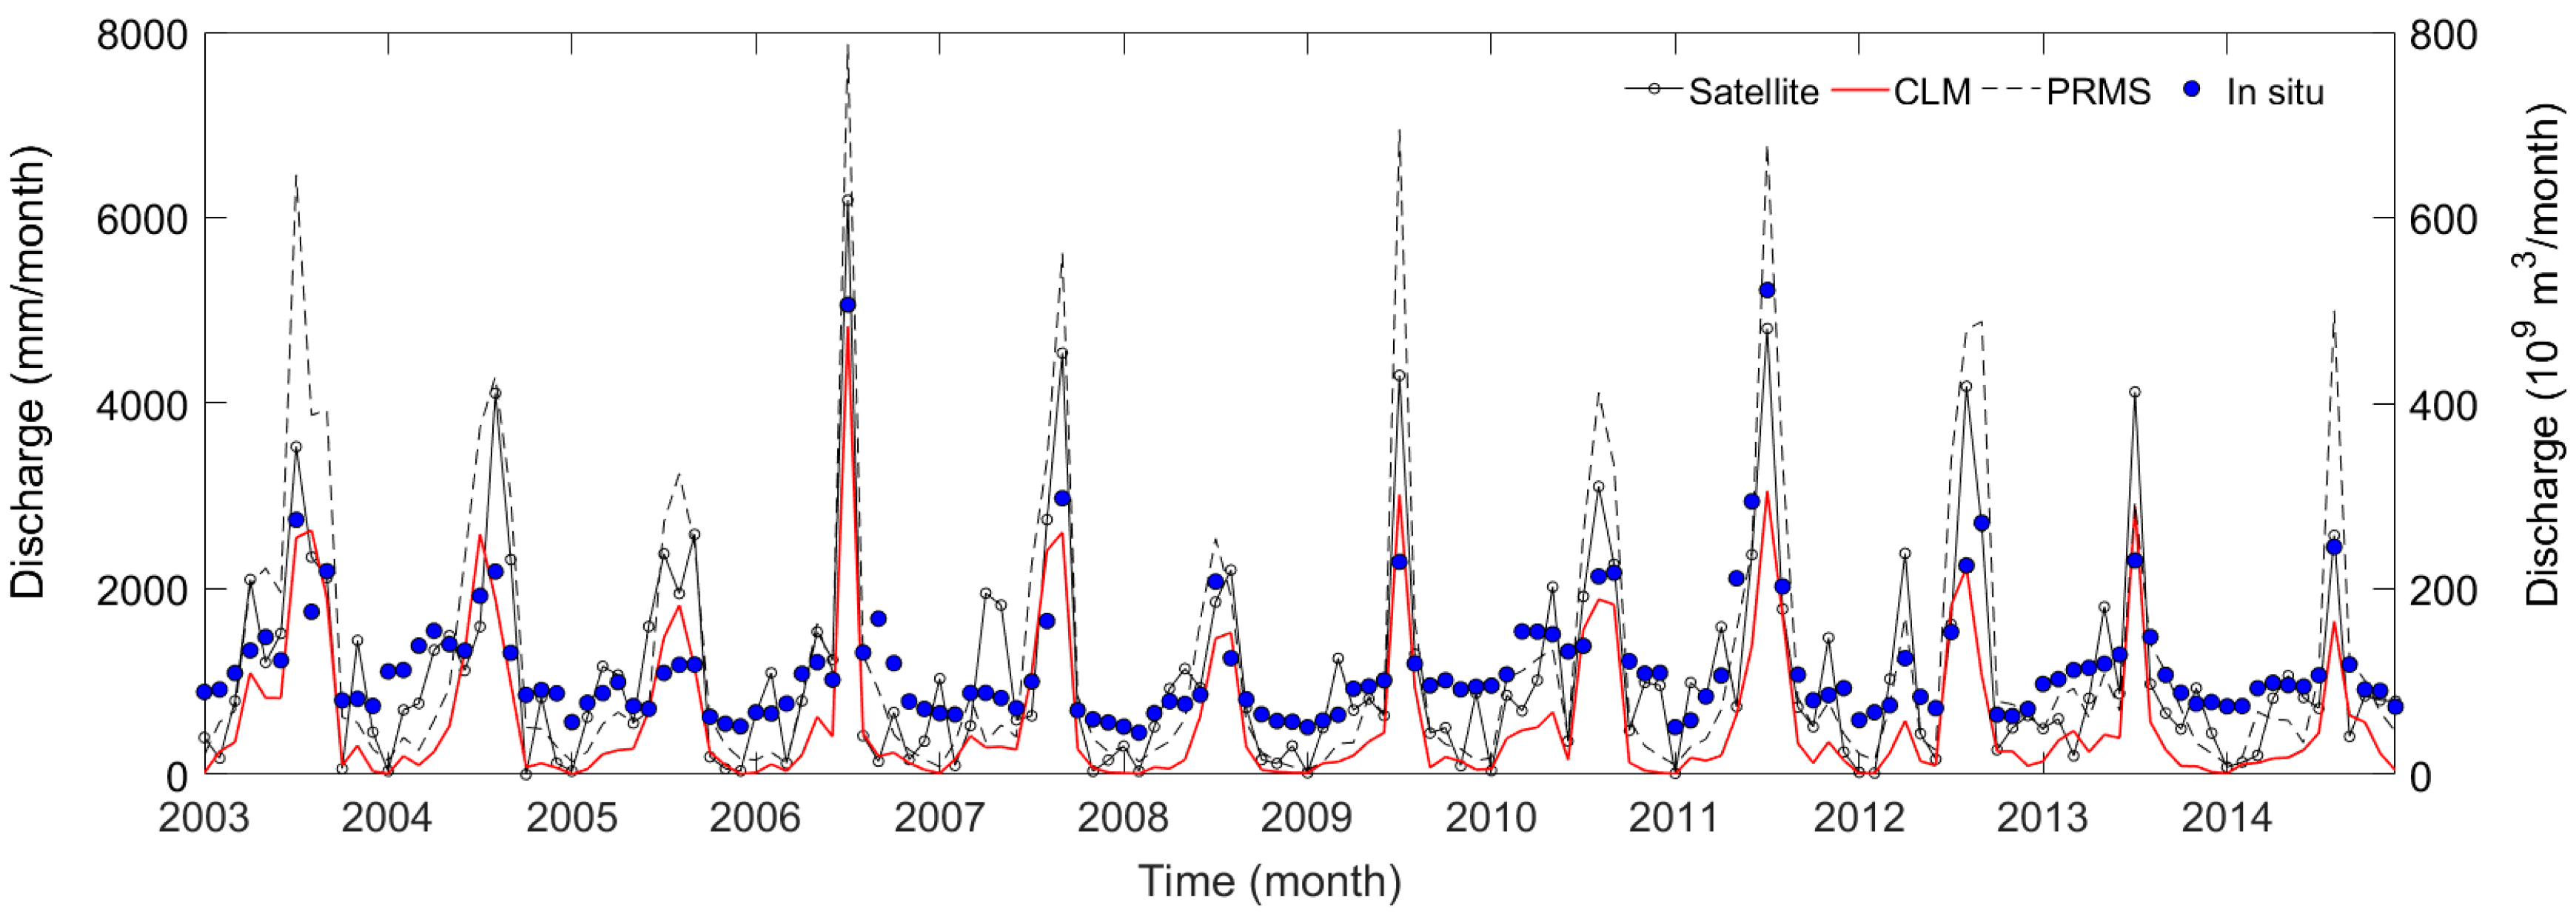
Figure 11 shows the temporal variation of the sum of total discharge from satellites, model datasets (CLM and PRMS), and in situ gauging stations of five major river basins (Han, Nakdong, Guem, Seomjin, and Youngsan river basins) in South Korea during the study period. While the results display a similar trend, the PRMS discharge tends to be overestimated compared with the satellite-, CLM-based, and in situ discharge; discrepancies occur mostly in the peak discharge during the summer season. It is interpreted to be due to localized torrential downpours concentrated in a few days. The mean annual discharge amount turned out to be 13,166.56 mm/year (~1106 × 10
9 m
3/year), 15,058.00 mm (~1264 × 10
9 m
3/year), 6678.79 mm (560 × 10
9 m
3/year) and 14,145.48 mm (~1188 × 10
9 m
3/year), according to the satellite, PRMS, CLM, and in situ data, respectively. The satellite-based discharge, PRMS, and in situ results show identical trends and similar values, compared to the CLM-based discharge.
Figure 12 shows the scatter plot of the satellite-based and model-based discharge. The
r of the satellite-based discharge was 0.88 for PRMS, 0.72 for CLM and 0.82 for in situ (
Table 8). The PRMS-based discharge was greater than the satellite-based discharge, while the CLM-based discharge showed a tendency for underestimation. Also, the NSE of the satellite-based discharge was 0.74, 0.17, and 0.65 for PRMS, CLM, and in situ discharge, respectively. Through the NSE results, PRMS showed the best performance with the satellite-based discharge. Based on the results, the estimated satellite-based discharge shows reasonable performance over the Korean peninsula, and on a regional scale.
5. Conclusions
The northern part of the peninsula (North Korea) is a practically ungauged area, since no hydrological information is available there, other than precipitation data at limited stations. In this study, we estimated the discharge of the Korean Peninsula from January 2003 to December 2014 using GRACE, MODIS, and TRMM satellites products. In order to integrate the spatial resolution of different satellite products, TMPA3B43V7 and MOD16 were resampled at 1.0° spatial resolution.
The total discharge estimates were validated with GLDAS LSMs (CLM, Mosaic, Noah, and VIC) results and PRMS long-term discharge and in situ discharge of five river basins in South Korea. The satellite-based discharge showed good correlation, with LSMs with r values of 0.70‒0.86. Also, the PRMS and in situ discharge (NSE values of 0.74 and 0.65) for South Korea showed similar trends and correlation with the satellite-based discharge compared to the CLM results (NSE values of 0.17). However, the satellite-based discharge, overestimated slightly in dry seasons, compared with the four LSMs in the Korean Peninsula. Also, PRMS discharge results in South Korea overestimated during rainy seasons compared with the satellite-based and LSM-based discharge. The total discharge estimated using the three different satellite products might have uncertainties due to the following reasons: (1) measurement error of each satellite product; (2) low spatial resolution of GRACE (~100 km); and (3) error made in the process of integrating the three satellite products.
Analysis of principal components yielded insight into the seasonal and inter-annual variability of the estimated discharge and its relationship with precipitation. The first modes of precipitation and discharge (EOF1) had relatively low values in mountainous regions. The second modes (EOF2) showed a dipole north to south pattern in both precipitation and discharge. The EOFs and PCs of discharge revealed a clear positive correlation with precipitation.
Considering the scarcity of hydrological data and the complexity of the topography of the Korean Peninsula, the statistical performance of the discharge estimates proves the applicability of the proposed method-the integration of three different satellite products; GRACE, MODIS, and TRMM. The estimated discharge will be a valuable asset for building a database for the ungauged area and will contribute to the efficient management of the trans-boundary river basins in the Korean Peninsula.
Acknowledgments
This research was supported by Basic Science Research Program through the National Research Foundation (NRF) funded by the ministry grant (NRF-2015R1D1A1A09060690), and by a grant (17AWMP-B079625-04) from the Water Management Research Program funded by the Ministry of Land, Infrastructure and Transport of Korea government.
Author Contributions
Jae Young Seo led manuscript writing and conducted the research under the guidance of Sang-Il Lee. Sang-Il Lee contributed to prepare the manuscript through review and comments.
Conflicts of Interest
The authors declare no conflict of interest.
References
- Trenberth, K.E.; Smith, L.; Qian, T.; Dai, A.; Fasullo, J. Estimates of the global water budget and its annual cycle using observational and model data. J. Hydrometeor. 2007, 8, 758–769. [Google Scholar] [CrossRef]
- Myeong, S. Flood Vulnerability and Deforestation: A Case Study of North Korea; Input Paper prepared for the Global Assessment Report on Disaster Risk Reduction 2015; United Nations Office for Disaster Reduction: Geneva, Switzerland, 2014. [Google Scholar]
- Seo, J.Y.; Lee, S.-I. Multi-Platform Satellite Based Estimates of Runoff in Ungauged Areas. In Proceedings of the ISPRS Joint International Geoinformation Conference, Kuala Lumpur, Malaysia, 28–30 October 2015. [Google Scholar] [CrossRef]
- Lee, S. Challenges and Opportunities for Water Resources Management in a Unified Korea; The East Asia Institute (EAI) Research Paper; The East Asia Institute (EAI): Seoul, Korea, 2016. [Google Scholar]
- Rodell, M.; Famiglietti, J.S.; Chen, J.; Seneviratne, S.I.; Viterbo, P.; Holl, S.; Wilson, C.R. Basin scale estimates of evapotranspiration using GRACE and other observations. Geophys. Res. Lett. 2004, 31, L20504. [Google Scholar] [CrossRef]
- Syed, T.H.; Famiglietti, J.S.; Rodell, M.; Chen, J.; Wilson, C.R. Analysis of terrestrial water storage changes from GRACE and GLDAS. Water Resour. Res. 2008, 44, W02433. [Google Scholar] [CrossRef]
- Lee, S.-I.; Kim, J.-S.; Lee, S.-K. Estimation of average terrestrial water storage changes in the Korean Peninsula using GRACE satellite gravity data (in Korean). J. Korea Water Resour. Assoc. 2012, 45, 805–814. [Google Scholar] [CrossRef]
- Lee, S.-I.; Seo, J.Y.; Lee, S.K. Validation of terrestrial water storage change estimates using hydrological simulation. J. Water Resour. Ocean Sci. 2014, 3, 5–9. [Google Scholar] [CrossRef]
- Seo, J.Y.; Lee, S.-I. Integration of GRACE, ground observation, and land-surface models for groundwater storage variations in South Korea. Int. J. Remote Sens. 2016, 37, 5786–5801. [Google Scholar] [CrossRef]
- Syed, T.H.; Famiglietti, J.S.; Chen, J.; Rodell, M.; Seneviratne, S.I.; Viterbo, P.; Wilson, C.R. Total basin discharge for the Amazon and Mississippi river basins from GRACE and a land-atmosphere water balance. Geophys. Res. Lett. 2005, 32, L24404. [Google Scholar] [CrossRef]
- Ferreira, V.G.; Gong, Z.; He, X.; Zhang, Y.; Andam-Akorful, S.A. Estimating total discharge in the Yangtze River Basin using satellite-based observations. Remote Sens. 2013, 5, 3415–3430. [Google Scholar] [CrossRef]
- Armanios, D.E.; Fisher, J.B. Measuring water availability with limited ground data: Assessing the feasibility of an entirely remote-sensing-based hydrologic budget of the Rufiji Basin, Tanzania, using TRMM, GRACE, MODIS, SRB, and AIRS. Hydrol. Process. 2014, 28, 853–867. [Google Scholar] [CrossRef]
- Hassan, A.A.; Jin, S. Lake level change and total water discharge in East Africa Rift Valley from satellite-based observations. Glob. Planet. Chang. 2014, 117, 79–90. [Google Scholar] [CrossRef]
- Wang, H.; Guan, H.; Gutiérrez-Jurado, H.A.; Simmons, C.T. Examination of water budget using satellite products over Australia. J. Hydrol. 2014, 511, 546–554. [Google Scholar] [CrossRef]
- Li, Q.; Zhong, B.; Luo, Z.; Yao, C. GRACE-based estimates of water discharge over the Yellow River basin. J. Geodesy Geodyn. 2016, 7, 187–193. [Google Scholar] [CrossRef]
- Munier, S.; Aires, F.; Schlaffer, S.; Prigent, C.; Papa, F.; Maisongrande, P.; Pan, M. Combining data sets of satellite-retrieved products for basin scale water balance study: 2. Evaluation on the Mississippi Basin and closure correction model. J. Geophys. Res. Atmos. 2014, 119, 12100–12116. [Google Scholar] [CrossRef]
- Buma, W.G.; Lee, S.-I.; Seo, J.Y. Hydrological evaluation of Lake Chad basin using space borne and hydrological model observations. Water 2016, 8, 205. [Google Scholar] [CrossRef]
- Lv, M.; Ma, Z.; Yuan, X.; Lv, M.; Li, M.; Zheng, Z. Water budget closure based on GRACE measurement and reconstructed evapotranspiration using GLDAS and water use data for two large densely-populated mid-latitude basins. J. Hydrol. 2017, 547, 585–599. [Google Scholar] [CrossRef]
- Baik, J.; Choi, M. Evaluation of remotely sensed actual evapotranspiration products from COMS and MODIS at two different flux tower sites in Korea. Int. J. Remote Sens. 2015, 36, 375–402. [Google Scholar] [CrossRef] [PubMed]
- Brutsaert, W. Hydrology: An Introduction; Cam-bridge University Press: Cambridge, UK, 2008. [Google Scholar]
- Swenson, S.C. GRACE Monthly Land Water Mass Grids NETCDF RELEASE 5.0. Ver. 5.0. PO.DAAC, CA, USA. Available online: http://dx.doi.org/10.5067/TELND-NC005 (accessed on 6 January 2017).
- Cheng, M.K.; Ries, J.C.; Tapley, B.D. Variations of the Earth’s figure axis from Satellite Laser Ranging and GRACE. J. Geophys. Res. 2011, 116, B01409. [Google Scholar] [CrossRef]
- Swenson, S.C.; Wahr, J. Post-processing removal of correlated errors in GRACE data. Geophys. Res. Lett. 2006, 33, L08402. [Google Scholar] [CrossRef]
- Landerer, F.W.; Swenson, S.C. Accuracy of scaled GRACE terrestrial water storage estimates. Water Resour. Res. 2012, 48, W04531. [Google Scholar] [CrossRef]
- Riegger, J.; Tourian, M.J. Characterization of runoff-storage relationships by satellite gravimetry and remote sensing. Water Resour. Res. 2014, 50, 3444–3466. [Google Scholar] [CrossRef]
- Mu, Q.; Zhao, M.; Running, S.W. Improvements to a MODIS global terrestrial evapotranspiration algorithm. Remote Sens. Environ. 2011, 115, 1781–1800. [Google Scholar] [CrossRef]
- Kim, H.W.; Hwang, K.; Mu, Q.; Choi, M. Validation of MODIS 16 Global Terrestrial Evapotranspiration Products in Various Climates and Land Cover Types in Asia. KSCE J. Civ. Eng. 2011, 16, 229–238. [Google Scholar] [CrossRef]
- Jang, K.; Kang, S.; Lim, Y.-J.; Jeong, S.; Kim, J.; Kimball, J.S.; Hong, S.Y. Monitoring daily evapotranspiration in Northeast Asia using MODIS and a regional Land Data Assimilation System. J. Geophys. Res. 2013, 118, 12927–12940. [Google Scholar] [CrossRef]
- Huffman, G.J.; Adler, R.F.; Bolvin, D.T.; Gu, G.J.; Nelkin, E.J.; Bowman, K.P.; Hong, Y.; Stocker, E.F.; Wolff, D.B. The TRMM multisatellite precipitation analysis (TMPA): Quasi-global, multiyear, combined-sensor precipitation estimates at fine scales. J. Hydrometeorol. 2007, 8, 38–55. [Google Scholar] [CrossRef]
- Koo, M.S.; Hong, S.Y.; Kim, J. An evaluation of the tropical rainfall measuring mission (TRMM) multi-satellite precipitation analysis (TMPA) data over South Korea. Asia-Pac. J. Atmos. Sci. 2009, 45, 265–282. [Google Scholar] [CrossRef]
- Sohn, B.J.; Han, H.-J.; Seo, E.-K. Validation of Satellite-Based High-Resolution Rainfall Products over the Korean Peninsula Using Data from a Dense Rain Gauge Network. J. Appl. Meteorol. Clim. 2010, 49, 701–714. [Google Scholar] [CrossRef]
- Kim, J.P.; Jung, I.W.; Park, K.W.; Yoon, S.K.; Lee, D. Hydrological Utility and Uncertainty of Multi-Satellite Precipitation Products in the Mountainous Region of South Korea. Remote Sens. 2016, 8, 608. [Google Scholar] [CrossRef]
- Rodell, M.; Houser, P.R.; Jambor, U.; Gottschalck, J.; Mitchell, K.; Meng, C.-J.; Arsenault, K.; Cosgrove, B.; Radakovich, J.; Bosilovich, M.; et al. The Global Land Data Assimilation System. Bull. Am. Meteor. Soc. 2004, 85, 381–394. [Google Scholar] [CrossRef]
- Leavesley, G.H.; Leichty, R.W.; Troutman, B.M.; Saindon, L.G. Precipitation-Runoff Modeling System: User’s Manual; Water Resources Investigation U.S. Geological Survey: Denver, CO, USA, 1983.
- Kim, N.W.; Kim, H.J.; Park, S.H. Long-term runoff characteristics on HRU variations of PRMS. J. Korea Water Resour. Assoc. 2005, 38, 167–177. [Google Scholar] [CrossRef]
- Bae, D.H.; Jung, I.W.; Chang, H.J. Long-term Trend of Precipitation and Runoff in Korean River Basins. Hydrol. Process. 2008, 22, 2644–2656. [Google Scholar] [CrossRef]
- Yoon, S.; Lee, T. Investigation of hydrological variability in the Korean Peninsula with the ENSO teleconnections. Proc. IAHS 2016, 374, 165–173. [Google Scholar] [CrossRef]
- Legates, D.R.; Wilmott, C.J. Mean seasonal and spatial variability in gauge-corrected, global precipitation. Int. J. Climatol. 1990, 10, 111–127. [Google Scholar] [CrossRef]
- Jin, S.; Feng, G. Large-scale variations of global groundwater from satellite gravimetry and hydrological models, 2002–2012. Glob. Planet. Chang. 2013, 106, 20–30. [Google Scholar] [CrossRef]
- Teferi, E.; Uhlenbrook, S.; Bewket, W. Inter-annual and seasonal trends of vegetation condition in the Upper Blue Nile (Abay) Basin: Dual-scale time series analysis. Earth Syst. Dyn. 2015, 6, 617–636. [Google Scholar] [CrossRef]
- Durbin, J.; Koopman, S.J. Time Series Analysis by State Space Methods; Oxford University Press: New York, NY, USA, 2001. [Google Scholar]
- Björnsson, H.; Venegas, S.A. A Manual for EOF and SVD Analyses of Climate Data; C2GCR Report No. 97-1; McGill University: Montreal, QC, Canada, 1997. [Google Scholar]
- Von Storch, H.; Zwiers, F.W. Statistical Analysis in Climate Research 1st den; Cambridge University Press: Cambridge, UK, 1999; pp. 293–316. [Google Scholar]
- Gochis, D.J.; Brito-Castillo, L.; Shuttleworth, J. Hydroclimatology of the North American Monsoon region in northwest Mexico. J. Hydrol. 2006, 316, 53–70. [Google Scholar] [CrossRef]
- Koumare, I. Temporal/Spatial Distribution of Rainfall and the Associated Circulation Anomalies over West Africa. Pakistan J. Metorol. 2014, 10, 1–11. [Google Scholar]
- Xue, Y.; Ji, J.; Sun, S.; Wu, G.; Lau, K.-M.; Poccard, I.; Kang, H.-S.; Zhang, R.; Schaake, J.C.; Zhang, J.Y.; et al. Multiscale Variability of the River Runoff System in China and Its Long-Term Link to Precipitation and Sea Surface Temperature. J. Hydrometeorol. 2005, 6, 550–569. [Google Scholar] [CrossRef]
- Fischer, T.; Gemmer, M.; Su, B.; Scholten, T. Hydrological long-term dry and wet periods in the Xijiang River basin, South China. Hydrol. Earth Syst. Sci. 2013, 17, 135–148. [Google Scholar] [CrossRef]
- Shen, C.; Qiang, H. Spatial and Temporal Variation of Annual Precipitation in a River of the Loess Plateau in China. J. Appl. Math. 2014, 2014. [Google Scholar] [CrossRef]
- Eom, J.; Seo, K.-W.; Ryu, D. Estimation of Amazon River discharge based on EOF analysis of GRACE gravity data. Remote Sens. Environ. 2017, 191, 55–66. [Google Scholar] [CrossRef]
Figure 1.
Location of the study area; (a) Digital Elevation Model (DEM) and Precipitation gauging stations; (b) Rivers, basins and discharge gauging stations.
Figure 1.
Location of the study area; (a) Digital Elevation Model (DEM) and Precipitation gauging stations; (b) Rivers, basins and discharge gauging stations.
Figure 2.
The time series of (a) Gravity Recovery and Climate Experiment (GRACE)-based terrestrial water storage anomaly (TWSA) and (b) terrestrial water storage changes (TWSC) with trends during the study period.
Figure 2.
The time series of (a) Gravity Recovery and Climate Experiment (GRACE)-based terrestrial water storage anomaly (TWSA) and (b) terrestrial water storage changes (TWSC) with trends during the study period.
Figure 3.
The time series of monthly evapotranspiration from MOD16 and GLDAS.
Figure 3.
The time series of monthly evapotranspiration from MOD16 and GLDAS.
Figure 4.
(a) The spatial resolution of TMPA3B43V7 at 0.25°; (b) Grid after resampling at 1.0°; (c) Thiessen polygons with precipitation gauging stations.
Figure 4.
(a) The spatial resolution of TMPA3B43V7 at 0.25°; (b) Grid after resampling at 1.0°; (c) Thiessen polygons with precipitation gauging stations.
Figure 5.
The time series of annual precipitation from TMPA3B43V7 and precipitation gauges.
Figure 5.
The time series of annual precipitation from TMPA3B43V7 and precipitation gauges.
Figure 6.
Time series of the satellite-based discharge and precipitation over the Korean Peninsula.
Figure 6.
Time series of the satellite-based discharge and precipitation over the Korean Peninsula.
Figure 7.
(a) Precipitation EOF-1 (variance = 85.2%); (b) Discharge EOF-1 (variance = 73.8%); (c) Score time series for principal component (PC)1 of monthly precipitation and discharge, 2003–2014.
Figure 7.
(a) Precipitation EOF-1 (variance = 85.2%); (b) Discharge EOF-1 (variance = 73.8%); (c) Score time series for principal component (PC)1 of monthly precipitation and discharge, 2003–2014.
Figure 8.
(a) Precipitation EOF-2 (variance = 6.4%); (b) Discharge EOF-2 (variance = 10.6%); (c) Score time series for PC2 of monthly precipitation and discharge, 2003–2014.
Figure 8.
(a) Precipitation EOF-2 (variance = 6.4%); (b) Discharge EOF-2 (variance = 10.6%); (c) Score time series for PC2 of monthly precipitation and discharge, 2003–2014.
Figure 9.
Time series of precipitation; (a) the satellite-based discharge and land surface model (LSM)-based discharge; (b) common land model (CLM); (c) Mosaic; (d) Noah; (e) variable infiltration capacity (VIC) over the Korean Peninsula.
Figure 9.
Time series of precipitation; (a) the satellite-based discharge and land surface model (LSM)-based discharge; (b) common land model (CLM); (c) Mosaic; (d) Noah; (e) variable infiltration capacity (VIC) over the Korean Peninsula.
Figure 10.
Comparison of the satellite-based discharge and LSM-based discharge; (a) Satellite-CLM; (b) Satellite-Mosaic; (c) Satellite-Noah; (d) Satellite-VIC.
Figure 10.
Comparison of the satellite-based discharge and LSM-based discharge; (a) Satellite-CLM; (b) Satellite-Mosaic; (c) Satellite-Noah; (d) Satellite-VIC.
Figure 11.
Comparison of the satellite-based discharge, model-based discharge (CLM and PRMS), and in situ discharge sum of the five major river basins in South Korea.
Figure 11.
Comparison of the satellite-based discharge, model-based discharge (CLM and PRMS), and in situ discharge sum of the five major river basins in South Korea.
Figure 12.
Scatter plots of discharge results, (a) Satellite-CLM; (b) Satellite-PRMS; (c) Satellite-in situ.
Figure 12.
Scatter plots of discharge results, (a) Satellite-CLM; (b) Satellite-PRMS; (c) Satellite-in situ.
Table 1.
Characteristics of major river basins in the Korean Peninsula.
Table 1.
Characteristics of major river basins in the Korean Peninsula.
| Country | Basin | Watershed Area (km2) | Channel Reach (km) | Slope (%) |
|---|
| North Korea | Amnok River | 32,557.70 (64,739.00) 1 | 803.00 | N/A |
| Tuman River | 10,565.00 (32,920.00) 1 | 547.80 | N/A |
| Daedong River | 20,247.00 | 450.30 | N/A |
| Cheongcheon River | 9,952.60 | 217.00 | N/A |
| Yeseong River | 3,916.30 | 187.40 | N/A |
| Geumya River | 2,200.50 | 145.10 | N/A |
| South Korea | Han River | 34,428.10 (26,219.00) 2 | 482.98 | 39.05 |
| Nakdong River | 23,690.32 | 511.01 | 37.03 |
| Guem River | 9,914.02 | 388.00 | 32.20 |
| Seomjin River | 4,914.32 | 222.00 | 37.50 |
| Youngsan River | 3,469.58 | 134.95 | 23.63 |
Table 2.
The data characteristics used in this study.
Table 2.
The data characteristics used in this study.
| Hydrological Component | Data | Temporal Resolution | Spatial Resolution |
|---|
| Terrestrial water storage anomaly | GRACE RL05 | Monthly | 1.0° |
| Terrestrial water storage changes |
| Evapotranspiration | MOD16 | 1 km |
| GLDAS v1 (CLM, Mosaic, Noah, VIC) | 1.0° |
| Precipitation | TMPA3B43V7 | 0.25° |
| Gauges | Point |
| Discharge | GLDAS v1 (CLM, Mosaic, Noah, VIC) | 1.0° |
| PRMS (South Korea) | Local |
| Gauges (South Korea) | Daily | Point |
Table 3.
The Global Land Data Assimilation System (GLDAS) v1 data description used in this study.
Table 3.
The Global Land Data Assimilation System (GLDAS) v1 data description used in this study.
| Data | Product Number | Name | Unit | Temporal Resolution |
|---|
| GLDAS v1 (CLM, Mosaic, Noah, VIC) | 065 | Total evapotransipration | Kg/m2/s | Past 3-hr average |
| 234 | Subsurface discharge | Kg/m2/s | Past 3-hr average |
| 235 | Surface discharge | Kg/m2/s | Past 3-hr average |
Table 4.
Description of time series data used for Empirical Orthogonal Function (EOF) analysis.
Table 4.
Description of time series data used for Empirical Orthogonal Function (EOF) analysis.
| Data | Number of Grid Points () | Time Period () |
|---|
| TMPA3B43V7 | 38 | 2003–2014 (144 months) |
| Satellite-based discharge | 38 | 2003–2014 (144 months) |
Table 5.
Trends, and annual and semi-annual amplitudes of hydrological components from January 2003 to December 2014.
Table 5.
Trends, and annual and semi-annual amplitudes of hydrological components from January 2003 to December 2014.
| Hydrological Component | Trend (mm/Month) | Annual Amplitude (A) (mm/Month) | Semi-Annual Amplitude (S) (mm/Month) | Ratio (S/A) | Goodness of Fit (r2) |
|---|
| GRACE-based TWSA | −9.29 * | 24.21 * | 5.56 * | 0.23 | 0.34 |
| GRACE-based TWSC | −0.43 | 12.39 | 2.82 | 0.23 | 0.29 |
| Evapotranspiration | MOD16 | 35.17 | 30.66 | 0.11 | 0.01 | 0.87 |
| CLM | 43.12 | 43.93 | 0.43 | 0.01 | 0.93 |
| Mosaic | 66.72 | 64.05 | 1.77 | 0.03 | 0.96 |
| Noah | 55.12 | 50.21 | 0.56 | 0.01 | 0.97 |
| VIC | 58.89 | 62.90 | 1.19 | 0.02 | 0.96 |
| Precipitation | TMPA3B43V7 | 105.97 | 105.62 | 5.07 | 0.05 | 0.60 |
| Gauge | 104.78 | 114.41 | 7.89 | 0.07 | 0.56 |
Table 6.
Statistical results of model-based discharge compared to satellite-based discharge in the Korean Peninsula.
Table 6.
Statistical results of model-based discharge compared to satellite-based discharge in the Korean Peninsula.
| Discharge | r (-) | Bias (mm/Month) | RMSE (mm/Month) | NSE (-) |
|---|
| CLM | 0.86 | 16.99 | 36.90 | 0.62 |
| Mosaic | 0.70 | −39.08 | 62.56 | 0.01 |
| Noah | 0.80 | −29.14 | 48.08 | 0.42 |
| VIC | 0.82 | −32.76 | 50.50 | 0.36 |
Table 7.
Seasonal amplitudes and phases of satellite- and model-based discharge.
Table 7.
Seasonal amplitudes and phases of satellite- and model-based discharge.
| Discharge | Annual Amplitude (mm/Month) | Annual Phase | Semi-Annual Amplitude (mm/Month) | Semi-Annual Phase |
|---|
| Satellite | 50.09 | −1.58 | 5.52 | −2.58 |
| CLM | 57.52 | −1.75 | 5.12 | −2.97 |
| Mosaic | 24.24 | −2.01 | 4.41 | 2.84 |
| Noah | 43.93 | −2.06 | 4.72 | −3.13 |
| VIC | 29.61 | −1.88 | 5.53 | 3.11 |
Table 8.
Statistical results of in situ discharge and model-based (CLM and Precipitation-Runoff Modeling System (PRMS)) discharge compared to satellite-based discharge.
Table 8.
Statistical results of in situ discharge and model-based (CLM and Precipitation-Runoff Modeling System (PRMS)) discharge compared to satellite-based discharge.
| Discharge | r (-) | Bias (mm/Month) | RMSE (mm/Month) | NSE (-) |
|---|
| In situ | 0.82 | −81.58 | 649.18 | 0.65 |
| PRMS | 0.88 | −157.62 | 782.38 | 0.74 |
| CLM | 0.72 | 515.65 | 742.08 | 0.17 |
© 2017 by the authors. Licensee MDPI, Basel, Switzerland. This article is an open access article distributed under the terms and conditions of the Creative Commons Attribution (CC BY) license (http://creativecommons.org/licenses/by/4.0/).
