3.1. Western Study Area
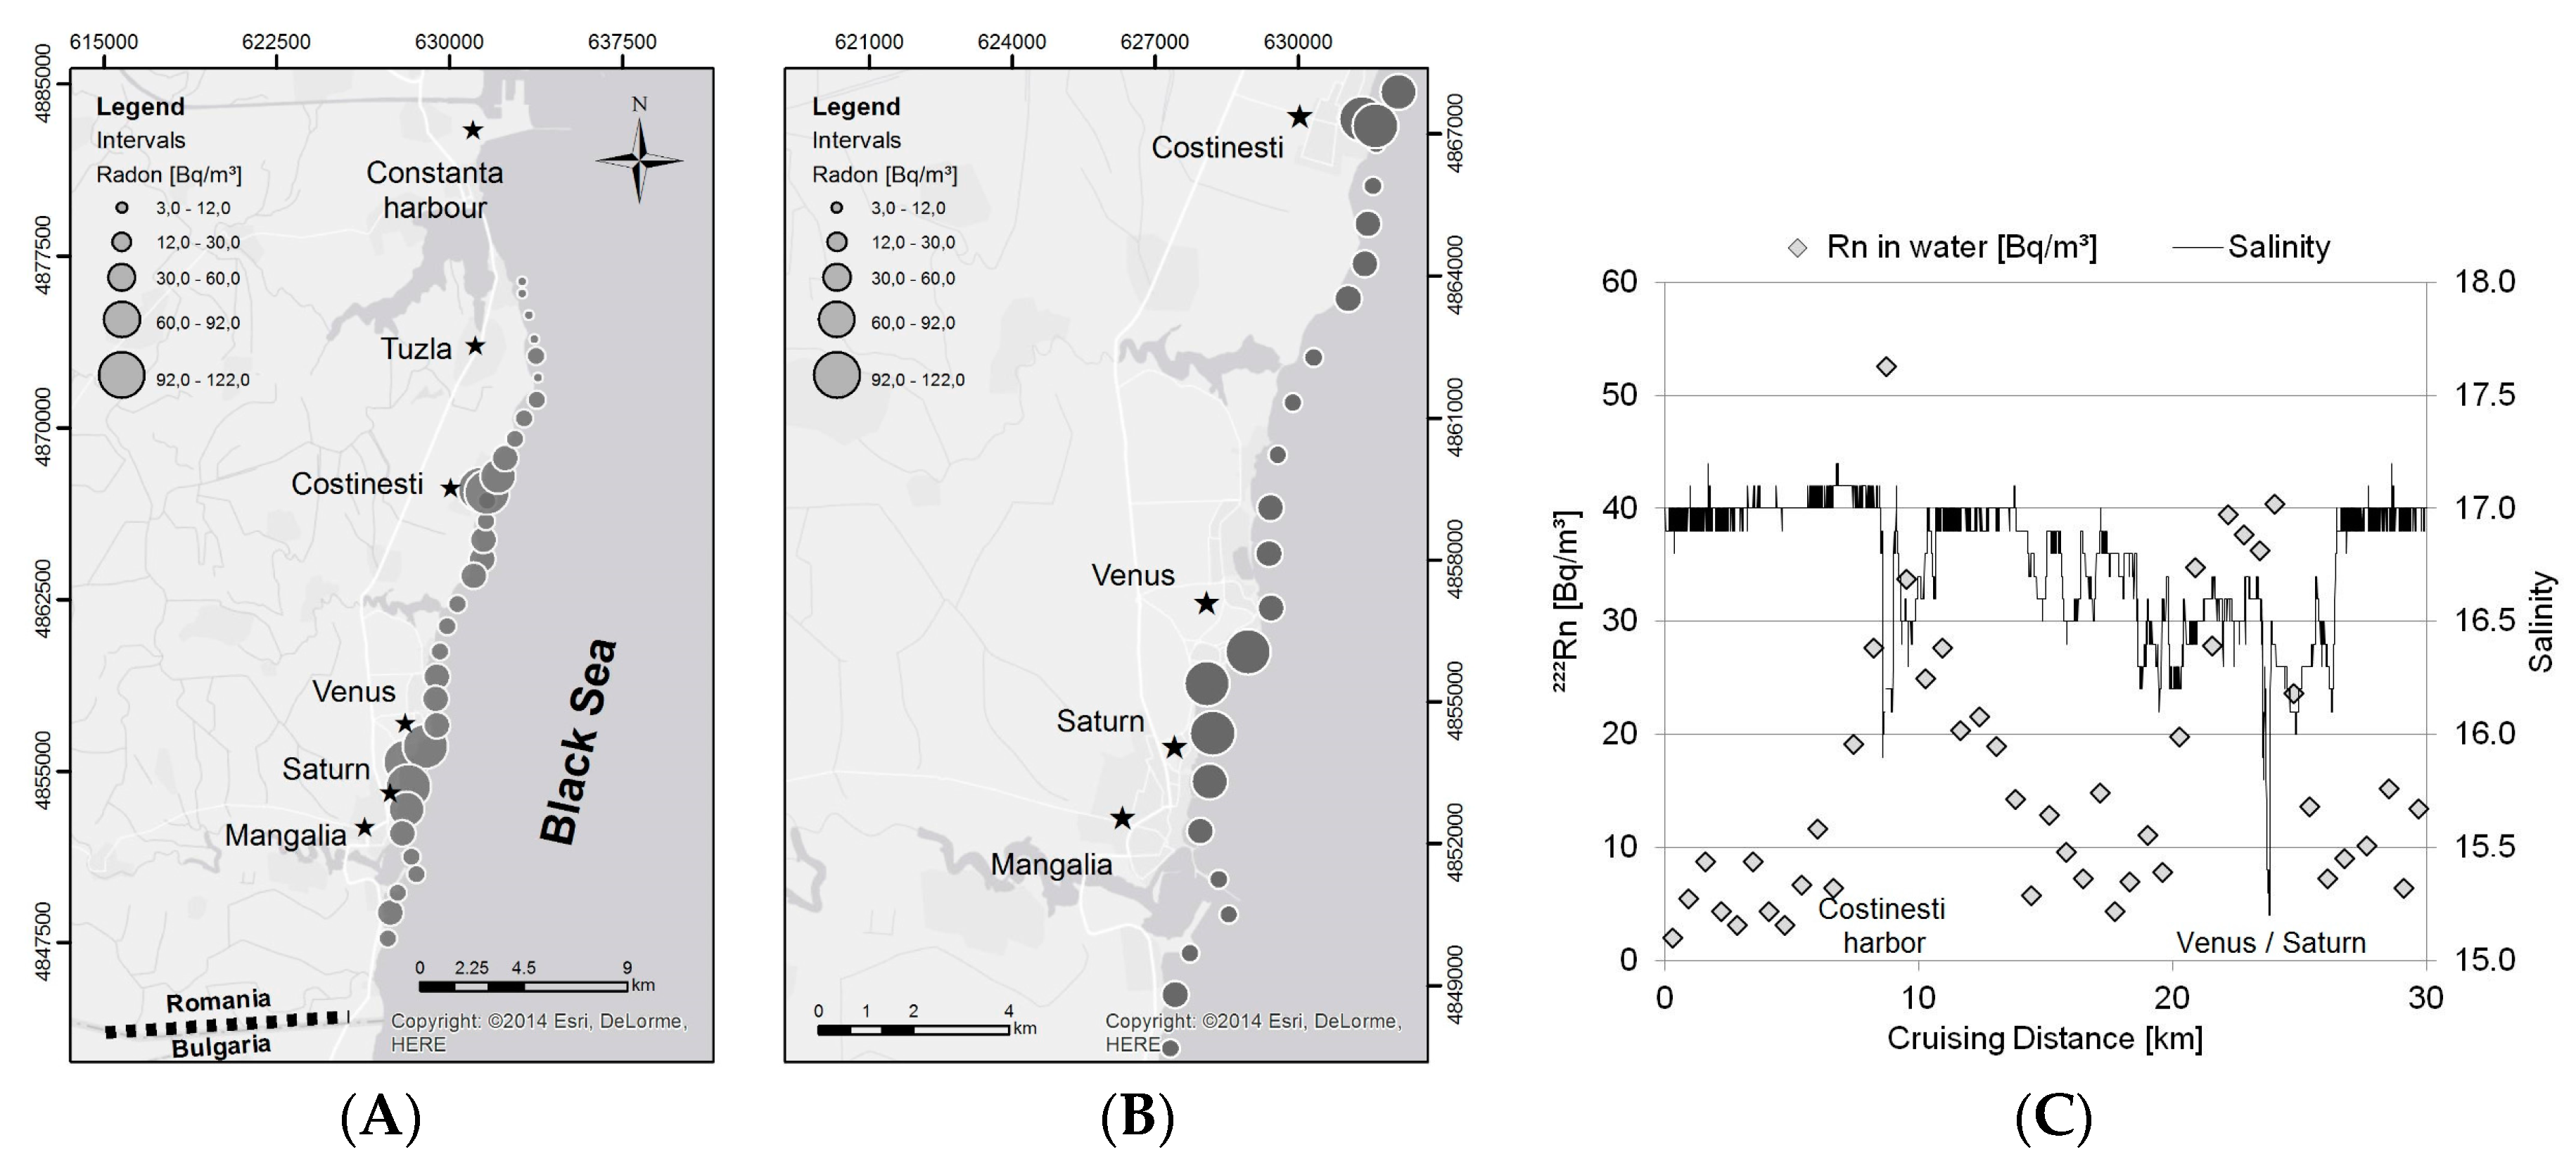
The sampling cruise carried out in May 2012 along the Romanian shore covered about 40 km of coastline between the southern end of the Constanta harbor structures and the southern outskirts of Mangalia (
Figure 2). During the campaign, the whole section was surveyed for both radon and salinity.
The offshore radon end-member (4 km off the coast) was detected to be 5 Bq/m3. However, no reliable terrestrial radon end-member could be determined since no groundwater monitoring wells were available close to the coastline. The springs and open water holes that were used for terrestrial end-member definition regarding salinity and stable isotopes were not appropriate for radon measurement due to the high likelihood of radon degassing.
Along the 40 km coastal profile, the radon concentration stayed for most parts around 10 Bq/m
3, i.e., slightly elevated in relation to the offshore end-member, thus indicating radon diffusion from the sediment pore water into the coastal sea. Still, at two sites, the data revealed significantly elevated radon concentrations of up to 110 Bq/m
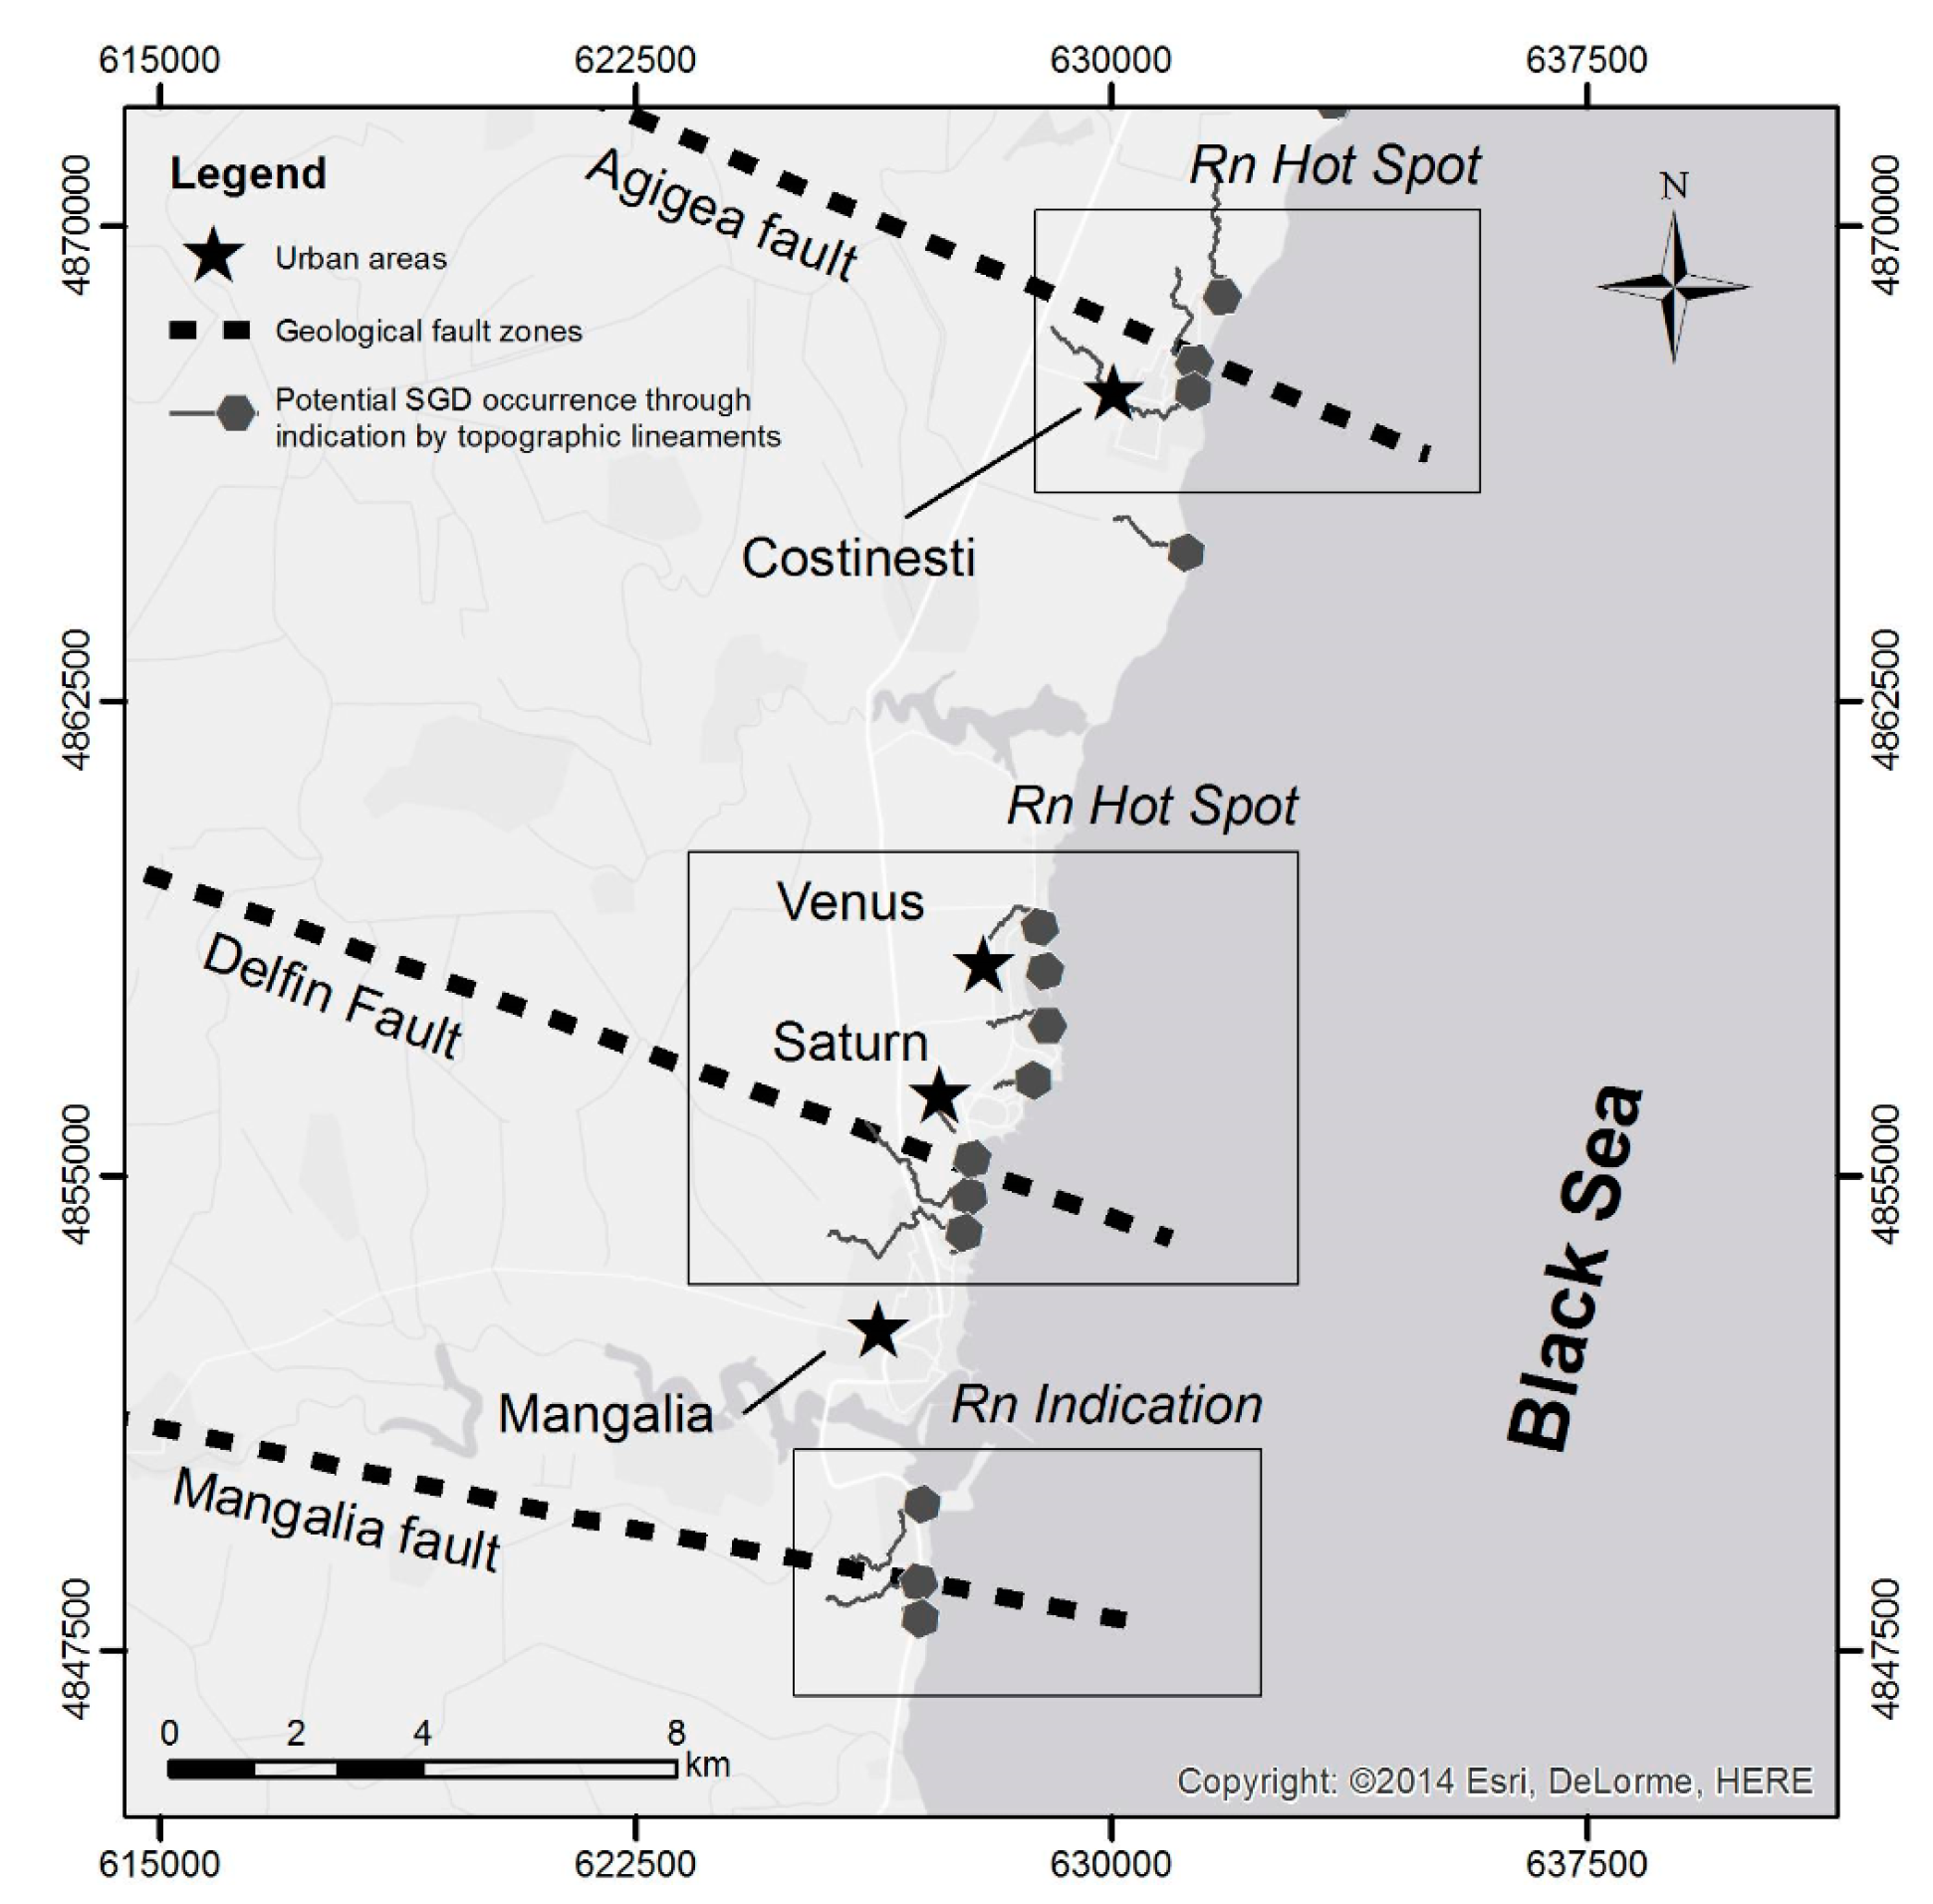
3. These two radon “hot spots” were detected in the area around Costinesti harbor and on the sandy bay between the beach settlements Venus and Saturn north of Mangalia. Besides these two distinct radon anomalies, a third area with elevated radon concentrations was found south of Mangalia. However, at this spot the detected concentration was only slightly elevated compared to the coastal average and supported by only one data point (
Figure 2).
Since the water depth below the boat was kept constant at about 4 m during the cruise, no dilution effect had to be taken into account for radon data evaluation. Radon evasion from the sea surface to the atmosphere was taken into account by measuring atmospheric radon and using wind speed data provided by a local weather station [
18]. The corrected radon data is illustrated in
Figure 2A and in more detail for Costinesti harbor and for the beach between Venus and Saturn in
Figure 2B. From the data, it was concluded that the two areas (Costinesti harbor and Venus/Saturn) are significantly influenced by SGD; a potential indication for SGD was present south of Mangalia.
The interpretation of the radon data was supported by the simultaneously recorded salinities. The offshore end-member for salinity was found to be 17.0. While background salinities of 16.5–17.0 were detected along most parts of the coastal profile, the values dropped locally at Costinesti harbor to 15.9 and on the beach between Venus and Saturn to 15.2 (
Figure 2C). The data show that salinity is generally suitable for supporting radon data interpretation. At the same time, it becomes obvious that salinity can hardly stand alone as a SGD indicator because the indication is not distinct enough.
Even though both radon and salinity clearly indicate two SGD hot spots, it is obvious that the radon pattern at Costinesti harbor is spatially limited compared to the Venus/Saturn peak. In order to verify the Costinesti anomaly by at least two radon data points, the cruising speed had been reduced to 2 km/h close to the harbor mouth. Still, the radon maximum shows sharp gradients towards the neighboring sampling locations, indicating a location of rather focused SGD close to the harbor structures. Considering comparable findings [
19,
20], the data suggests an anthropogenic impact on the coastal aquifer as a possible reason for the indicated locally increased SGD rate. It can be assumed that a perturbation of the local calcareous aquifer by the pilings of the harbor construction results in preferential flow paths, thereby producing a comparatively high groundwater seepage rate locally.
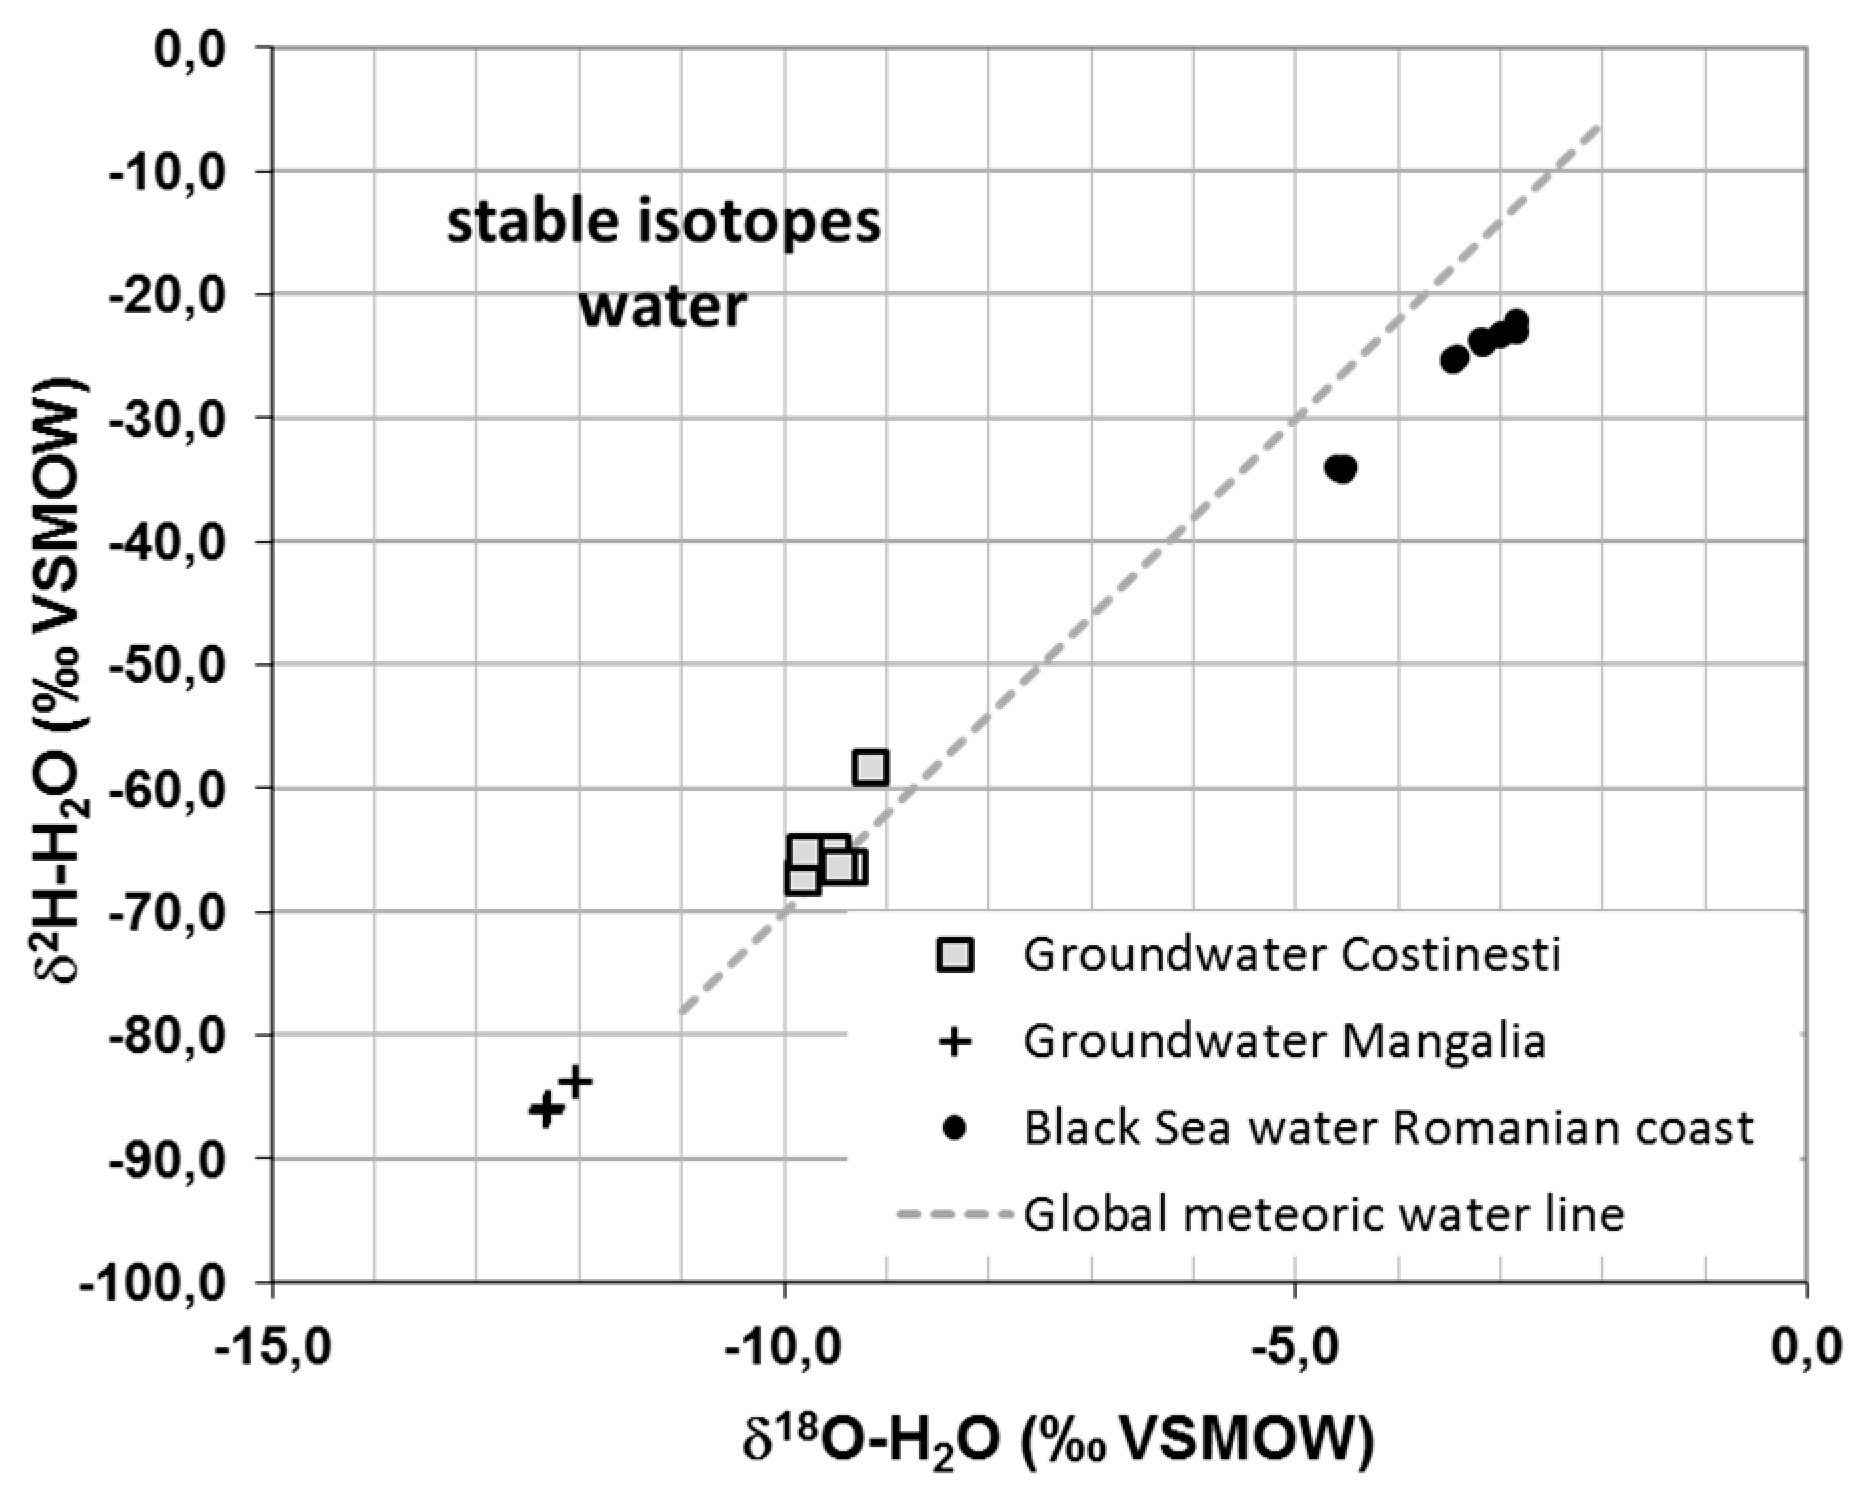
The Venus/Saturn peak, on the other hand, is not a man-made phenomenon but of geological origin. The beach is known for its hot spring, which indicates good hydraulic connection to a deep aquifer domain. This hydrogeological structure results in an elevated SGD rate. The assumption is supported by chemistry data of the groundwater sampled there. If the hot spring water parameters are compared to water taken from the sampling locations near Costinesti that are fed by the shallow aquifer, the differences become obvious (
Table 1). Furthermore, the stable isotope data indicate a different aquifer domain for the water from the hot spring (
Figure 3). A radon end-member could not be determined at the hot spring due to the high temperature of the water and the associated difficulties related to sample handling (degassing).
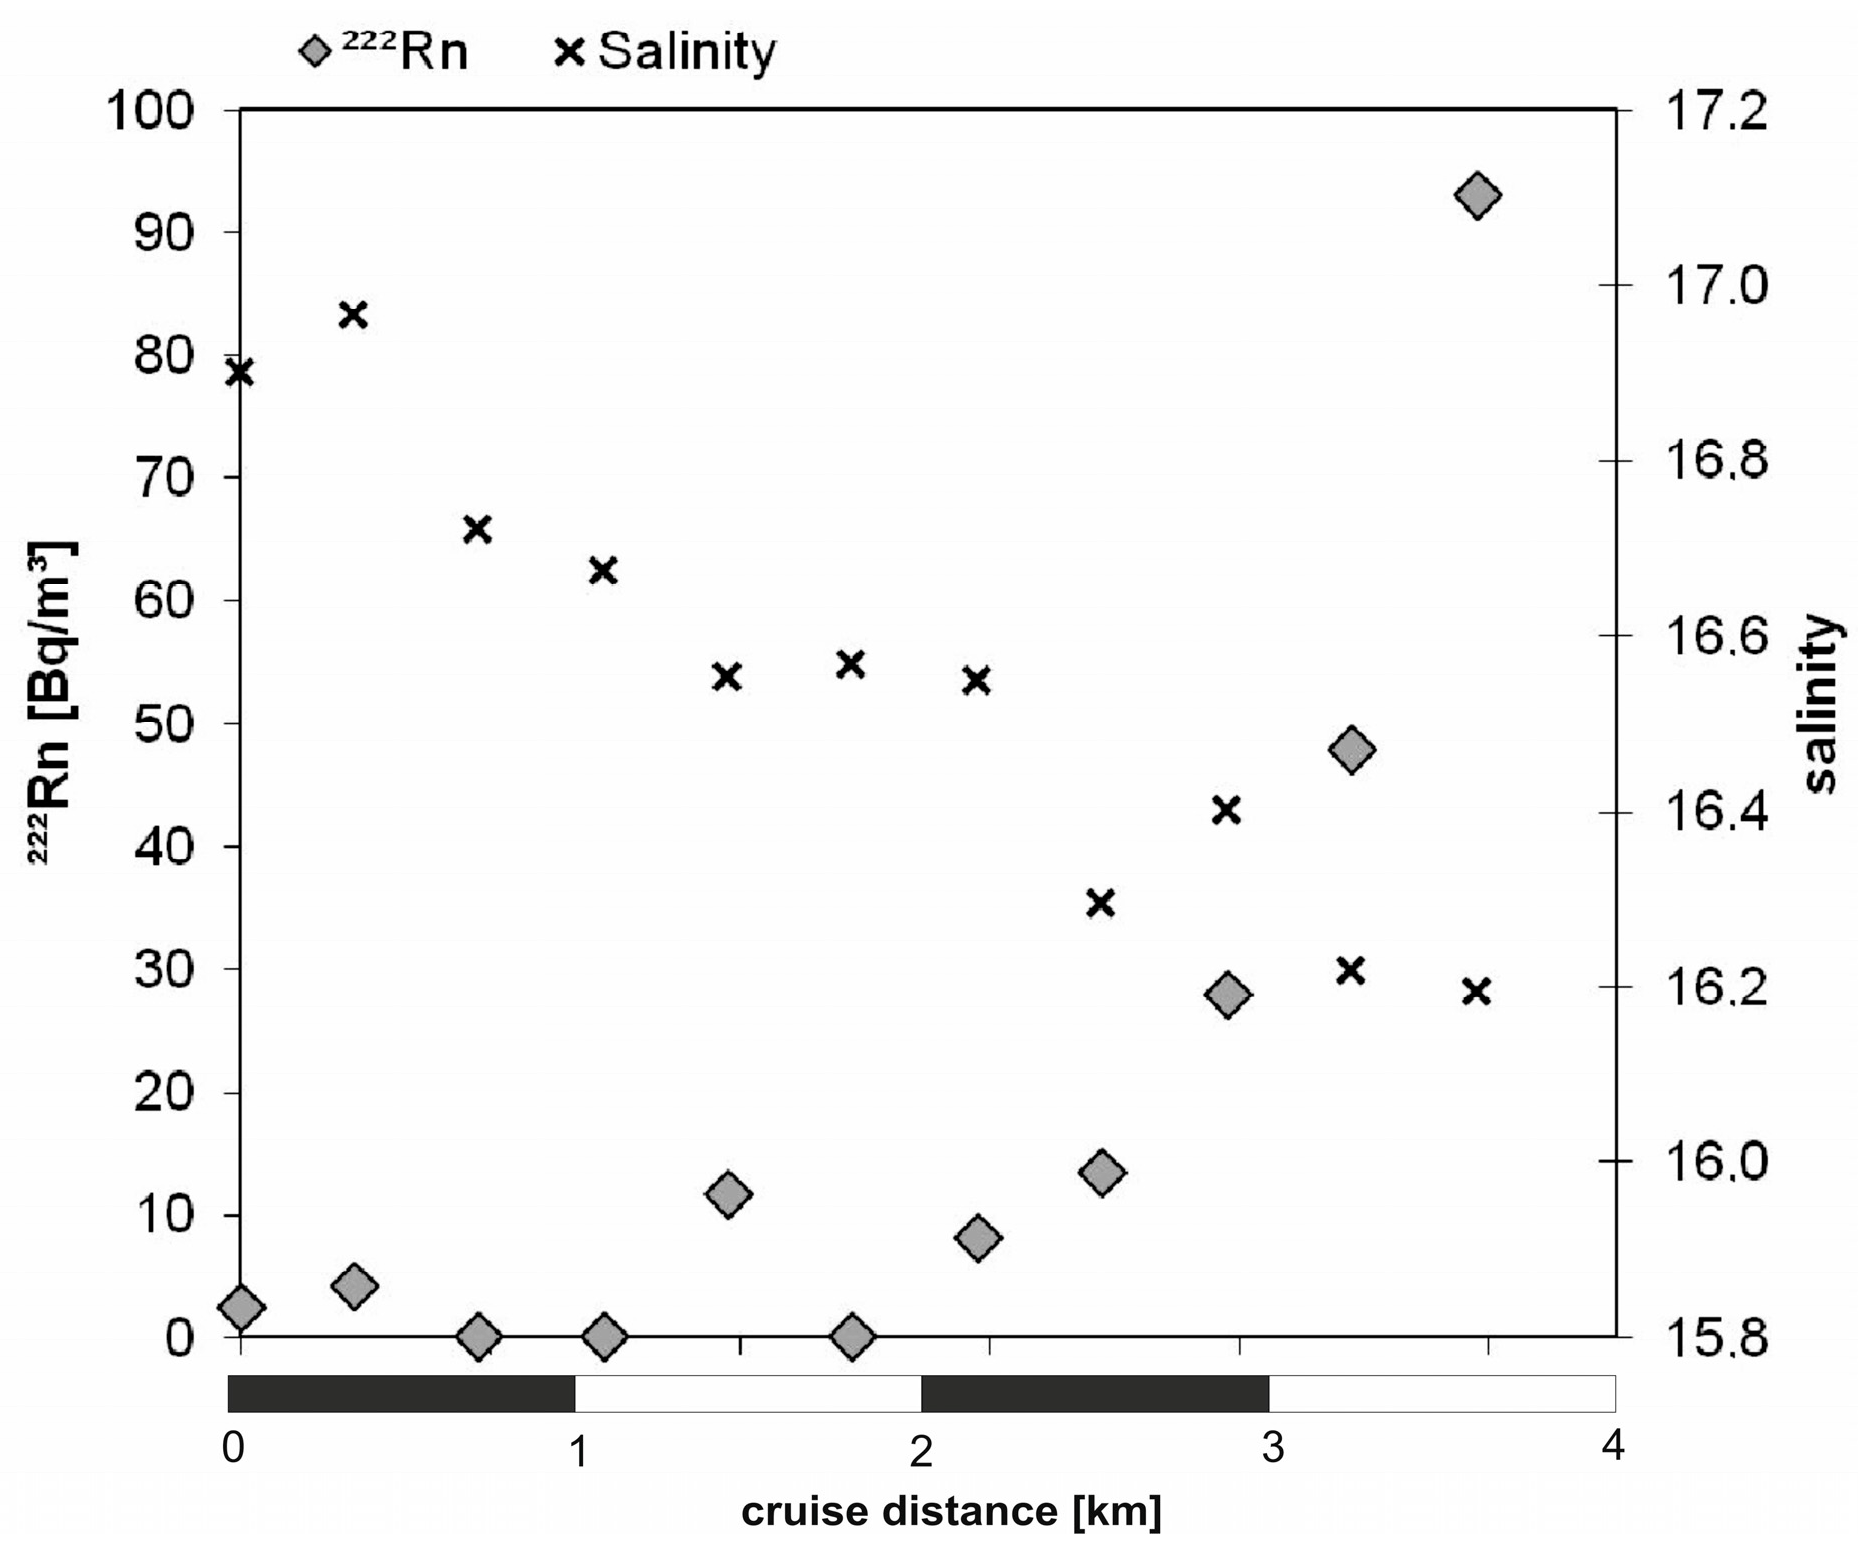
In order to validate the findings, an additional radon cruise was executed in September 2012. The survey focused on the SGD prone stretch of coastline north of Mangalia between the beach settlements of Venus and Saturn. The May results could be confirmed with the September data. The coastal profile between Mangalia in the south and Venus in the north showed again highest concentrations of up to 120 Bq/m
3 at the Venus/Saturn beach. Additionally to the coastal cruise, a profile perpendicular to the coast starting 4 km offshore and ending at the Venus/Saturn beach was measured during the September campaign. Along the profile, the offshore radon concentration ranged below 5 Bq/m
3 and started to rise gradually about 2 km off the beach, reaching its highest value of nearly 100 Bq/m
3 close to the beach. Along the same profile, salinities dropped from about 16.9 offshore to 16.2, thus also indicating SGD influence (
Figure 4).
The conclusions drawn for the coastline from the radon and salinity results were evaluated based on satellite data that covered a wider area both inland and seaward.
Figure 5 shows three major geological fault zones and a number of smaller morpho-structural lineaments that were derived from a geometric topography analysis using regional digital elevation models. Even though the agriculture dominated wider hinterland of the investigated coastal area is rather flat with an average elevation of ca. 50 m above sea level and a 21 m coastal cliff, the modeled lineaments indicate zones of preferential water accumulation. A group of water accumulation lines and one of the major fault zones (“Agigea Fault”) intersect with the shoreline in the vicinity of Costinesti harbor indicating an elevated probability of SGD within this area. As discussed above, SGD at this spot is most probably bound to a manmade perturbation of the local aquifer resulting in preferential groundwater flow paths. Still, water accumulation and preferential coast bound flow patterns in the connected hinterland add to the hydraulic pressure that triggers the local SGD hot spot. Another cluster of water accumulation lines and another major fault zone (“Delfin Fault”) intersect the coastline between Venus and Saturn and south of Saturn. As supported by the chemistry and stable isotope data discussed above, the hot spring present in this area is most likely linked to the fault zone. This indicates that the Venus/Saturn SGD hot spot is not preferentially supported by the inland hydraulic head of the upper aquifer (and hence not necessarily indicated by the associated water accumulation lines) but presumably originating from a deeper aquifer domain with a flow and pressure pattern completely independent from the local surface geography and upper hydraulic head distribution. A third fault system (“Mangalia Fault”) and a cluster of related water accumulation lines intersect the coastline south of Mangalia within the area that shows minor SGD signals as indicated by the radon distribution pattern.
In contrast to the satellite based geometric lineament analysis, the assessment of sea surface temperature distribution patterns in the coastal sea showed no results that were in line with the tracer based results. Costinesti harbor and the Venus/Saturn beach show normal SST ranges, thereby not indicating substantial SGD volumes. It can be concluded that the SST approach is not suitable for the western Black Sea target area since the SGD rates are not high enough to influence the SST pattern significantly.
3.2. Eastern Study Area
Three general SGD prone areas exist along the Georgian coastline [
1]: (i) the slope of the Greater Caucasus in the north-west essentially with focused SGD from karst systems; (ii) the central lowlands (Kolkheti region) mainly with diffuse SGD from alluvial deposits; and (iii) the south-eastern mountainous Adjara region preferentially with focused SGD from volcanic fissure systems discharging groundwater both close to the coast and deep offshore. The eastern project study area is located within the Adjara region. For this region [
1] expected SGD fluxes up to about 30% of the regional river water runoff, however, without stating any literature references, which makes it hard to evaluate these estimates.
The sampling campaign that was carried out in the Adjara region as part of the presented Black Sea study took place in October 2012 and covered 27 km of coastline starting 10 km north of Kobuleti (Natanebi River mouth) and ending about 3 km north of Batumi bay. The whole coastal section was surveyed for radon and salinity. Offshore end-members for all applied tracers (222Rn, salinity, δ18O, δ2H) were measured 4 km offshore. The measurements revealed radon and salinity end-members of 4 Bq/m3 and 17.5, respectively (for stable water isotope end-members see below). Terrestrial end-members were taken at springs, rivers and accessible wells. While all terrestrial sampling locations were suitable for the determination of stable isotopes and salinity, the resulting radon data is not satisfactorily reliable. The latter is due to the lack of trustworthy groundwater monitoring wells in the closer vicinity of the coast.
The background radon concentrations along the 27 km coastal profile stayed mainly below 25 Bq/m
3. In comparison to the offshore end-member, this value indicates minor diffuse SGD all along the profile, which can be attributed to the rather steep hydraulical gradient in the hinterland. In addition, two distinct areas with significantly elevated radon concentrations were mapped. The first area started at the northern city limits of Kobuleti and continued along the town beach and south of it for about 7 km; the second area was detected in the south of the surveyed stretch of coastline about 10 km north of Batumi bay close to the mouth of the Chakvi River (
Figure 6).
In the northern SGD zone, the highest radon concentrations of about 340 Bq/m
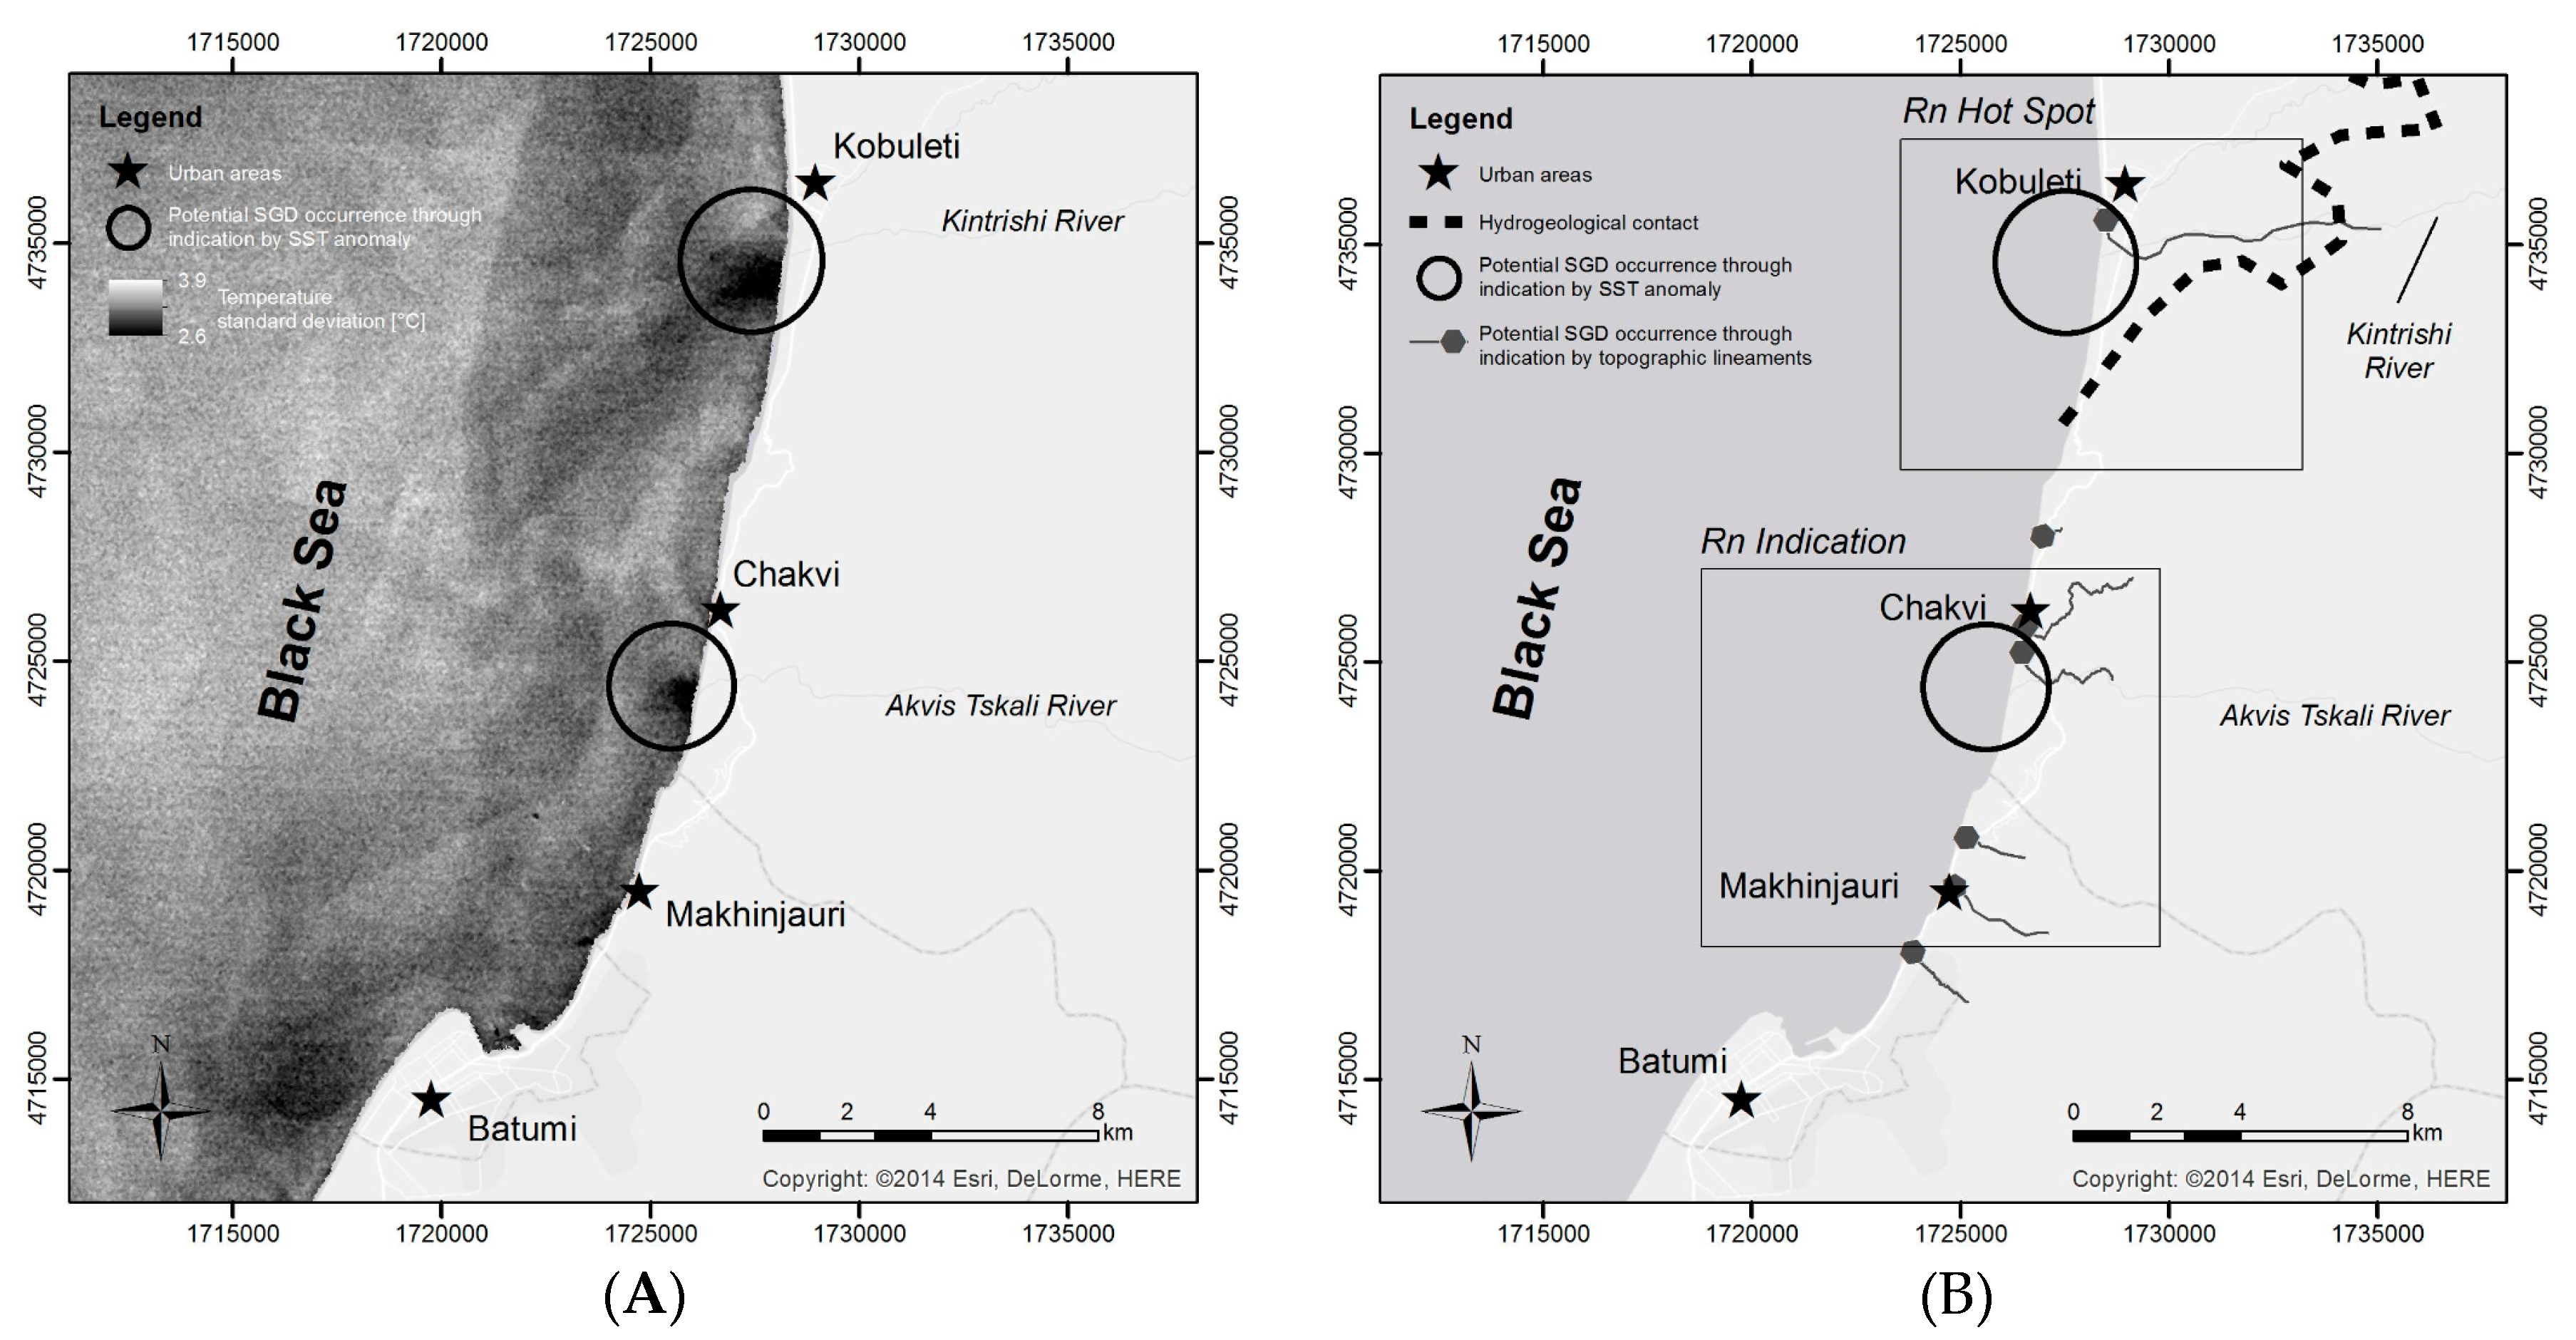
3 were recorded in the middle of the Kobuleti beach section. This section is characterized by major concrete pilings designed for stabilizing the beach and the immediately adjacent urban structures. As had been assumed for Costinesti harbor, the concrete pilings might have caused major disturbances of the natural structure of the shallow aquifer resulting in preferential groundwater flow paths thus triggering elevated SGD rates in the vicinity of the pilings. As mentioned above (and in contrast to Costinesti harbor), the Kobuleti hinterland shows noteworthy relief with elevations up to 300 m and hence a substantial hydraulic gradient. A distinct topographic lineament correlating with the Kintrishi River catchment and indicating water accumulation was identified in the area. The lineament intersects with the coastline at the Kobuleti beach potentially triggering SGD in this area (cf. Figure 8). Furthermore, a major hydrogeological contact between Middle Eocene volcanic rocks (basalts) of the Arsiani range in the southeast and unconsolidated Quaternary molasse in the northwest supports SGD in the Kobuleti area. The basaltic bedrock is outcropping southeast of Kobuleti and acts as a hydrogeological barrier that forces the groundwater to discharge into the sea in the Kobuleti region. These findings are comparable to a situation discussed for the region of Gordon’s Bay, False Bay, South Africa [
21].
In the southern SGD zone radon concentrations of up to 130 Bq/m
3 were detected (
Figure 6). No major manmade structures are present here. However, in the area, the coastline intersects with a cluster of distinct water accumulation lineaments suggesting natural groundwater accumulation and seaward flow path patterns as cause for elevated SGD rates in this area (cf. Figure 8).
The coastal cruise revealed salinity background values of about 17.3, i.e., values slightly below the offshore end-member of 17.5. Still, the salinities recorded along the coastal profile are not suitable for verifying the assumptions made based on the radon distribution pattern. On the one hand, the salinity did drop down to 4.8 at Kobuleti town beach and down to 9.1 north of Chakvi River mouth. On the other hand, the data cannot be attributed to SGD alone due to the river discharge. The salinities of the coastal sea that were found directly at the mouths of the Achkva (north) and Chakvi (south) rivers were 1.4 and 6.3, respectively.
In addition to radon and salinity, six samples were taken for measuring stable water isotope signatures in the coastal seawater. The samples were taken along a 4 km profile perpendicular to the beach. The profile ended about 1 km north of the Kobuleti town beach concrete structures. Closest to the coast, the signatures indicated a share of freshwater in the coastal seawater of up to 20%. Since the signatures of groundwater and upstream river water are identical, this share of freshwater also cannot be attributed to SGD alone; river water discharge has to be taken into account (
Figure 7). At the same time, it can be stated that the river water discharge is not at all dominating the signal since the water volume discharged by the rivers was, at the time of sampling, rather small. This only minor influence is reflected by a stable isotope signature measured in a river water sample that were taken upstream Achkva River in a distance of ca. 200 m from its mouth. These samples still revealed an 80% share of seawater (
Figure 7). Since no tidal forces are present in the Black Sea, the marine influence must be due to a very low water discharge rate of the Achkva River.
In contrast to the survey carried out at the Romanian coast, the two SGD zones that were localized in the Adjara region based on radon distribution patterns are also reflected in the SST distribution. The approach is based on the temperature standard deviation calculated per pixel from a set of eight SST images recorded during the hydrological winter. Zones of low SST variability that are conceptually indicating SGD were found directly south of Kobuleti and immediately south of the mouth of Chakvi River. The two areas, which show a rather diffuse but still significant SST indication, are illustrated in
Figure 8A,B. It has to be noted that the two SST indications were detected slightly south of the zones that showed the highest radon concentrations close to the Kobuleti and Chakvi Rivers (with offsets of about 600 and 200 m, respectively). Small scale ocean current patterns (available from the Ukrainian “Black Sea GOOS program” [
22]), which indicate a south bound current in the target area, can only be partially responsible for the observed patterns, since such coastal ocean current would result in a shift of both signals, radon and SST. The slight spatial offset between the two indications can be explained with the following assumption. Radon, which was sampled from a water depth of about 1 m, is an integral signal that represents more or less the complete 4 m water column. The SST signal, on the other hand, is only valid for the uppermost layer of that water column that are less than a millimeter in thickness. Hence, a difference in the drift velocity of the coastal water column on the one hand and the uppermost sea surface on the other hand, e.g., triggered by southward winds, would result in a spatial offset of the signals.
