Article

Dissipation of Micropollutants in a Rewetted Fen Peatland: A Field Study Using Treated Wastewater

1
Leibniz Centre for Agricultural Landscape Research (ZALF) e.V., Eberswalder Str. 84, 15374 Müncheberg, Germany
2
ECT Oekotoxikologie GmbH, Böttgerstr. 2-14, 65439 Flörsheim am Main, Germany
3
Department of Biology & CESAM, University of Aveiro, 3810-193 Aveiro, Portugal
*
Author to whom correspondence should be addressed.
Water 2017, 9(6), 449; https://doi.org/10.3390/w9060449
Submission received: 25 April 2017 / Revised: 7 June 2017 / Accepted: 12 June 2017 / Published: 21 June 2017

Abstract

:
In the present study, a mixture of treated wastewater and surface water was used to rewet a degraded fen peatland site during a three-year rewetting experiment. We studied the behavior and effects of micropollutants by means of hydrological, physico-chemical, microbiological and ecotoxicological monitoring. The highest concentrations of micropollutants in the treated wastewater were found for the pharmaceuticals carbamazepine and diclofenac, some metabolites, the sweetener acesulfame, tolyl- and benzotriazole and diatrizoate. In the underlying, shallow groundwater where treated wastewater application for rewetting had been expected to have the greatest impact due to seeping and evapotranspiration processes, only a sporadic occurrence of micropollutants was found. The influence of dilution by groundwater movements was examined by applying a geohydrological model. The sorption of micropollutants onto the peaty soil also played a role, as found for carbamazepine. Further processes such as photolysis, microbial decay under low redox conditions and plant uptake can be assumed to be relevant for the removal of many substances. Ecotoxicity tests with the soil before and after rewetting did not indicate any negative impact on the soil habitat quality by wastewater application, but clearly pointed at ecotoxicologically relevant geogenic arsenic concentrations at the study site. Although a positive effect on receiving surface water systems is expected if wastewater is applied on land instead of discharged to water bodies, the rewetted soil may turn into a sink for micropollutants in the long term. Hence, the findings of the present field study encourage further investigations in order to identify the governing processes in the elimination of micropollutants in rewetted peatlands flooded with treated wastewater.

1. Introduction

In Europe, improving water quality and counteracting water scarcity has become an increasingly important issue as reflected in the Blueprint to Safeguard Europe’s Water Resources released by the European Commission in 2012 [1]. One of the key topics addressed in this communication is the evaluation of the reuse of treated wastewater for irrigation or industrial purposes, which is supposed to increase about 35–60% worldwide by the year 2025 in order to meet increasing water demand and to reuse nutrients within the watershed. Another key topic of the European Commission Blueprint is the establishment of buffer strips that prevent or reduce pollution of water bodies by agrochemicals and nutrients applied to agricultural land. Buffer strips enhance the biological continuity between rivers and adjacent land, which supports the biodiversity and soil fertility of wetlands and riparian areas. Lowland peatlands can be considered as buffer zones because they link terrestrial and aquatic environments [2]. They retain nutrients when peat is growing, preserve carbon in their organic matter and store water within their organic layers. Therefore, the natural functions of wetlands are considered an important ecosystem service [3]. Because of high fertility of these organic soils, peatlands have been drained and agriculturally used for centuries. However, mineralization of the organic matter sets on once the peat is drained and exposed to oxygen. Drained peatlands thereby start releasing CO2 and other gases into the air rather than act as natural carbon storage. In addition, metals and other chemicals previously bound in the organic matter can be mobilized and leach into the groundwater [4]. To rehabilitate the natural functions of peatlands, the restoration of waterlogged, anaerobic conditions is essential. Simply blocking drainage outlets is not sufficient, but surplus water is required to keep a high groundwater table especially in regions with a negative water budget [5]. This surplus water could be supplied in the form of treated wastewater.
In this context, the present study aimed to investigate the fate and effects of micropollutants introduced via application of treated wastewater to organic waterlogged peatland with regard to the soil as well as the adjacent surface water and groundwater. A hypothetical scheme of processes related to rewetting peatlands with treated wastewater instead of directly discharging it from the wastewater treatment plant (WWTP) into the receiving surface water is illustrated in Figure 1.
During recent decades, the occurrence of substances such as pharmaceuticals and personal care products at low concentrations (so-called micropollutants) in treated wastewater has been increasingly documented and raised concern about the impacts on the quality of receiving surface water and groundwater [6,7,8,9]. In dependence of their chemical structure, some micropollutants are well eliminated by wastewater treatment, whereas recalcitrant pollutants are released into receiving water bodies with the WWTP’s effluent [10]. In the case of beta blockers and psycho-active drugs, for example, less than 60% removal during conventional wastewater treatment has been reported [11]. A further reduction of the micropollutant concentration in the effluent can be achieved using constructed wetlands via several processes [12]: (a) photodegradation under UV light and volatilization; (b) sorption to soil and sediment particles; (c) biodegradation under oxic and anoxic conditions; and (d) plant uptake (Figure 1).
While both sorption to sediments and photodegradation play a major role in the removal of micropollutants, biodegradation is recognized as the dominant mechanism in constructed wetlands for wastewater treatment via phytoremediation [13]. The interaction between the plants, substrate and associated microbial communities, as well as the mixture of micropollutants, triggers the removal and transformation processes [14,15]. Wetland plant communities (e.g., Phragmites australis and Typha latifolia) contribute to the removal of micropollutants either by direct uptake or by enabling aerobic degradation by pumping oxygen into the wet ground via their aerenchym [16]. In contrast to constructed wetlands with a typically coarse sandy bottom layer and high hydraulic conductivity, the mineral soils of naturally grown wetlands like peatlands are covered by peaty layers with high organic matter content (> 30%) that consist of a wide range of humic substances such as lignines, fulvic acids and humic acids. The peaty soil pore water is characterized by an extremely low redox potential, sometimes falling below −200 mV [17]. Therefore, the conditions are mostly anoxic within the groundwater-saturated and capillary zones, with seasonal trends in the upper horizons [18]. These conditions can favor the anaerobic, though rather slow microbial degradation of otherwise recalcitrant micropollutants [19].
With respect to the passage of treated wastewater through the soil, batch and soil column experiments are commonly used to estimate sorption parameters, and microcosm experiments used to investigate plant uptake [20,21]. While standard laboratory experiments with defined boundary conditions yield comparable results, their extrapolation to real field conditions characterized by heterogeneous soil layers and accompanying physico-chemical properties, specific hydrological and climatic conditions, and diverse communities of microorganisms and plants is challenging and may considerably deviate from the findings of actual field-scale investigations [22].
In the present study, we monitored a rewetting experiment carried out on a fen peatland area over a period of three years. To rewet the fen peat, treated wastewater was mixed with surface water and distributed over the vegetated area after the water level in the adjacent ditches was elevated by blocking the flow with weirs. The additional water input by flooding was necessary for rewetting to compensate for the high evapotranspiration losses. Results of the hydrological, geochemical and ecotoxicological monitoring were combined with those of the geohydraulic modeling of the groundwater flow pathways and of the retention time [5]. The aim was to investigate the behavior of wastewater-borne micropollutants within the aerobic/anaerobic passage along the streamlines to the adjacent surface water, as shown in Figure 1, and assess potential ecotoxicological long-term impacts on soil organisms.

2. Materials and Methods

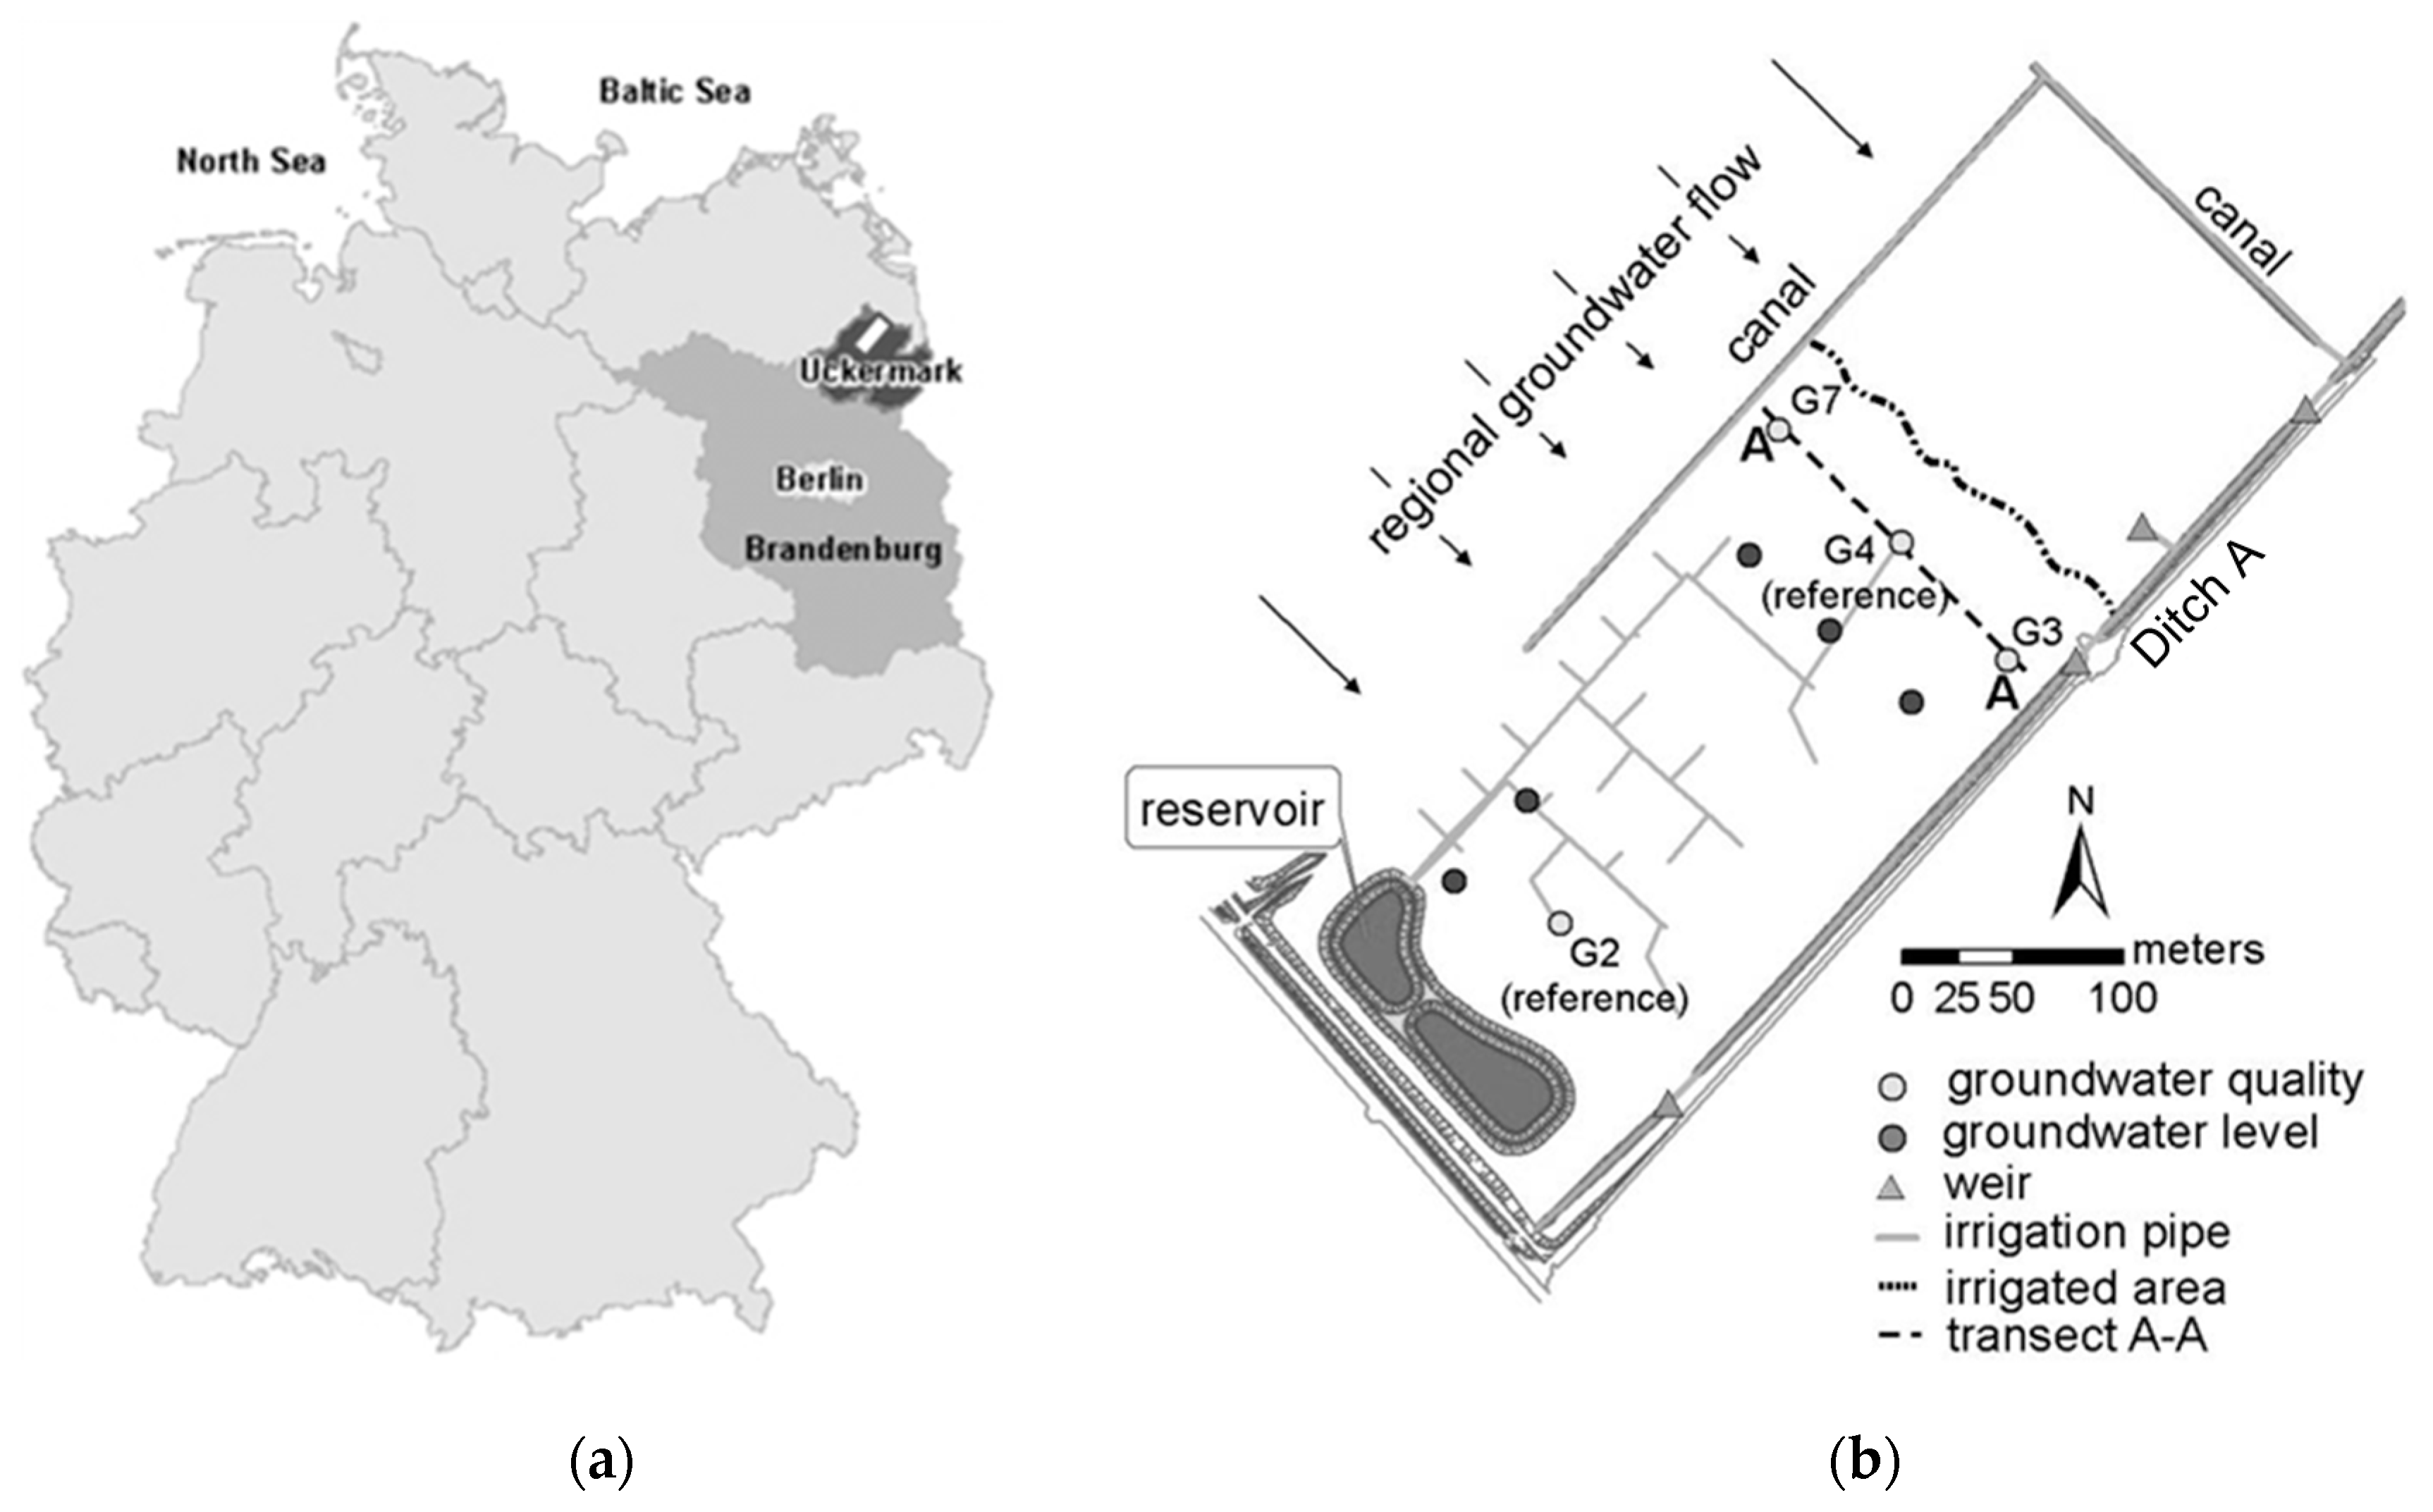
2.1. Study Site Description

The study site is situated in the northern part of the Federal State of Brandenburg, Germany. It is located in the Randow-Welse valley (53°06′ N, 14°01′ E), which covers 2800 ha of fen peatland (Figure 2a,b). Throughout the fen area, the groundwater level is controlled by ditches and weirs that act in two directions—to retain water during the dry season and to drain during times of excess water. The peat soils are highly decomposed and degraded. In 1997, we started a pilot project for peatland restoration on an 8-hectare site—the Biesenbrow pilot site [5]. Used for intensive corn production until 1977, then as grassland up to 1997, the area has been covered with reed (Phragmites australis) ever since. A peat forming process was re-initiated following years of peat degradation with peat consolidation, subsidence and shrinkage during the intensive land use period. This was demonstrated by topographical surveys in 1997 and 2011 [23].
The fen peat cover has a mean thickness of 60 cm and a maximum thickness of up to 150 cm. The peat soil is classified as ombric Histosol [24]. According to German guidelines for soil mapping [25], the soil horizons are labeled as follows: the topsoil horizon (approximately 15 cm) is formed by a strongly decomposed peat soil horizon (nHm—peat earthified horizon) underlain by a segregated structured peat soil horizon (approximately 15 cm) with coarse to fine polyhedrons (nHa—peat aggregate horizon). Then comes a peat soil shrinkage horizon (nHt—peat shrinkage horizon, approximately 40 cm) and a horizon of reed and sedge derived peat which was not affected by pedogenesis due to its position permanently below the groundwater table (nHr—peat horizon, permanently below the groundwater table). The subsoil consists of a mud soil horizon and a mineral soil horizon made up of middle-fine sands [18].
For peat rewetting, the pilot site was adapted to high water tables by installing plank weirs and a slight embankment to avoid surface runoff into the ditch if water levels for rewetting are higher than the soil surface. To establish near-surface water tables, the area was flooded with surplus water pumped from the ditch into an elevated water reservoir and distributed by an aboveground pipe network. Before starting the flooding with treated wastewater, the twenty-year-old Phragmites australis stands were harvested, leaving the soil surface with only a low plant cover.

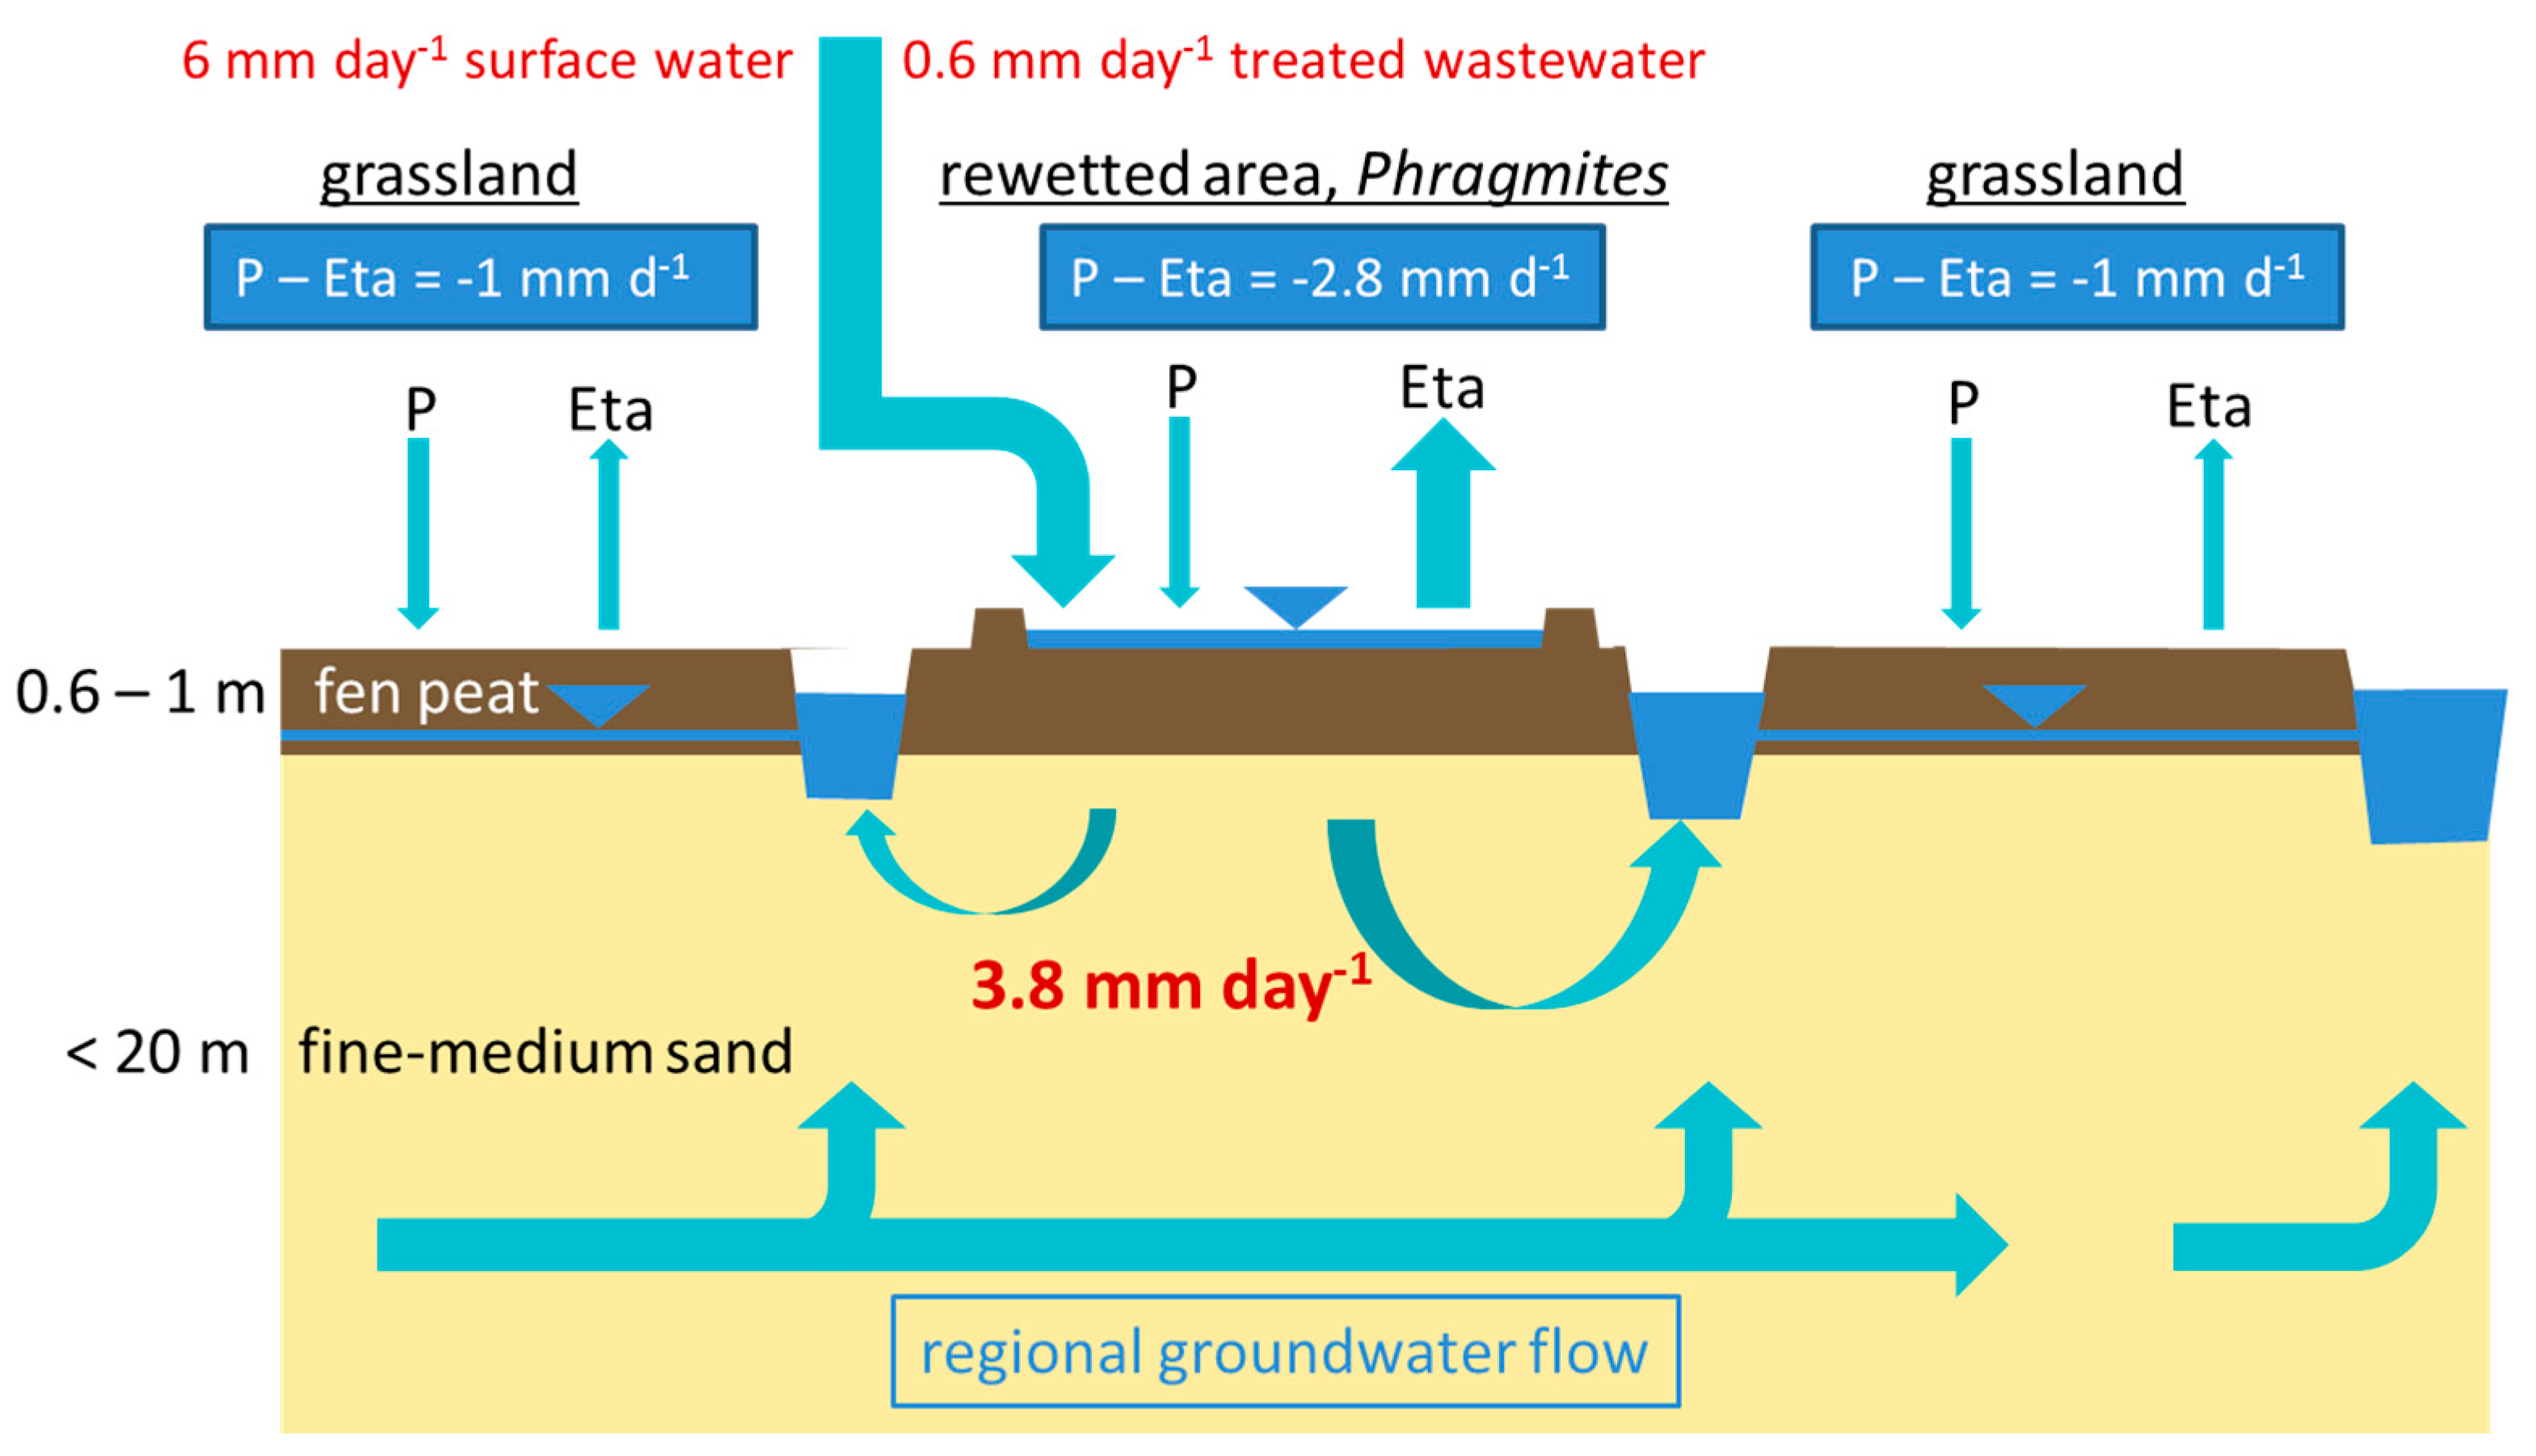
2.2. Flooding Regime

In order to rewet the peatland, a daily surplus water rate of approximately 6.6 mm was necessary according to the hydrological budget to compensate for the evapotranspiration losses (2.8 mm) as well as for the geohydraulic losses for exfiltration into the ditch and into adjacent areas downstream (3.8 mm), which have a lower groundwater table [17] (Figure 3). A boundary condition for the geohydraulic losses is the assumption of a daily water deficit of 1 mm in the surrounding grassland areas (P—Eta) [26]. For peat conservation and peat forming processes as well as for carbon sequestration, a near-surface groundwater table is required. With respect to rewetting, surplus water was necessary to compensate for the decrease of the landscape water budget since the last peat forming era. This was provoked by both, climatic changes over the last millennia as well as anthropogenic interventions by landscape water management within the Randow-Welse valley (e.g., land reclamation activities).
Because of the high priority of groundwater protection defined in the German Groundwater ordinance [27], and gaps in our knowledge of the matter transformation function of waterlogged organic soils, government permission for rewetting with treated wastewater was only granted provided the treated wastewater was diluted with surface water. Thus, a 1:10 mixture of treated wastewater and surface water was used to rewet a privileged flooding area of 5 ha at approximately 6.6 mm day–1, corresponding to 300 m3 surface water and 30 m3 treated wastewater per day, during the vegetation period in 2011, 2012, and 2013 (May to October).
The treated wastewater was obtained from a small municipal WWTP in this rural region (3100 population equivalents; mechanical, biological, and activated sludge treatments; and discharge 68,000 m3 year–1) and was transported to the pilot site every working day. The treated wastewater was injected into the water reservoir close to the outlet into the surface pipelines.

2.3. Monitoring Program

A hydrological and chemical monitoring system was installed at the pilot site (Figure 2b) comprising 12 groundwater-table observation wells, 7 observation plots for groundwater chemistry as nested Teflon wells at depths of 2 m, 4 m, and 6 m below soil surface, 3 sampling points for surface water chemistry and redox sensors (made by UGT Umwelt-Geräte-Technik GmbH, Müncheberg, Germany) to continuously record the redox potential at a depth of 1 m below soil surface. The groundwater table depths were measured manually once a week for all groundwater table observation wells and, additionally, continuously by the logger at G3. Groundwater chemistry analyses were performed during the vegetation periods in 2011, 2012 and 2013 at 20 sampling dates in total. The results of groundwater chemistry have been published in Maassen et al. [5].
In order to calculate both the dilution ratio of surplus water with groundwater and the residence time, geohydraulic modeling was conducted using FEFLOW (Version 6.1, DHI-WASY GmbH, Berlin, Germany) [28]. We calculated the mass transport at reference plot G4 using ditch water levels, regional groundwater levels and the evapotranspiration rates of the rewetted area and the adjacent grasslands as boundary conditions. To increase the probability of detecting the micropollutants in the groundwater zone and considering the groundwater flow dynamics, two reference sites were installed that had a direct supply pipeline (Figure 2b), imitating a point source setting as a worst-case scenario. Additionally, the locations of the reference plots were chosen according to the expected, previously modeled groundwater streamlines, near the groundwater divide where no-flux boundary conditions prevail. This means that the groundwater flow velocities at the reference plots are at a minimum; a more vertical groundwater movement is expected, hence they can be assumed to have the highest concentration of pollutants.
In 2011 and 2014, just before and after the period of rewetting with treated wastewater, respectively, soil samples and undisturbed soil cores at different depths were taken at the reference plots G4 (Figure 2b) and analyzed with respect to physicochemical soil properties (C, N, Fe, bulk density Db). The bulk density Db was analyzed on an oven-dry basis (105 °C). The soil’s metal contents (Fe, As, Cd, Zn, Ni, Cu, Cr and Pb) were analyzed using ICP (HORIBA Jobin Yvon Inc., Palaiseau, France) after an Aqua Regia digestion, and the contents of C and N were determined using a Leco-CNS2000 analyzer (LECO Corporation, St. Joseph, Michigan, USA). In the period of 2011–2013, soil microbial activities were assayed at the reference plot G4 for the three upper soil horizons nHm, nHa, and nHt. The enzyme activities of FDA hydrolase (FDA—fluorescein diacetate) and beta-glucosidase were measured photometrically in line with Maassen and Balla [17].

2.4. Micropollutants in Water and Soil

For the micropollutant analysis, in total 36 samples of treated wastewater and groundwater from the reference plots G2 (4 m) and G4 (2 m) were taken at 14 sampling dates during the vegetation periods 2011–2013. The wastewater samples were taken on the same days as the groundwater samples. On the same days, surface water was sampled at the inlet weir and outlet weir of Ditch A (Figure 2). Additionally, soil samples were taken at the reference plots G2 and G4 in the soil horizons nHm and nHa in the spring of 2015, i.e., 15 months after the end of flooding with treated wastewater. All samples were cooled during transport to the laboratory, stored at 5 °C in the fridge and analyzed as soon as possible.
In the water samples, 67 micropollutants were analyzed: 2,4,5-T (2,4,5-trichlorophenoxyacetic acid), 2,4-D (2,4-dichlorophenoxyacetic acid), 2,6-DCBA (2,4-dichlorobenzoic acid), 4-hydroxydiclofenac, AA (4-aminoantipyrine), AAA (4-acetoaminoantipyrine), acesulfame, alachlor, AMDOPH (1-acetyl- 1-methyl-2-dimethylox-amoyl-2-phenyl-hydrazide), AMPH (1-acetyl-1-methyl-2-phenylhydrazide), atenolol, atrazine, bentazon, benzotriazole, bezafibrate, boscalide, bromacile, bromoxynile, carbamazepine, chlorfenvinphos, chloridazone, chlorpyrifos, chlortoluron, clofibric acid, desethyl-atrazine, desethyl-terbutylazine, desisopropyl-atrazine, diatrizoate, diazepam, dichlorprop, diclofenac, diuron, DMAA (dimethylaminoantipyrine), FAA (4-formylaminoantipyrine), isoproturon, lenacile, MCPA (2-methyl-4-chlorophenoxyacetic acid), mecoprop, meprobamate, metalaxyle, metamitrone, metazachlor, methyldesphenylchloridazone, metoprolol, metribuzine, oxazepam, PBSA (phenylbenzimidazole sulfonic acid), p,p-DDA (bis(chlorophenyl)acetic acid), pendimethaline, pentachlorphenole, phenazone, phenylethylmalonamide (PEMA), primidone, propranolol, propyphenazone, p-TSA+o-TSA (toluolsulfonamides), pyrithyldione, simazine, sotalol, SPS (N-(Phenylsulfonyl)sarcosine), TBP (tri-n-butylphosphate), TCEP (tris(2-chloroethyl) phosphate), TCPP (tris(1-chloro-2-propyl)phosphate), terbuthylazine, tolyltriazole, TPP (triphenylphosphate), and trimethoprim.
The chemical analysis of micropollutants in the water samples was carried out using liquid chromatography coupled with high resolution mass spectrometry (LC-HRMS) according to the methods described in Wode et al. [29]. The substances acesulfame, diatrizoate and PBSA were analyzed using liquid chromatography coupled with tandem mass spectrometry LC-MS/MS as described in Rühmland et al. [30]. TBP and TCPP were later excluded from the analysis as they were detected in all samples due to their usage as a plasticizer and flame retardant in plastics, respectively. To calculate mean values, concentrations below the limit of quantitation (LoQ) were considered as half the LoQ.
The soil samples were extracted by means of pressurized liquid extraction (PLE) using a mixture of water/methanol (50:50) and analyzed for micropollutants using LC-MS/MS according to the method described in Braguglia et al. [31]. The following micropollutants were analyzed in the soil: atenolol, benzotriazole, bezafibrate, carbamazepine, diatrizoate, diclofenac, diuron, isoproturon, mecoprop, metoprolol, oxazepam, and primidone.

2.5. Biotests with Soil before and after Flooding

Soil samples for biotesting were taken before the first rewetting period (April 2011) and after the third rewetting period (April 2014) to analyze the effects of repeated wastewater application on the soil habitat quality for terrestrial organisms. For this purpose, 20 kg of peat soil were sampled at sampling plot G4 at three depths: 0–15 cm (nHm horizon), 15–38 cm and 38–55 cm (nHa horizon). Soil samples were homogenized, air-dried for several days in the laboratory, sieved (4 mm) and stored at 4 °C in the dark until analysis. The maximum water holding capacity (WHCmax) and pH were determined for each soil sample. For the biotests, four test organisms were selected to represent different taxonomic groups and different trophic levels important for the terrestrial ecosystem: plants (oats, Avena sativa) as primary producers, bacteria (Arthrobacter globiformis) as destruents, and annelids (enchytraeids, Enchytraeus crypticus) and arthropods (springtails, Folsomia candida) as decomposers. The applied ecotoxicological tests are summarized in Table 1. In each biotest, all six soil samples were tested in parallel together with a laboratory control soil.
For the test with Avena sativa, the relative soil moisture was adjusted to 40% of the WHCmax and pots (9 cm diameter, 7.2 cm height) were filled with approximately 270 to 410 g dry weight depending on the soil. The sandy loam soil LUFA Sp2.3 [32], was used as a control. In each pot, 10 seeds were sown. Pots were bottom watered as necessary and a liquid fertilizer was supplied twice during the test. Seven days later (i.e., on Day 7), 50% of the seeds in the control had emerged, and the plants were reduced to 5 representative seedlings per pot. On Day 15, plants were harvested and the shoot biomass (fresh weight) per plant was determined.
For the test with Arthrobacter globiformis, the relative soil moisture was adjusted to 70% of the WHCmax. The loamy sand LUFA Sp2.2 [32] was used as a control. After 2 h of incubation with the bacterium and adding the fluorescence dye resazurin, the increase in dehydrogenase activity during 1 h (at intervals of 15 min to 45 min) was determined photometrically via the increase in the fluorescence of the formed resofurin.
For the test with Enchytraeus crypticus, the relative soil moisture was adjusted to 69% to 72% of the WHCmax (38% for control). As a control, artificial soil was used with a content of 69% quartz sand, 20% kaolin, 10% peat and 1% calcium carbonate. Each replicate vessel was filled with 20 g soil dry weight and 10 adult worms were inserted. After 28 days, the number of adults and juveniles was determined to assess the endpoints of survival and reproduction.
For the test with Folsomia candida, the relative soil moisture was adjusted to 69% to 72% of the WHCmax (38% for control). As a control, artificial soil (the same as with Enchytraeus crypticus) was used. Each replicate vessel was filled with 30 g soil fresh weight and 10 adult worms were inserted. After 28 days, the number of adults and of juveniles was determined to assess the endpoints of survival and reproduction of the first generation. To assess the effects on the second generation, 10 juveniles of comparable size were taken from each replicate and inserted into new test vessels. The survival and reproduction of the second generation was assessed on Day 28 (i.e., 56 days from the first test start).
For each endpoint, the results obtained for the six soils were transformed into the percentage of the results obtained in the respective laboratory control soil. This percentage (inhibition in relation to the laboratory control) was compared to the threshold value defined in guideline ISO 17616 [33] that indicates deteriorated soil habitat quality. Additionally, the performance of the tested organisms was tested for statistically significant differences between the soil sampled before (April 2011) and after the wastewater application (April 2014), separately for each horizon and each endpoint. Pair-wise t-tests were used for these comparisons after confirming normal distribution of errors (visual check) and variance homogeneity (Levene’s test). Here reported p-values from these t-tests were not corrected for multiple comparison.

3. Results

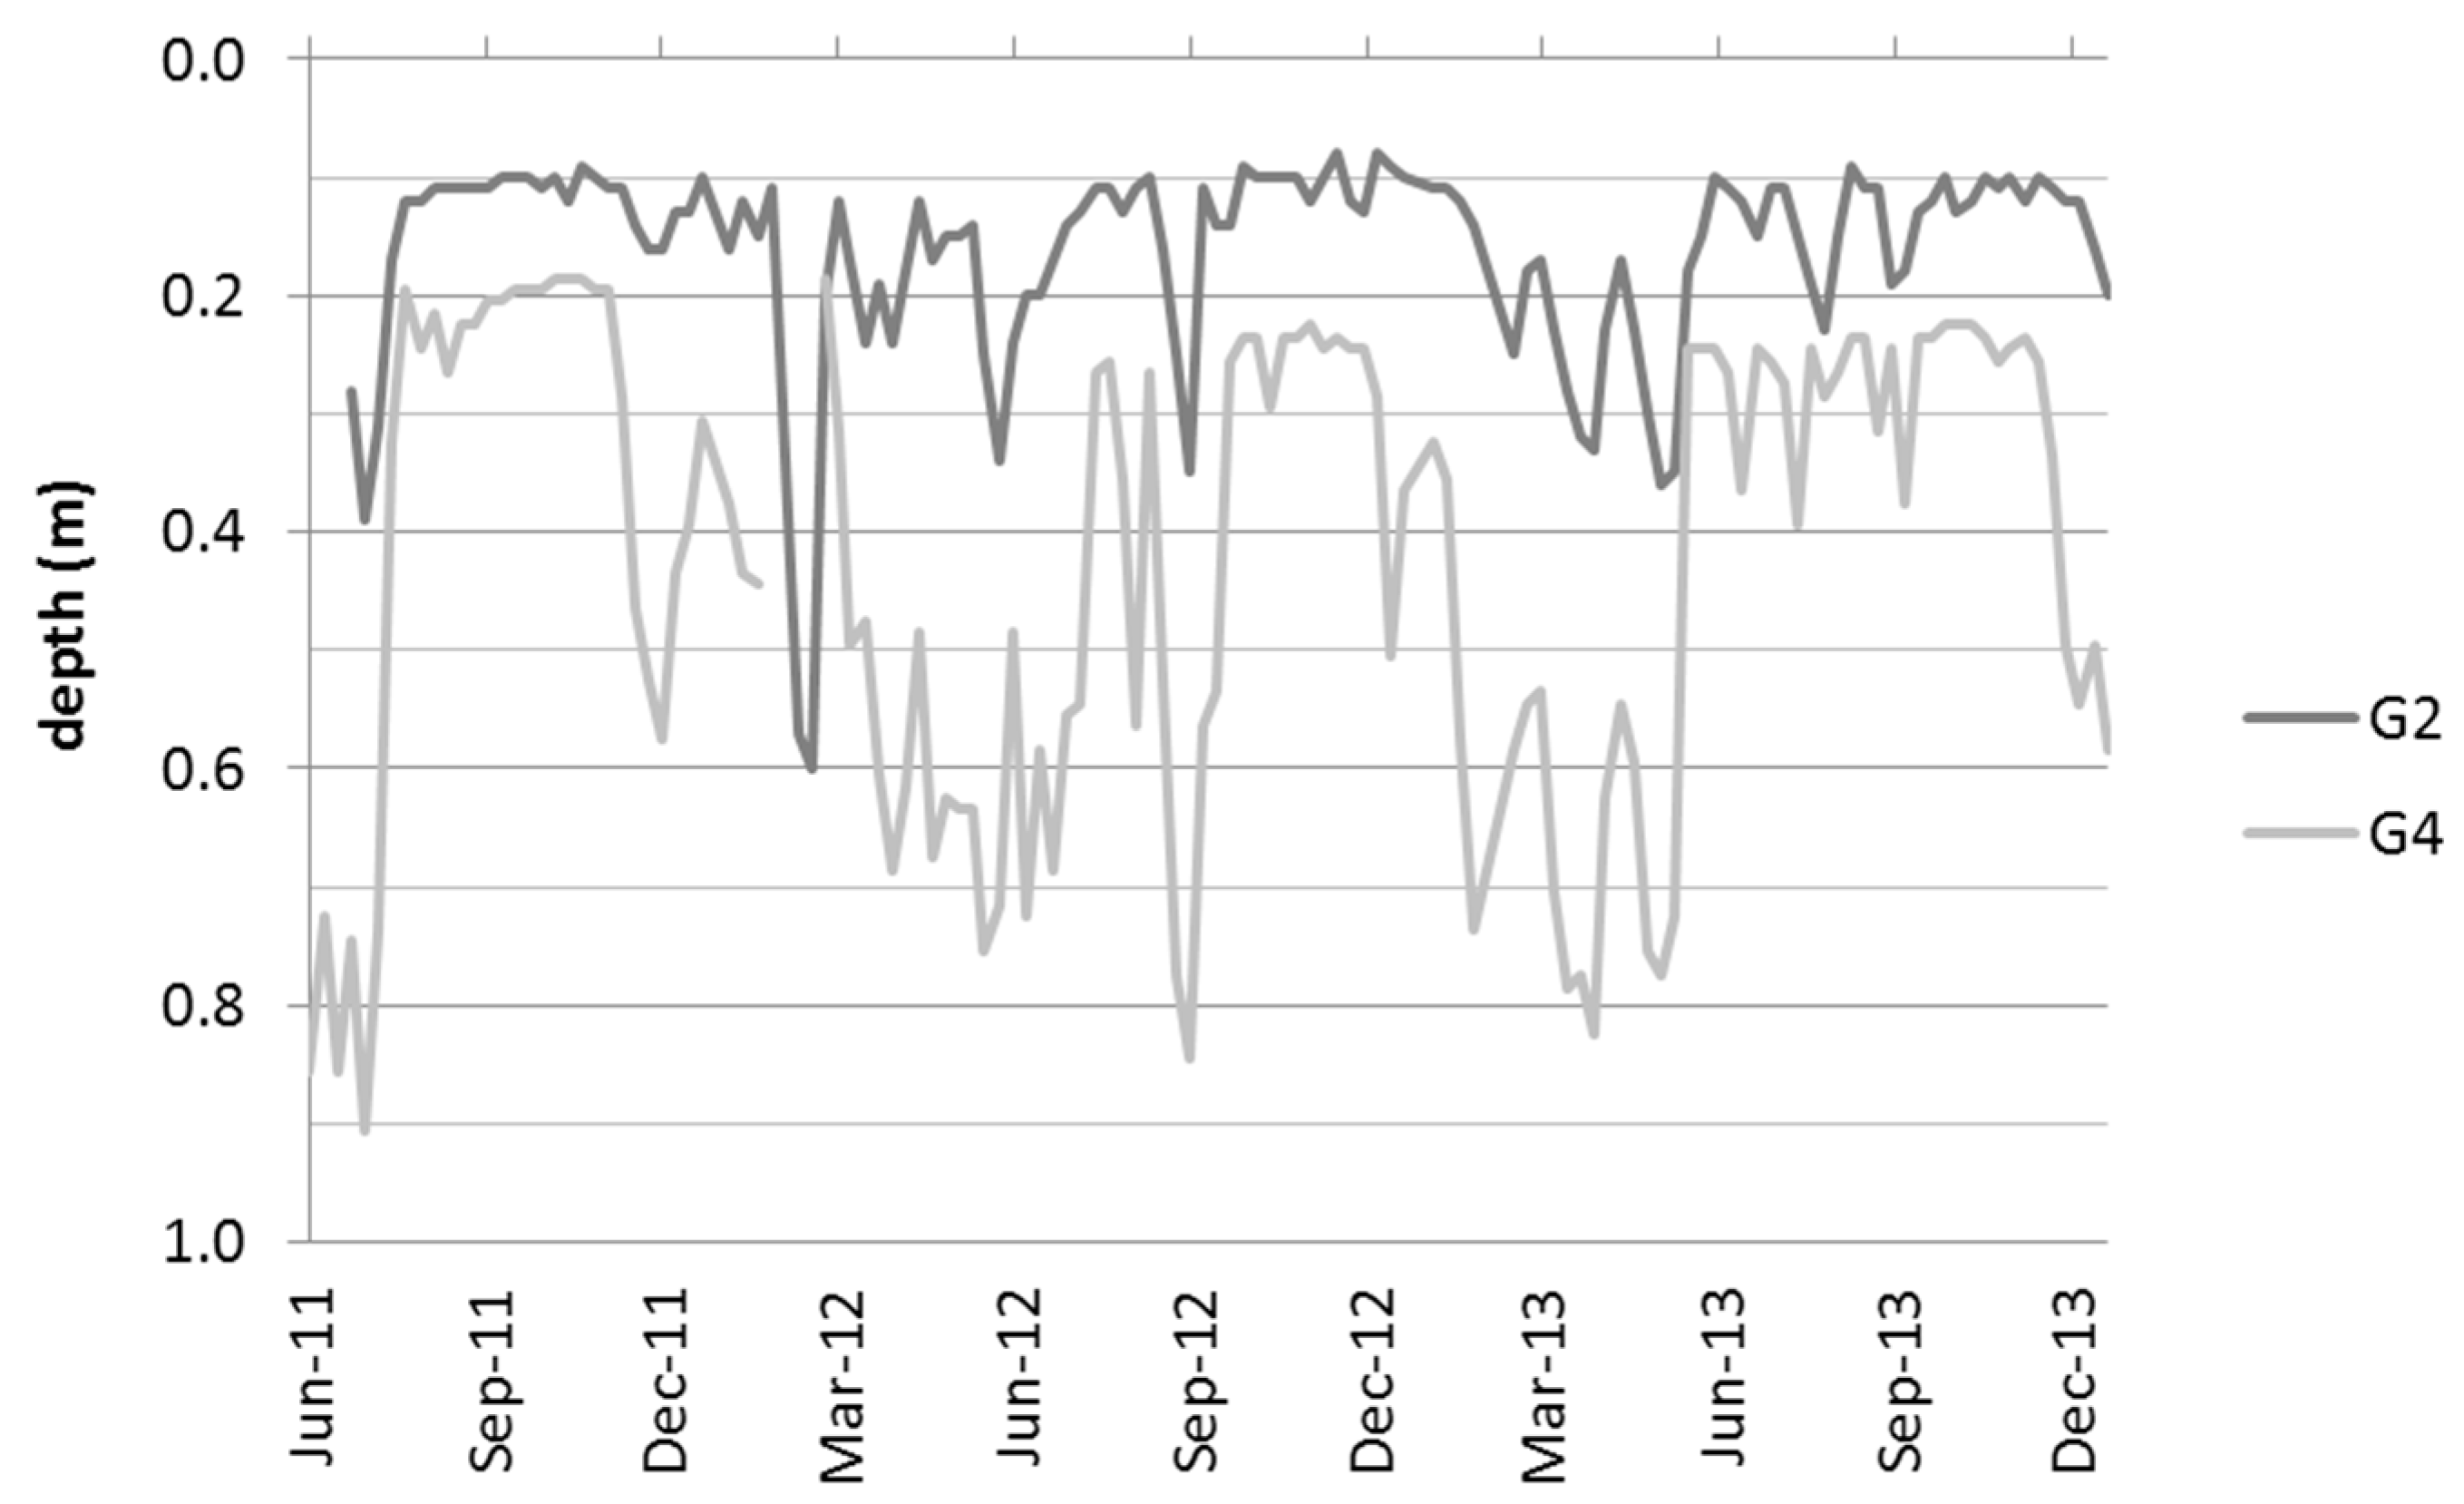
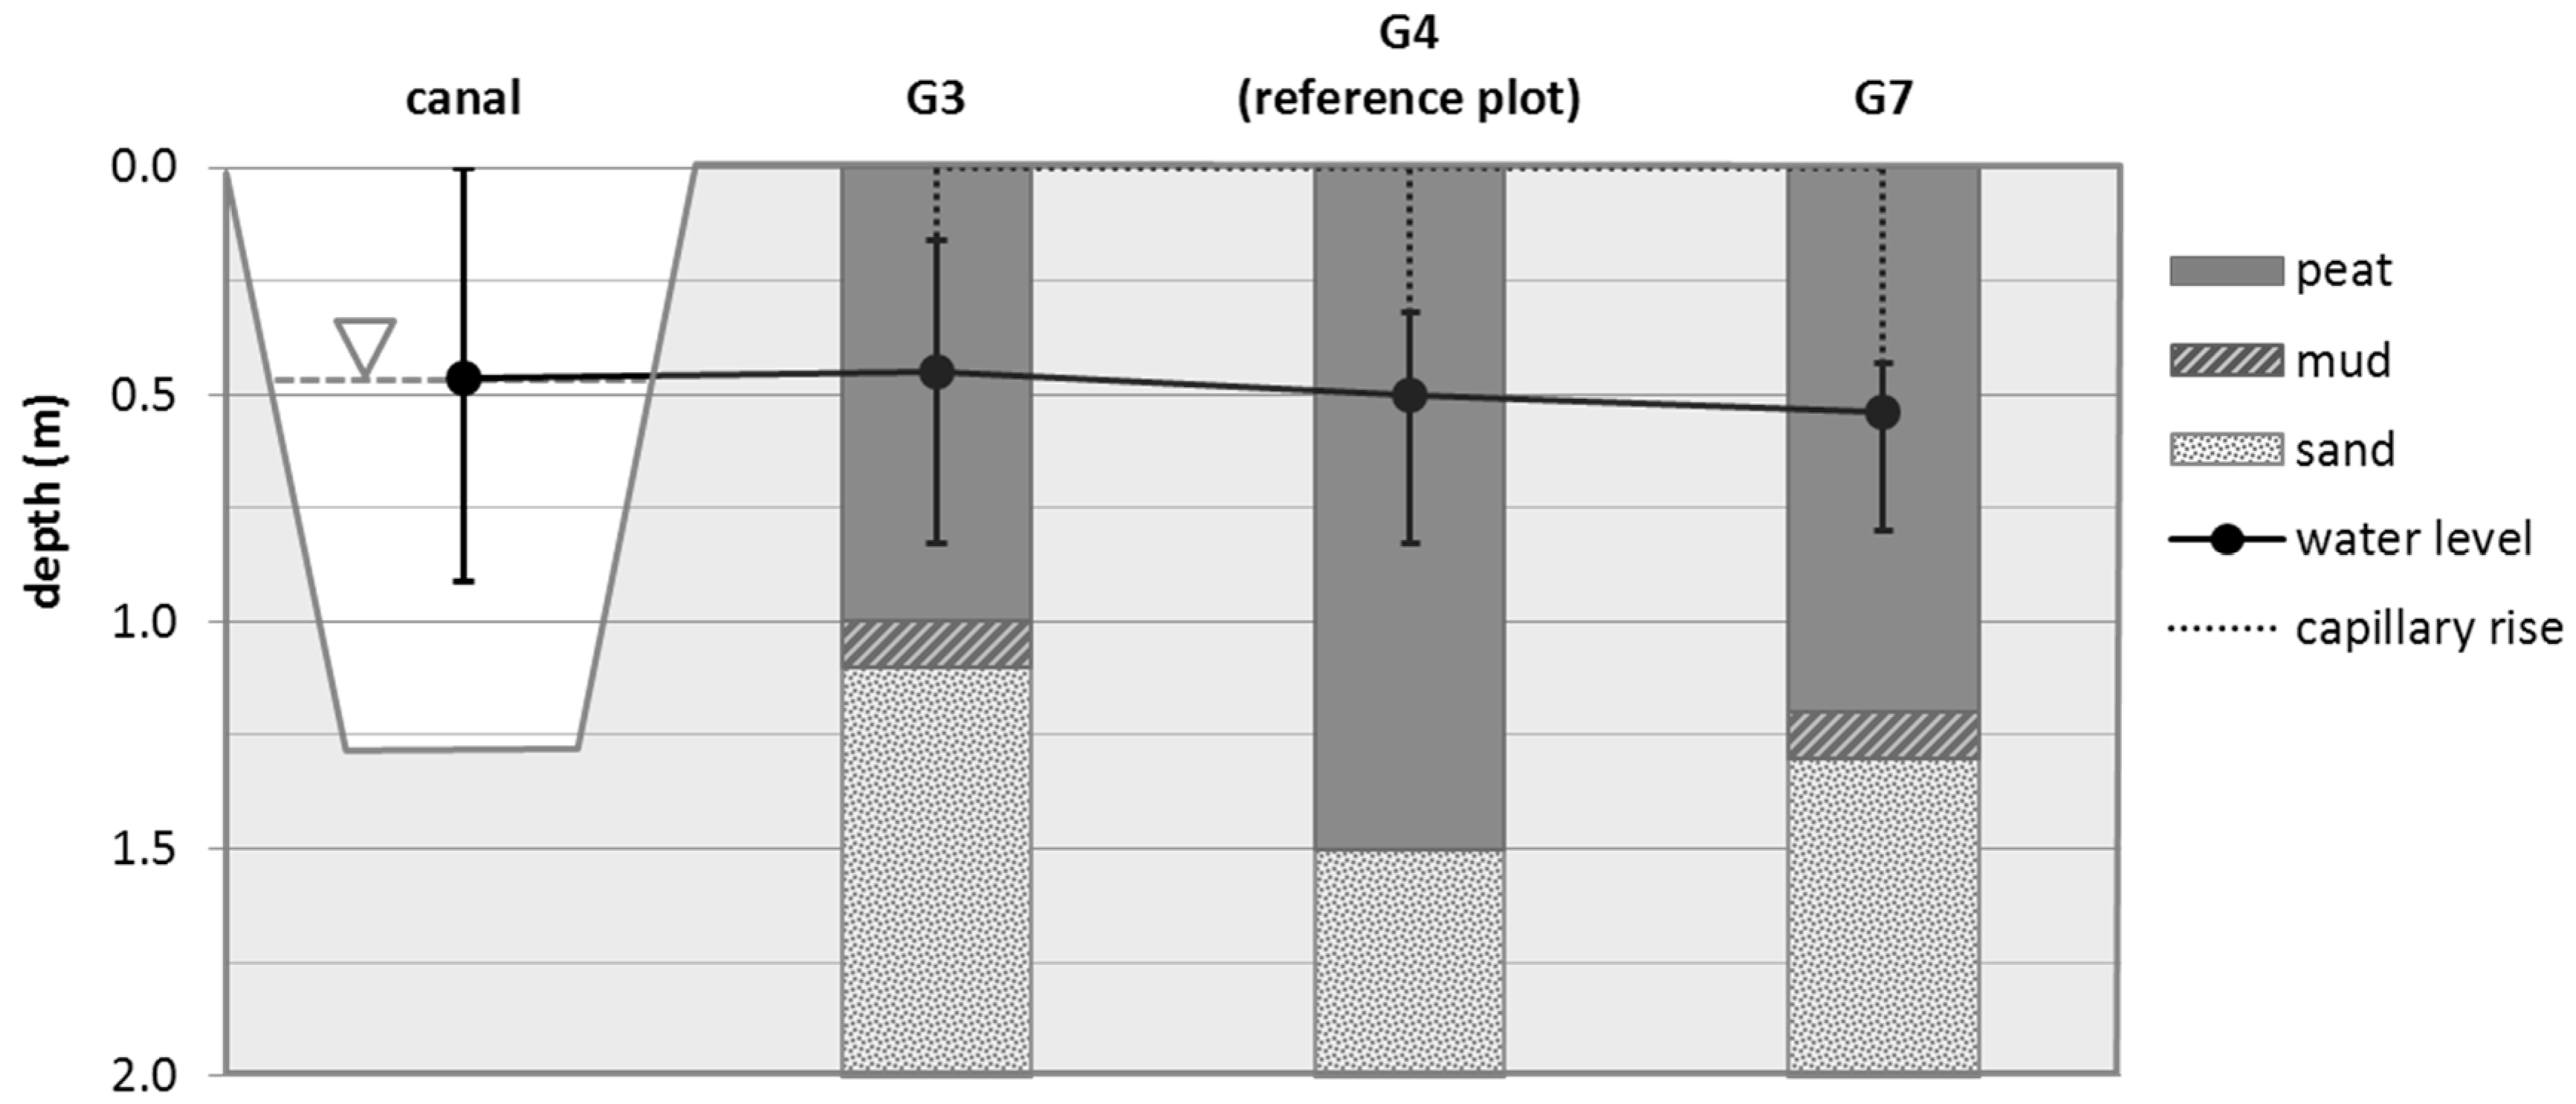
3.1. Hydrological and Geohydraulic Conditions, and Physio-Chemical Soil Properties

Figure 4 shows that during the vegetation periods between April and October 2011 to 2013 at reference plot G2 the groundwater table was close to the soil surface and at a relatively constant level. The groundwater level at plot G4 was deeper than the level at plot G2, with differences ranging from approximately 10 cm to 50 cm. The main reason for these instable groundwater levels and the big differences between G2 and G4 was vandals who occasionally removed planks of the weirs, which caused rapid changes in the groundwater level. This shows that the water management of a rewetted area surrounded by “producing fields” is not problem-free when it comes to agreement on the water tables that fit all needs. Nevertheless, transect A–A (Figure 5) shows that the groundwater level always stayed within the peat layer. The transect also shows that the amplitude of the water level changes decreased in line with the distance from the ditch. The main flow gradient was low (0.03%) and directed away from the ditch towards the experimental area.
As summarized in Table 2, the dry bulk density (Db) was substantially higher in the anthropogenically affected nHm and nHa soil horizons than in the deeper, undisturbed nHt horizon. The high bulk density of the upper horizons, linked to a smaller pore volume Vp, was the result of their higher aeration and thus of a higher degree of decomposition in the organic fen peat soil. This correlated with a lower organic carbon content (Corg) and a lower total carbon (Ct) content as well as a higher carbon to nitrogen ratio (C/N) in the upper horizons. The higher the C/N-ratio, the lower the nutrient status of the peat. All peat soil horizons in the Biesenbrow site were in a eutrophic state (C/N-ratios of 10–20, according to Succow and Josten [34]), with the nHt horizon being eutrophic but to a lesser degree. The upper horizons were characterized by significantly higher iron content than the lowest horizon. Based on previous investigations, approximately 50% can be assumed amorphous oxalate-soluble iron [18], which corresponded well with the high dissolved iron concentration Fe2+ in the groundwater of approximately 10 mg L−1. Similarly high concentrations in the groundwater, between 10 and 20 mg L−1, were found for dissolved organic carbon DOC [5]. The NO3-N concentration ranged between 0.3 and 1.0 mg L–1, the mean of NH4-N was 0.38 mg L−1. Soil property parameters and metal contents measured before and after three years of rewetting with treated wastewater did not show a consistent trend and overall small changes. The greatest differences were an about twofold increase of cadmium concentration in the top soil (nHm) and a 2–4-fold decrease of arsenic and lead, respectively, in the deeper soil layer (nHt) (Table 2).
The pores above the groundwater table were mostly filled with water because of capillary rise. Following the results of Schindler et al. [35], obtained with peat soils under similar conditions, 95–97% of all pores above the groundwater table can be assumed water-filled in a peat nHa horizon and a groundwater table depth of 60 cm below the surface. Hence, 3–5% of pore space within the capillary zone, which is indicated by the dotted line in Figure 5, is filled with air. The permanently wet conditions in the peat resulted in strongly reductive, anaerobic conditions, as demonstrated by the continuously measured redox potential Eh at a depth of 1 m near the ditch bank, ranging from 0 mV down to −200 mV (Figure 6).

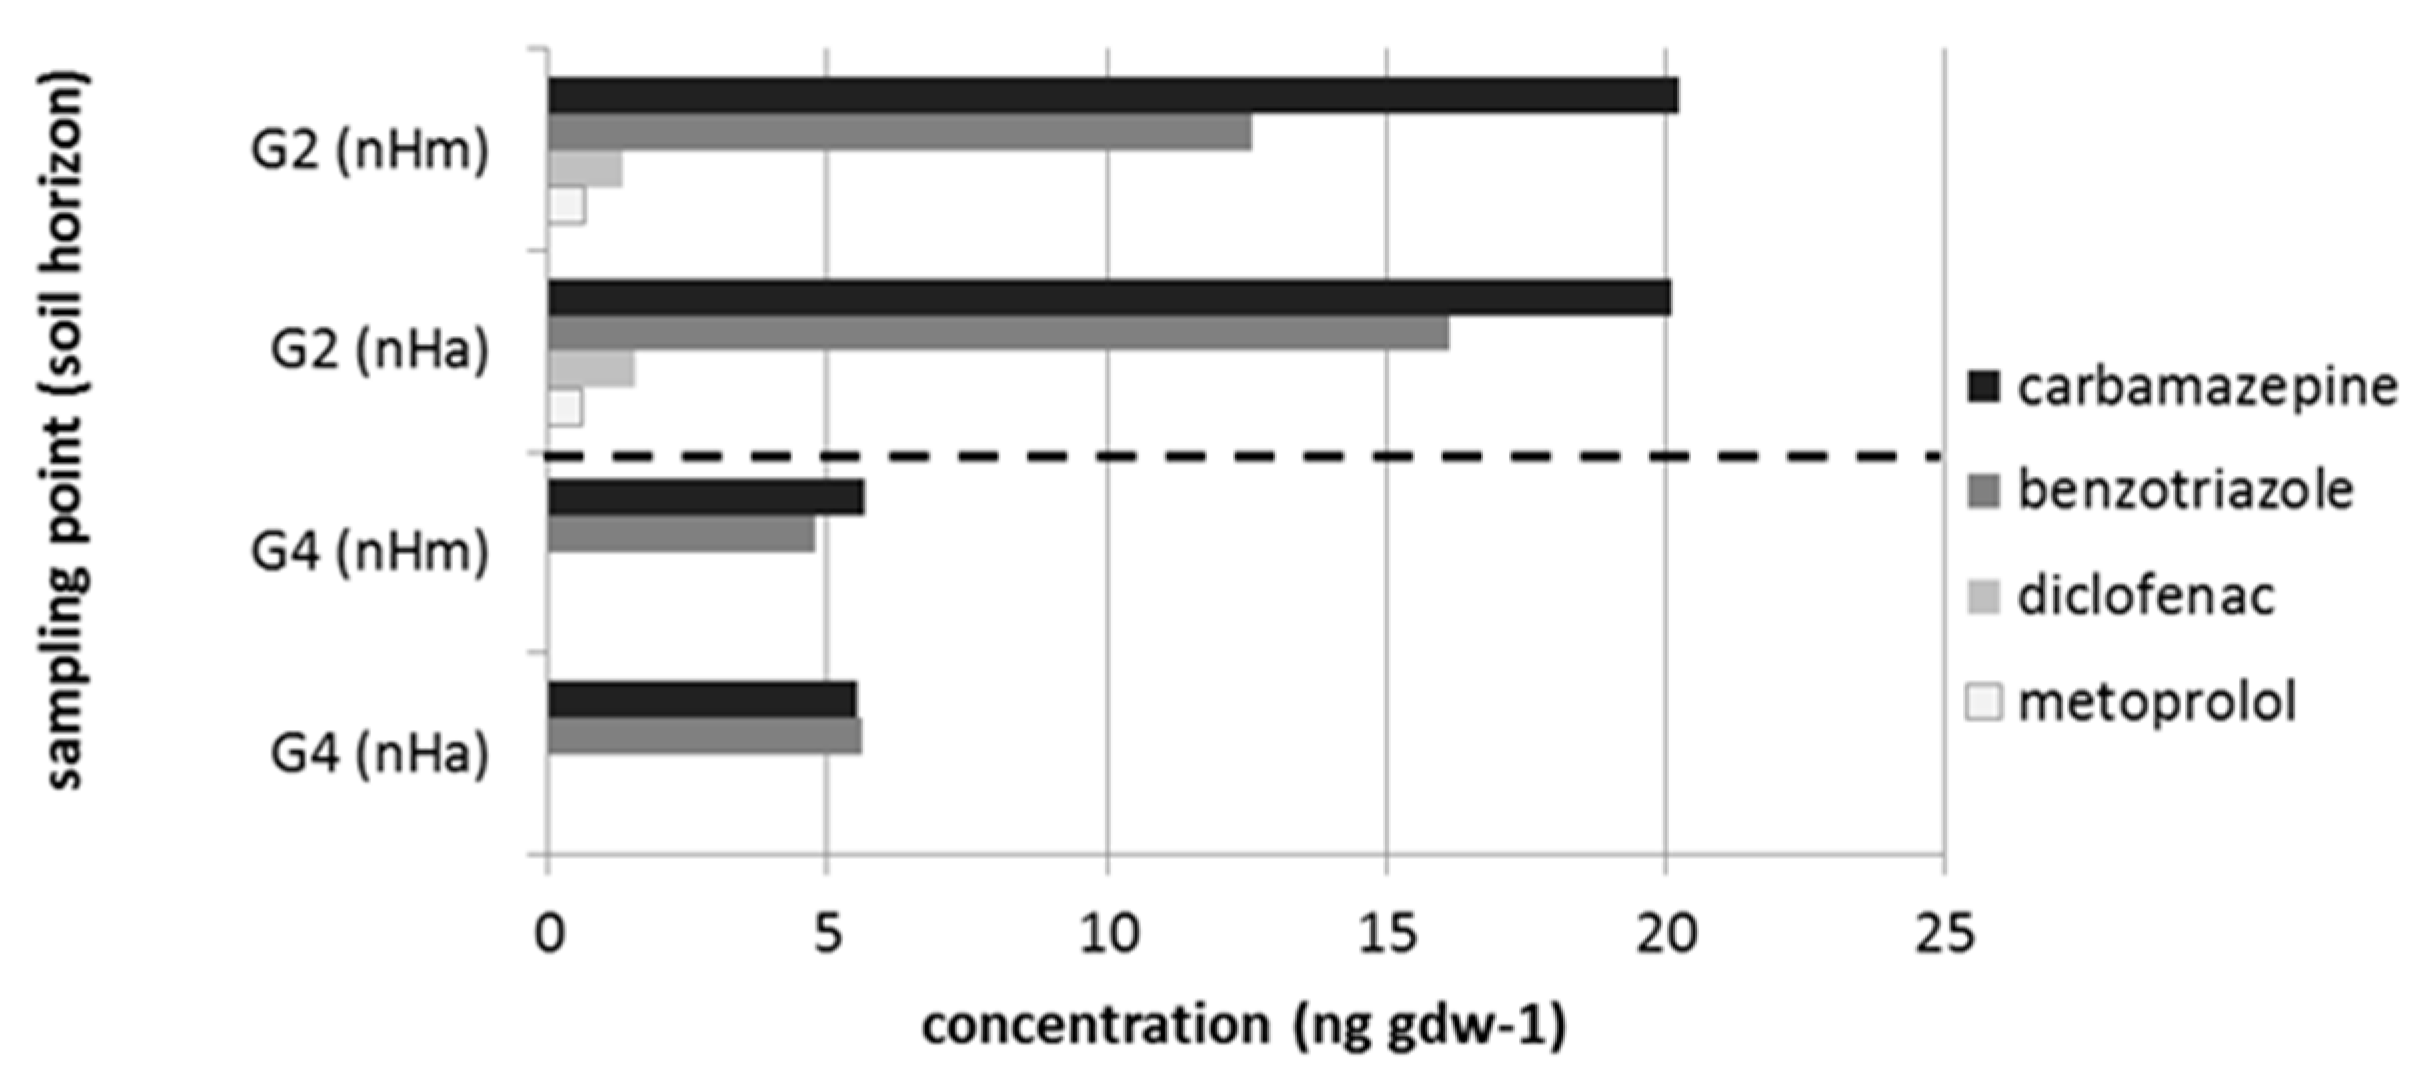
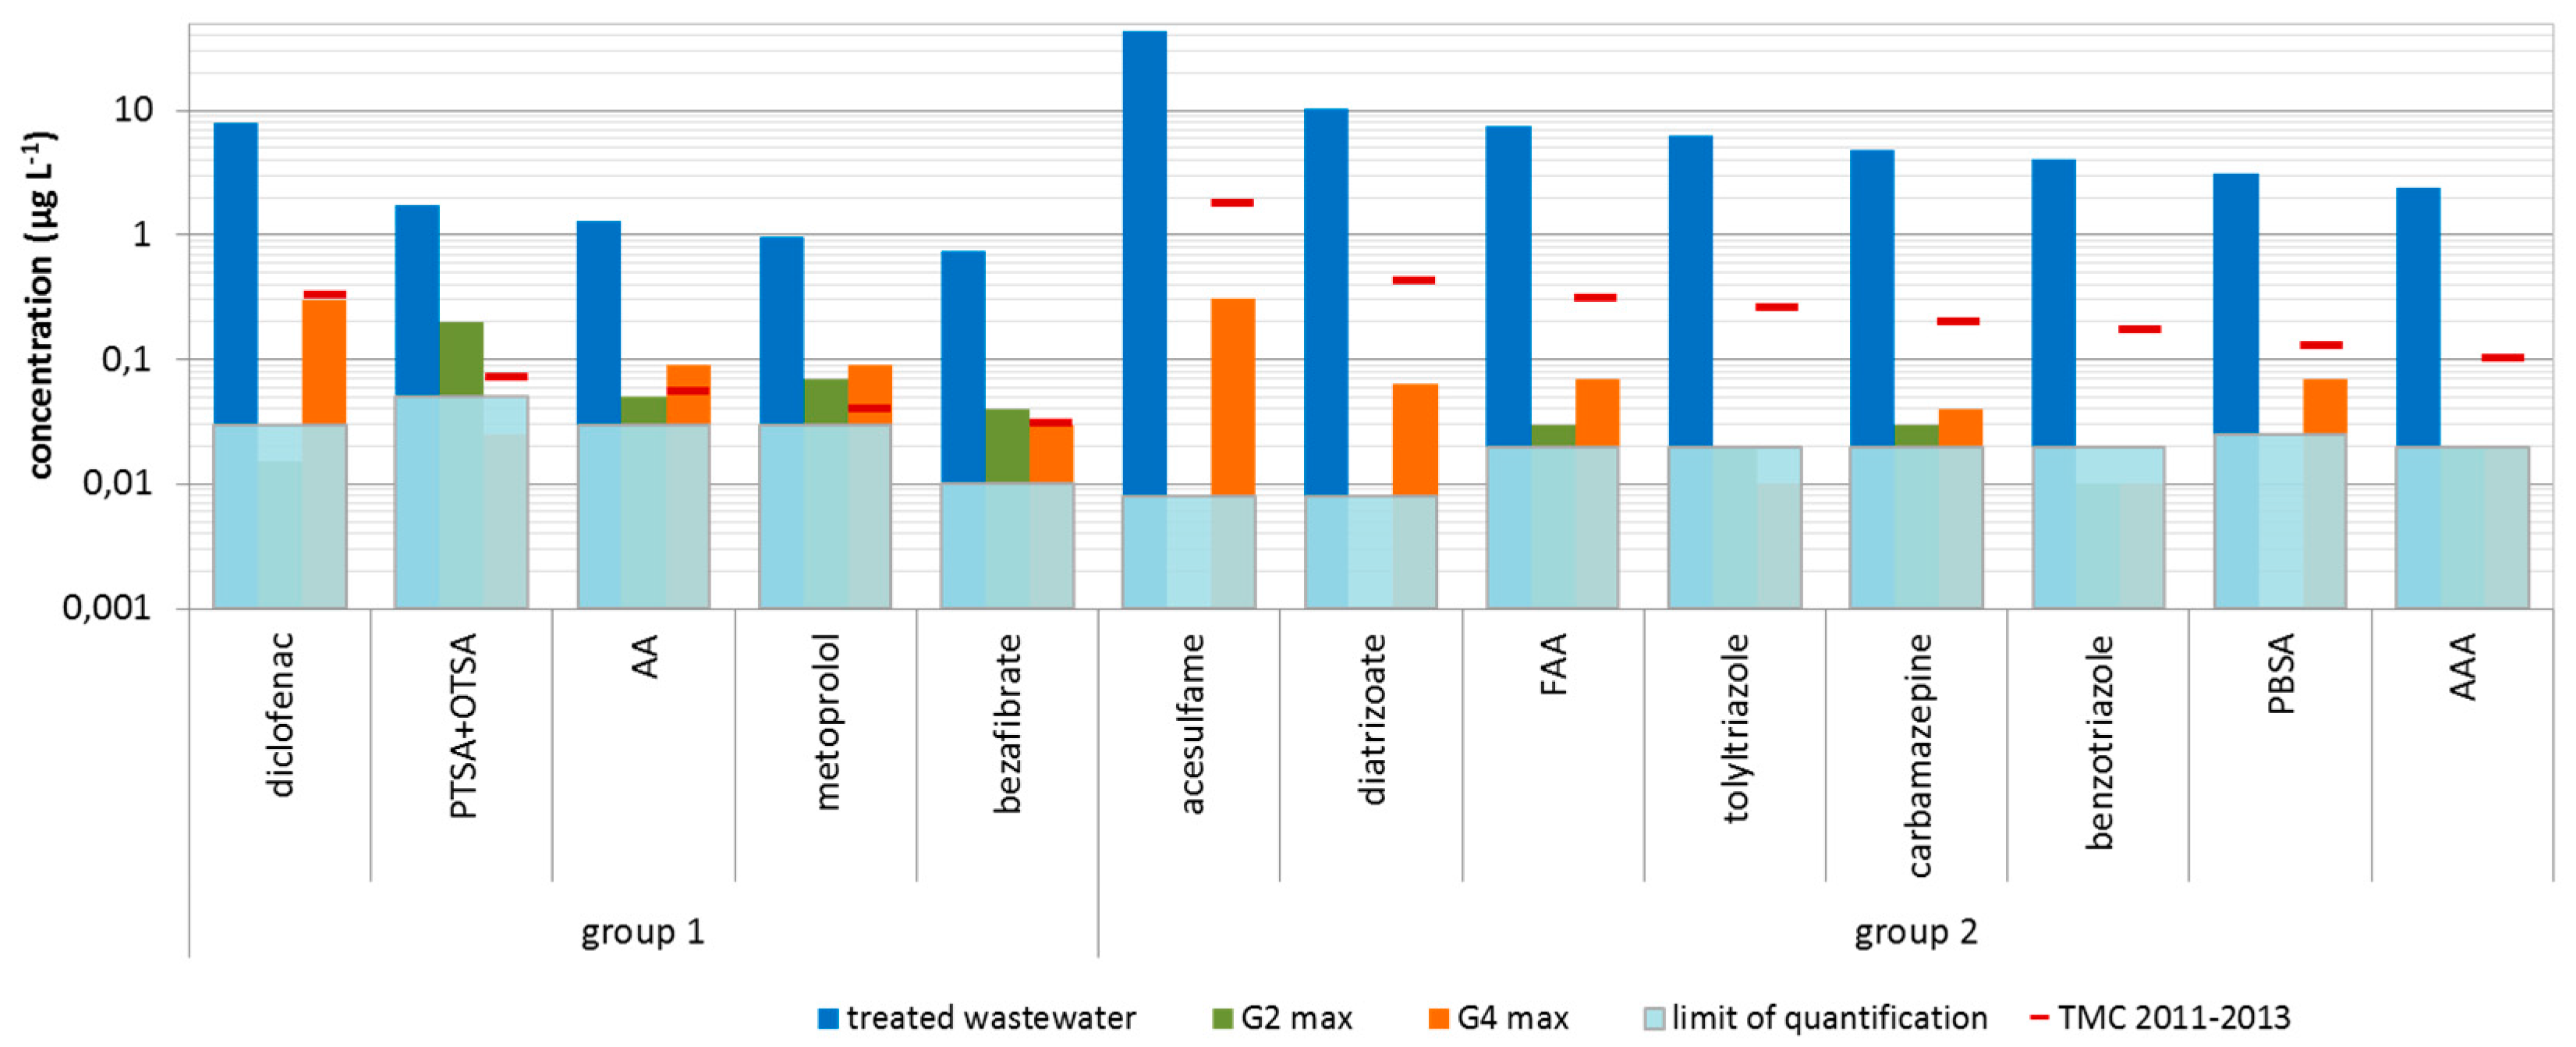
3.2. Micropollutants in the Treated Wastewater, Groundwater, Surface Water and Peat Soil

Chemical analysis of the treated wastewater revealed that only 31 among the 67 screened substances were present at concentrations higher than their limits of quantitation. The highest concentration in the treated wastewater of this rural area was found for the artificial sweetener acesulfame (mean 67 µg L–1), the pharmaceuticals diclofenac (mean 8.0 µg L–1) and carbamazepine (mean 4.9 µg L−1). The pharmaceutical metabolite FAA (mean 7.5 µg L−1) and other chemicals, such as tolyl- and benzotriazole, contained in corrosion inhibitors, or the contrast agent diatrizoate, were also detected with mean concentrations between 4 and 6 µg L–1.
In the groundwater, 15 of the 31 compounds found in treated wastewater were detected: diclofenac, carbamazepine, metoprolol, bezafibrate, FAA, AAA, AA, AMPH, PEMA, isoproturon, acesulfame, tolyltriazole, diatrizoate, p-TSA + o-TSA and PBSA. The highest groundwater concentrations were found for the pharmaceuticals diclofenac and acesulfame (both approximately 0.3 µg L–1) in June 2013 during a dry spell and a reduced groundwater table (see Figure 4). At the same time, the concentration of diclofenac of 0.11 µg L–1 was measured at the outlet weir of Ditch A. At other times and for all other micropollutants, no concentration higher than the LoQ was detected in the ditch water. The concentrations of all compounds detected in groundwater (with the exception of diclofenac and acesulfame) did not exceed the limit of 0.1 µg L–1 that is considered as a health orientation value for drinking water regarding substances for which no or insufficient human toxicity data are available [36,37].
The treated wastewater, which was diluted approximately 10-fold with surface water before distribution on the soil surface according to the water balance in Figure 3, was subject to further dilution when it was mixed with groundwater in the groundwater-saturated peat soil. According to the results by groundwater modeling with FEFLOW, a theoretical minimum concentration (TMC) for each compound was calculated that could be expected if all compounds were stable and not degradable, as a tracer. To calculate the TMC regarding dilution, we assumed a homogeneous distribution over the flooded area of 5 ha. A final dilution quotient of 1:24 in the shallow groundwater zone was found for the reference plots (see Supplementary Materials Figure S1). A summary of these results is shown in Table 3.
The number of detections (Table 3) shows that, during the three-year period the measured substances were detected only once in the groundwater, if at all. Hence, only diclofenac and acesulfame did not meet the legal requirements for groundwater protection, showing concentrations above 0.1 µg L–1.
In the peat soil, carbamazepine, benzotriazole, diclofenac and metoprolol were detected (Figure 7). Other substances with substantial concentrations in the treated wastewater may have accumulated in the soil, too, but were not covered by the monitoring program.
To assess the adsorbed amounts of micropollutants, similarly to the TMC of groundwater, we used a “scaling tool”: a theoretical maximum amount that might be adsorbed when all micropollutant matter loaded during the three-year experimental period is adsorbed in the nHm horizon (Table 4). For bezafibrate, primidone, atenolol, oxazepam, isoproturone, and diurone, the theoretical maximum concentration was lower than the LoQ and, therefore, these chemicals have been not relevant for further consideration.
The strongest accumulation in the soil was detected for carbamazepine and benzotriazole, whose concentration at sampling plot G2 was higher than at G4. Compared with the maximum adsorption load in plot G2, the loads for carbamazepine and benzotriazole were higher than calculated, and covered a soil horizon of about 40 cm. This was likely caused by differences in the load of micropollutants reaching the reference plots due to the hydraulic conditions of the water distribution regime under a gravity-driven pressure gradient: reference plot G2 received a higher portion of surplus water, while plot G4 was 150 m away, hence the discharge was lower, as demonstrated by the lower groundwater table in plot G4 in Figure 4. This might lead to loads for metoprolol below the LoQ at plot G4. Diatrizoate and benzotriazole were not adsorbed, and the loads of bezafibrate, primidone, atenolol, oxazepam, isoproturone, and diurone were too small to be detected.
Surprisingly, the concentrations in the upper nHm peat horizon were not different from those in the lower nHa horizon. This might be due to the immediate dilution of surplus water with groundwater and its vertical rather than horizontal movement, allowing the micropollutants to sorb throughout the peat soil zone.

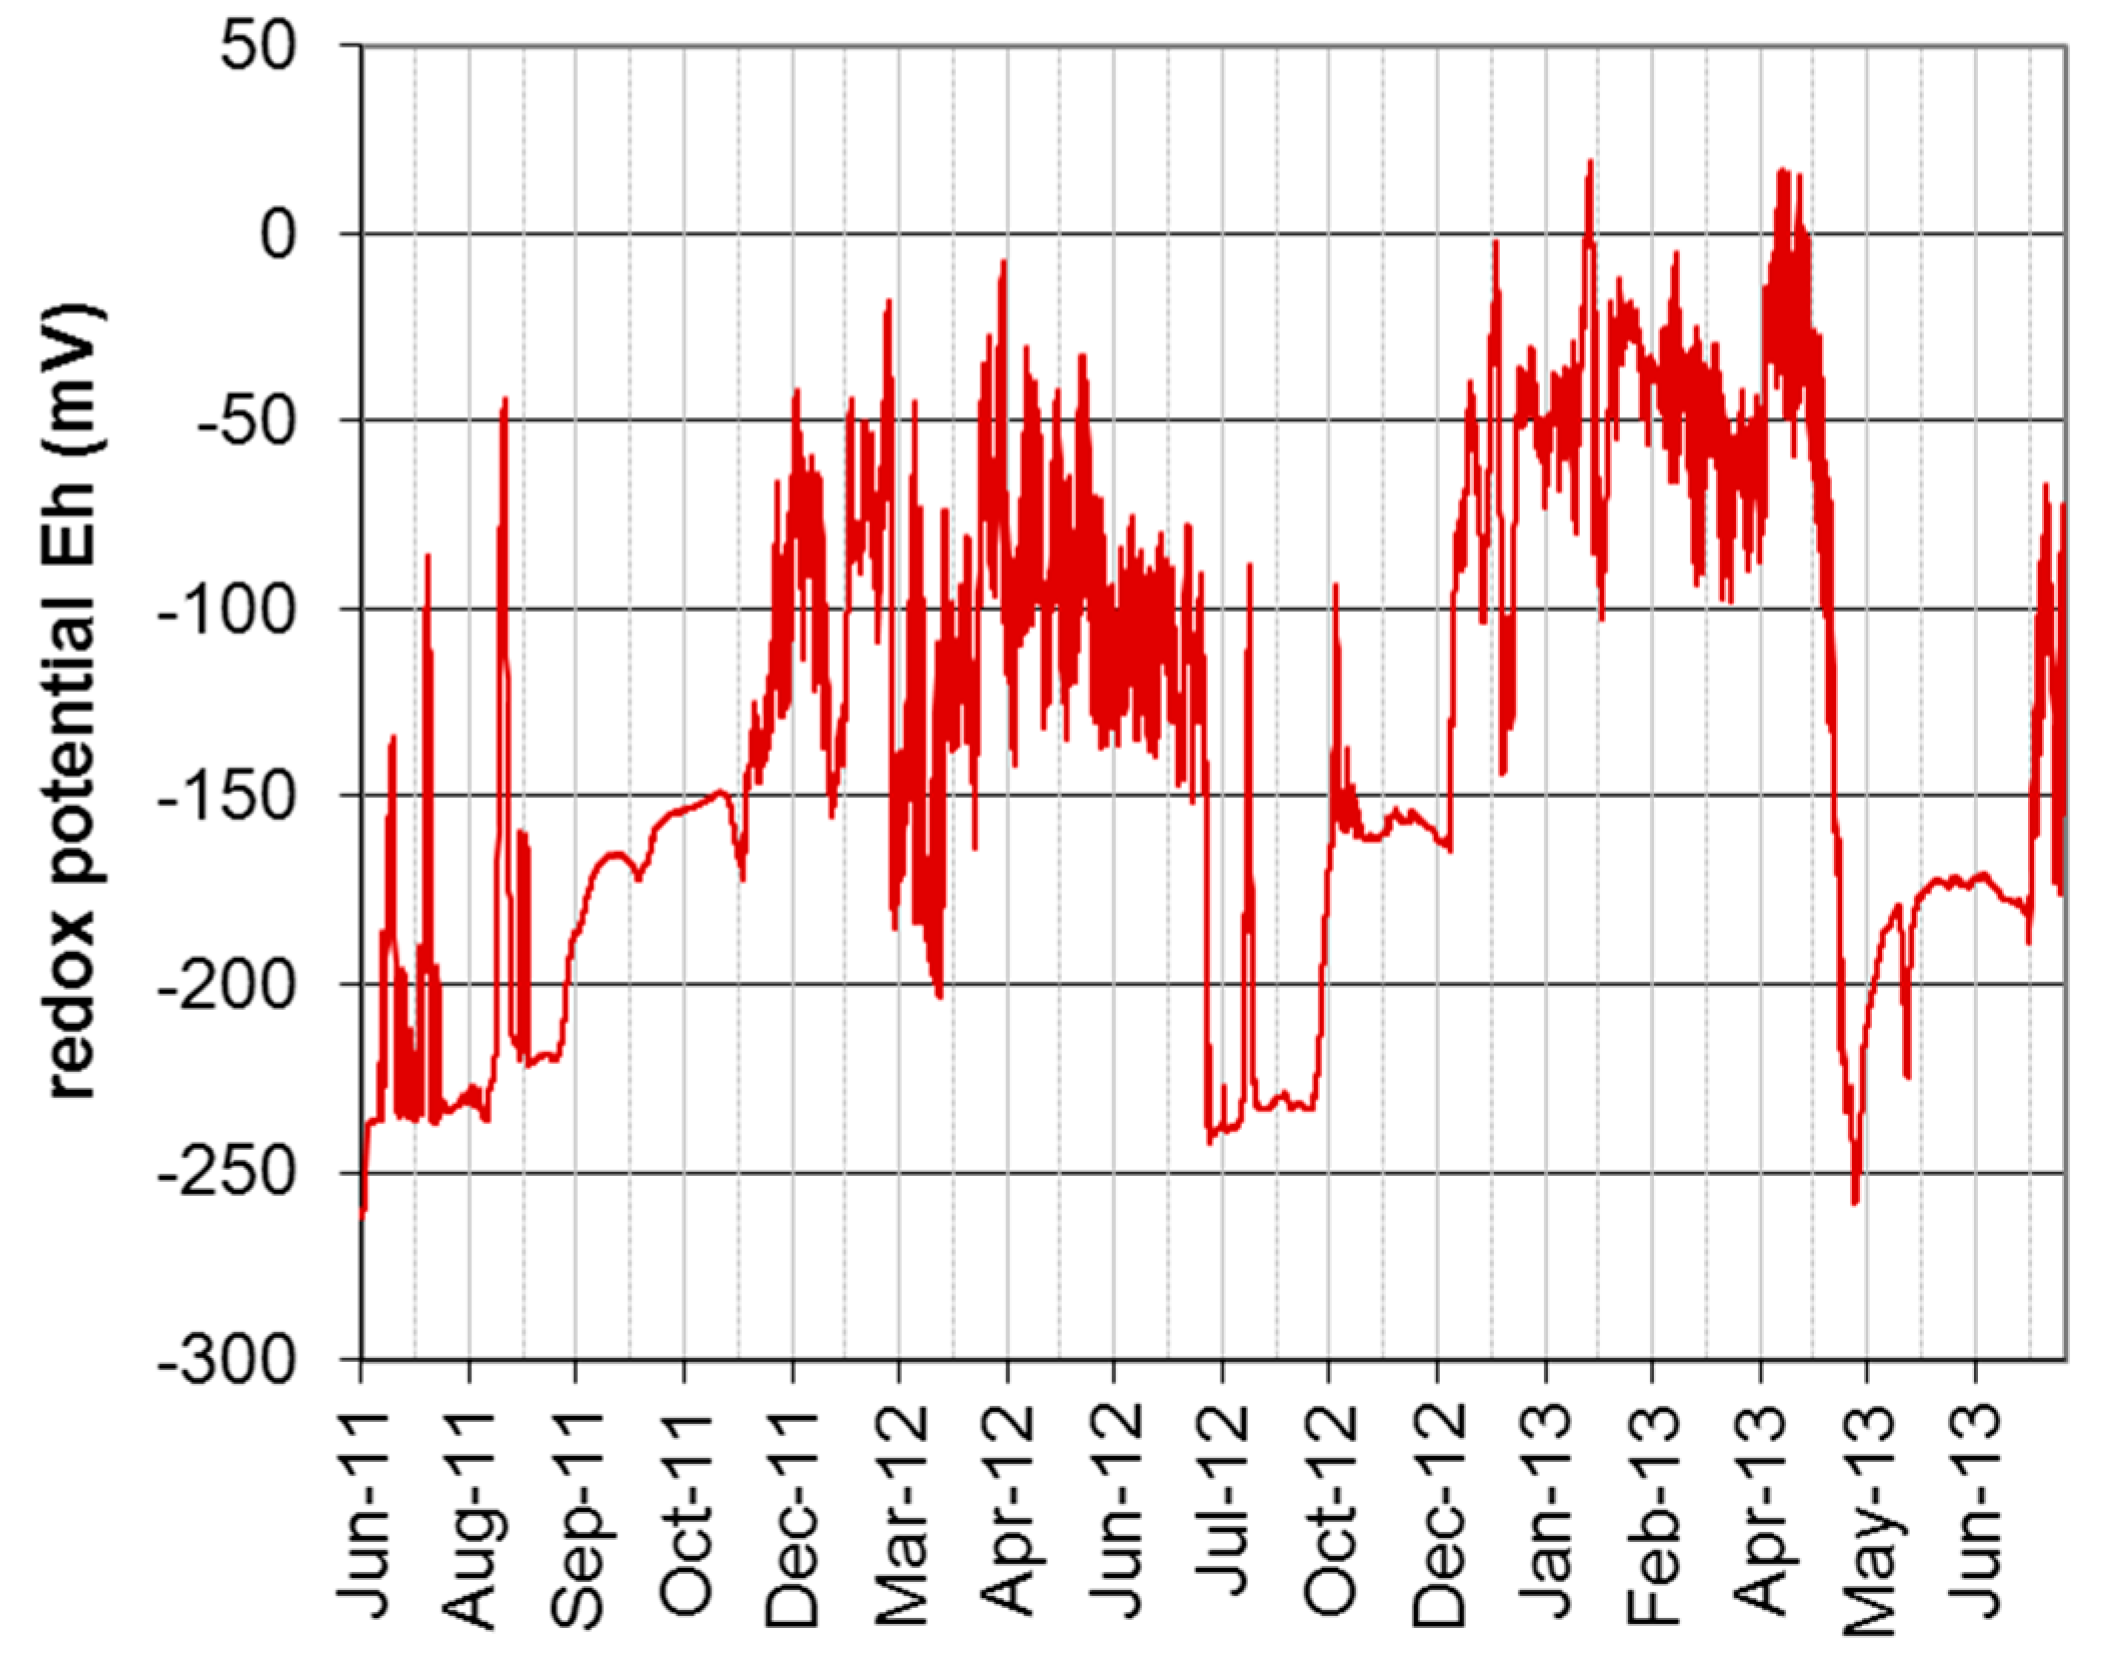
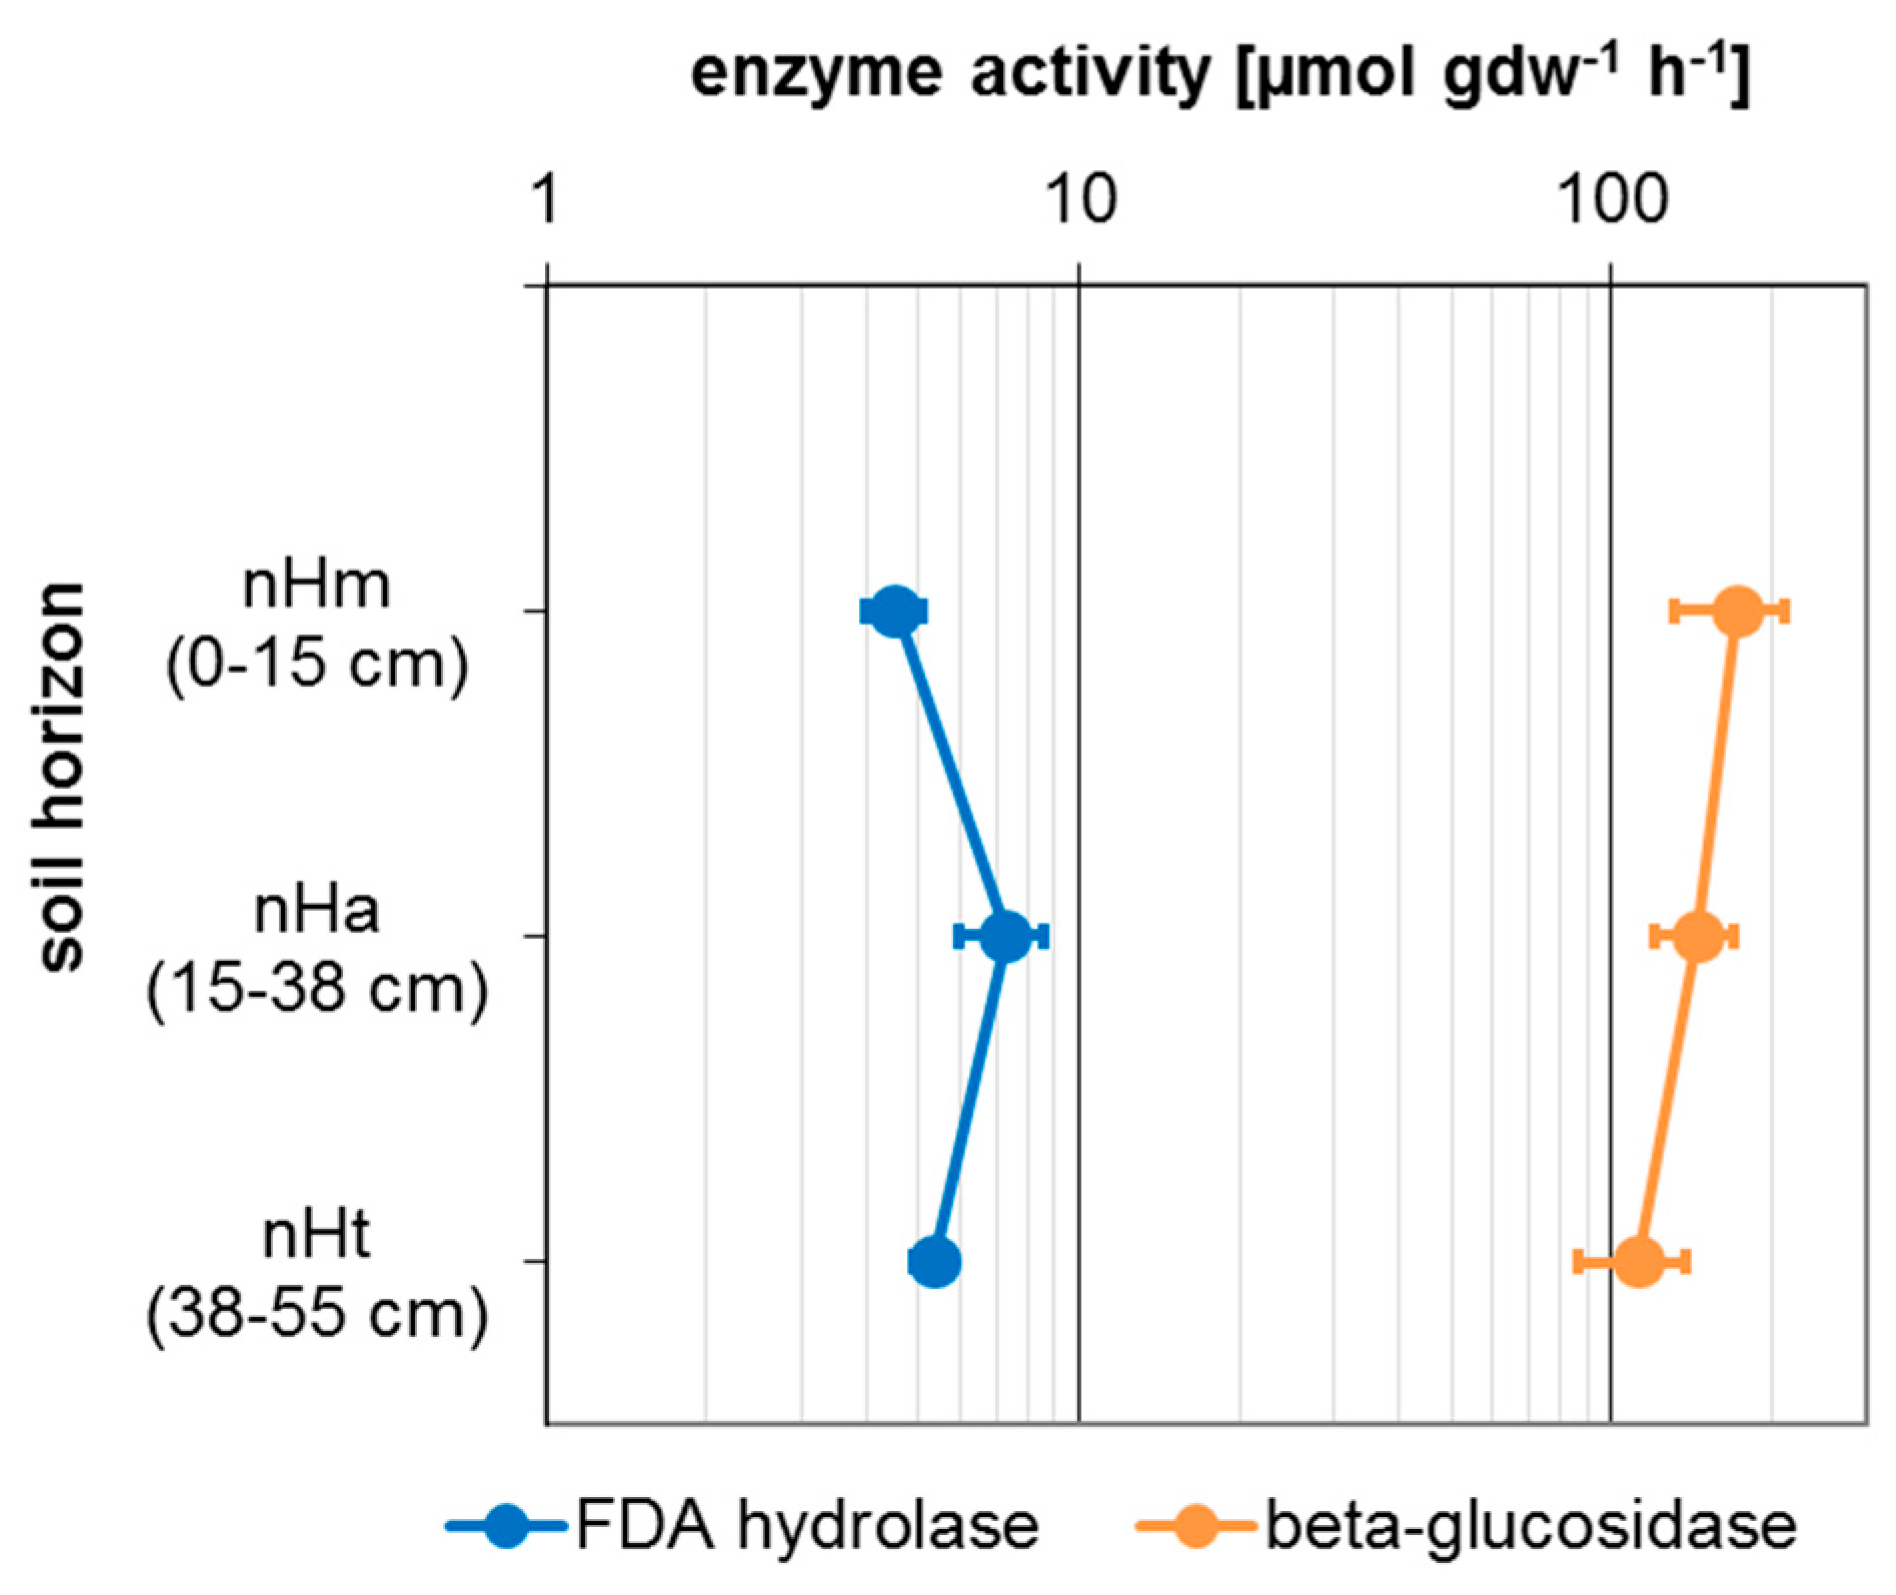
3.3. Microbial Activity

Microbial activities in the peat soil were 5–7 µmol gdw–1 h–1 for FDA hydrolase and 100–200 µmol gdw–1 h–1 for beta-glucosidase (gdw—gram dry weight) (Figure 8). FDA hydrolase showed the highest values in the nHa horizon, whereas for beta-glucosidase the values where highest at the upper nHm soil horizon.

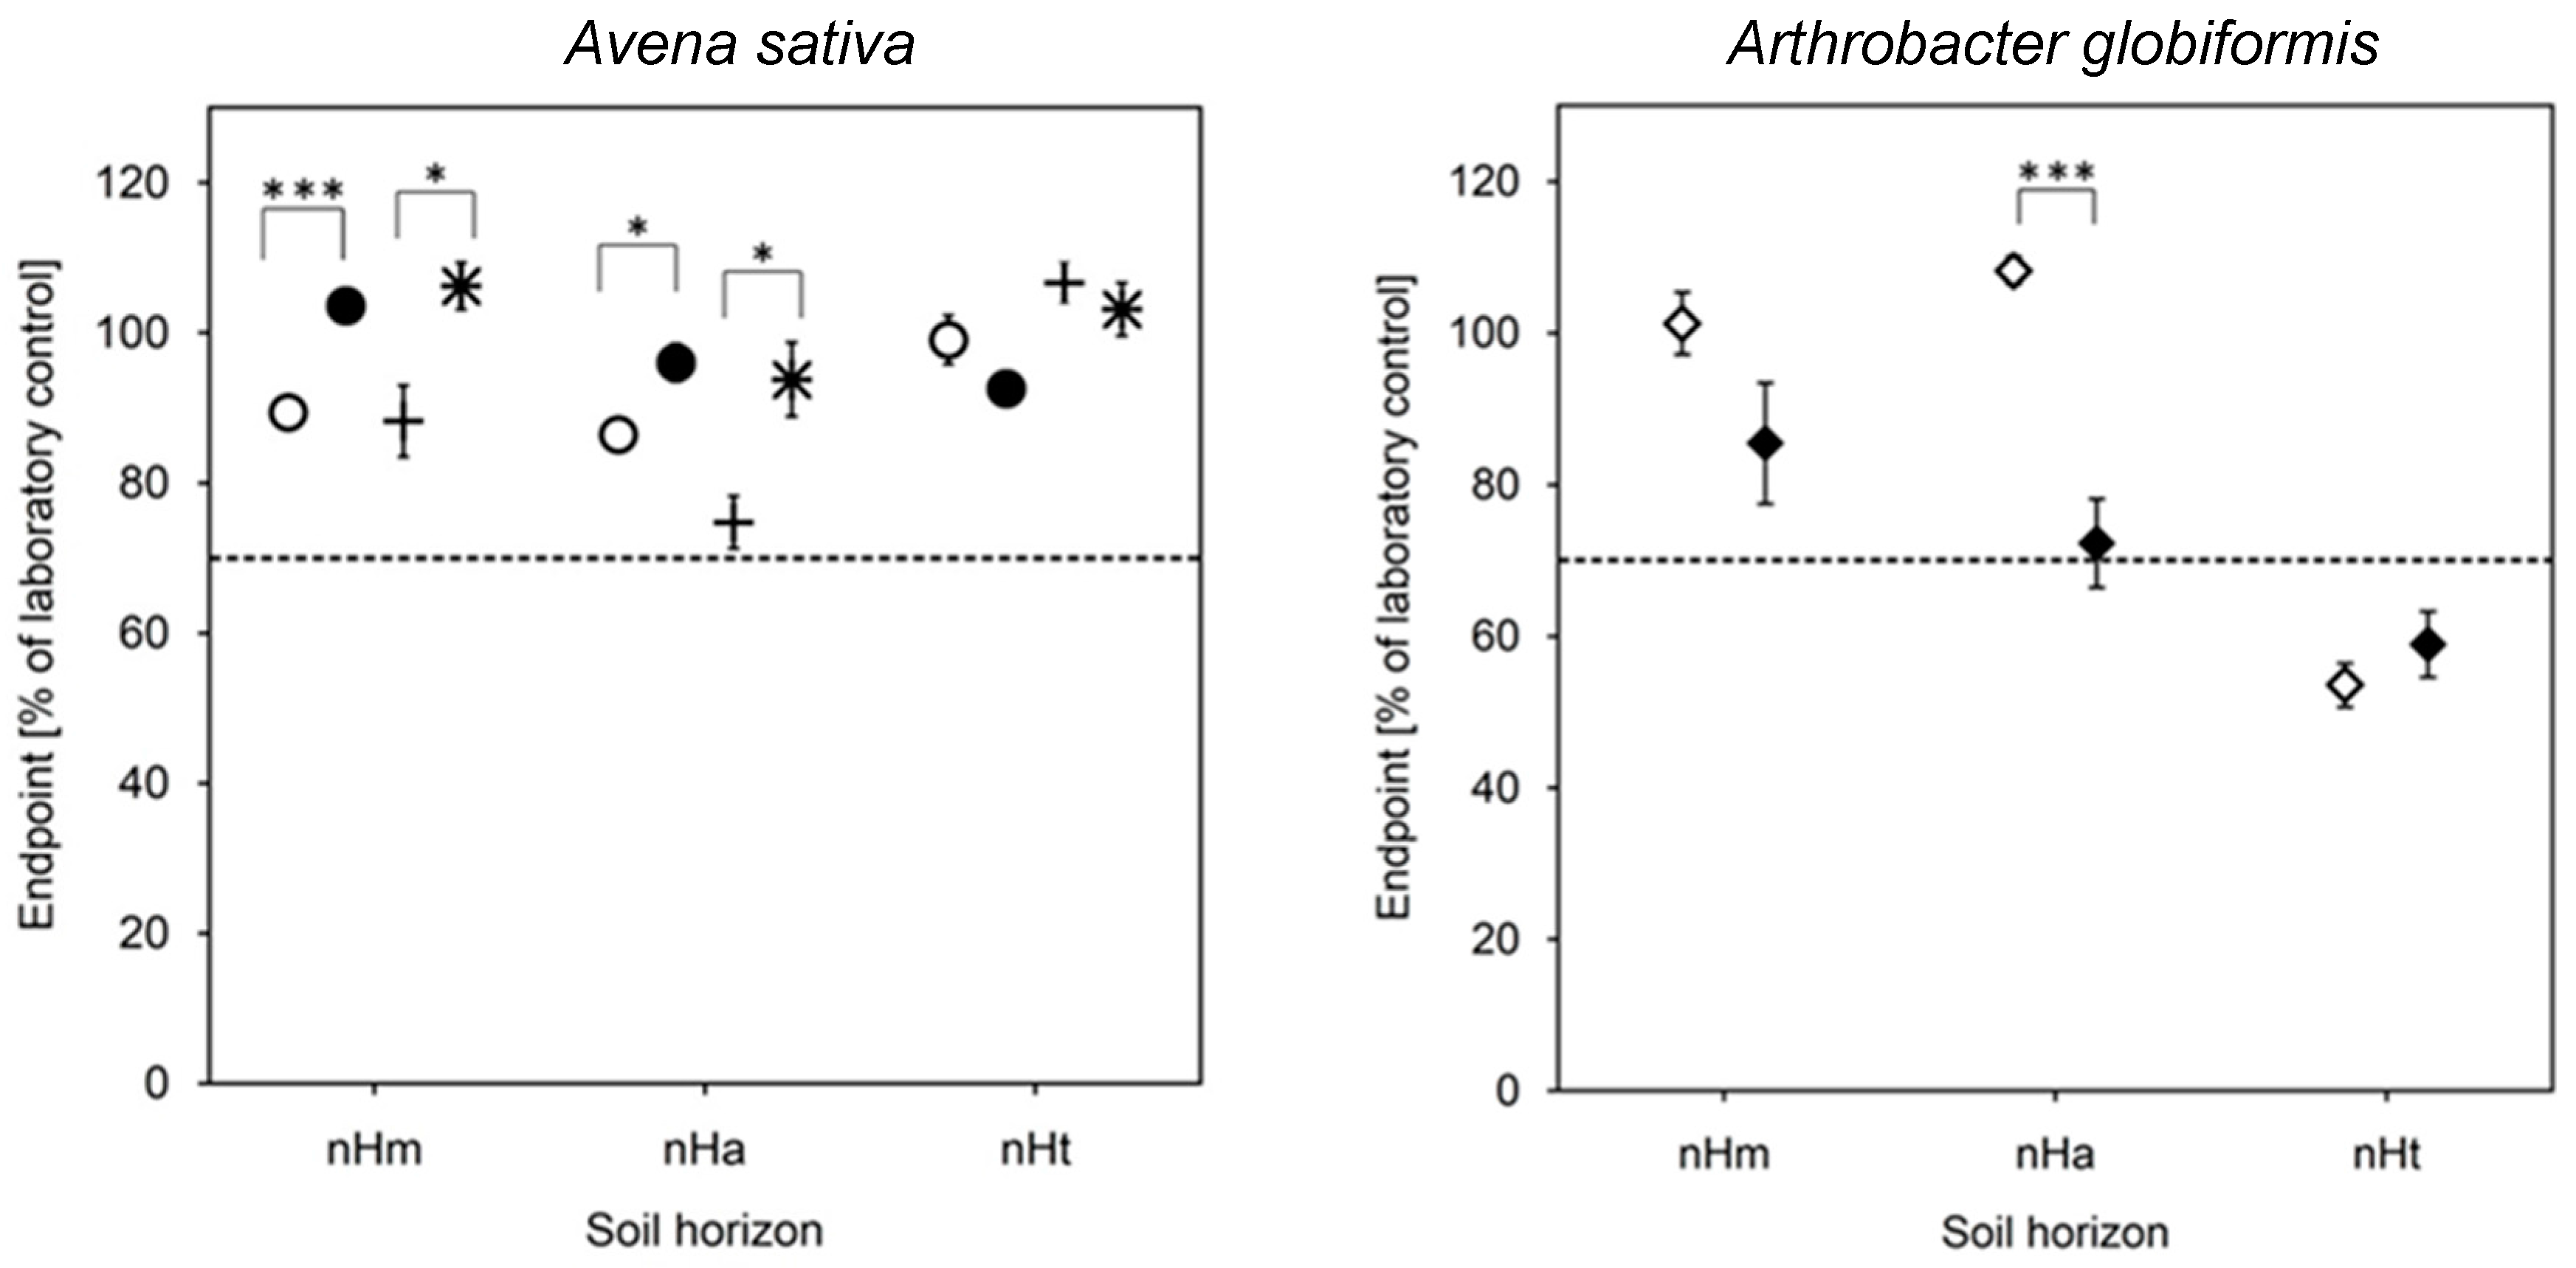
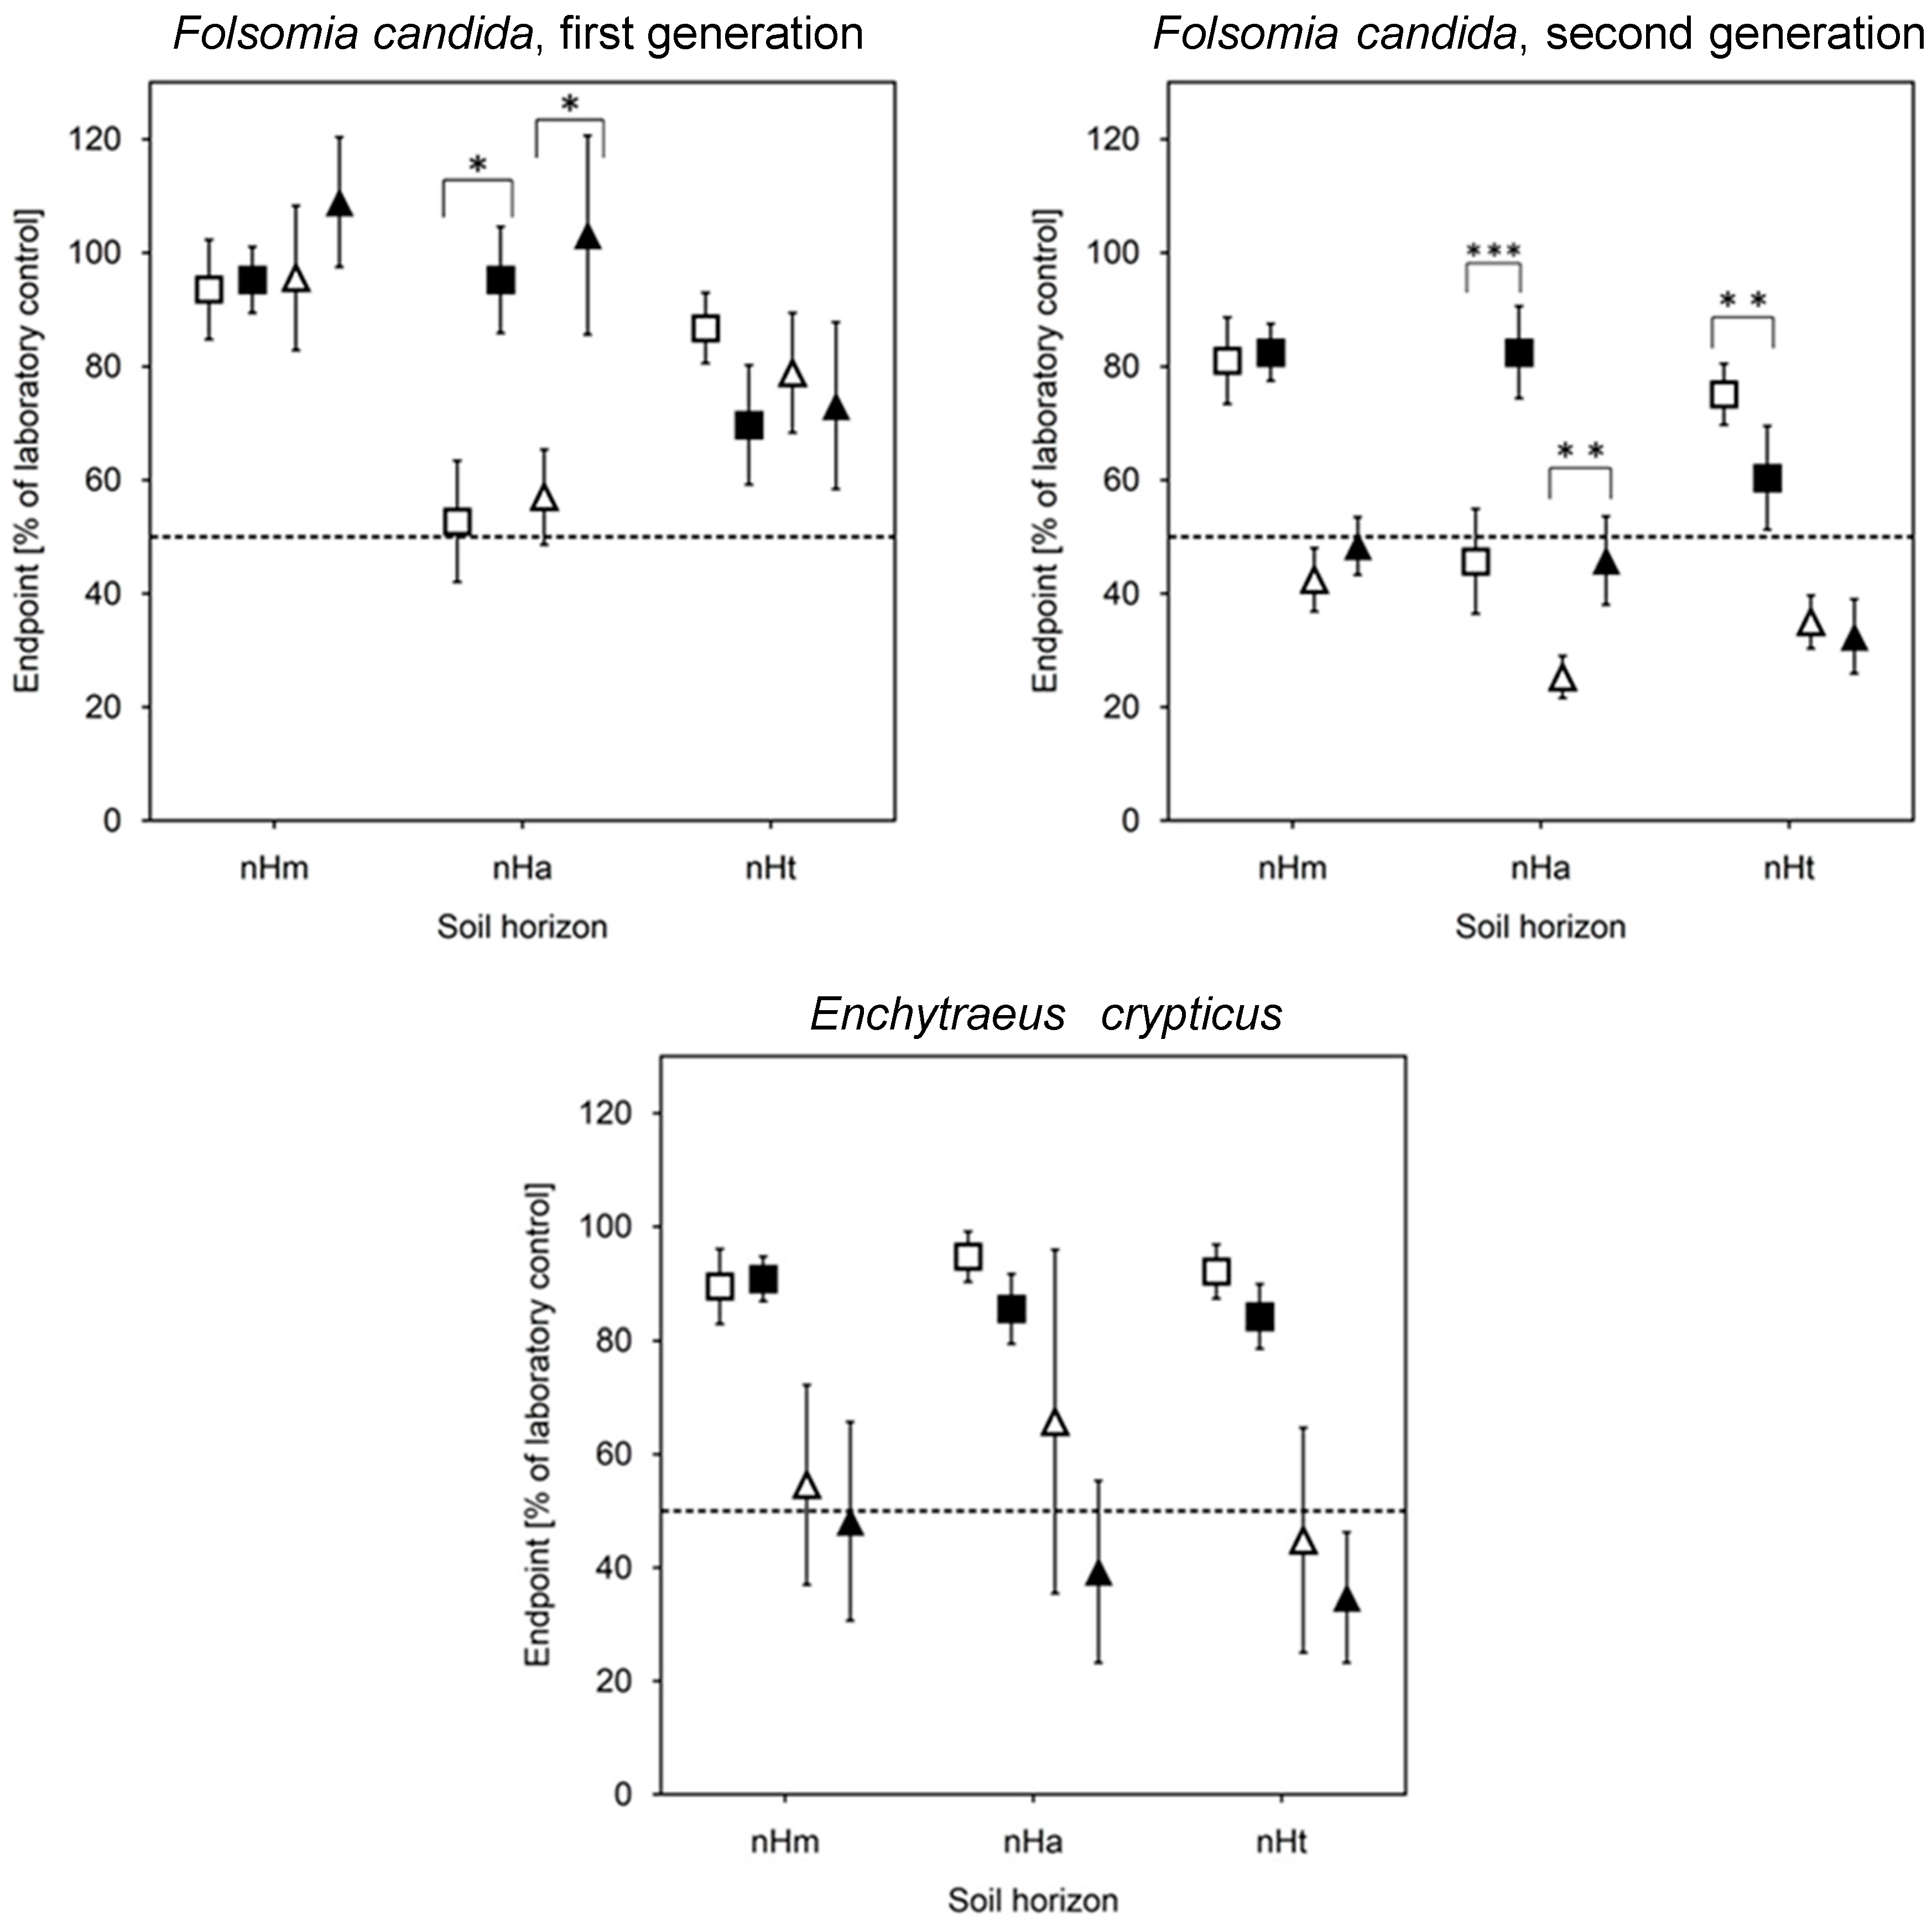
3.4. Biotests with Soil (Risk Assessment)

All biotests were valid according to the specific test guidelines with respect to the criteria relating to the laboratory control. Only the variance in the number of first-generation juveniles of Folsomia candida exceeded the stated coefficient of variation value (30%, observed: 40%). However, this is considered to have no further impact on the integrity of the results besides the resulting lower statistical power.
The comparison with the species-specific threshold values as defined in ISO 17616 [33] demonstrated that several soil horizons were no suitable habitats for some of the tested organisms (Figure 9). This was specifically indicated by reproduction of Enchytraeus crypticus as well as survival and reproduction of Folsomia candida in the second generation. The first generation of this collembolan species reproduced well in all soils, except in the nHa horizon sampled before rewetting. Several test organisms performed significantly better in the soil sampled after three years of rewetting than in the soil sampled before rewetting. This was found specifically with regard to growth of the plant Avena sativa in the upper nHm and nHa horizons as well as survival and reproduction of first and second generation of Folsomia candida in the nHa horizon. A significant worse performance in soil after rewetting compared to soil before rewetting was only observed with regard to one endpoint in one soil horizon, i.e., dehydrogenase activity of Arthrobacter globiformis in the middle nHa horizon.

4. Discussion

4.1. Dissipation

To discuss the dissipation of micropollutants in the peat site, we clustered the substances into two groups (Figure 10):
  • First group, where the concentration in the groundwater was approximately identical with the TMC and higher than the LoQ: diclofenac, p-TSA + o-TSA, AA, metoprolol, and bezafibrate.
  • Second group, where the measured concentration in the groundwater is lower than the TMC: acesulfame, diatrizoate, FAA, tolyltriazole, carbamazepine, benzotriazole, PBSA, and AAA.
For the first group, with only slight deviations in the measured concentration in groundwater compared with the TMC, we conclude that they display an almost persistent behavior with only a slight sorption to soil and negligible biodegradation. For diclofenac, a low level of sorption in the reference plot G2 was documented (Figure 7), whereas the highest measured concentration of diclofenac in the groundwater was found in G4. The result fits well with the calculated TMC, which was performed for the hydrological conditions in the G4 transect.
In the literature, the anionic diclofenac is described to be more persistent under anaerobic wetland conditions [30], anaerobic river sediments [38], sandy saturated aquifers [39], and treated wastewater sludge [40]. This is in agreement with our findings. Due to the negative charge, sorption to the negatively loaded humic substances of the peat seems to be insignificant. The biotransformation of diclofenac is described as small [10], but mostly under oxic conditions [10,41]. Photodegradation, as a dominant process for the removal [42], is dependent on the pattern of soil cover by Phragmites australis which provides shadow on a brown soil surface. However, a significant plant uptake, especially with macrophytes, reported by Zhang et al. [43], should not be overlooked. The presence of diclofenac in the ditch, as the only micropollutant that was found above the LoQ, suggests that under these conditions diclofenac is able to reach the deeper groundwater zone and to be upwelled into the ditch.
p-TSA+o-TSA are catalyzers with logKow (−0.62) and no tendency to be sorbed. Meffe et al. [44] found a removal of p-TSA under oxic, but not under anoxic conditions. In accordance with the prevailing redox conditions (mostly of Eh < 0 mV, see Figure 6), which are between anaerobic and anoxic, it can be concluded, that mainly the dissipation was caused by mixing.
In addition, the neutral aminoantipyridine AA (logKow 0.84), which was found in both reference plots in the expected concentration around TCM, underline the findings in the literature. As a polar substance the sorption tendency is small [45,46]. During an aerobic rapid sand filtration, phenazone compounds were found to be eliminated while anoxic conditions inhibit degradation [47].
The beta-blocker metoprolol (logKow 1.80) was moderately sorbed to soils (Figure 7). The main factor responsible for the retardation is the cation exchange process [48,49]. Sorption studies in column experiments with aquifer sediments underline these findings and show that Ca-rich environments enhance a desorption from the soil matrix [50,51]. In comparison with peat soils, the investigated soil types have a lower carbon content. A slightly higher concentration in the groundwater compared with TMC in both reference plots could hint at a desorption process in the calcium-rich peat.
The anionic acid bezafibrate, with a logKow of 3.97 [52], is not prone to adsorb to soil but biodegradable under conditions when biodegradable carbon is sufficient [53]. In our study, we could not prove that this was occurring, as the potential maximum concentration was less than the LoQ (Table 4). As bezafibrate was found in both groundwater observation wells, G2 and G4, a removal by biodegradation seems to be limited under the given abiotic and biotic conditions. Concentration in the expected small range underlines findings regarding bank filtration [54]. At 1.11 µg L−1, the median of the concentration in treated wastewater from the small Passow WWTP is relatively low and is compared with a larger WWTP in the metropolis of Berlin in the same range [55].
The second discriminated group shows a higher difference between the TMC and the detected concentration in the groundwater or the LoQ. Here, we also assume that there is a higher sorption and/or biodegradation, and plant uptake (Figure 1).
The sweetener acesulfame (logKow (–1.33)), with the highest concentration in treated wastewater (mean = 41 µg L–1) is known to be persistent and mobile and hence an ideal tracer for the presence of wastewater in the groundwater [56,57,58], under both oxic and anoxic conditions, and independent of the organic carbon content [59,60]. Our findings did not prove these results. There is a discrepancy of about 70% with respect to the TMC. Tran et al. [61] reported biodegradation by ammonia-oxidizing bacteria and co-metabolic biodegradation in activated sludge. However, further studies considering enhanced nitrification activity or the availability of ammonium did not verify this degradation process [62]. Scheurer et al. [63] reported moderate degradation because of the prolonged residence time within the natural environments.
The iodinated X-ray contrast medium diatrizoate is known to be very persistent in natural water. However, Redeker et al. [64] found anaerobic degradation with a corresponding transformation under anoxic conditions into stable transformation products which have been mineralized under air atmosphere. Rühmland et al. [30] confirmed the biodegradation of diatrizoate under anaerobic conditions in constructed wetlands.
The polar complexing agents tolyltriazole (logKow 1.19) and benzotriazole (logKow 1.08), which are applied as anticorrosive, have been disseminated below the LoQ. Benzotriazole, which could not be detected in the groundwater, is also described as stable in the environment with low sorption affinity to soils, even in the case of a soil with a high organic carbon content of about 6% [65]. For benzotriazole, the sorption to peat soil we found was in the range of maximum loading. This might be why it disappears in the groundwater. Breedveld et al. [66] reported efficient sorption at different pH values (3 and 7) to organic material such as peat and compost. The sorption could be of a hydrophobic nature at these pH values because the benzotriazole is present in unprotonated form [67]. Additionally, in Jia et al. [65] it is shown that ferrihydrite has a high sorption affinity to benzotriazole. The presence of a high iron content within the upper soil layers (see Table 2) could explain the high sorption behavior. Additionally, Liu et al. [68] found a biodegradation of benzotriazole and its derivates under both, aerobic and anaerobic conditions. While under nitrate reducing conditions the degradation rate of benzotriazole was less, under iron-reducing conditions for all investigated benzotriazoles the degradation was increasing.
Carbamazepine (logKow 2.50), with no dependency on pH, which was bound to soil in both reference plots and found in the groundwater to a small extent only, is known to be recalcitrant with low sorption [69] and not degradable under anoxic conditions [70,71]. Studies on the sorption behavior of carbamazepine in batch or column experiments were mostly carried out with mineral, sandy and loamy soils with a low organic matter content [53,72,73]. However, soil organic matter, besides other factors, is recognized as having a strong influence on sorption and biodegradation [74]. Borisover et al. [75] have shown that peat sorption is stronger the higher the hydration of the sorbent. Aristilde and Sposito [76] describe the different sorption behavior of terrestrial humic acids (including peat) and aquatic humic acids with respect to the antimicrobial ciprofloxacin. The aromatic structure of peat humic acids enhances the van-der Waals interactions as well as hydrogen-bond-donating moieties which could be responsible for the binding environment. According to Żabczyński et al. [77], humic acids act as OH radicascavengers. Sauvêtre and Schröder [78] reported on the uptake of carbamazepine by the rhizomes and by bacteria endophytic to Phragmites australis. A removal efficiency of 90% was obtained nine days after a treatment with 5 µg L–1. Richter et al. [79] found the best sorption for carbamazepine and other investigated substances for two carbon-rich and acidic peaty soils (TOC 5.5% and 10%, pH 4.8 and 5.5, respectively) in comparison with two sandy soils (TOC 1.8% and 1.1%, pH 6.8 and 6.9, respectively). For both soil types, a biotic and abiotic degradation of carbamazepine and the formation of transformation products were reported in König et al. [80]. The authors stated that the removal processes under more complex conditions are more manifold than under controlled lab conditions.
The UV filter PBSA, a polar substance (logKow 1.03), is described as mobile [81]. The most effective degradation process of the nonionic compound is photodegradation. However, Zhang et al. [82] have found decreased degradation when colloidal organic matter is present. Similar to diclofenac, under the conditions of the high stands of Phragmites and Typha with a covered soil surface, the effect of photodegradation is somewhat inhibited, but cannot be excluded.
The metabolites of phenazone-type pharmaceuticals AA, FAA and AAA are redox-sensitive, their degradation occurs more efficiently under oxic conditions [47]. As remnants have been detected in both reference plots we assume that the water-table differences (Figure 4) between these plots are not a significant explanation. If oxic conditions enhance the degradation, the aerenchym of the wetland plants, which oxygenate the root environment, could be considered as a significant promoter of the retention process.

4.2. Microbial Activity and Potential for the Degradation of Micropollutants in Peat Soils

Microbial biodegradation of micropollutants may generally occur via metabolism and/or co-metabolism pathways. In the case of metabolism, microorganisms use organic compounds directly as substrates for cell growth, increasing their enzyme activities. For the microbial decay of many poorly utilizable micropollutants, microorganisms depend on easily degradable organic carbon as a source of energy for biomass growth and enzyme induction. This is described as co-metabolism. Micropollutants can be microbially degraded via aerobic or anaerobic pathways. However, to our knowledge, no studies have been conducted regarding the microbial degradation of micropollutants in peat substrates.
In the peat soil of the Biesenbrow pilot site, the preconditions for a microbial decay of micropollutants are evident. The high carbon content of the peat soil and the high level of enzyme activities at the Biesenbrow pilot site are favorable prerequisites that allow for the co-metabolism of poorly degradable micropollutants [61]. The geohydrological settings and the continuously low redox potential in the peat soil (Figure 6) create anaerobic conditions for microbial communities. Studies on the anaerobic digestion of organic micropollutants in sewage sludge show that, beside the community structure and substance availability, the residence time is another factor known to be crucial for the micropollutant degradation rate [83,84,85]. In most activated sludge systems, the residence time ranges from 10 to 65 days [61]. The high content of organic matter detected in the peat soil (≤ 36% Corg, Table 2) and in the groundwater (mean DOC 16 mg L–1) in combination with long groundwater residence times (vertical travel time in the peat approximately 3 months m–1) are favorable conditions for microbial activity. Microbial biodegradation of micropollutants is known to increase along with the residence time, as it promotes the adaptation of the microbial community as well as microbial enzyme expression [86,87]. Indeed, high microbial activities of the enzymes FDA hydrolase and beta-glucosidase (Figure 8) were observed in the Biesenbrow peat soil. The measured FDA hydrolase activities (5–7 µmol gdw–1 h–1) were in the same range as described by other authors studying peatlands (e.g., Reiche et al. [88] up to 15 µmol gdw–1 h–1). In contrast, the determined beta-glucosidase activities were very high (100–200 µmol gdw–1 h–1) compared to findings of Hill et al. [89] for fen peatlands (up to approximately 18 µmol gdw–1 h–1).
For many different soils, microbial enzyme activities have been described as increasing during wastewater application due to the high content of organic carbon and nutrients in the wastewater (overview in Becerra-Castro et al. [90]). The supply with organic matter and nutrients is expected to stimulate certain microorganisms as well as different metabolic pathways [90]. However, no significant changes in microbial activity were found during the 3-year wastewater application of the present study (data not shown).
Altogether, the environmental conditions (high carbon content, residence times and enzyme activities) and the low concentrations of micropollutants in the groundwater at the Biesenbrow pilot site suggest that there is a high potential for the microbial degradation of micropollutants in the peat soil.

4.3. Ecotoxicological Impacts of Wastewater Application

As summarized in Table 2, soil pH was slightly increased in all soil horizons by flooding with wastewater. However, this and other key soil properties were in all samples within the range that is suitable for the selected tested organisms [33]. Hence, these parameters cannot explain any difference between the toxicity of soil samples before and after rewetting. The selection of collembolans and enchytraeids (instead of, e.g. earthworms) was in line with OECD guideline 232 [91] that recommends these organisms for testing more acidic soils (such as peaty soils). The impacted performance of these two test organisms in the soils, independently of wastewater application, must therefore be due to other factors, which may include background levels of existing organic or inorganic contaminants. Indeed, measured concentrations of arsenic (Table 2) before as well as after rewetting clearly exceeded proposed protective soil values for arsenic, but not for cadmium, zinc, nickel, lead, chromium, copper or lead metals [92]. Particularly collembolans and enchytraeids have been shown to be highly sensitive to arsenic with no observed effect concentrations (NOECs) at or below 10 mg/kg soil [93,94,95], while the plant Avena sativa and the bacterium Arthrobacter globiformis are far less susceptible [92]. The effects were most apparent in the second generation of exposed collembolans in the present study, which is in line with a recent report on transgenerational effects of arsenic in an aquatic organism, the zebrafish [96]. Hence, the impacted soil habitat quality for the collembolan and enchytraeid species at the study site clearly points at ecotoxicologically relevant concentrations of arsenic in the soil. Since the effects were also observed in soil sampled before rewetting, it can be concluded that the ecotoxic arsenic concentrations is most likely geogenic and did not result from the rewetting with treated wastewater. Rewetting actually improved the habitat quality of the middle soil horizon even, which indicates that arsenic leached to some degree from this soil horizon or otherwise became less bioavailable due to rewetting. Improvement of soil habitat quality by wastewater application was likewise observed in a soil column experiment with four field-sampled soils percolated over a period of three months [79]. For two soils that were particularly highly contaminated with metals, PAHs and PCBs, the performance of the test organisms Avena sativa and Enchytraeus crypticus was significantly improved by the percolation with treated wastewater.
Since the plant Avena sativa shows little sensitivity to arsenic (also reflected in good growth in soil sampled before rewetting), nutrient enrichment by flooding with treated wastewater is the more likely explanation for the observed improved plant growth in the upper soil horizons after rewetting. The test with the soil bacterium Arthrobacter globiformis with the middle horizon (nHa) provides the only evidence for deteriorated soil habitat quality by rewetting with treated wastewater. This finding has to be interpreted with care as guideline ISO 17616 [33] states that at least two different endpoints should show effects to conclude on significantly restricted soil habitat quality. Overall, the ecotoxicological test battery covering representative organisms from the taxonomic groups of bacteria, plants, annelids and arthropods provided no evidence that the three-year application with diluted treated wastewater had a significantly negative impact on the soil ecosystem. For some organisms, rewetting even improved soil quality, presumably due to nutrient enrichment and reduction of toxic background levels of arsenic. Concern for the soil ecosystem at this field site was raised, not due to wastewater-born micropollutants, but related to ecotoxicologically relevant background levels of naturally occurring contaminants, in particular arsenic.

5. Conclusions

From the findings at the Biesenbrow pilot site, we conclude that rewetting with treated wastewater at organic peat soil did not show a significant negative impact on the soil and groundwater after three years of wastewater application rewetting. The surplus water was a mixture of treated wastewater and surface water in order to prevent groundwater contamination during the “high-risk experiments”; hence, the findings are valid for the applied concentration. Our investigations encourage the running of further field studies with higher concentrations involving peaty wetlands. Their long-term behavior under real-world conditions is the sum of certain pedological, hydrological, chemical and biological factors: a changing water table in the upper peat layers enhances photodegradation and ozonation under aerobic conditions, whereas the zone beneath the groundwater table is continuously reduced in oxygen. In the upper horizon, the groundwater level fluctuates with varying soil moisture. Phragmites and Typha stands might enhance biodegradation by enzymes. The divergent findings for diclofenac, carbamazepine, acesulfame and diatrizoate compared to literature studies might be the result. Following the top-down approach with the positive removal effects of micropollutants, special investigations should be carried out on organic soils considering the specific environmental conditions, to identify the governing processes. Because of restrictions regarding groundwater protection, the applied loads of micropollutants in the field experiment were on a relatively low level. Nevertheless, a wide range of compounds reached a concentration higher than the limit of quantification despite dilution of wastewater with surface water. Hence, a possible accumulation of micropollutants in soil due to long-term flooding with wastewater (i.e., more than three years) could not be excluded. Therefore, it is necessary to better understand and describe possible removal processes such as biodegradation.
Summarizing the effects and possible removal processes, the peatland environmental conditions seem to be a pre-condition for micropollutant removal within the landscape. Such buffer zones for surface water protection within the vicinity of rural medium-sized WWTPs could both post-clean treated wastewater and store water and carbon. Although no risk for soil organisms has been detected in the present study and a positive effect on adjacent surface water systems is expected when wastewater is applied to land instead of being directly discharged to water bodies, rewetted peatland areas may turn into a sink for wastewater-born micropollutants in the long term. Hence, only already degraded, but certainly not pristine, natural peat areas should be considered for wastewater application. The positive effect of decreased peat degradation and increased carbon storage should be taken into account when considering the risks and benefits of wastewater usage.

Supplementary Materials

The following are available online at www.mdpi.com/2073-4441/9/6/449/s1, Figure S1: Simulated concentration at the reference plot G4 in 2 m depth.

Acknowledgments

We would like to thank Karsten Stornowski from the Soil and Water association “Welse” for providing the Biesenbrow pilot site and for extensive technical support, and Peter Heldt for the stressful water management and the weekly groundwater table measurements. We thank Arne Wick from the German Federal Institute of Hydrology (Bundesanstalt für Gewässerkunde, Koblenz), and Florian Wode of Berlin Water Works (Berliner Wasserbetriebe) for providing the water and soil analyses for micropollutants and for helpful critical comments on the manuscript. Particular thanks go to Ralf Dannowski for his extensive hydrological advice. We would like to thank Jutta Zeitz at the Humboldt University of Berlin for the peat soil mapping at the Biesenbrow site.We would like to thank the anonymous reviewers for their helpful suggestions. This study was financially supported by the German Federal Ministry of Education and Research (BMBF) through the project ELaN (FKZ 033L025). Bruno Guimarães has a doctoral fellowship from the Portuguese Foundation for Science and Technology (FCT) (SFRH/BD/95559/2013). Thanks are also due, for the financial support to the Centre for Environmental and Marine Studies (CESAM) of the University of Aveiro (UID/AMB/50017), to FCT/MEC through national funds, and the co-funding by the European Regional Development Fund (ERDF), within the PT2020 Partnership Agreement and Compete 2020. The publication of this article was funded by the Open Access fund of the Leibniz Association.

Author Contributions

Dagmar Balla and Sebastian Maassen contributed to the planning, monitoring, and evaluation of the experiments, and to the manuscript preparation and editing. Elisabeth Richter, Bruno Guimarães and Anja Coors provided the ecotoxicological investigations, and contributed to manuscript preparation and editing. All authors have read and approved the final manuscript.

Conflicts of Interest

The authors declare no conflict of interest.

References

  1. Communication from the Commission to the European Parliament, the Council, the European Economic and Social Committee and the Committee of the Regions—A Blueprint to Safeguard Europe’s Water Resources, COM (2012) 673 Final. Available online: http://ec.europa.eu/environment/water/blueprint/ia_en.htm (accessed on 1 February 2017).
  2. Naiman, C.P.J.; Decamps, H.; Mc Clain, M.E. Ecology, Conservation, and Management of Streamside Communities, Riparia 1st ed.; Elsevier Academic Press: London, UK, 2005. [Google Scholar]
  3. Roebeling, P.C.; Cunha, M.C.; Arroja, L.; van Grieken, M.E. Agricultural water pollution treatment for efficient water quality improvement in linked terrestrial and marine ecosystems. J. Coast. Res. 2011, 64, 1936–1940. [Google Scholar]
  4. Couwenberg, J.; Fritz, C. Towards developing IPCC methane ‘emission factors’ for peatlands (organic soils). Mires Peat 2012, 10, 1–17. [Google Scholar]
  5. Maassen, S.; Balla, D.; Dannowski, R. Long-term behavior of groundwater chemistry in a periodically rewetted fen area covered with macrophytes. J. Environ. Manag. 2015, 150, 412–419. [Google Scholar] [CrossRef] [PubMed]
  6. Kümmerer, K. Pharmaceuticals in the environment. Annu. Rev. Environ. Resour. 2010, 35, 57–75. [Google Scholar] [CrossRef]
  7. Ternes, T.; Joss, A. Human Pharmaceuticals, Hormones and Fragrances—The Challenge of Micropollutants in Urban Waste Water Manag; IWA Publishing: London, UK, 2007. [Google Scholar]
  8. Schwarzenbach, R.P.; Escher, B.I.; Fenner, K.; Hofstetter, T.B.; Johnson, C.A.; von Gunten, U.; Wehrli, B. The challenge of micropollutants in aquatic systems. Science 2006, 313, 1072–1077. [Google Scholar] [CrossRef] [PubMed]
  9. Noguera-Oviedo, K.; Aga, D.S. Lessons learned from more than two decades of research on emerging contaminants in the environment. J. Hazard. Mater. 2016, 316, 242–251. [Google Scholar] [CrossRef] [PubMed]
  10. Lahti, M.; Oikari, A. Microbial transformation of pharmaceuticals naproxen, bisoprolol, and diclofenac in aerobic and anaerobic environments. Arch. Environ. Contam. Toxicol. 2011, 61, 202–210. [Google Scholar] [CrossRef] [PubMed]
  11. Wick, A.; Fink, G.; Joss, A.; Siegrist, H.; Ternes, A.T. Fate of beta blockers and psycho-active drugs in conventional wastewater treatment. Water Res. 2009, 43, 1060–1074. [Google Scholar] [CrossRef] [PubMed]
  12. Imfeld, G.; Braeckevelt, M.; Kuschk, P.; Richnow, H.H. Monitoring and Assessing Processes of Organic Chemicals Removal in Constructed Wetlands. Chemosphere 2009, 74, 349–362. [Google Scholar] [CrossRef] [PubMed]
  13. Schröder, P.; Navarro-Aviñó, J.; Azeizeh, H.; Goldhirsch, A.G.; DiGrigorio, S.; Komives, T.; Langergraber, G.; Lenz, A.; Maestri, E.; Memon, A.R.; et al. Using phytoremediation technologies to upgrade water treatment in Europe. Environ. Sci. Pollut. Res. 2007, 14, 490–497. [Google Scholar] [CrossRef]
  14. Carvalho, P.N.; Basto, M.C.P.; Almeida, C.M.R.; Brix, H. A Review of plant-pharmaceutical interactions: From uptake and effects in crop plants to phytoremediation in constructed wetlands. Environ. Sci. Pollut. Res. 2014, 21, 11729–11763. [Google Scholar] [CrossRef] [PubMed]
  15. Vasquez, M.I.; Lambrianides, A.; Schneider, M.; Kümmerer, K.; Fatta-Kassinos, D. Environmental side effect of o pharmaceutical coctails: What we know and what we should know. J. Hazard. Mater. 2014, 279, 169–189. [Google Scholar] [CrossRef] [PubMed]
  16. Verlicchi, P.; Zambello, E. How efficient are constructed wetlands in removing pharmaceuticals from untreated and treated urban wastewaters? A review. Sci. Total Environ. 2014, 470, 1281–1306. [Google Scholar] [CrossRef] [PubMed]
  17. Maassen, S.; Balla, D. Impact of hydrodynamics (ex- and infiltration) on the microbially controlled phosphorus mobility in running water sediments of a cultivated northeast german wetland. Ecol. Eng. 2010, 36, 1146–1155. [Google Scholar] [CrossRef]
  18. Zeitz, J.; Velty, S. Soil properties of drained and rewetted fen soils. J. Plant Nutr. Soil Sci. 2002, 165, 618–626. [Google Scholar] [CrossRef]
  19. Shareef, A.; Page, D.; Vanderzalm, J.; Williams, M.; Gupta, V.V.S.R.; Dillon, P.; Kookana, R. Biodegradation of Simazine and Diuron Herbicides Under Aerobic and Anoxic Conditions Relevant to Managed Aquifer Recharge of Storm Water. Clean Soil, Air Water 2014, 42, 745–752. [Google Scholar] [CrossRef]
  20. Siemens, J.; Huschek, G.; Walshe, G.; Siebe, C.; Kasteel, R.; Wulf, S.; Clemens, J.; Kaupenjohann, M. Transport of Pharmaceuticals in Columns of a Wastewater-Irrigated Mexican Clay Soil. J. Environ. Qual. 2010, 39, 1201–1210. [Google Scholar] [CrossRef] [PubMed]
  21. Matamoros, V.; Caselles-Osorio, A.; García, J.; Bayona, J.M. Behaviour of Pharmaceutical products and biodegradation intermediates in horizontal subsurface flow constructed wetland. A microcosmexperiment. Sci. Tot. Environ. 2008, 394, 171–176. [Google Scholar] [CrossRef] [PubMed]
  22. Greskowiak, J.; Prommer, H.; Massmann, G.; Nützmann, G. Modeling seasonal redox dynamics and the corresponding fate of the pharmaceutical residue during artificial recharge of groundwater. Environ. Sci. Technol. 2006, 40, 6615–6621. [Google Scholar] [CrossRef] [PubMed]
  23. Balla, D.; Maassen, S.; Dannowski, R. Value-adding of rewetted fen peatlands using their purification potential with respect to surface water. In Peatlands in Balance, Proceedings of the 14th International Peat Congress, Stockholm, Sweden, 3–8 June 2012; International Peat Society: Jyväskylä, Finland, 2012; Abstract 423. [Google Scholar]
  24. World Reference Base for Soil Resources. Available online: http://www.fao.org/docrep/w8594e/w8594e00.HTM (accessed on 1 February 2017).
  25. Arbeitsgruppe Boden. Bodenkundliche Kartieranleitung, 4th ed.; Publisher: Bundesanstalt für Geowissenschaften und Rohstoffe und Geologische Landesämter: Hannover, Germany, 1994. (In German) [Google Scholar]
  26. Dannowski, R.; Balla, D. Wasserhaushalt und geohydraulische Situation einer vernässten Niedermoorfläche mit Schilfanbau in Nordost-Brandenburg. Arch. Nat. Conserv. Landsc. Res. 2004, 43, 27–40. (In German) [Google Scholar]
  27. Grundwasserverordnung vom 9. November 2010 (BGBl. I S. 1513). Available online: https://www.gesetze-im-internet.de/bundesrecht/grwv_2010/gesamt.pdf (accessed on 1 February 2017).
  28. FEFLOW. Available online: https://www.mikepoweredbydhi.com (accessed on 1 February 2017).
  29. Wode, F.; Reilich, C.; van Baar, P.; Dünnbier, U.; Jekel, M.; Reemtsma, T. Multiresidue analytical method for the simultaneous determination of 72 micropollutants in aqueous samples with ultra high performance liquid chromatography–high resolution mass spectrometry. J. Chromatogr. A 2012, 1270, 118–126. [Google Scholar] [CrossRef] [PubMed]
  30. Rühmland, S.; Wick, A.; Ternes, T.A.; Barjenbruch, M. Fate of pharmaceuticals in a subsurface flow constructed wetland and two ponds. Ecol. Eng. 2015, 80, 125–139. [Google Scholar] [CrossRef]
  31. Braguglia, C.M.; Coors, A.; Gallipoli, A.; Gianico, A.; Guillon, E.; Kunkel, U.; Mascolo, G.; Richter, E.; Ternes, T.A.; Tomei, M.C.; Mininni, G. Quality Assessment of digested sludges produced by advanced stabilization processes. Environ. Sci. Pollut. Res. Int. 2015, 22, 7216–7235. [Google Scholar] [CrossRef] [PubMed]
  32. Analyses Data Sheet for Standard Soils according to GLP. Available online: http://www.lufa-speyer.de/images/stories/2016-STB-Bo-data_sheet.pdf (accessed on 1 February 2017).
  33. ISO 17616. Soil Quality - Guidance on the Choice and Evaluation of Bioassays for Ecotoxicological Characterization of Soils and Soil Materials (2008). Available online: http://www.iso.org/iso/catalogue_detail.htm?csnumber=38417 (accessed on 1 February 2017).
  34. Succow, M.; Joosten, H. Landschaftsökologische Moorkunde; Schweizerbart‘sche Verlagsbuchhandlung: Stuttgart, Germany, 2010. (In German) [Google Scholar]
  35. Schindler, U.; Behrendt, A.; Müller, L. Change of soil hydrological properties of fens as a result of soil development. J. Plant Nutr. Soil Sci. 2003, 166, 357–363. [Google Scholar] [CrossRef]
  36. Umweltbundesamt. Bewertung der Abwesenheit teil- oder nicht bewertbarer Stoffe im Trinkwasser aus gesundheitlicher Sicht—Empfehlungen der Trinkwasserkommission des Umweltbundesamtes. Bundesgesundheitsbl-Gesundheitsforsch-Gesundheitsschutz 2003, 46, 249–251. (In German) [Google Scholar]
  37. Working Group of the Federal States on Water Issues (LAWA). Determination of Insignificance Thresholds for Groundwater. Available online: http://www.lawa.de/documents/GFS-Report_8df.pdf (accessed on 17 October 2016).
  38. Radke, M.; Maier, M. Lessons learned from sediment/water-testing of pharmaceuticals. Wat. Res. 2014, 55, 63–73. [Google Scholar] [CrossRef] [PubMed]
  39. Scheytt, T.; Mersmann, P.; Lindstädt, R.; Heberer, T. Determination of Sorption Coefficients of Pharmaceutically Active Substances Carbamazepine, Diclofenac, and Ibuprofen, in Sandy Sediments. Chemosphere 2005, 60, 245–253. [Google Scholar] [CrossRef] [PubMed]
  40. Falås, P.; Wick, A.; Castronovo, S.; Habermacher, J.; Ternes, T.A.; Joss, A. Tracing the Limits of Organic Micropollutants Removal in Biological Wastewater Treatment. Water Res. 2016, 95, 240–249. [Google Scholar] [CrossRef] [PubMed]
  41. Jewell, K.S.; Falås, P.; Wick, A.; Joss, A.; Ternes, T.A. Transformation of Diclofenac in Hybrid Biofilm-Activated Sludge Processes. Water Res. 2016, 105, 240–249. [Google Scholar] [CrossRef] [PubMed]
  42. Boreen, A.L.; Arnold, W.A.; McNeill, K. Photodegradation of pharmaceuticals in the aquatic environment: A review. Aquat. Sci. 2003, 65, 320–341. [Google Scholar] [CrossRef]
  43. Zhang, D.Q.; Hua, T.; Gersberg, R.M.; Zhu, J.; Ng, W.J.; Tan, S.K.D. Fate of diclofenac in wetland mesocosm planted with Scirpus validus. Ecol. Eng. 2012, 49, 59–64. [Google Scholar] [CrossRef]
  44. Meffe, R.; Massmann, G.; Kohfahl, C.; Taute, T.; Richter, D.; Dünnbier, U.; Pekdeger, A. Investigation the redox sensitivity of para-toluenesulfonamide(p-TSA) in groundwater. Environ. Earth Sci. 2012, 65, 861–870. [Google Scholar] [CrossRef]
  45. Tolls, J. Sorption of Veterinary Pharmaceuticals in Soils: A Review. Environ. Sci. Technol. 2001, 35, 3397–3406. [Google Scholar] [CrossRef] [PubMed]
  46. Kah, M.; Brown, C.D. Prediction of the adsorption of ionizable pesticides in soils. J. Agric. Food Chem. 2007, 55, 2312–2322. [Google Scholar] [CrossRef] [PubMed]
  47. Massmann, G.; Dünnbier, U.; Heberer, T.; Taute, T. Behavior and redox sensitivity of pharmaceutical residues during bank filtration—Investigation of Residues of Phenazone-Type Analgesics. Chemosphere 2008, 71, 1476–1485. [Google Scholar] [CrossRef] [PubMed]
  48. Kodešová, R.; Grabic, R.; Kočárek, M.; Klement, A.; Golovko, O.; Fér, M.; Nikodem, A.; Jakšík, J. Pharmaceuticals’ sorption relative to soil properties of thirteen different Soils. Sci. Tot. Environ. 2015, 51, 435–443. [Google Scholar] [CrossRef] [PubMed]
  49. Kodešová, R.; Kočárek, M.; Klement, A.; Golovko, O.; Koba, O.; Fér, M.; Nikodem, A.; Vondráčková, L.; Jakšík, J.; Grabic, R. An analysis of the dissipation of pharmaceuticals under thirteen different soil conditions. Sci. Total Environ. 2016, 544, 369–381. [Google Scholar] [CrossRef] [PubMed]
  50. Schaffer, M.; Boxberger, N.; Börnick, H.; Licha, T.; Worch, E. Sorption Influenced transport of ionizable pharmaceuticals onto natural sandy aquifer sediment at different pH. Chemosphere 2012, 8, 513–520. [Google Scholar] [CrossRef] [PubMed]
  51. Schaffer, M.; Börnick, H.; Nödler, K.; Licha, T.; Worch, E. Role of cation exchange processes on the sorption influenced transport of cationic ß-blockers in Aquifer Sediments. Water Res. 2012, 46, 5472–5482. [Google Scholar] [CrossRef] [PubMed]
  52. Wode, F. Screening und Quantifizierung Organischer Spurenstoffe Mittels UPLC-HRMS: Entwicklung von Methoden und Anwendung zur Unterscheidung Historischer und Aktueller Spurenstoffe in Einem Ehemaligen Rieselfeld. Ph.D. Thesis, TU Berlin, Berlin, Germany, 28 August 2014. (In German). [Google Scholar]
  53. Maeng, S.K.; Sharma, S.K.; Abel, C.D.T.; Magic-Knezev, A.; Amy, G.L. Role of biodegradation in the removal of pharmaceutically Active Compounds with Different Bulk Organic Matter Characteristics Trough Managed Aquifer Recharge. Batch and Column Studies. Water Res. 2011, 45, 4722–4736. [Google Scholar] [CrossRef] [PubMed]
  54. Heberer, T.; Adam, M. Transport and Attunuation of pharmaceuticals during artificial groundwater replenishment. Environ. Chem. 2004, 1, 22–25. [Google Scholar] [CrossRef]
  55. Müller, B.; Scheytt, T.; Asbrand, M. Pharmaceuticals as indicator of sewage-influenced groundwater. Hydrogeol. J. 2012, 20, 1117–1129. [Google Scholar] [CrossRef]
  56. Buerge, I.J.; Keller, M.; Buser, H.-R.; Müller, M.D.; Poiger, T. Saccharin and other Artificial Sweeteners in Soils: Estimated Inputs from Agriculture and Households, Degradation, and Leaching to Groundwater. Environ. Sci. Technol. 2011, 45, 615–621. [Google Scholar] [CrossRef] [PubMed]
  57. Van Stempvoort, D.R.; Robertson, W.D.; Brown, S.J. Artificial sweeteners in a large septic plume. Ground Water Monit. Rem. 2011, 31, 95–102. [Google Scholar] [CrossRef]
  58. Jekel, M.; Dott, W.; Bergmann, A.; Dünnbier, U.; Gnirß, R.; Haist-Gulde, B.; Hamscher, G.; Letzel, M.; Licha, T.; Lyko, S.; et al. Selection of organic process and source indicator substances for the anthropogenically influenced water cycle. Chemosphere 2015, 125, 155–167. [Google Scholar] [CrossRef] [PubMed]
  59. Tran, N.H.; Gan, J.; Nguyen, V.T.; Chen, H.; You, L.; Duarah, A.; Zhang, L.; Gin, K.Y. Sorption and biodegradation of Artificial Sweeteners in Activated Sludge Processes. Bioresour. Technol. 2015, 197, 329–338. [Google Scholar] [CrossRef] [PubMed]
  60. Scheurer, M.; Brauch, H.-J.; Lange, F.T. Analysis and occurrence of seven Artificial Sweeteners in German waste water and surface water and in soil aquifer treatment (SAT). Anal. Bioanal. Chem. 2009, 394, 1585–1594. [Google Scholar] [CrossRef] [PubMed]
  61. Tran, N.H.; Nguyen, V.T.; Urase, T.; Ngo, H.H. Role of Nitrification in the biodegradation of selected artificial sweetening agents in biological wastewater treatment process. Bioresour. Technol. 2014, 161, 40–46. [Google Scholar] [CrossRef] [PubMed]
  62. Castronovo, S.; Wick, A.; Scheurer, M.; Nödler, K.; Schulz, M.; Ternes, T.A. Biodegradation of the artificial sweetener acesulfame in biological treatment and sandfilters. Water Res. 2017, 110, 342–353. [Google Scholar] [CrossRef] [PubMed]
  63. Scheurer, M.; Storck, F.R.; Graf, C.; Brauch, H.-J.; Ruck, W.; Lev, O.; Lange, F.T. Correlation of six anthropogenic markers in wastewater, surface water, bank filtrate, and soil aquifer treatment. J. Environ. Monit. 2011, 13, 966–973. [Google Scholar] [CrossRef] [PubMed]
  64. Redeker, M.; Wick, A.; Meermann, B.; Ternes, T.A. Removal if the iodinated X-ray contrast medium diatrizoate by anaerobic transformation. Environ. Sci. Technol. 2014, 48, 10145–10154. [Google Scholar] [CrossRef] [PubMed]
  65. Jia, Y.; Aagaard, P.; Breedveld, G.D. Sorption of triazoles to soil and iron minerals. Chemosphere 2007, 67, 250–258. [Google Scholar] [CrossRef] [PubMed]
  66. Breedveld, G.D.; Roseth, R.; Sparrevik, M.; Hartnik, T.; Hem, L.J. Persistence of the De-icing additive benzotriazole at an abandoned airport. Water Air Soil Pollut. 2003, 3, 91–101. [Google Scholar] [CrossRef]
  67. Jafvert, C.T. Sorption of organic acid compounds to sediments: Initial model development. Environ. Toxicol. Chem. 1990, 9, 1259–1268. [Google Scholar] [CrossRef]
  68. Liu, Y.; Ying, G.; Shareef, A.; Kookana, R.S. Biodegradation of three selected benzotriazoles in aquifer material under aerobic and anaerobic conditions. J. Contam. Hydrol. 2013, 151, 131–139. [Google Scholar] [CrossRef] [PubMed]
  69. Yu, L.; Fink, G.; Wintgens, T.; Melin, T.; Ternes, T.A. Sorption behavior of potential organic waste water indicators with soils. Water Res. 2009, 43, 951–960. [Google Scholar] [CrossRef] [PubMed]
  70. Suarez, S.; Lema, J.M.; Omil, F. Removal of pharmaceutical and personal care products (PPCPs) under nitrifying and denitrifying conditions. Water Res. 2010, 44, 3214–3224. [Google Scholar] [CrossRef] [PubMed]
  71. Hamann, E.; Stuyfzand, P.J.; Greskowiak, J.; Timmer, H.; Massmann, G. The Fate of organic micropollutants during long-term/long-distance river bank filtration. Sci. Total Environ. 2016, 545–546, 629–640. [Google Scholar] [CrossRef] [PubMed]
  72. Grossberger, A.; Hadar, Y.; Borch, T.; Chefetz, B. Biodegradability of pharmaceutical compounds in agricultural soils irrigated with treated waste water. Environ. Pollut. 2014, 185, 168–177. [Google Scholar] [CrossRef] [PubMed]
  73. Revitt, D.M.; Balogh, T.; Jones, H. Sorption Behavior and transport potential for selected pharmaceuticals and triclosan in two sterilized soils. J. Soils Sediments 2015, 15, 594–606. [Google Scholar] [CrossRef]
  74. Schwarzenbach, R.P.; Gschwend, P.M.; Imboden, D.M. Environmental Organic Chemistry, 2nd ed.; John Wiley & Sons Inc.: Hoboken, NJ, USA, 2003. [Google Scholar]
  75. Borisover, M.; Sela, M.; Chefetz, B. Enhancement Effect of water associated with natural organic matter (NOM) on organic compound-NOM Interactions: A case study with carbamazepine. Chemosphere 2011, 82, 1454–1460. [Google Scholar] [CrossRef] [PubMed]
  76. Aristilde, L.; Sposito, G. Complexes of the antimicrobial ciprofloxacin with soil, peat, and aquatic humic substances. Environ. Toxicol. Chem. 2013, 32, 1467–1478. [Google Scholar]
  77. Żabczyński, S.; Buntner, D.; Miksch, K.; Roig, B. Performance of the conventional treatment processes of the most resistant PPs. In Pharmaceuticals in the Envir. Current Knowledge and Need Assessment to Reduce Presence and Impact; Roig, B., Ed.; IWA publishing: London, UK, 2010; pp. 87–114. [Google Scholar]
  78. Sauvêtre, A.; Schröder, P. Uptake of Carbamazepine by rhizomes and endophytic bacteria of phragmites australis. Front. Plant. Sci. 2015, 6, 1–11. [Google Scholar] [CrossRef] [PubMed]
  79. Richter, E.; Hecht, F.; Schnellbacher, N.; Ternes, T.A.; Wick, A.; Wode, F.; Coors, A. Assessing the ecological long-term impact of wastewater irrigation on soil and water based on bioassays and chemical analyses. Water Res. 2015, 84, 33–42. [Google Scholar] [CrossRef] [PubMed]
  80. König, A.; Weidbauer, C.; Seiwert, B.; Reemtsma, T.; Unger, T.; Jekel, M. Reductive Transformation of carbamazepine by biotic and abiotic processes. Water Res. 2106, 101, 272–280. [Google Scholar] [CrossRef] [PubMed]
  81. Wick, A.; Marincas, O.; Moldovan, Z.; Ternes, T.A. Sorption of biocides, triazine, and phenylurea herbicides, and UV-filters onto secondary sludge. Water Res. 2011, 45, 3638–3652. [Google Scholar] [CrossRef] [PubMed]
  82. Zhang, S.; Chen, J.; Wang, Y. Humic Acids decrease the photodegradation of the sunscreen UV filter 2-phenylbenzimidazole-5-sulfonic acid in natural waters. Environ. Chem. Lett. 2012, 10, 389–394. [Google Scholar] [CrossRef]
  83. Barret, M.; Delgadillo-Mirquez, L.; Trably, E.; Delgenes, N.; Braun, F.; Cea-Barcia, G.; Steyer, J.P.; Patureau, D. Anaerobic Removal of trace organic contaminants in sewage sludge: 15 Years of Experience. Pedosphere 2012, 22, 508–517. [Google Scholar] [CrossRef]
  84. Delgadillo-Mirquez, L.; Lardon, L.; Steyer, J.P.; Patureau, D. A New dynamic model for bioavailability and cometabolism of micropollutants during anaerobic digestion. Water Res. 2011, 45, 4511–4521. [Google Scholar] [CrossRef] [PubMed]
  85. Stasinakis, A.S. Review on the Fate of Emerging Contaminants during Sludge Anaerobic Digestion. Bioresour. Technol. 2012, 121, 432–440. [Google Scholar] [CrossRef] [PubMed]
  86. Helbling, D.E.; Johnson, D.R.; Honti, M.; Fenner, K. Micropollutant biotransformation kinetics associate with WWTP process parameters and microbial community characteristics. Environ. Sci. Technol. 2012, 46, 10579–10588. [Google Scholar] [CrossRef] [PubMed]
  87. Yi, T.; Harper, W.; Holbrook, R.; Love, N. Role of Particle size and ammonium oxidation in removal of a-ethinyl estradiol in bioreactors. J. Environ. Eng. 2006, 132, 1527–1529. [Google Scholar] [CrossRef]
  88. Reiche, M.; Hädrich, A.; Lischeid, G.; Küsel, K. Impact of manipulated drought and heavy rainfall events on peat mineralization processes and source-sink functions of an acidic fen. J. Geophys. Res. 2014, G02021. [Google Scholar] [CrossRef]
  89. Hill, B.H.; Elonen, C.M.; Jicha, T.M.; Kolka, R.K.; Lehto, L.L.P.; Sebestyen, S.D.; Seifert-Monson, L.R. Ecoenzymatic stoichiometry and microbial processing of organic matter in northern bogs and fens reveals a cmmon P-limitation between peatland types. Biogeochemistry 2014, 120, 203–224. [Google Scholar] [CrossRef]
  90. Becerra-Castro, C.; Lopes, A.R.; Vaz-Moreira, I.; Silva, E.F.; Manaia, C.M.; Nunes, O.C. Wastewater reuse in irrigation: A microbiological perspective on implications in soil fertility and human and environmental health. Environ. Int. 2015, 75, 117–135. [Google Scholar] [CrossRef] [PubMed]
  91. OECD. Test No. 232—Collembolan Reproduction Test in Soil. In Guidelines for Testing Chemicals; OECD: Paris, France, 2009. [Google Scholar]
  92. Jänsch, S.; Römbke, J.; Schallnaß, H.-J.; Terytze, K. Derivation of soil values for the path ‚soil—Soil organisms‘ for metals and selected organic compounds using species sensitivity distributions. Environ. Sci. Pollut. Res. 2007, 14, 308–318. [Google Scholar] [CrossRef]
  93. Lock, K.; Janssen, C.R. Toxicity of arsenate to the compost worm Eisenia fetida, the Potworm Enchytraeus Albidus and the Springtail Folsomia Candida. Bull. Environ. Contam. Toxicol. 2002, 68, 760–765. [Google Scholar] [CrossRef] [PubMed]
  94. Greenslade, P.; Vaughan, G.T. A comparison of collembola species for toxicity testing of Australian soils. Pedobiologia 2003, 47, 171–179. [Google Scholar] [CrossRef]
  95. Crouau, Y.; Moia, C. The relative sensitivity of growth and reproduction in the springtail, folsomia Candida, exposed to Xenobiotics in the laboratory: An indicator of soil toxicity. Ecotoxicol. Environ. Saf. 2006, 64, 115–121. [Google Scholar] [CrossRef] [PubMed]
  96. Hallauer, J.; Geng, X.; Yang, H.-C.; Shen, J.; Tsai, K.-J.; Liu, Z. The effect of chronic arsenic exposure in zebrafish. Zebrafish 2016, 13, 405–412. [Google Scholar] [CrossRef] [PubMed]
Figure 1. Hypothetical scheme for the improved elimination of micropollutants present in treated wastewater used to rewet peatlands that serve as buffer zones for surface water (instead of directly discharging treated wastewater from the WWTP into the receiving surface water). The enlarged view shows the main processes involved in the removal of micropollutants. In the present study, the top layer was a formerly decomposed, now growing fen peat, underlain by a mineral aquifer.
Water 09 00449 g001
Figure 2. (a) Location of the Biesenbrow pilot site; and (b) water distribution system with monitoring/sampling design, and the transect A–A.
Water 09 00449 g002
Figure 3. Scheme of the water fluxes and water budget of the Biesenbrow pilot site along the regional groundwater flow direction (see Figure 2b). P, precipitation; Eta, actual evapotranspiration (modified after [26]).
Water 09 00449 g003
Figure 4. Groundwater hydrographs (groundwater depths beneath surface level) at reference plots G2 and G4 from June 2011 to December 2013.
Water 09 00449 g004
Figure 5. Transect A–A from Figure 2b: soil profile and groundwater level amplitudes (min, max and median) in the ditch (n = 663) and in the groundwater wells G3 (n = 5), G4 (n = 10), and G7 (n = 10). The distance between the ditch and groundwater well G7 is approximately 300 m.
Water 09 00449 g005
Figure 6. Redox potential in the peat soil of the Biesenbrow pilot site.
Water 09 00449 g006
Figure 7. Concentrations of micropollutants in the peat soil at the Biesenbrow site after three years of wastewater application for rewetting.
Water 09 00449 g007
Figure 8. Enzyme activity in the peat soil of the Biesenbrow pilot site. gdw, gram dry weight; nHm, peat earthified horizon; nHa, peat aggregate horizon; nHt, peat shrinkage horizon.
Water 09 00449 g008
Figure 9. Results of ecotoxicity tests with four test organisms and three soil horizons sampled in 2011 and 2014 (before and after rewetting, respectively). Each endpoint is depicted as a mean percentage in relation to the respective laboratory control (n = 5 for Avena sativa, n = 7 for Enchytraeus crypticus and n = 8 for Arthrobacter globiformis and Folsomia candida); error bars indicate standard errors. Symbols: white = 2011; black = 2014; circle = shoot length; cross = shoot biomass; diamond = dehydrogenase activity; square = survival; triangle = reproduction. Responses below the dotted lines (representing the threshold values according to ISO 17616 [33]) are considered as indication for deteriorated habitat quality for the respective test organism. Asterisks indicate significant differences between the samples from 2011 and 2014 (* p < 0.05; ** p < 0.01; *** p < 0.001, pair-wise t-tests).
Water 09 00449 g009aWater 09 00449 g009b
Figure 10. Detected concentration of several micropollutants, classified into groups.
Water 09 00449 g010
Table 1. Test organisms, endpoints and test guidelines used to assess the habitat quality of the soils before and after wastewater application.
TaxonSpeciesEndpoint, Test Duration, Number of Replicates (n)Test Guideline
Bacteria, micrococcaceaeArthrobacter globiformisinhibition of enzyme activity, 1 h (8)ISO 18187 (2014)
Annelids, enchytreidsEnchytraeus crypticusinhibition of reproduction, 28 d (8)OECD 220 (2004a)
Arthropods, springtailsFolsomia candidainhibition of reproduction, 28 d (7)OECD 232 (2009)
Monocotyledonous plantsAvena sativainhibition of growth, 14–21 d (5)ISO 11269-2 (2012), OECD 208 (2006d)
Table 2. Mean values (n = 3) of selected physico-chemical soil properties from fen peat soil horizons at reference plot G4, before (2011) and after three years of wastewater application (2014). WHCmax, maximum water holding capacity; Db, bulk density; Vp, pore volume.
HorizonnHmnHanHt
201120142011201420112014
Db (g cm–3)0.530.50.550.520.230.27
Vp (%)73 72 87
Corg (%)161616163735
Ct (%)161617163836
C/N121213121918
WHCmax (mm )162 155 232
Fe (g kg–1)798185812729
pH6.776.66.85.96.4
As (mg kg–1)353238325522
Cd (mg kg–1)0.9320.9820.630.62
Zn (mg kg–1)373042281729
Ni (mg kg–1)119.8109.6137.7
Cu (mg kg–1)241722161734
Cr (mg kg–1)119.61111116.1
Pb (mg kg–1)262825276.23.6
Table 3. Limits of quantitation (LoQ), concentration c of micropollutants (µg L–1) in treated wastewater and in the groundwater of reference plots G2 (n = 8) and G4 (n = 4), and the theoretical minimum concentration (TMC). n, measurements in treated wastewater; NoD, number of detections.
CompoundLoQTreated WastewaterTMCGroundwater
cmeancmin/cmaxnNoDcNoD
Pharmaceuticals
Diclofenac0.037.942.0/13.0770.330.301 (G4)
Carbamazepine0.024.852.7/7.0660.200.031 (G2)
0.041 (G4)
Metoprolol0.030.97<LoQ/1.8770.0410.071 (G2)
0.091 (G4)
Bezafibrate0.010.75<LoQ/4.1650.0310.031 (G2)
0.041 (G4)
Sotalol0.030.490.05/1.0660.02<LoQ0
Phenazone0.020.170.073/0.36660.007<LoQ0
Primidone0.050.067<LoQ/0.17730.003<LoQ0
Atenolol0.030.05<LoQ/0.19720.002<LoQ0
Oxazepan0.050.069<LoQ/0.14740.003<LoQ0
Clofibric acid0.010.043<LoQ/0.09420.002<LoQ0
Propranolol0.030.034<LoQ/0.09620.001<LoQ0
Diazepam0.050.029<LoQ/0.053710.001<LoQ0
Pharmaceutical Metabolites
FAA0.027.543.2/15770.320.031 (G2)
0.071 (G4)
AAA0.022.420.47/5.8770.100.021 (G2)
0.021 (G4)
4-Hydro-Diclofenac0.012.170.32/4.5770.091<LoQ0
AA0.031.3<LoQ/3.9310.0550.051 (G2)
0.0550.091 (G4)
AMPH0.020.230.10/0.49770.010.031 (G2)
0.031 (G4)
PEMA0.050.051<LoQ/0.18710.0020.061 (G2)
Pesticides
Desethylatrazine0.020.25<LoQ/1.2510.01<LoQ0
MCPA0.010.089<LoQ/0.31420.004<LoQ0
Isoproturon0.020.05<LoQ/0.16640.0020.021 (G2)
0.021 (G4)
Mecoprop0.010.0230.01/0.062420.001<LoQ0
Diuron0.020.029<LoQ/0.087730.001<LoQ0
Other Substances
Acesulfame0.00843.6219.85/67.0331.830.311 (G4)
Tolytriazol0.026.291.6/13770.260.021 (G2)
Diatrizoate0.00810.172.5/23.0330.430.021 (G2)
Benzotriazole0.024.11.8/5.8770.17<LoQ0
p-TSA+o-TSA0.051.73<LoQ/5.0650.0730.21 (G2)
PBSA0.0253.101.66/4.55220.130.071 (G4)
TCEP0.030.081<LoQ/0.2640.003<LoQ0
Table 4. Calculated maximum amount of solute adsorbed onto the peat (in ng g–1) for the upper soil layer compared to the LoQ for the analyzed substances in the soil.
DiclofenacDiatrizoateCarbamazepineBenzotriazoleBezafibrateMetoprololPrimidoneAtenololOxazepamIsoproturoneDiurone
Maximum Amount of Adsorption 111.47.27.05.91.61.40.170.170.140.10.04
LoQ1.31.250.32.52.50.51.252.50.50.250.25
Note: 1 under the assumption of Db = 0.5 g cm–3 according to Table 2, and a peat layer of 20 cm

