Article

Risk Analysis of Reservoir Operations Considering Short-Term Flood Control and Long-Term Water Supply: A Case Study for the Da-Han Creek Basin in Taiwan

1
Sinotech Engineering Consultants, 14th Fl. 171, Nanking East Rd., Sec. 5, Taipei 105, Taiwan
2
Department of Civil Engineering, National Taiwan University, No. 1, Sec. 4, Roosevelt Rd., Taipei 10617, Taiwan
3
Department of Marine Environmental Informatics, National Taiwan Ocean University, No. 2, Beining Rd., Jhongjheng District, Keelung City 20224, Taiwan
*
Author to whom correspondence should be addressed.
Water 2017, 9(6), 424; https://doi.org/10.3390/w9060424
Submission received: 3 February 2017 / Revised: 7 June 2017 / Accepted: 8 June 2017 / Published: 12 June 2017

Abstract

:
This study applies an integrated methodology to assess short-term over-levee risk and long-term water shortage risk in the Da-Han Creek basin, which is the most important flood control and water storage system in northern Taiwan. An optimization model for reservoir flood control and water supply is adopted, to determine reservoir releases based on synthetic inflow hydrographs during typhoons, which are generated by Monte Carlo simulations. The release is then used to calculate the water level at a downstream control point using a novel developed back-propagation neural network-based model, to reduce computational complexity and achieve automatic-efficient risk evaluation. The calculated downstream water levels and final reservoir water levels after a typhoon event are used to evaluate the mapped over-levee risk and water shortage risk, respectively. The results showed that the different upper limit settings for the reservoir have a significant influence on the variation of 1.19 × 10⁻⁵% to 75.6% of the water shortage risk. This occurs because of the insufficient inflow and narrow storage capacity of the Shih-Men Reservoir during drought periods. However, the upper limit settings have a minor influence (with a variation of only 0.149% to 0.157%) on the over-levee risk in typhoon periods, because of the high protection standards for the downstream embankment.

1. Introduction

A reservoir can be operated for various purposes, such as water supply, flood control, power generation and entertainment. For planning purposes, a management model is usually built for either short-term planning, such as flood control during storms [1,2,3,4,5,6,7], or long-term planning, such as water flow distribution optimization [8,9,10,11] and reservoir operation rule optimization [12,13,14,15,16,17]. Those studies developed complete formulations and algorithms for managing the abovementioned planning topics. However, they did not evaluate the effects of reservoir operations on the competing demands of simultaneous flood control operations and water supply allocation.
In general, risk in reservoir operations involves: (1) short-term flood damage risk (e.g., over-levee, inundation); and (2) long-term shortage (water deficit) risk [13]. Short-term flood damage risk is caused by flooding from external waters (i.e., creek, river) during reservoir operations, and inundation risk is caused by flooding from internal waters (i.e., rainwater from the urban inland) during the operations of a pumping station and anti-tide gate. However, inundation loss is hard to quantify, primarily because the loss data involved in this process are multifarious and difficult to establish, measure and collect [18]. Hence, only a few previous studies have evaluated flood risk by primarily referring to over-levee risk, because such processes require the development and integration of multiple optimization and simulation models, e.g., a reservoir release optimization model for flood control, a solver algorithm, rainfall-runoff simulations, reservoir continuity routing, downstream channel flow routing and an over-levee risk analysis considering multiple types of inflow scenarios [19,20,21]. Regarding previous studies on flood damage risk, Wood (1977) [22] proposed an integral transformation method to evaluate the risk of embankment overflow. Kuo et al. [23] thoroughly compared popular risk analysis methods for assessing reservoir overtopping risk, including Rosenblueth’s and Harr’s point estimation method, Monte Carlo simulation (MCS), Latin hypercube sampling and the mean-value first-order second-moment (MFOSM) method. Paik [24] used the MFOSM method and advanced first-order second-moment method to evaluate hydrological risk to urban stormwater and water storage facilities. However, the inflow hydrographs for different types of typhoons are very diverse. Previous analyses of over-levee risks have seldom considered possible diverse typhoon-induced inflow scenarios.
Regarding previous studies on long-term shortage risk, Klemes [25] calculated long-term water supply reliability using hypothetically-generated inflows. Klemes [26] estimated the reliability of reservoir operations using seasonal inputs. Wurbs [27] studied the water resources management, water allocation and supply reliability of a reservoir system. Yamout et al. [28] studied the effects of incorporating the conditional value-at-risk when analyzing a water allocation problem, as opposed to using frequently expected values, two-stage modeling, scenario analysis and linear optimization tools. Higgins et al. [29] applied MCS to estimate trade-offs between the amount of allocated water and the risk of failing to achieve minimal reservoir levels. Hsu et al. [9] studied the relationship between potential bottleneck locations and water supply deficits. Kuo and Hsu [30] used the minimum cut-set method to calculate the mechanical reliability of a water distribution system after a long-term water supply period. Bekri et al. [11] optimized water allocation within a river basin using a fuzzy-boundary-interval linear programming method. Their method used the simultaneous generation of stochastic equal-probability hydrologic scenarios to consider the uncertainty of random water inflows. However, the trade-offs between (1) hedging rules for reservoir levels and shortage risks and (2) reservoir target storage levels (i.e., upper limits) and shortage risks have seldom been analyzed in previous studies. The upper limit defines the empty space in a reservoir for flood control, as well as the storage space for future water supply.
In reality, over-levee and shortage risks are associated with reservoir operation hedging rules, particularly the upper reservoir level limits. However, the trade-off relationship between short-term reservoir flood operation rules and long-term shortage risks (considering diverse hydrological scenarios) is rarely studied, because such studies require automatic integrated optimization-simulation routing algorithms, which are very time consuming. To resolve these issues, this study first applies an integrated methodology to generate a series of representative synthetic inflow hydrographs using MCS with historical typhoon-induced flash flood hydrographs. Then, this study calculates mapping damage based on the stream water level and top elevation of the levee at the downstream control point. The water level simulation model is embedded into the reservoir flood operation optimization model. This is done so that automatic risk analysis is performed using MCS instead of conventional rainfall-runoff routing approaches [31]. A novel back-propagation neural network (BPNN) model is developed for calculating the water level at a downstream control point. This will allow for a rapid, integrated optimization analysis process. BPNN is a data-driven model that does not require multi-parameterized physical properties such as topography, geology and bathymetry [32,33]. To evaluate shortages (water deficits) for various types of demand nodes, this study employed a network flow-based optimization model to analyze water supply and allocation patterns in the distribution system, under reservoir operating scenarios for multiple hedging rules.
The purpose of this study is to apply an integrated methodology to: (1) generate diverse possible synthetic inflow hydrographs during typhoons; (2) assess how the upper limit for the reservoir level in the operation hedging rules influences over-levee risks during typhoons (and corresponding annual water supply shortage risks in a semi-arid region); and (3) analyze the trade-offs and priority relationships between over-levee risk and water shortage risk for different types of upper limit levels. The developed methodology was applied to the Shih-Men Reservoir basin located in the upper Da-Han Creek, which is the most important flood control and water storage system in northern Taiwan. The adopted models and algorithms include: (1) the MCS; (2) a deterministic reservoir operation optimization model for flood control; (3) mixed integer linear programming; (4) a novel BPNN-based water level simulation model; (5) a water allocation optimization model for a network flow-based distribution system; and (6) an approach for evaluating over-levee and shortage risks.

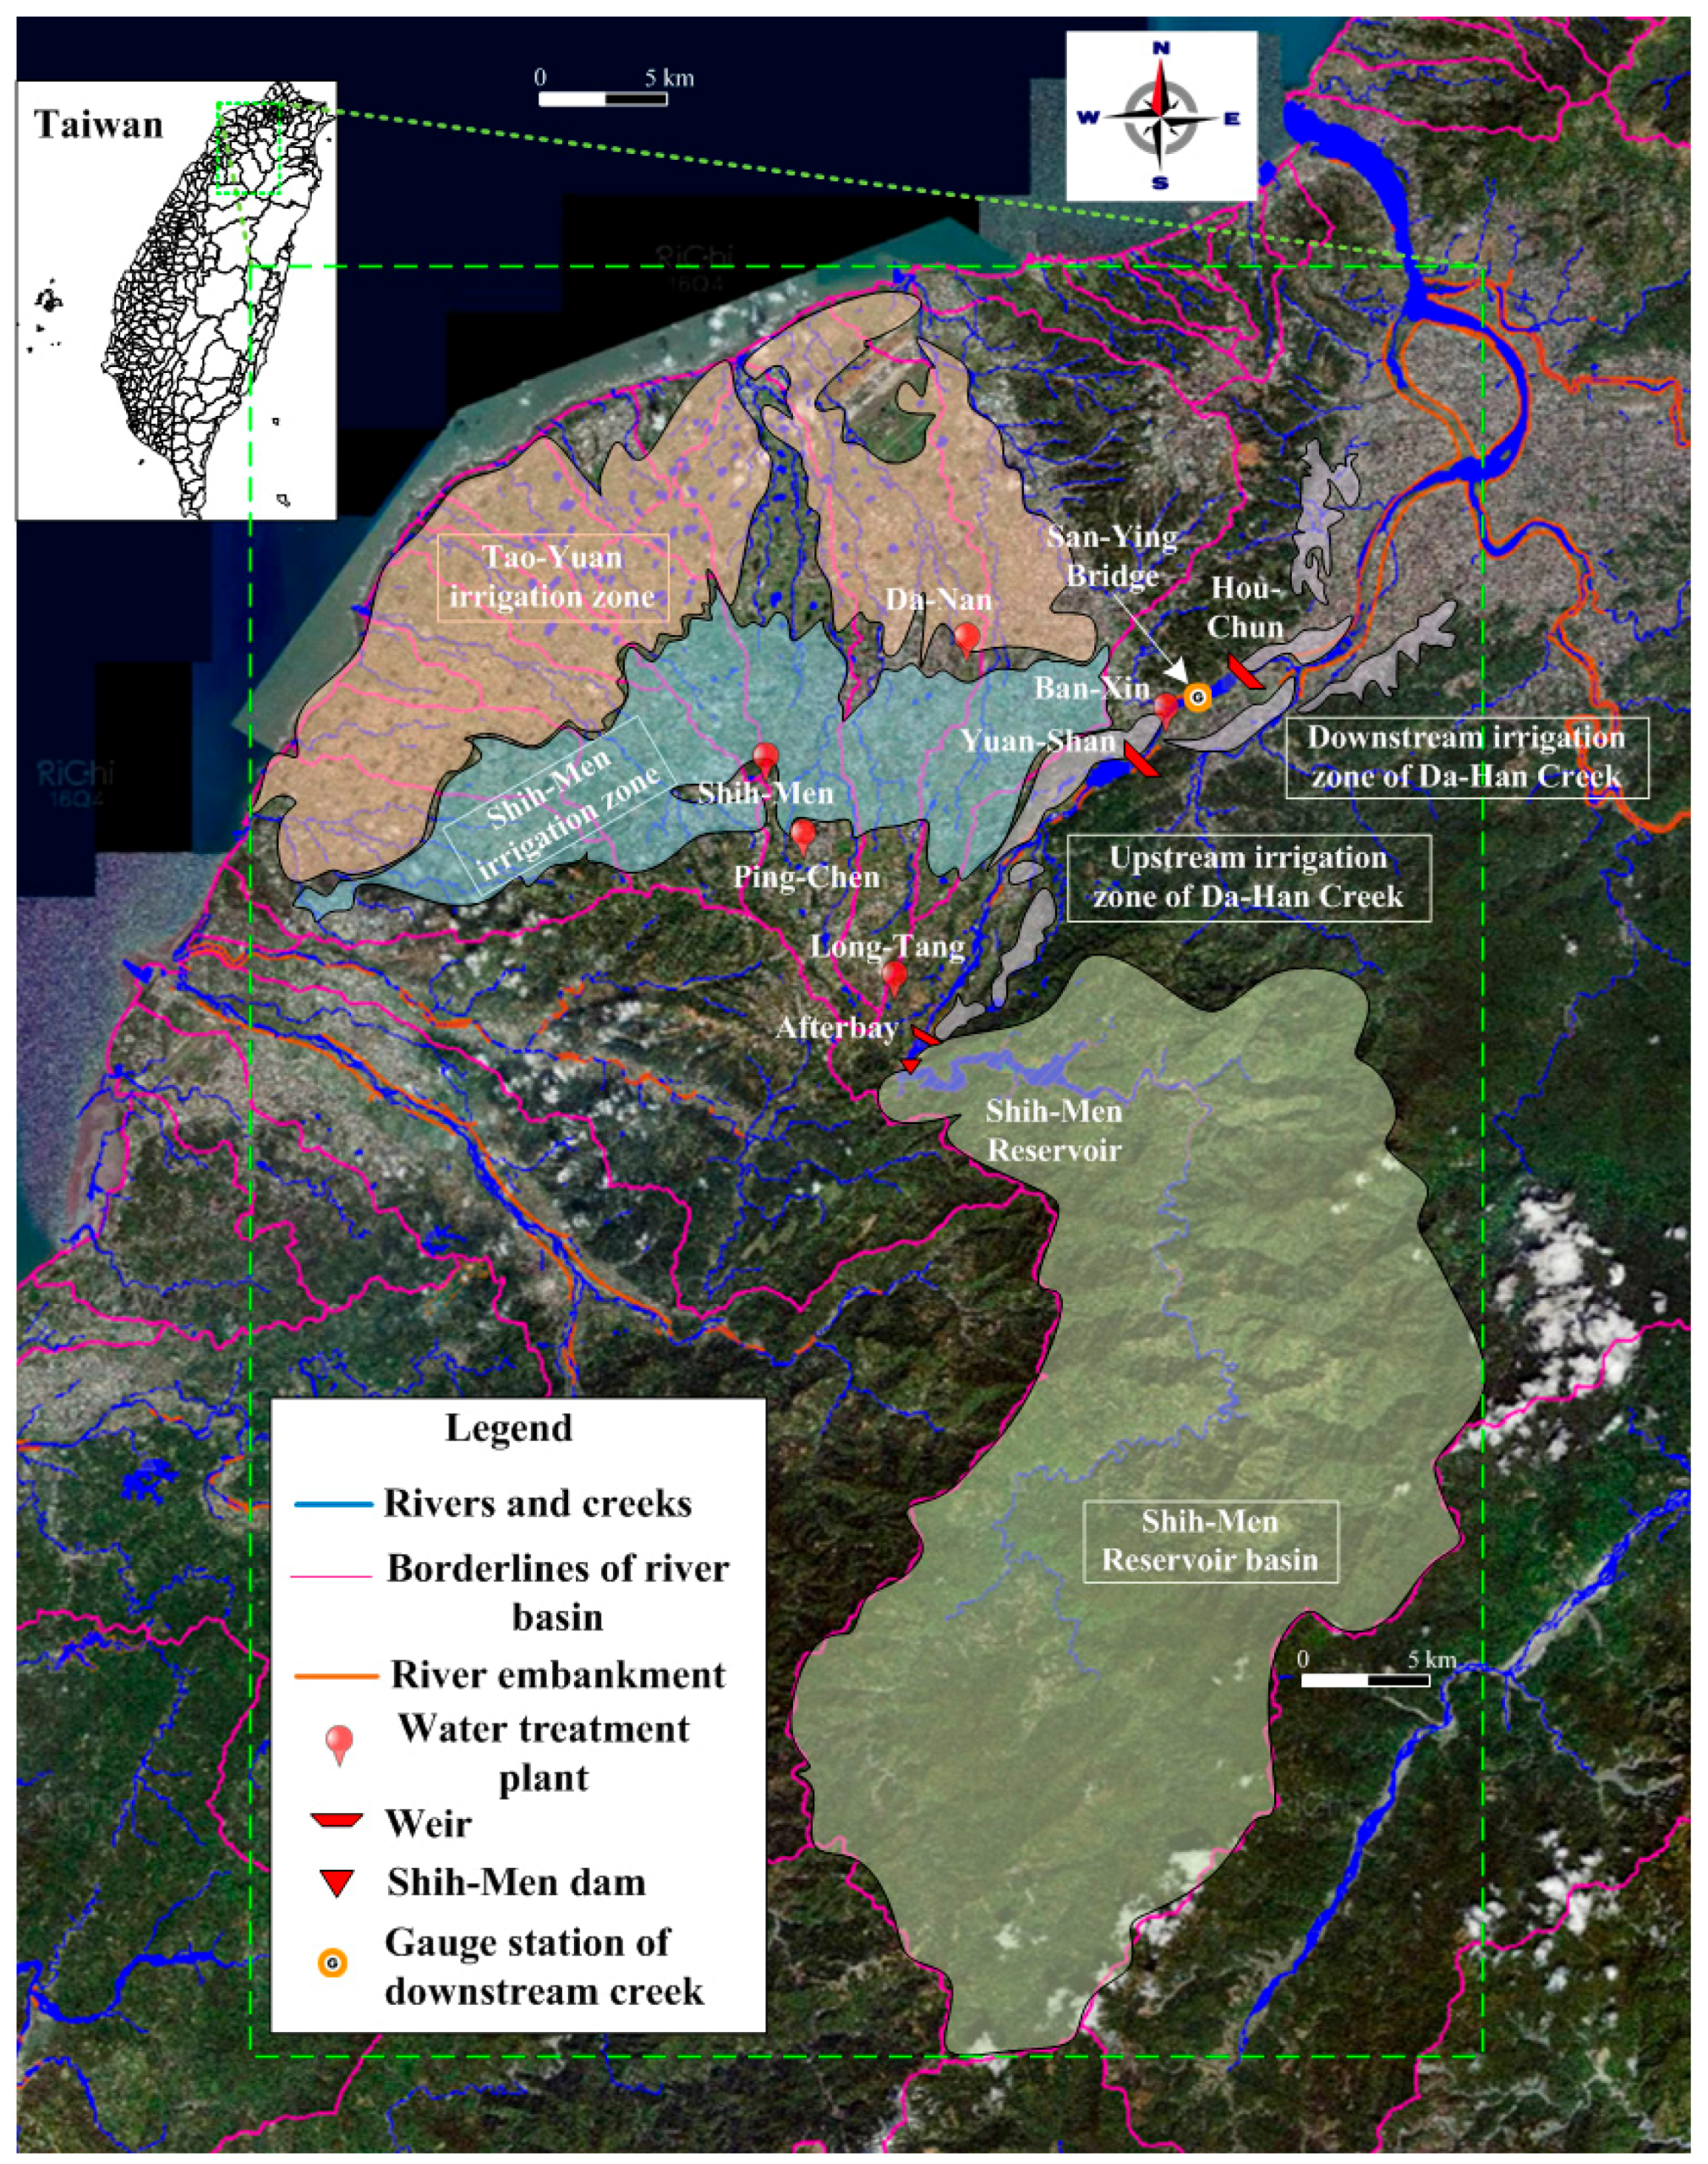
2. Study Area and Data

Taiwan has been threatened by floods because of its topography, uneven precipitation distribution and exposure to extreme hydrological events, such as typhoons. Because Taiwan has steep mountains and short creeks, massive precipitation in Taiwanese watersheds causes heavy and rapid runoff during the summer and autumn. Appropriate reservoir operations could retard severe floods during catastrophic typhoons. The ability to mitigate downstream flooding is directly determined by the empty storage space in a reservoir at a specific time; this space is defined by time-varying upper limit levels in the reservoir operation rules. If the empty storage is insufficient during peak flow, over-levee risk increases. If reservoirs leave too much empty storage space at the end of flood control operations, serious shortages may occur during the subsequent dry season.
Among the 109 reservoirs in Taiwan, the Shih-Men Dam is the third largest, supplying water to over three million people in northern Taiwan. The Shih-Men Dam is constructed at Da-Han Creek, the length of which is 126 km. Figure 1 shows a map of the study area, comprising 1163 km2. The creek starts at an elevation of 3536 m, ends near Hou-Chun Weir and then enters Tam-Shui River. There are four agricultural irrigation demands (upstream of Da-Han Creek, Shih-Men, Tao-Yuan and downstream of Da-Han Creek), two municipal demands (Shih-Men and Ban-Xin) and five water treatment plants (Long-Tang, Ping-Chen, Shih-Men, Ban-Xin and Da-Nan). The Shih-Men Reservoir, which is a multipurpose reservoir with a total capacity of 219 × 106 m3, was constructed in 1964 to meet public and agricultural demands. It is used for flood control, water supply, irrigation, tourism and hydropower generation.
Based on the rainfall patterns in the Da-Han Creek basin, a year is divided into a wet season and a dry season. Each season is six months long. The dry season begins on 1 November and ends on 30 April. If the stored water in the reservoir at the beginning of the dry season is insufficient, agricultural water shortages will occur. Accordingly, it is important to assess shortage risks during drought periods and over-levee risks during typhoon periods for different upper limit settings of the reservoir. The period used for planning purposes is ten days, and this is consistent with agricultural planning and practices in Taiwan. Each month has three periods. The first 20 days of a month comprise the first and second periods of that month, and the remaining days of the month comprise the last period of that month [13].
In practice, in order to guide reservoir releasing operations during typhoon-flood periods and intake operations during water supply periods, hedging rules are invented to formulate an operational strategy [34]. There are three level curves in the hedging rules of Shih-Men Reservoir: (1) the upper limit of the water surface level (WSL); (2) the lower limit of the WSL; and (3) the severe lower limit of the WSL, as shown in Figure 2. The upper limit of the WSL is regarded as the target WSL of a reservoir at the end of a typhoon-flood event. When the current WSL for the reservoir is above the lower limit of the WSL, the capacity of water supply for the demand node is the same as the planning water distribution volume. When the current WSL is below the severe lower limit of the WSL, the agricultural demand node can only receive 50% of the planning water distribution volume, while the public demand node can only receive 80% of the planning volume. The upper limit of the WSL for Shih-Men ranges from 235 to 245 m during a one-year period. The upper limit of the WSL in the wet season is lower than in the dry season, which is done to manage anticipated typhoon-flood events and prepare sufficient water supply storage in the drought season. However, the probability exists that unexpected abnormal dry weather will occur in the wet season or that an unexpected typhoon-flood will suddenly occur in the dry season [35]. Hence, an assessment of possible over-levee and shortage conditions for the specific upper limits of the WSL in Shih-Men reservoir is an important research topic in this study. The elevation of the dam crest, maximum allowable safe WSL for flood control and dead WSL are 252.1, 249.5 and 195 m, respectively. The reservoir WSL can be operated within the range of the lower WSL and maximum safe WSL during typhoon periods.
In this study, the original water supply system elements of the Da-Han Creek basin are characterized by nodes and arcs. For example, inflows, reservoirs, diversion structures and demands are represented as nodes, whereas rivers, channels and pipes are represented as arcs, as shown in Figure 3. The data needed for the water allocation optimization model are the ending storage of the reservoir after a typhoon event, historical inflow data, the water demands of public and agricultural demand nodes, the water delivery network and the capacity of various types of water supply infrastructure (including pipes, reservoirs and water treatment plants).

3. Methods

3.1. Methodology Flowchart
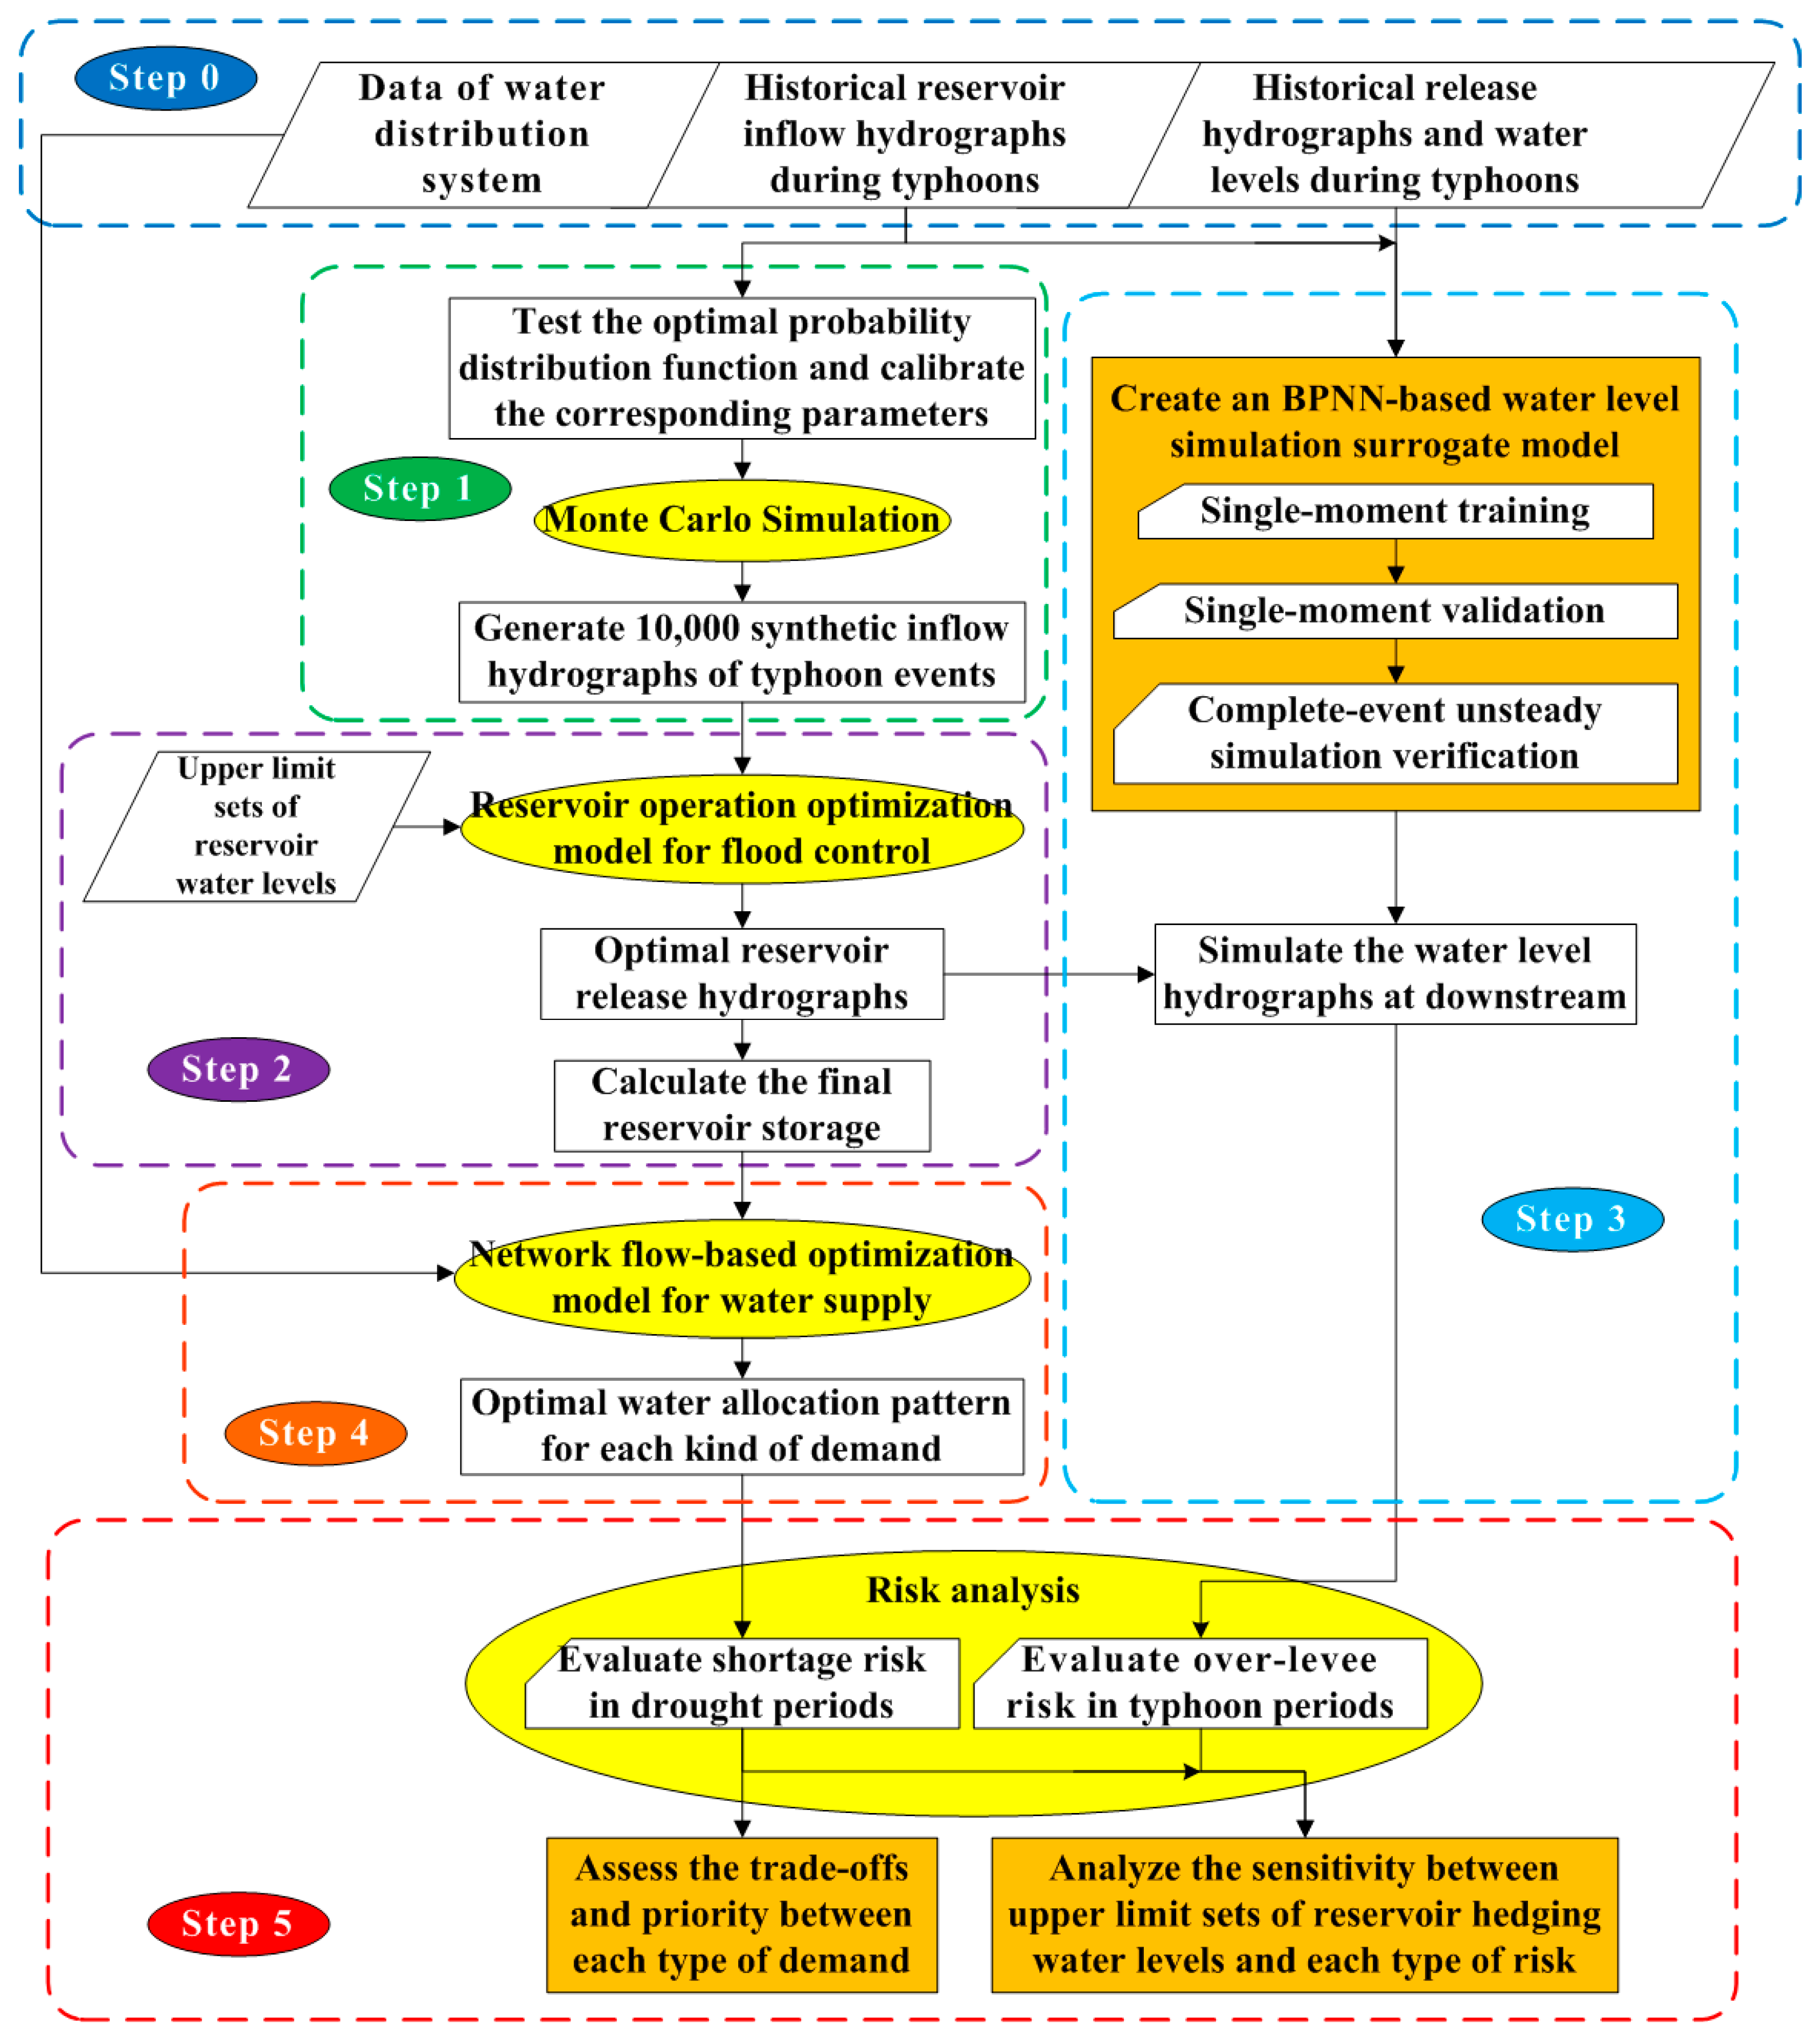
Figure 4 shows a flowchart of the developed methodology. The step-by-step procedures for the integrated risk analysis algorithm are as follows:
Step 0:
Data collection. The variables include historical inflow and release hydrographs and water levels at the downstream control location during typhoons. These water levels were measured by the Shih-Men Reservoir Management Bureau, Taiwan.
Step 1:
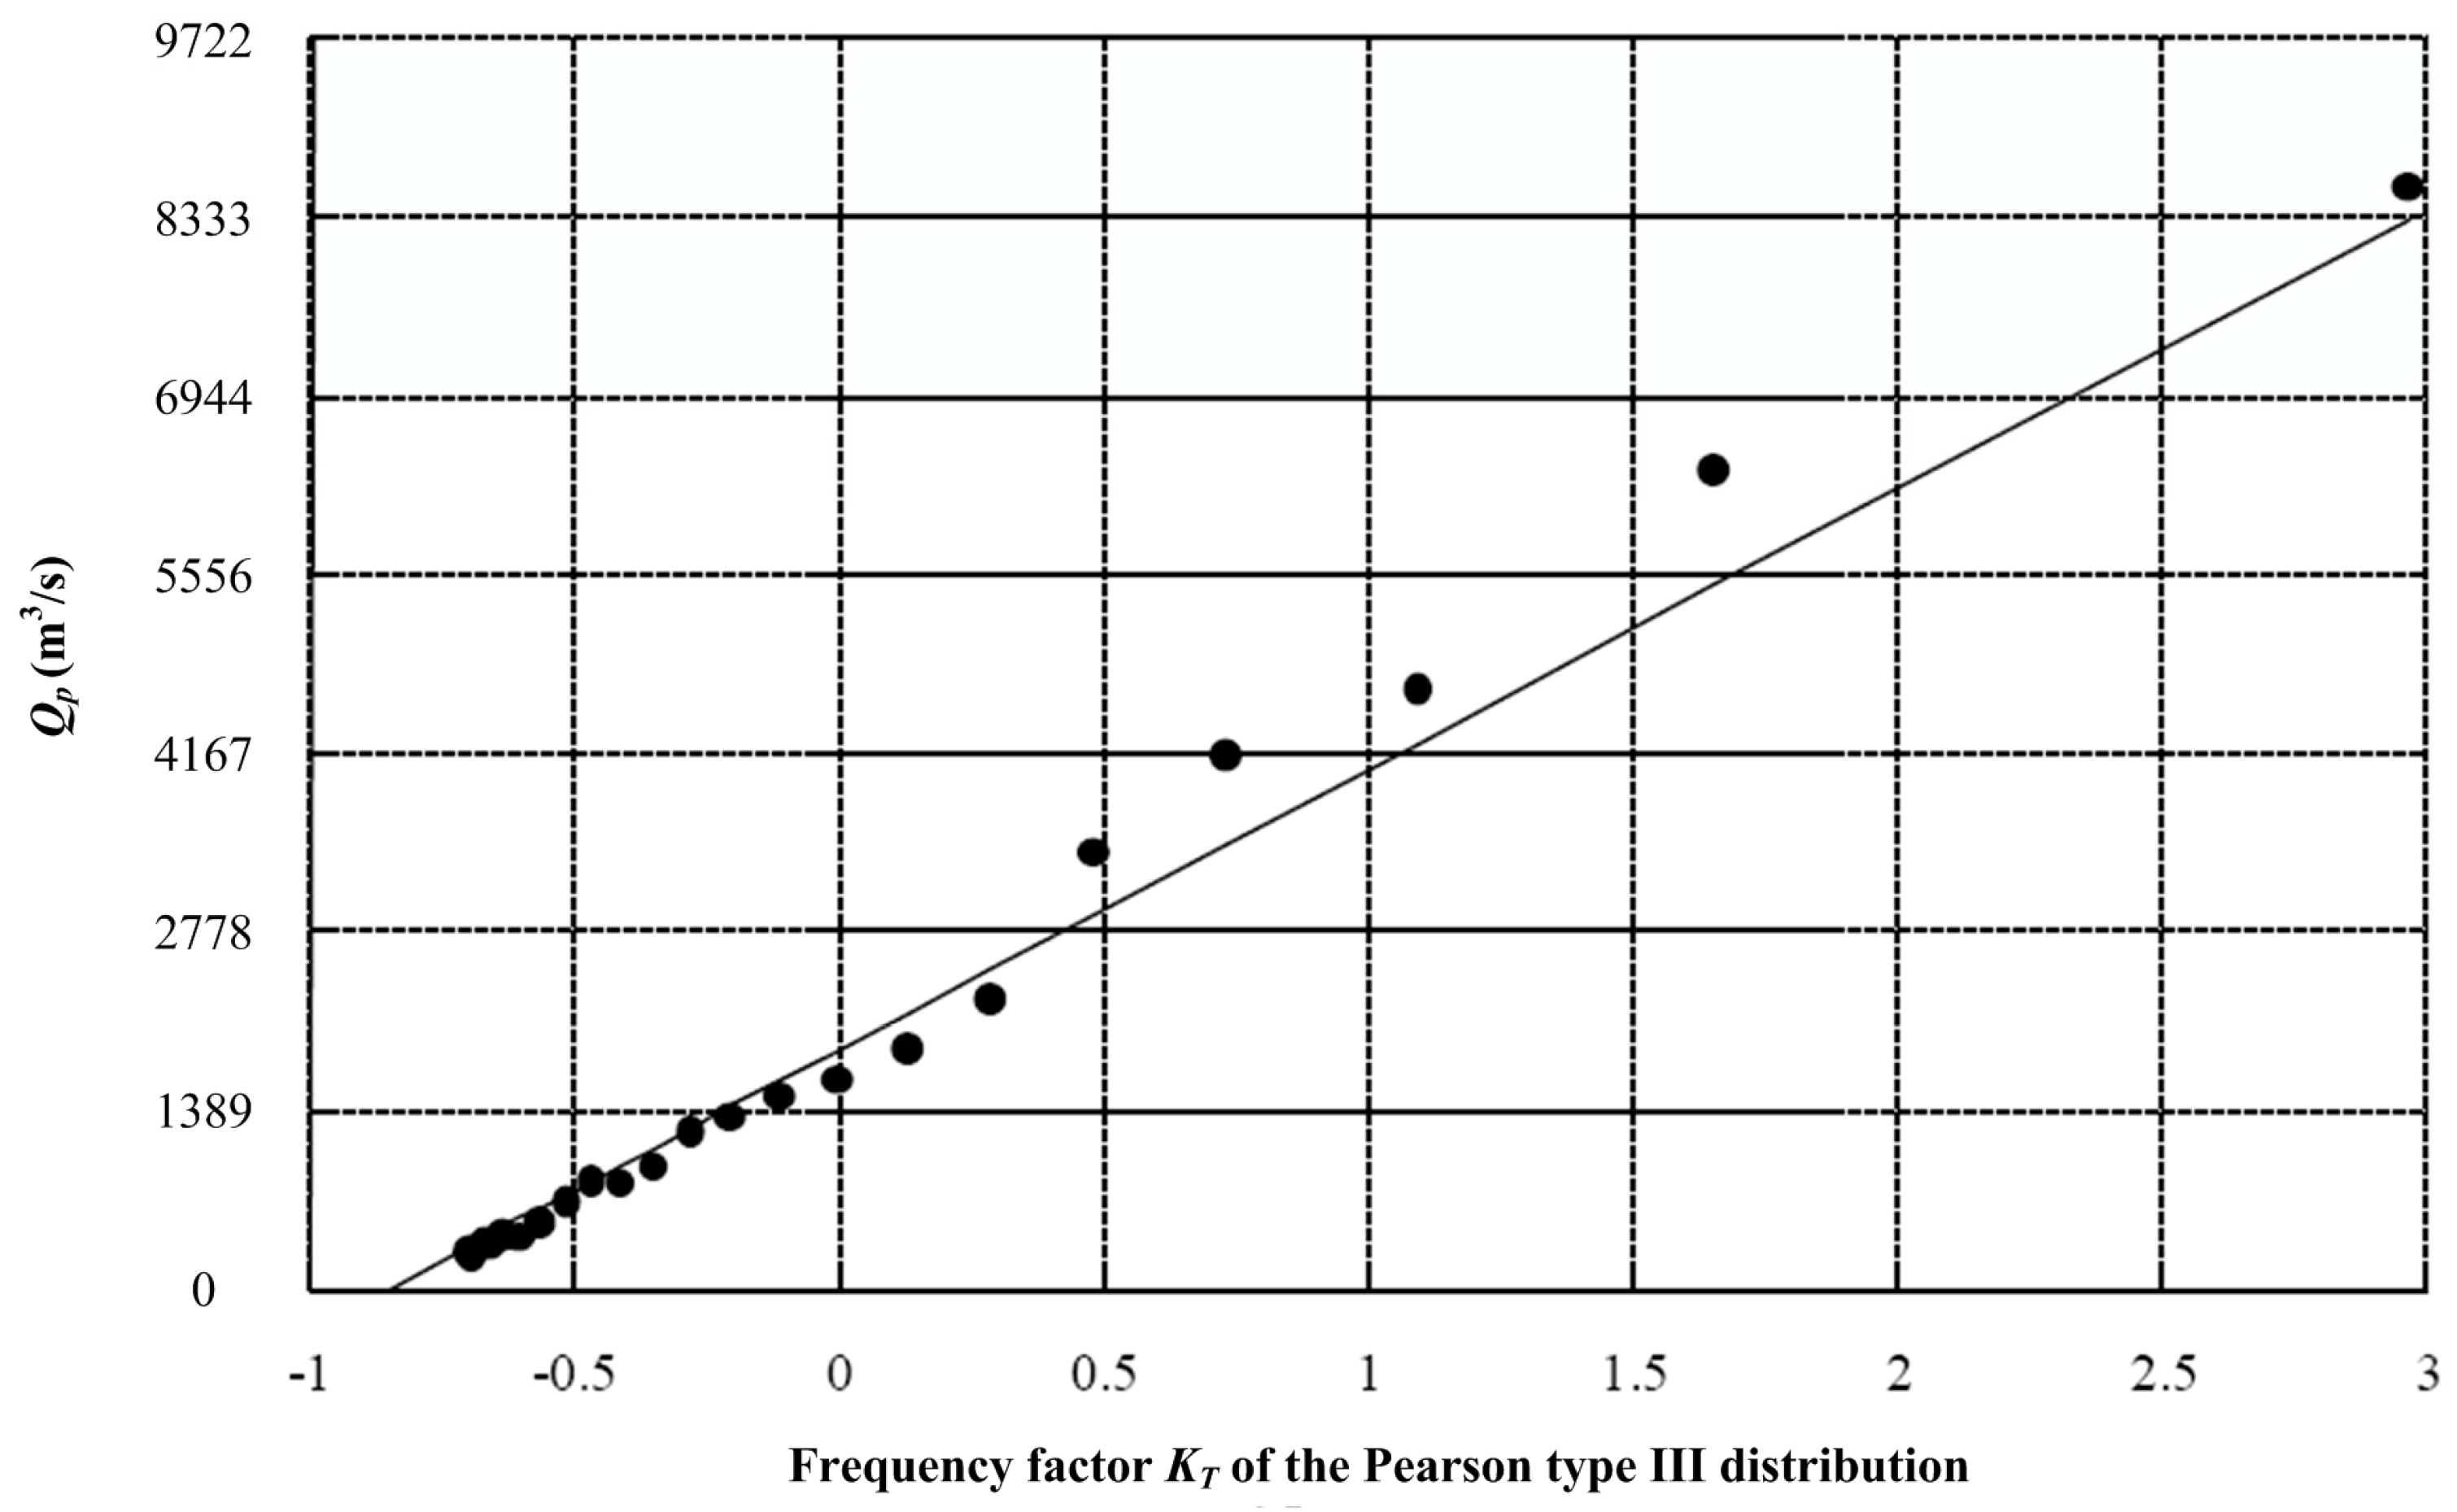
Generation of the inflow hydrograph. First, test the optimal probability distribution function, and calibrate the corresponding parameters for the historical inflow hydrographs. Then, use Monte Carlo simulation (MCS) to generate 10,000 synthetic inflow hydrographs for typhoon events.
Step 2:
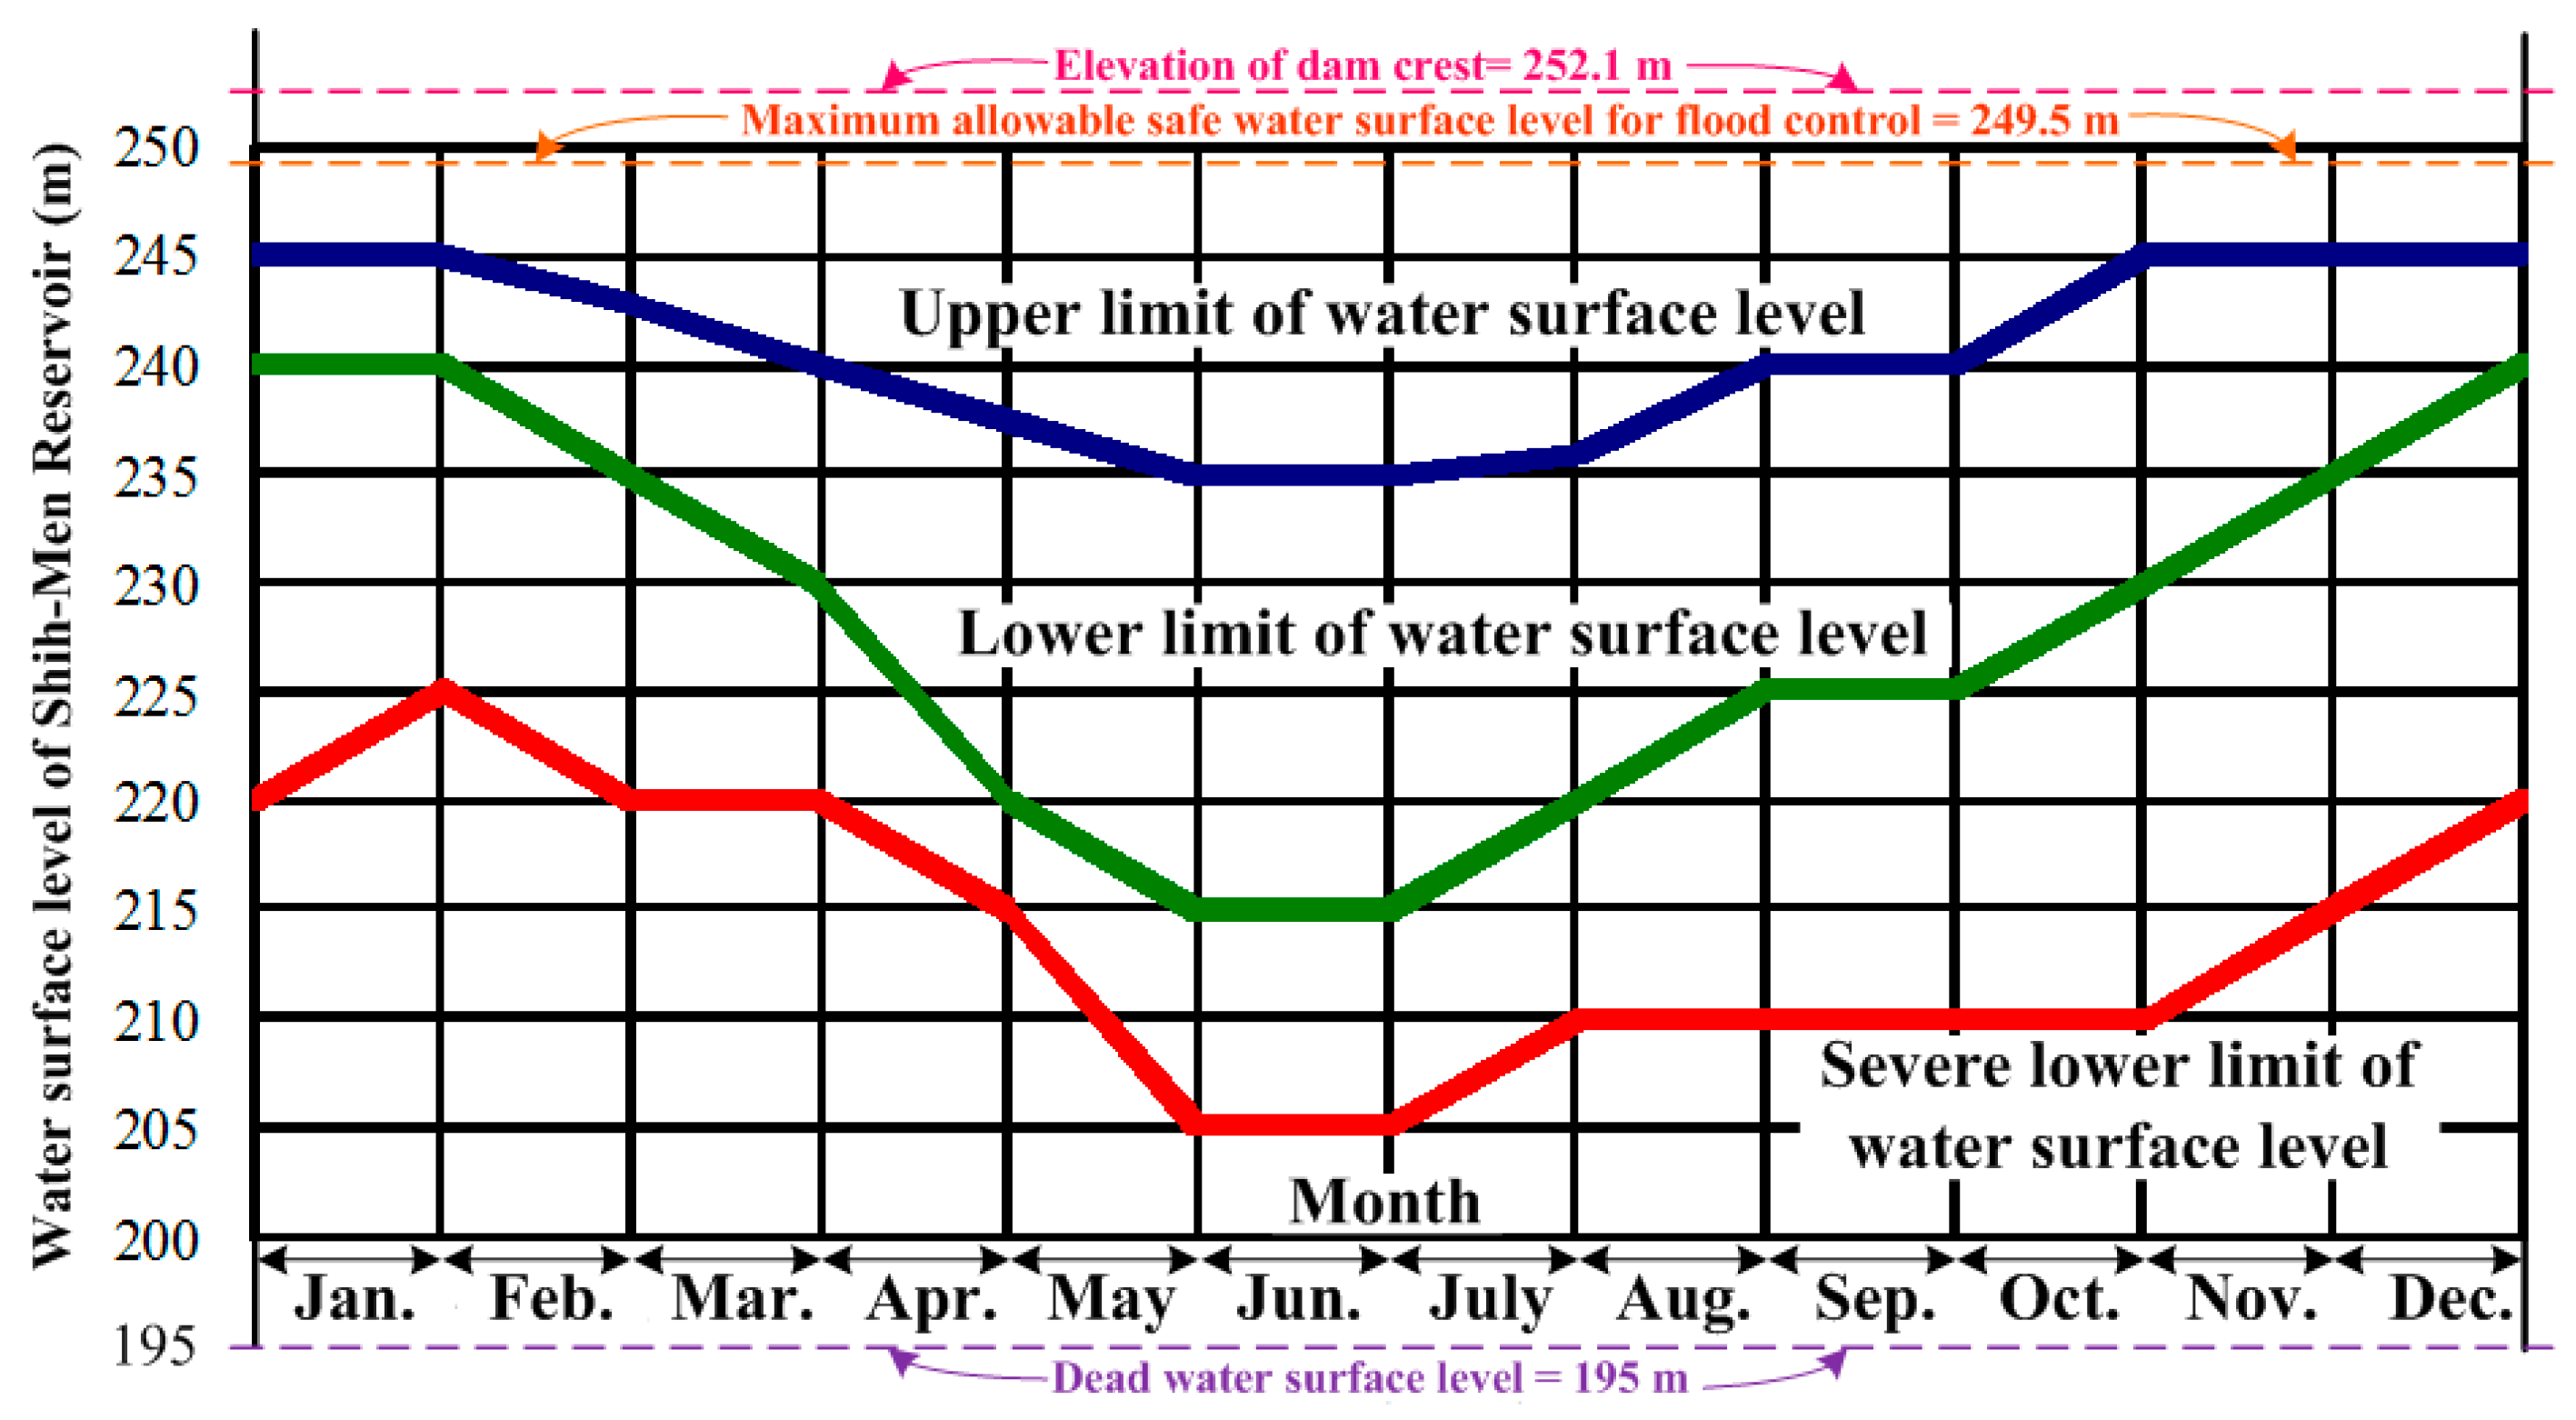
Optimization of reservoir release. Construct a flood operation model to optimize the reservoir release hydrograph based on predefined sets of operation rules (i.e., the upper limits of target reservoir water levels) during typhoons, and simulate flow and storage during reservoir operations. The release hydrograph and final reservoir storage are used to evaluate the over-levee and shortage risks in Steps 3 and 4, respectively.
Step 3:
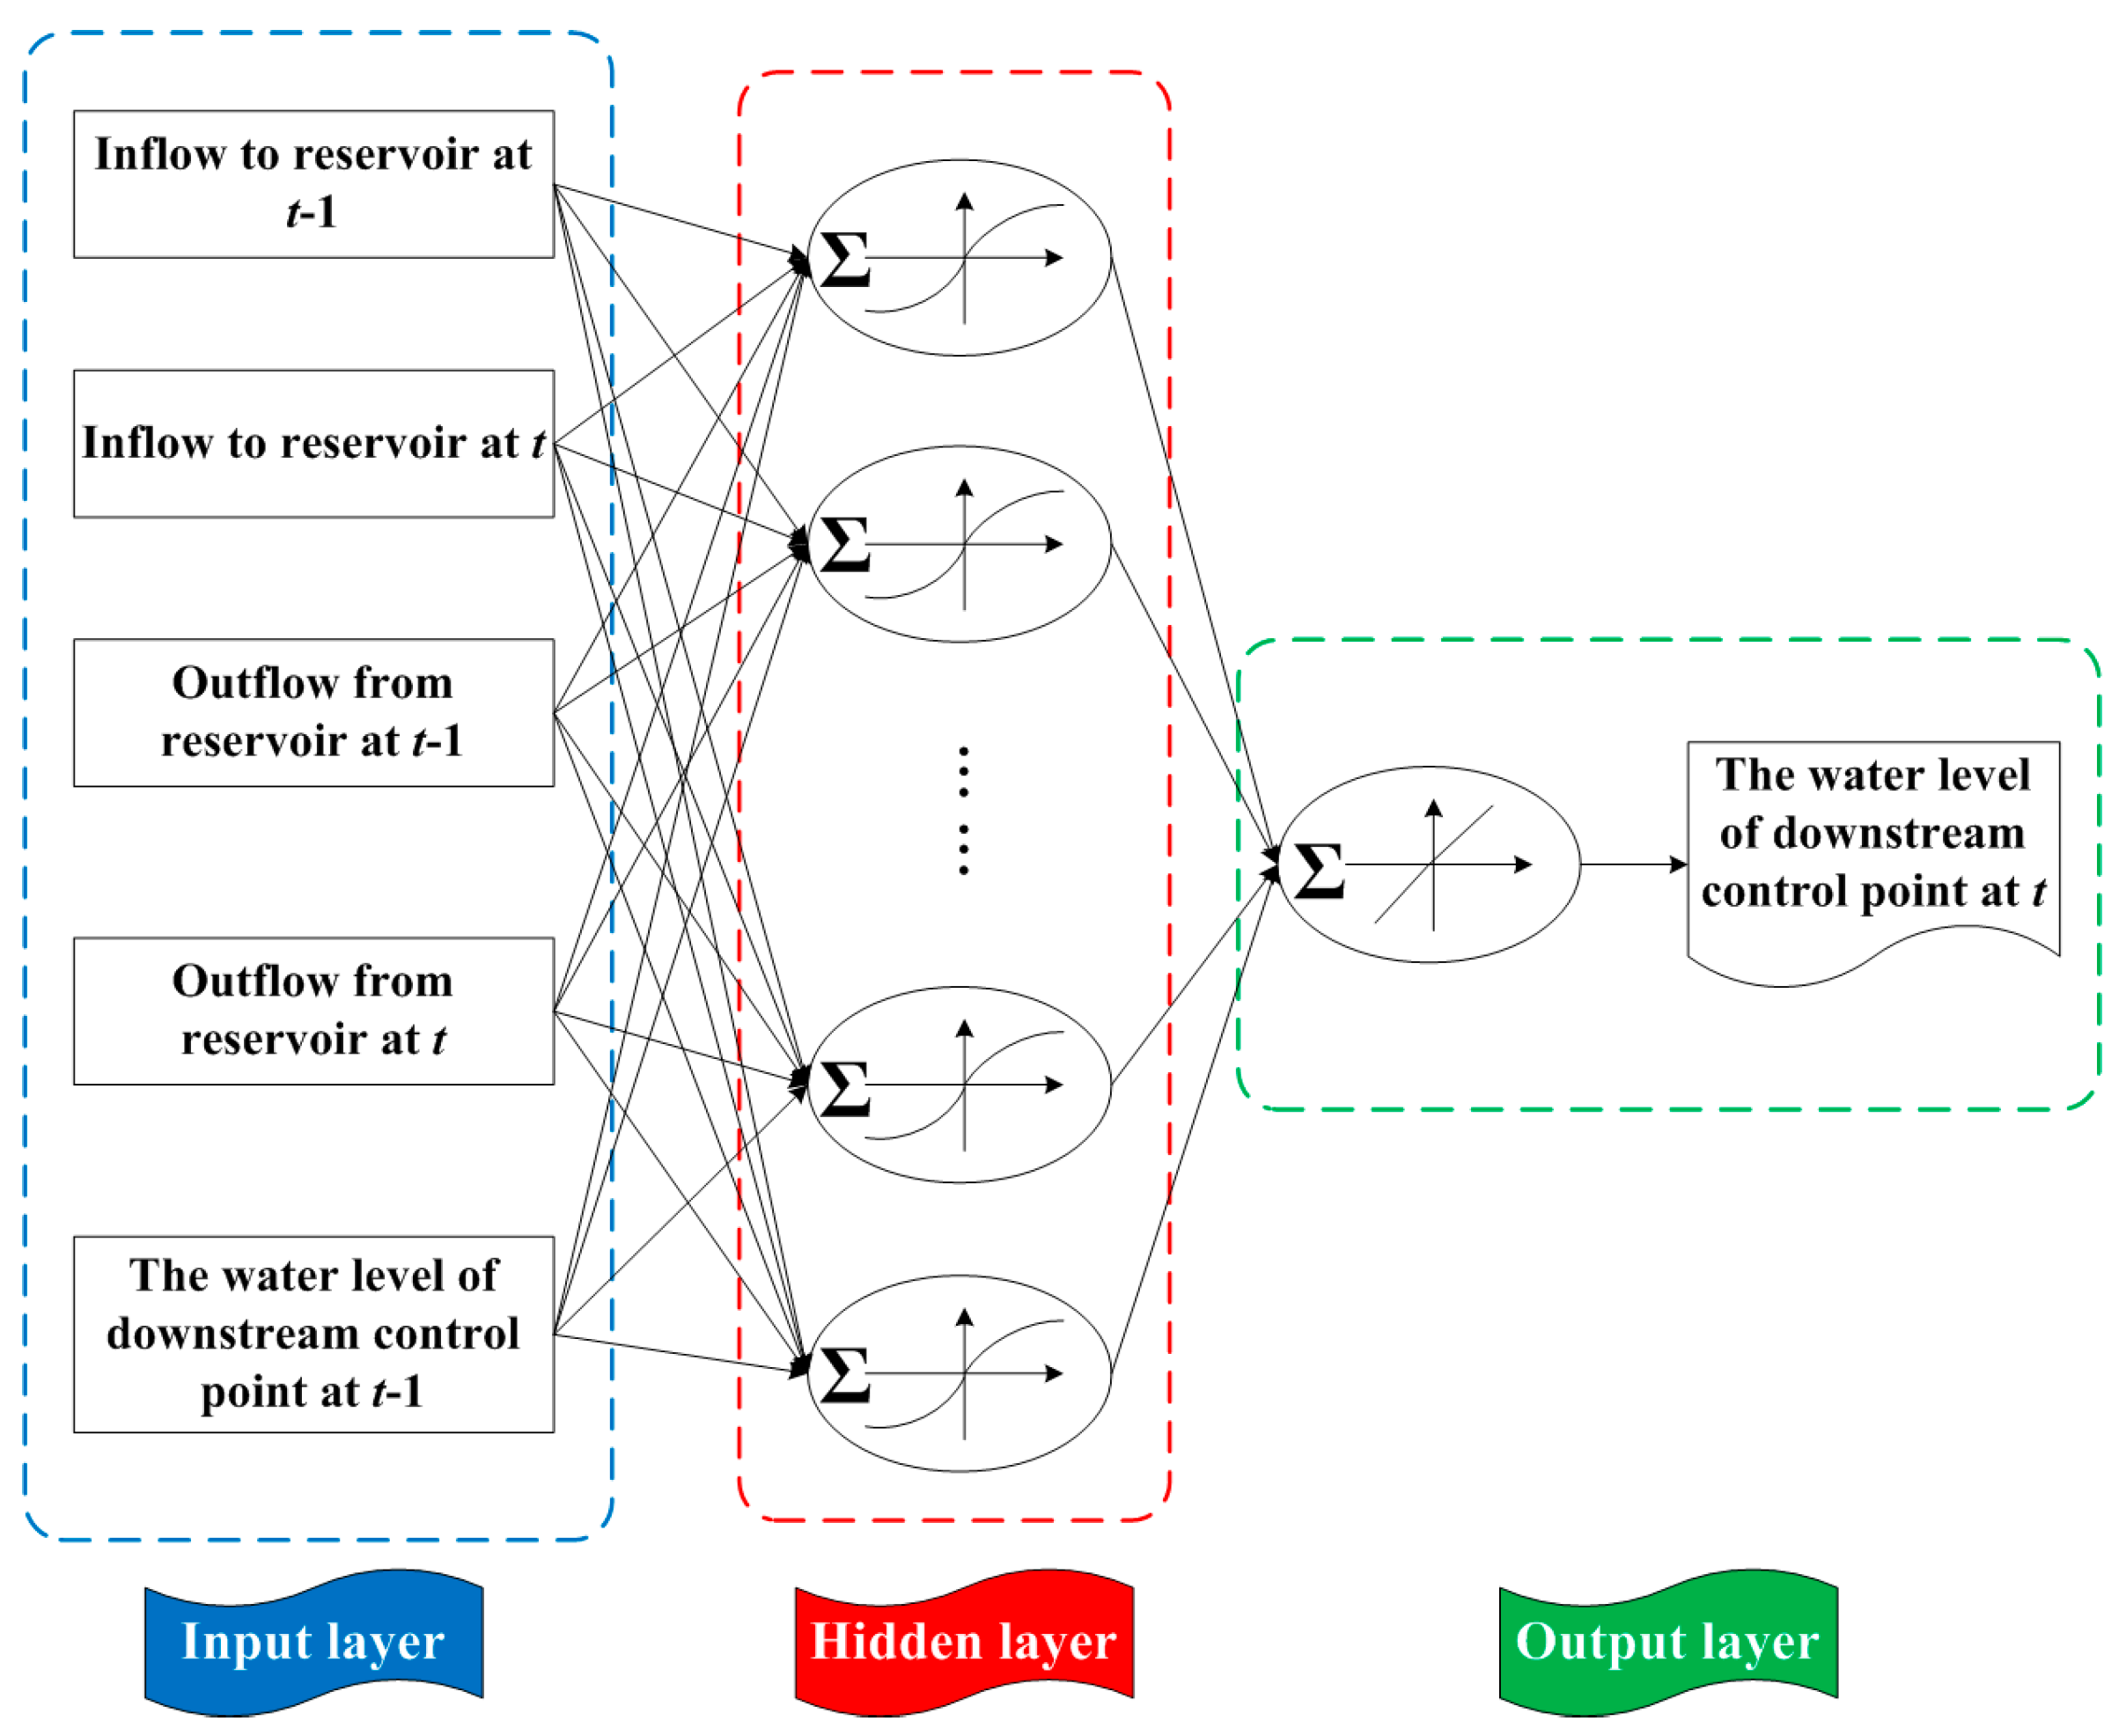
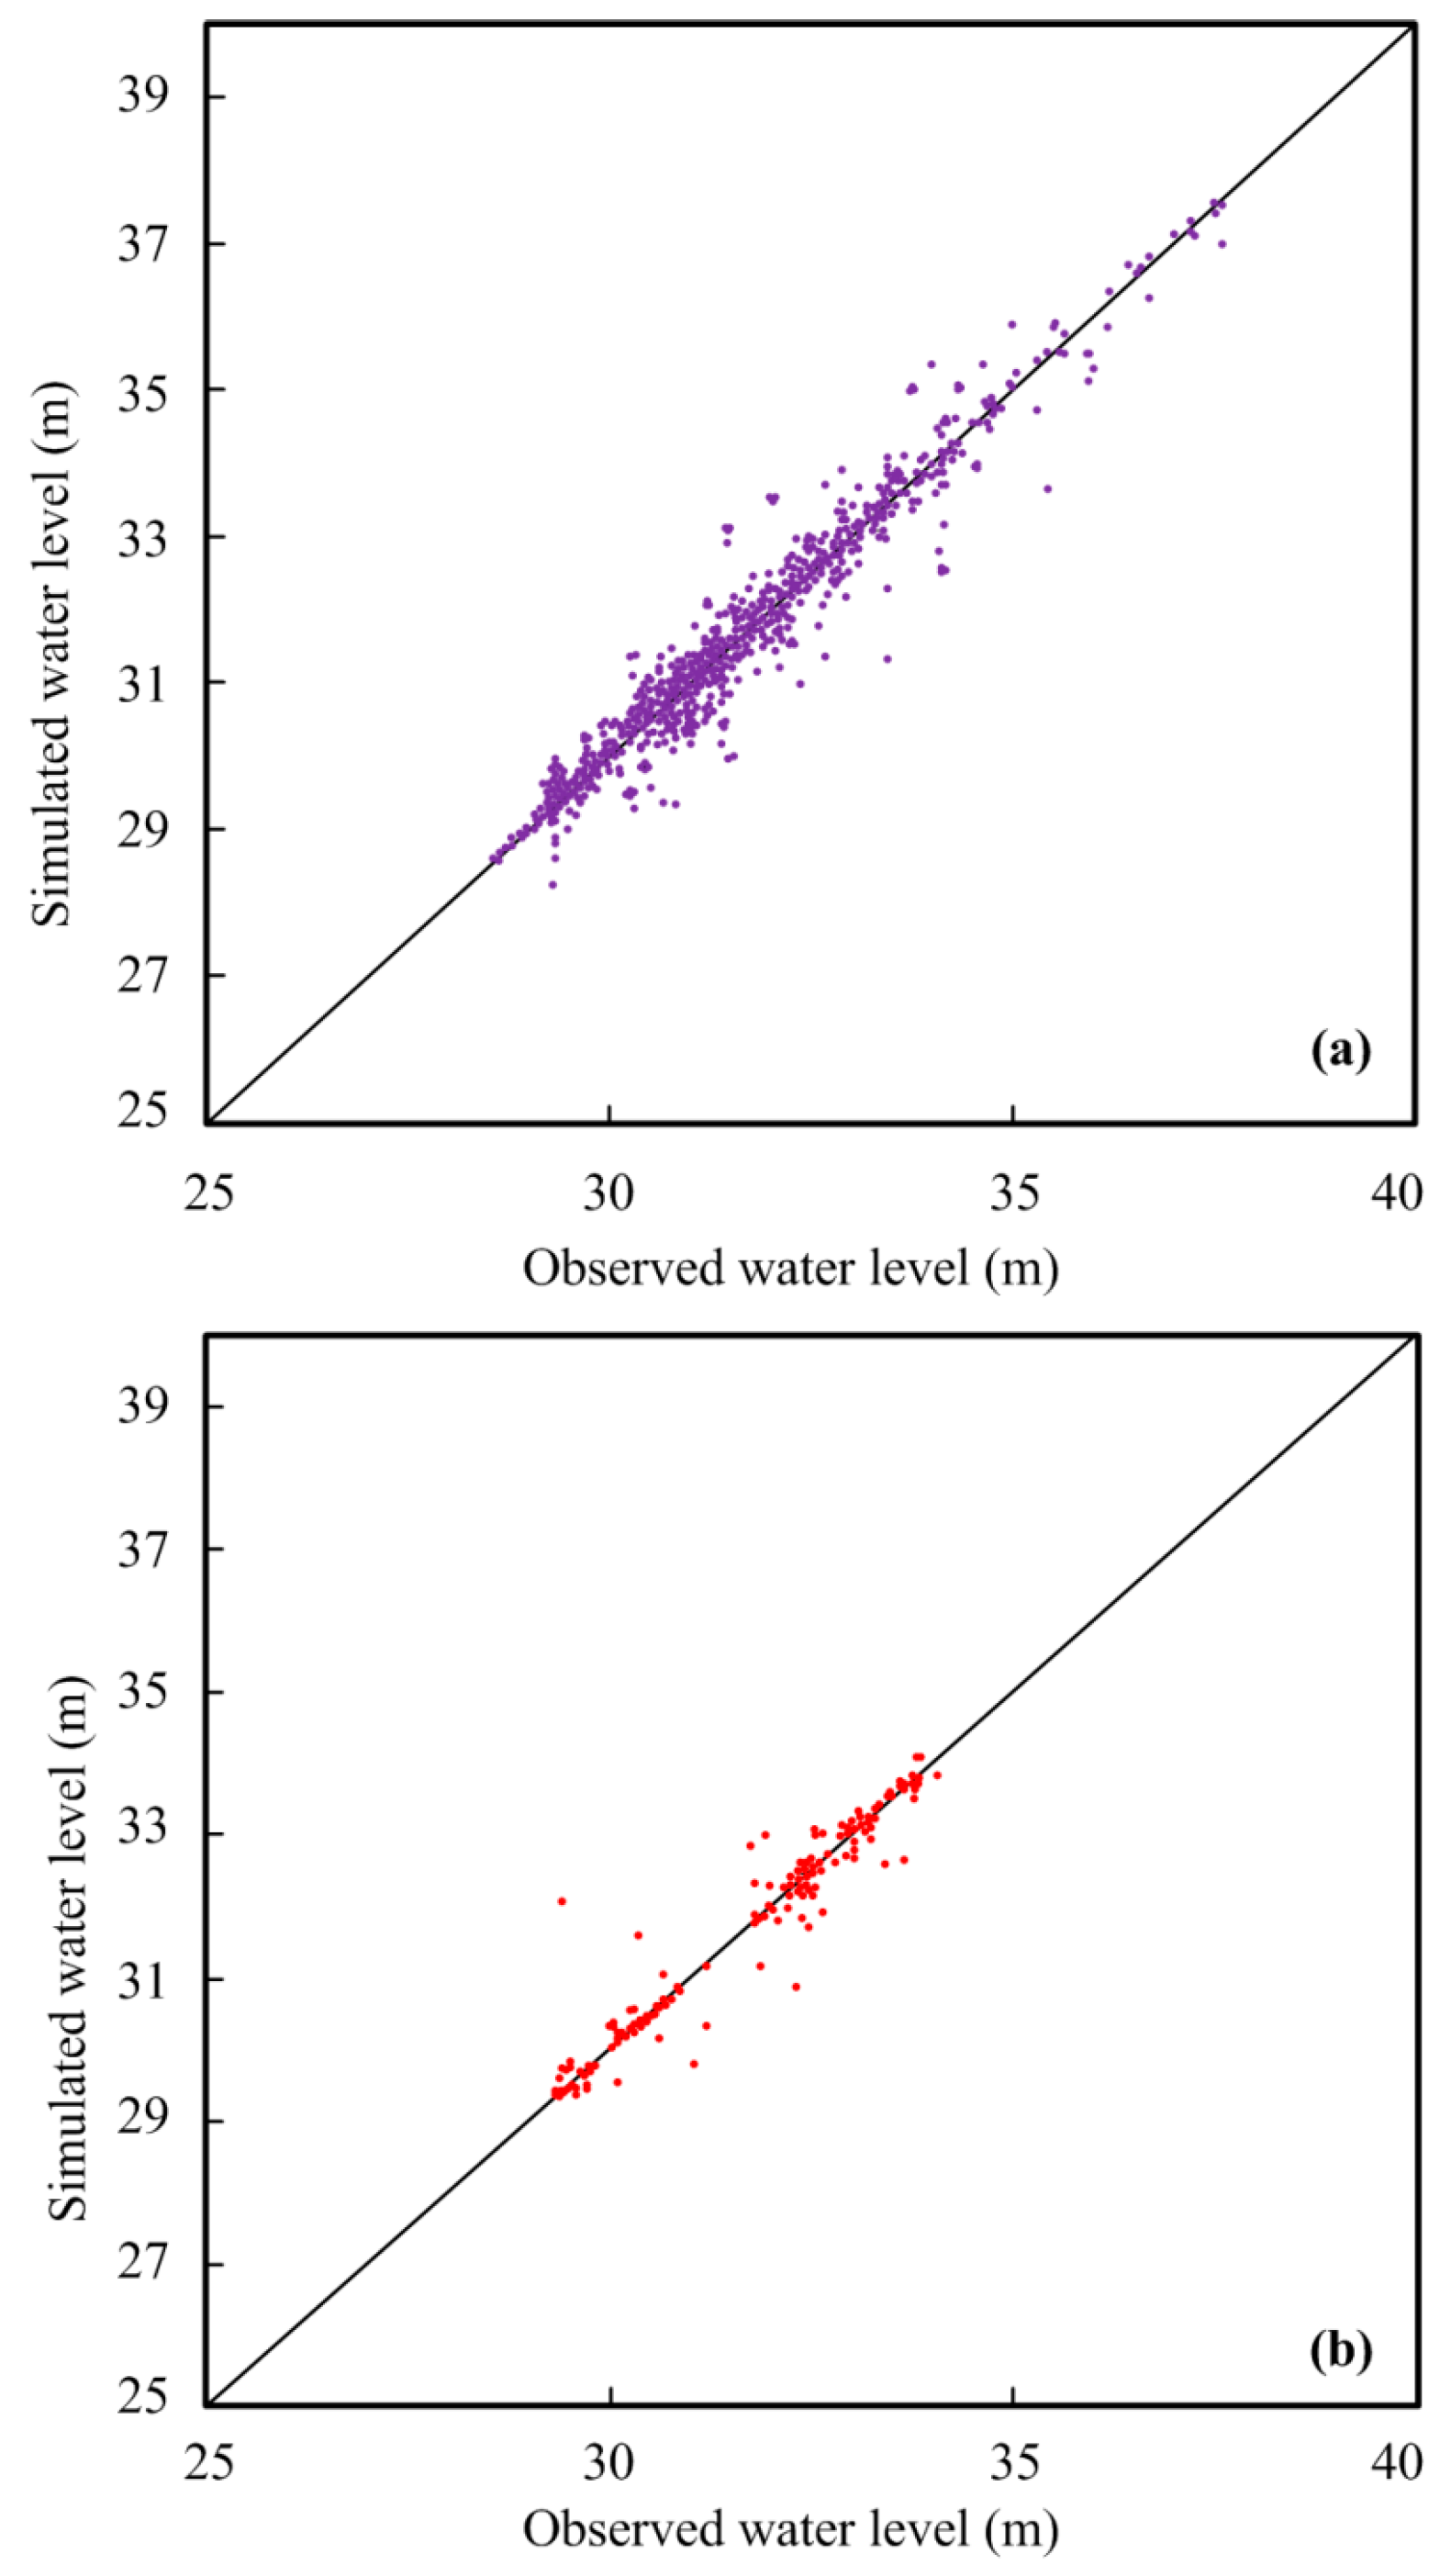
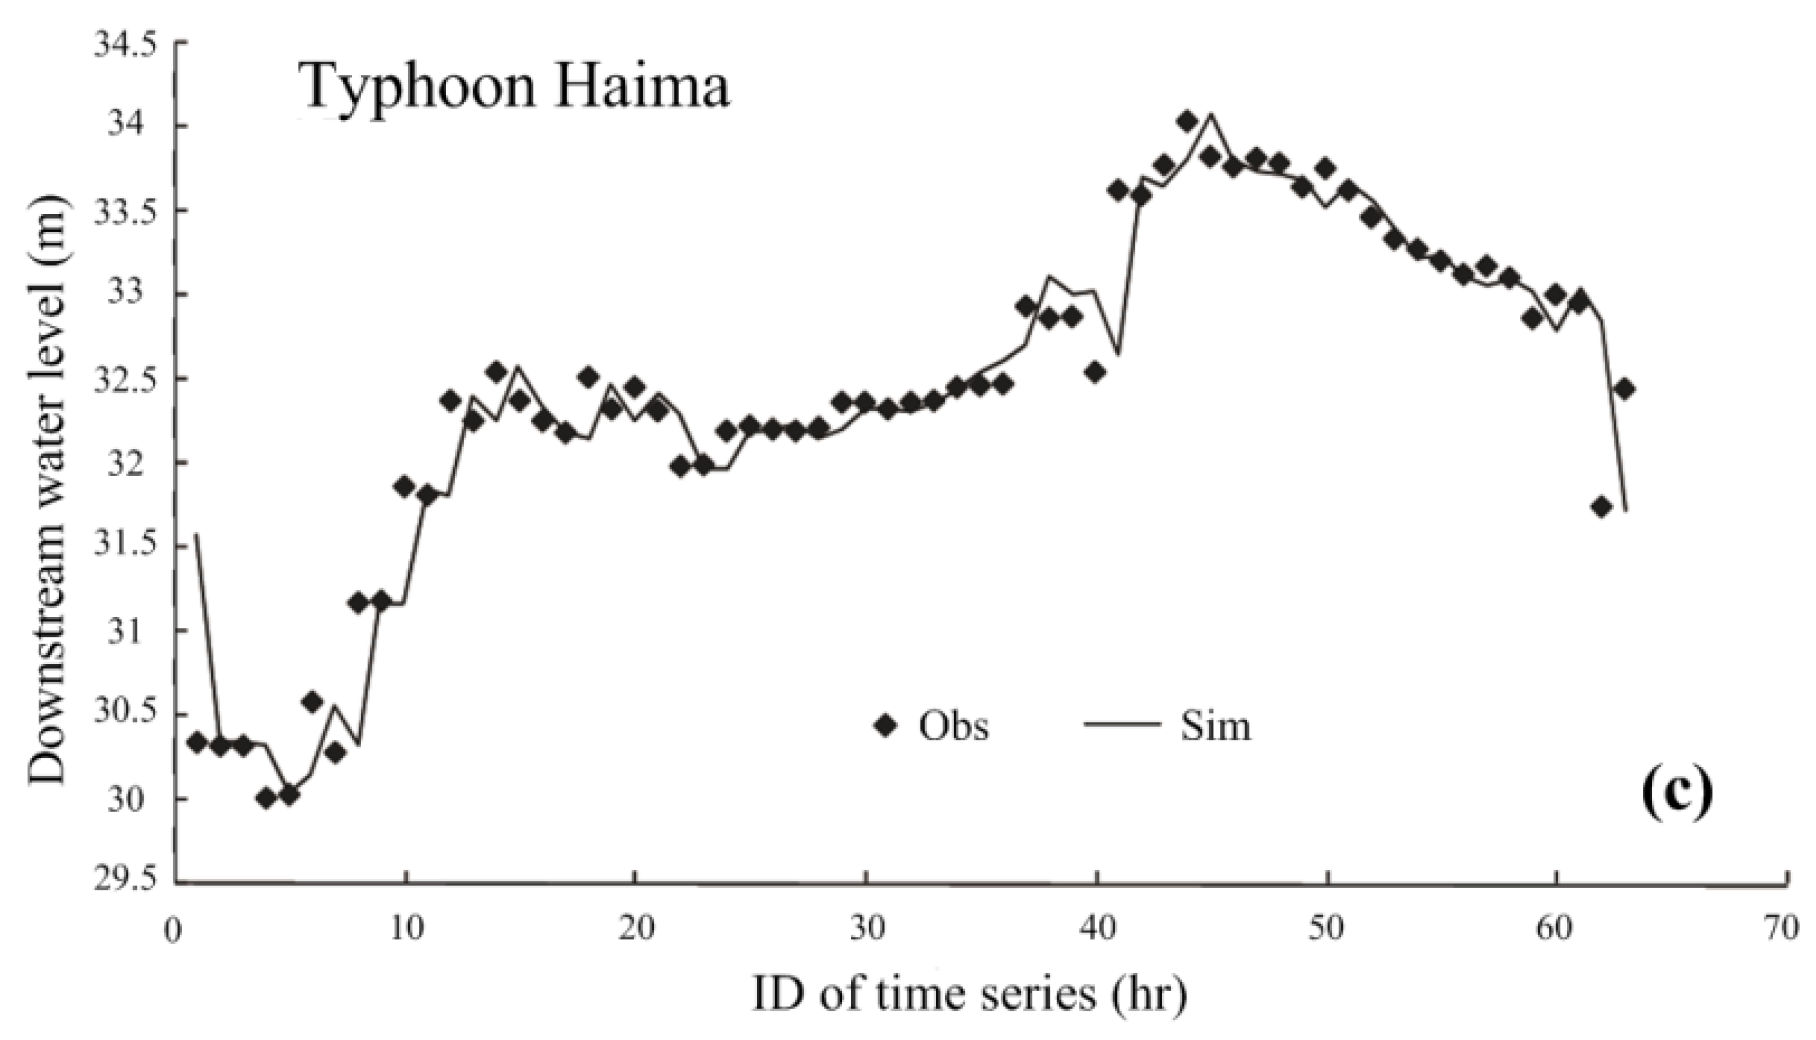
Construction of a novel BPNN-based water level simulation surrogate model. The processes include single-moment training, single-moment validation and complete-event unsteady simulation verification. This model is used to calculate the water level at the downstream control point under reservoir release during typhoons.
Step 4:
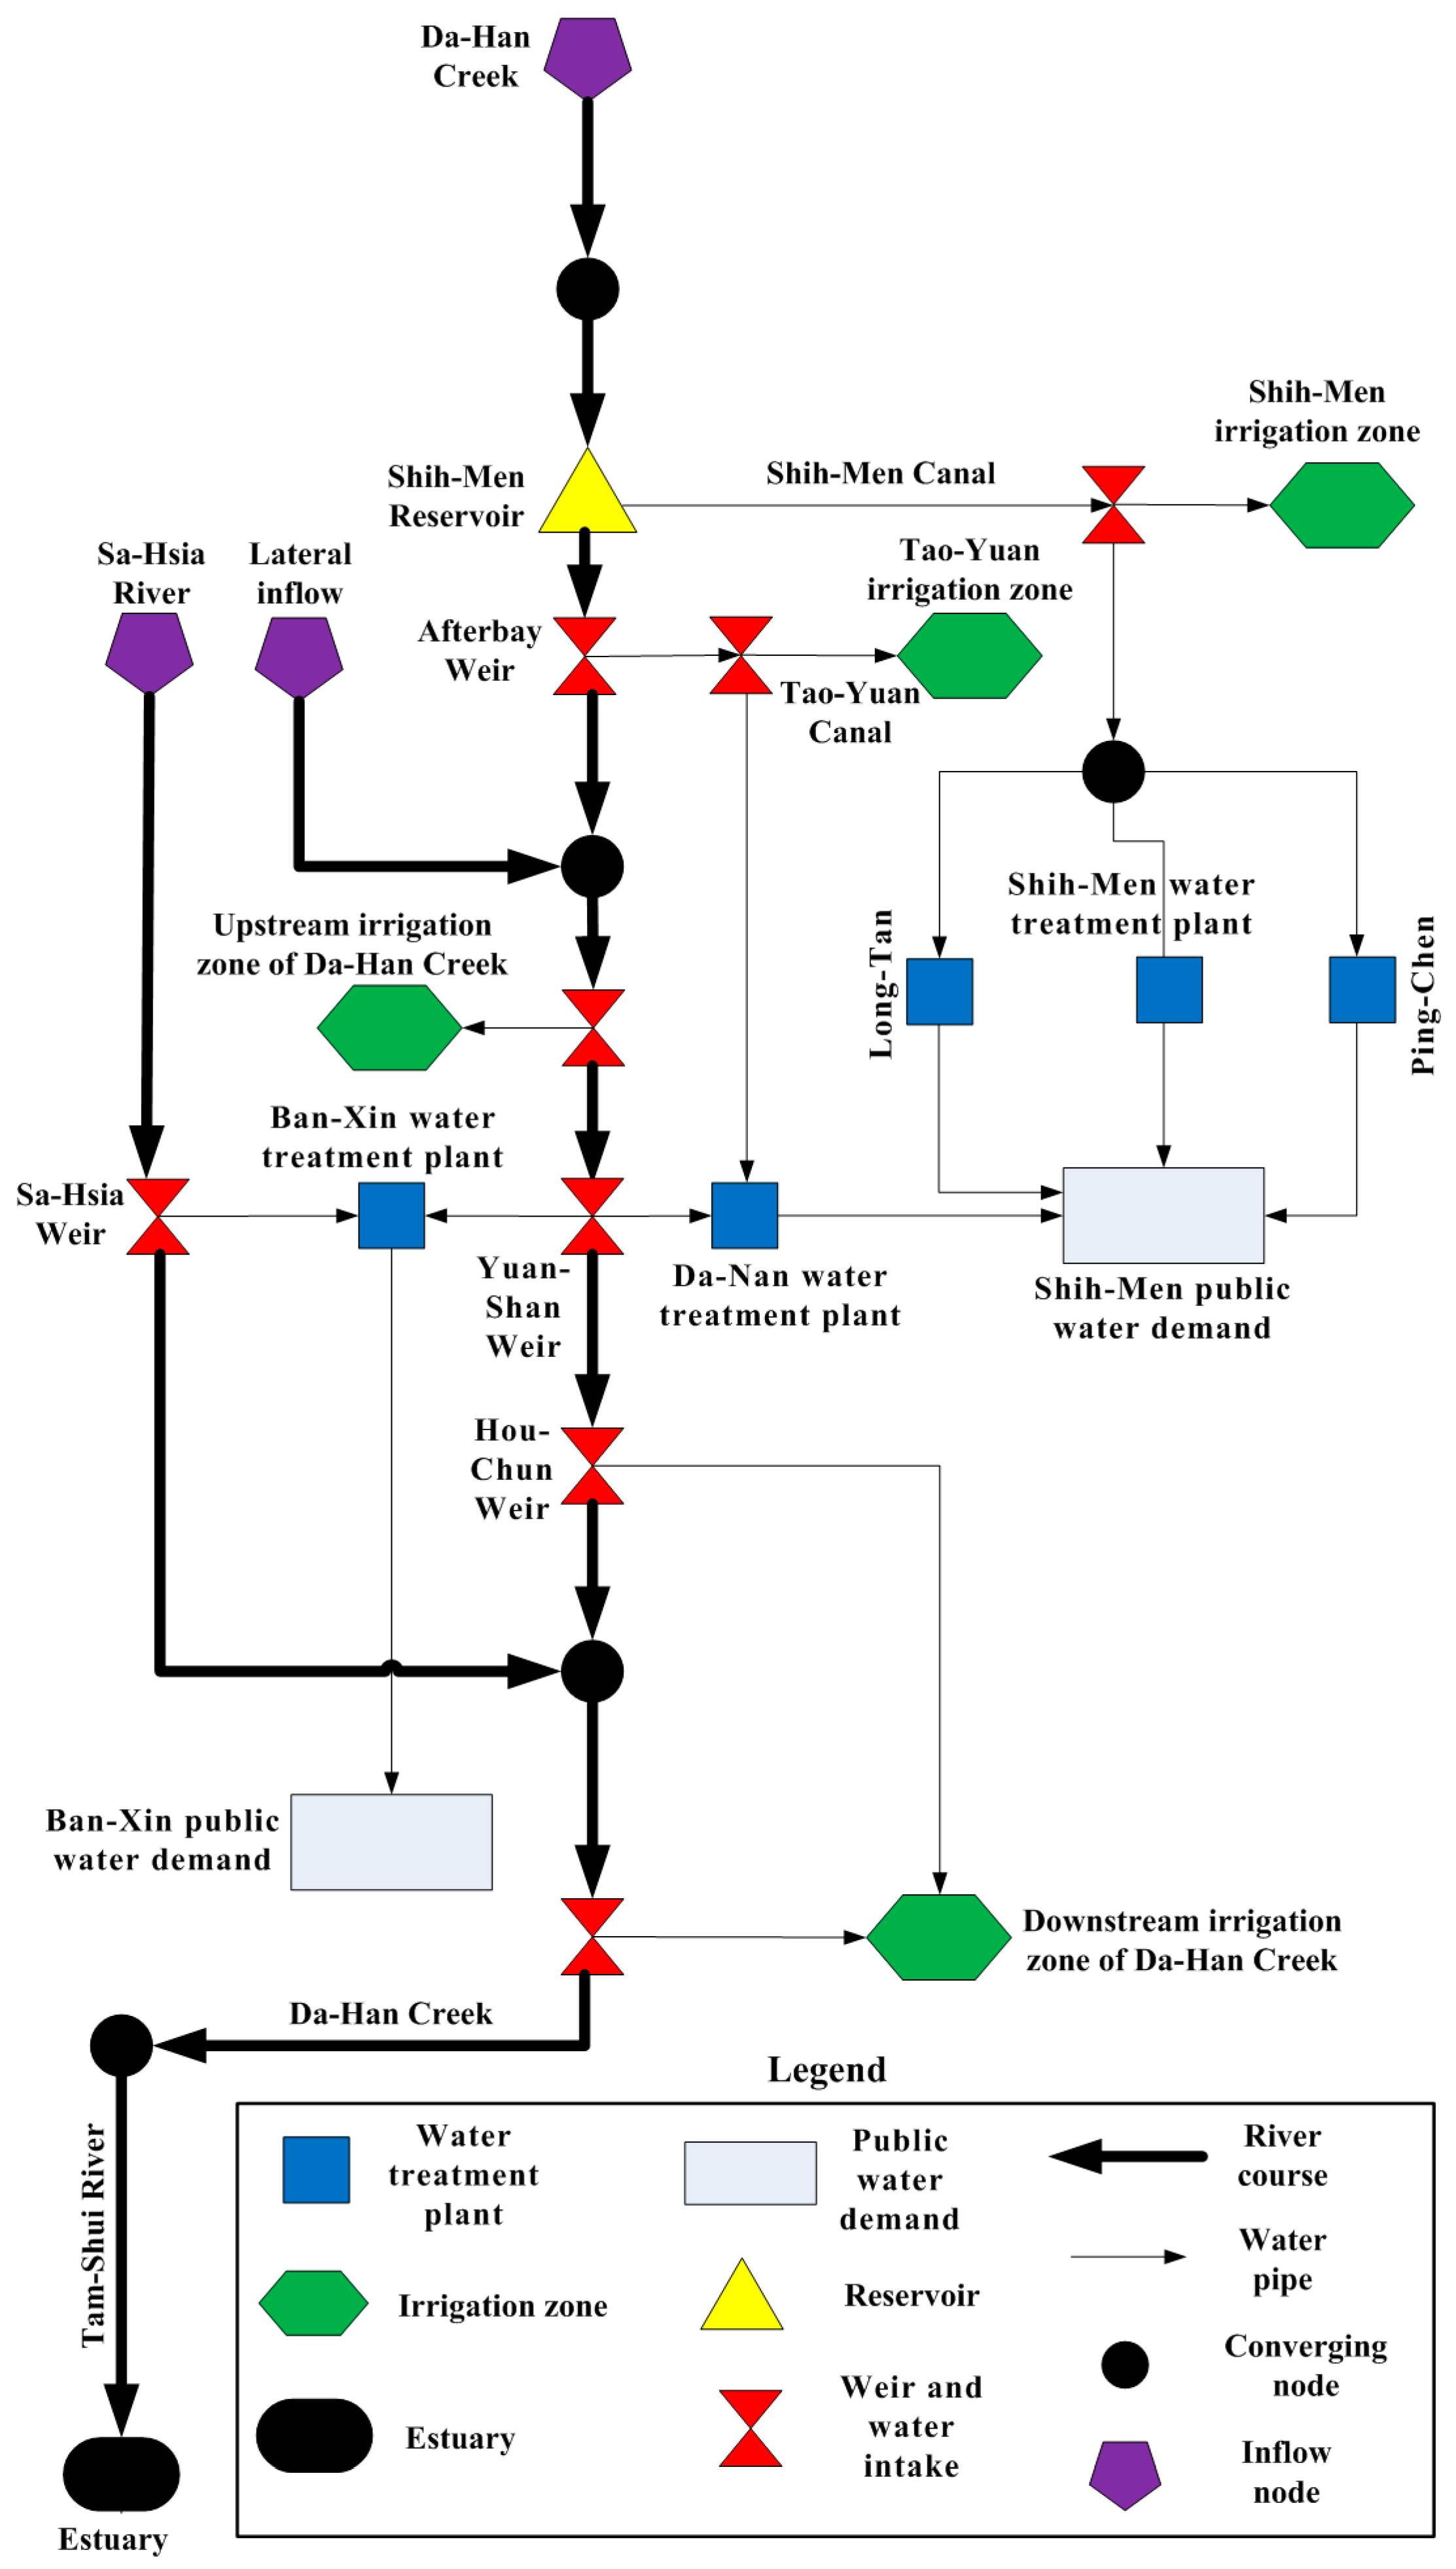
Optimization of water allocation. Construct a network flow-based optimization model using the water distribution system data and optimize the water allocation patterns for each municipal and agricultural demand.
Step 5:
Risk analysis of over-levee and shortage risks during reservoir operations. Evaluate the over-levee risk and drought risk based on the defined over-levee threshold values for the control point and resistance for the shortage index, respectively. Then, assess the trade-offs and priorities between each type of demand, and analyze the relationship between various upper limits for reservoir hedging water levels and each type of risk.

3.2. Generation of Inflow Hydrographs

3.2.1. Monte Carlo Simulation

In this study, MCS is used to generate representative synthetic inflow hydrographs for typhoon events based on historical time series data for risk analysis. Most risks in the real world have hundreds of possible outcomes. MCS can provide a fuller picture of the risk in a hydrological system by considering different likelihoods of input assumptions, initial conditions, boundary conditions and scenarios [36]. MCS generates random variables that preserve distributional characteristics and provide numerical evaluations of the probabilistic features of the system response.
The steps for generating continuous random parameters via an inverse computational fluid dynamics method are as follows: (1) select a sample size n, and generate uniform random numbers u 1 , u 2 , , u n from u(0,1); (2) define the optimal probability distribution functions (PDFs) F X ( x ) for the parameter X for generating synthetic inflow hydrographs (described in Section 3.2.2), where x is the derived value of the parameter X; and (3) solve for x m = F X 1 ( u m ) ; m = 1 ,   2 ,   ,   n .

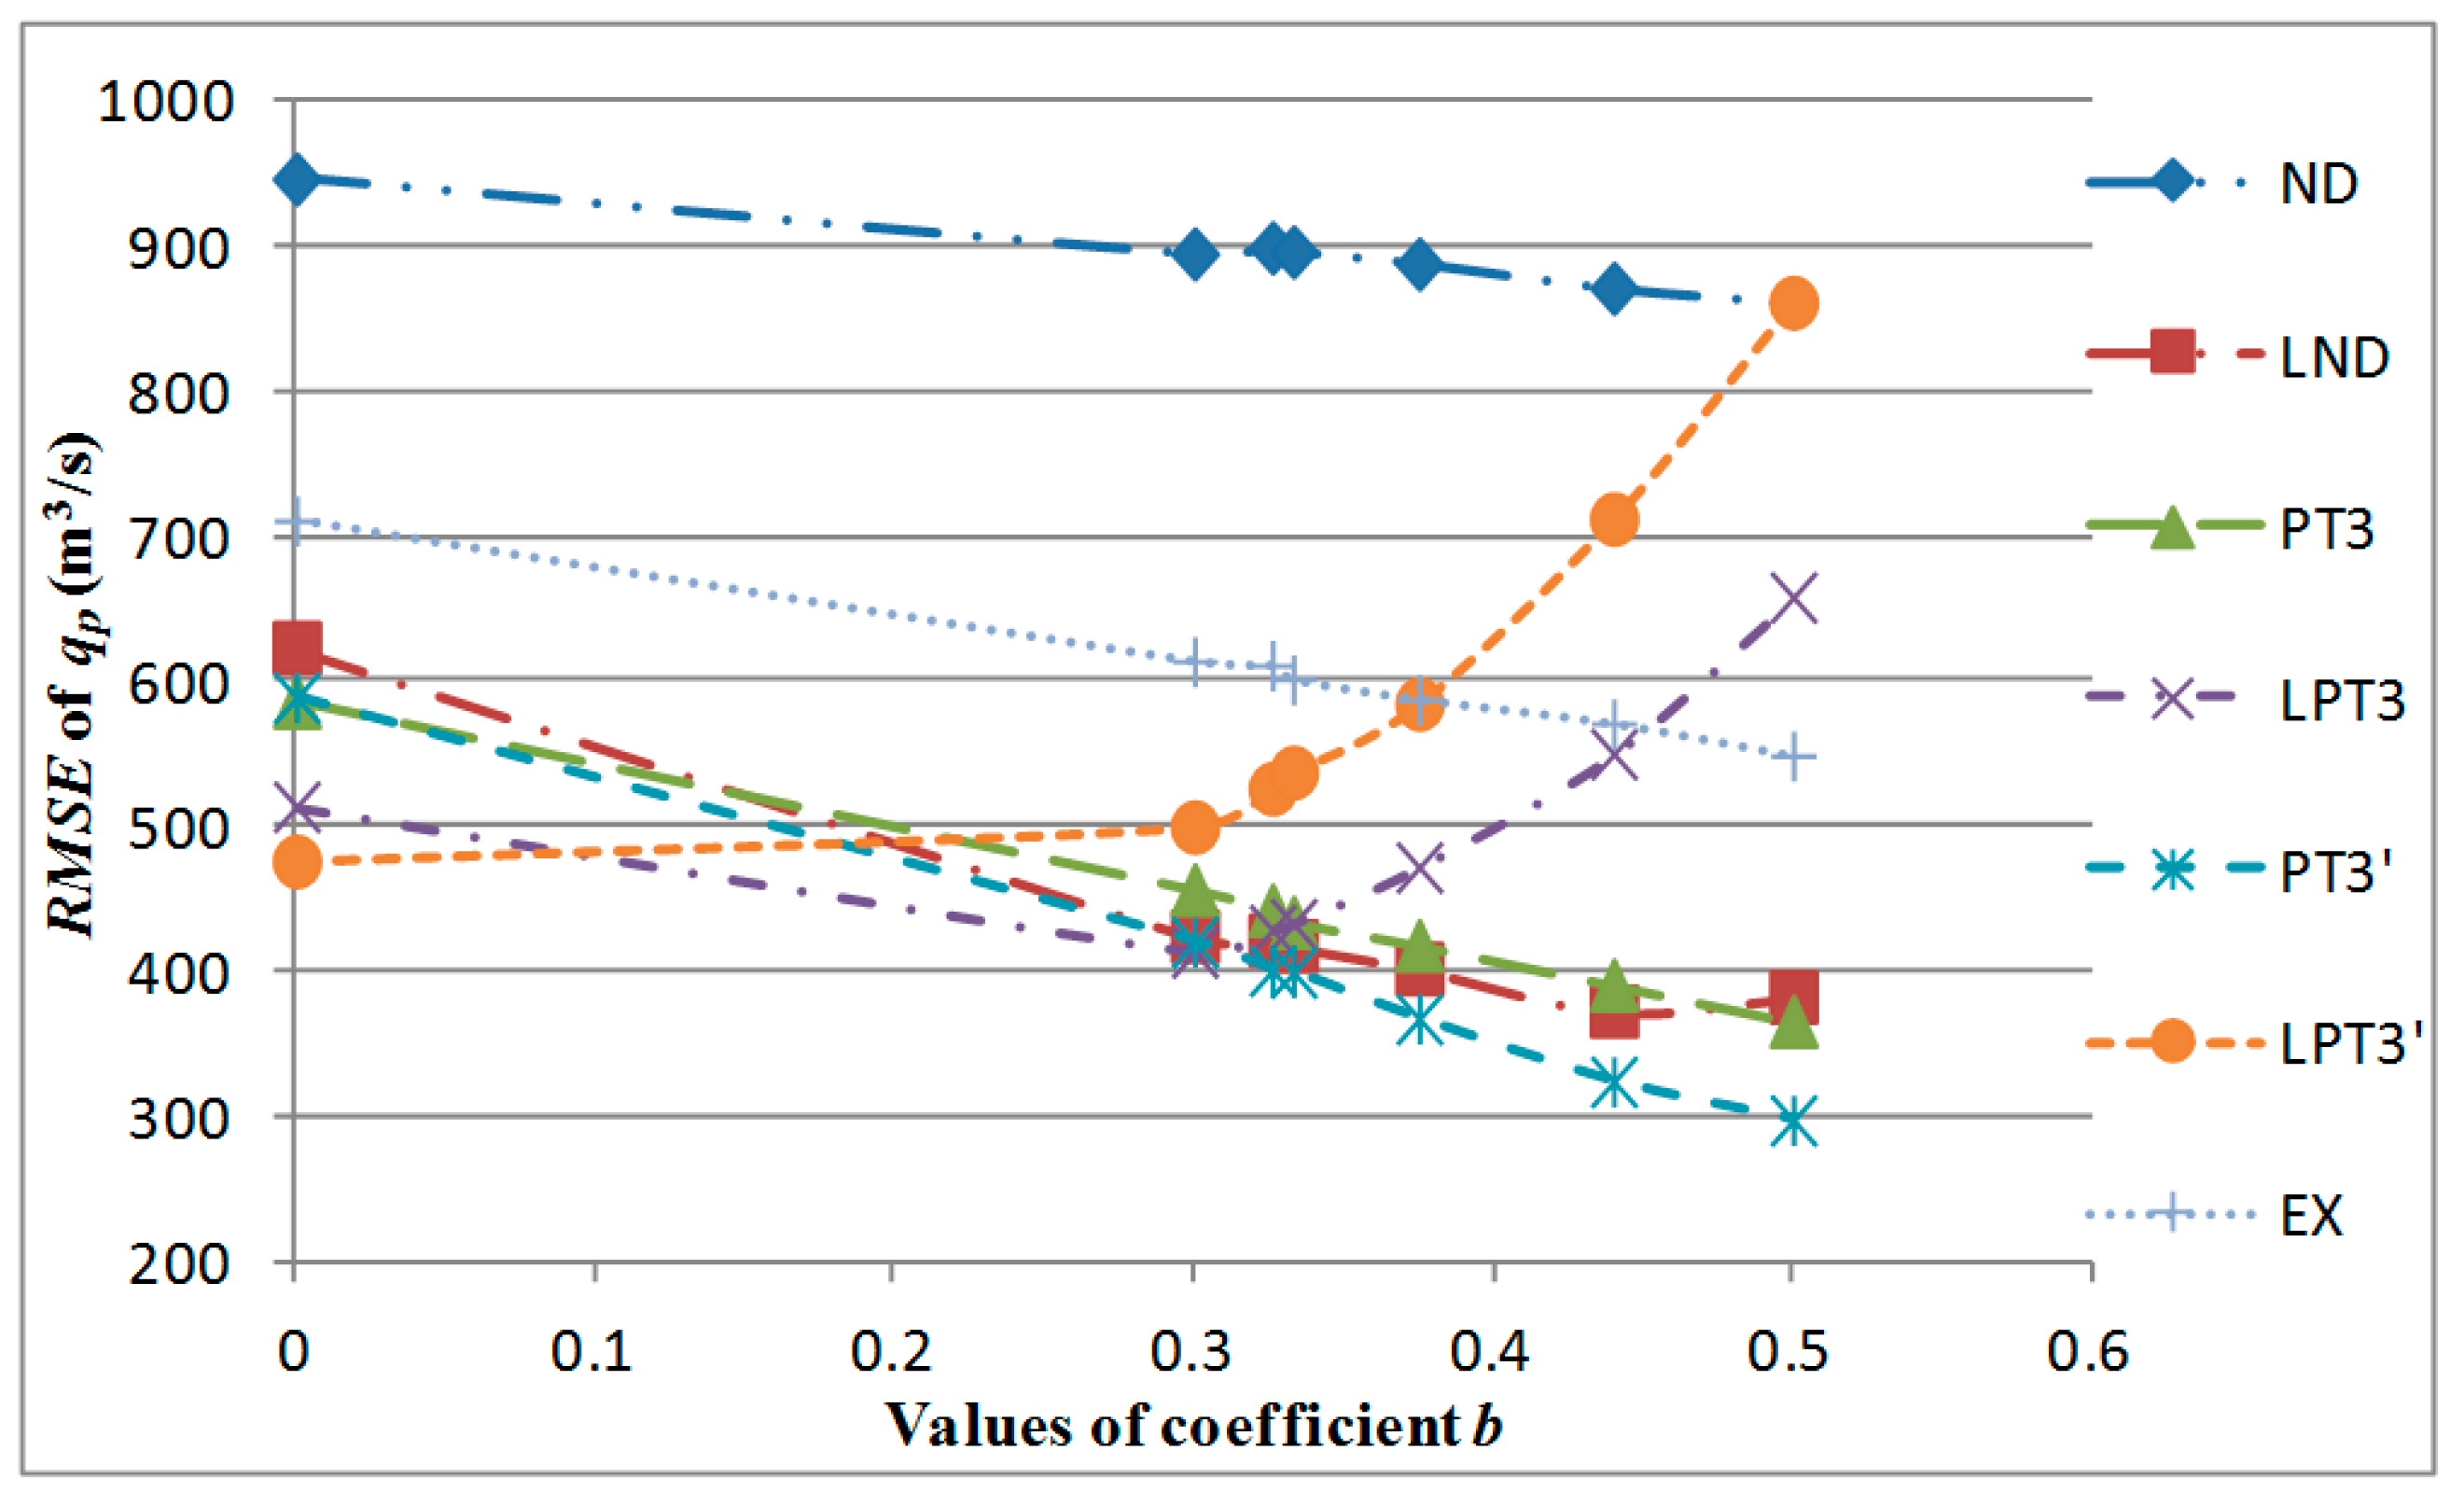
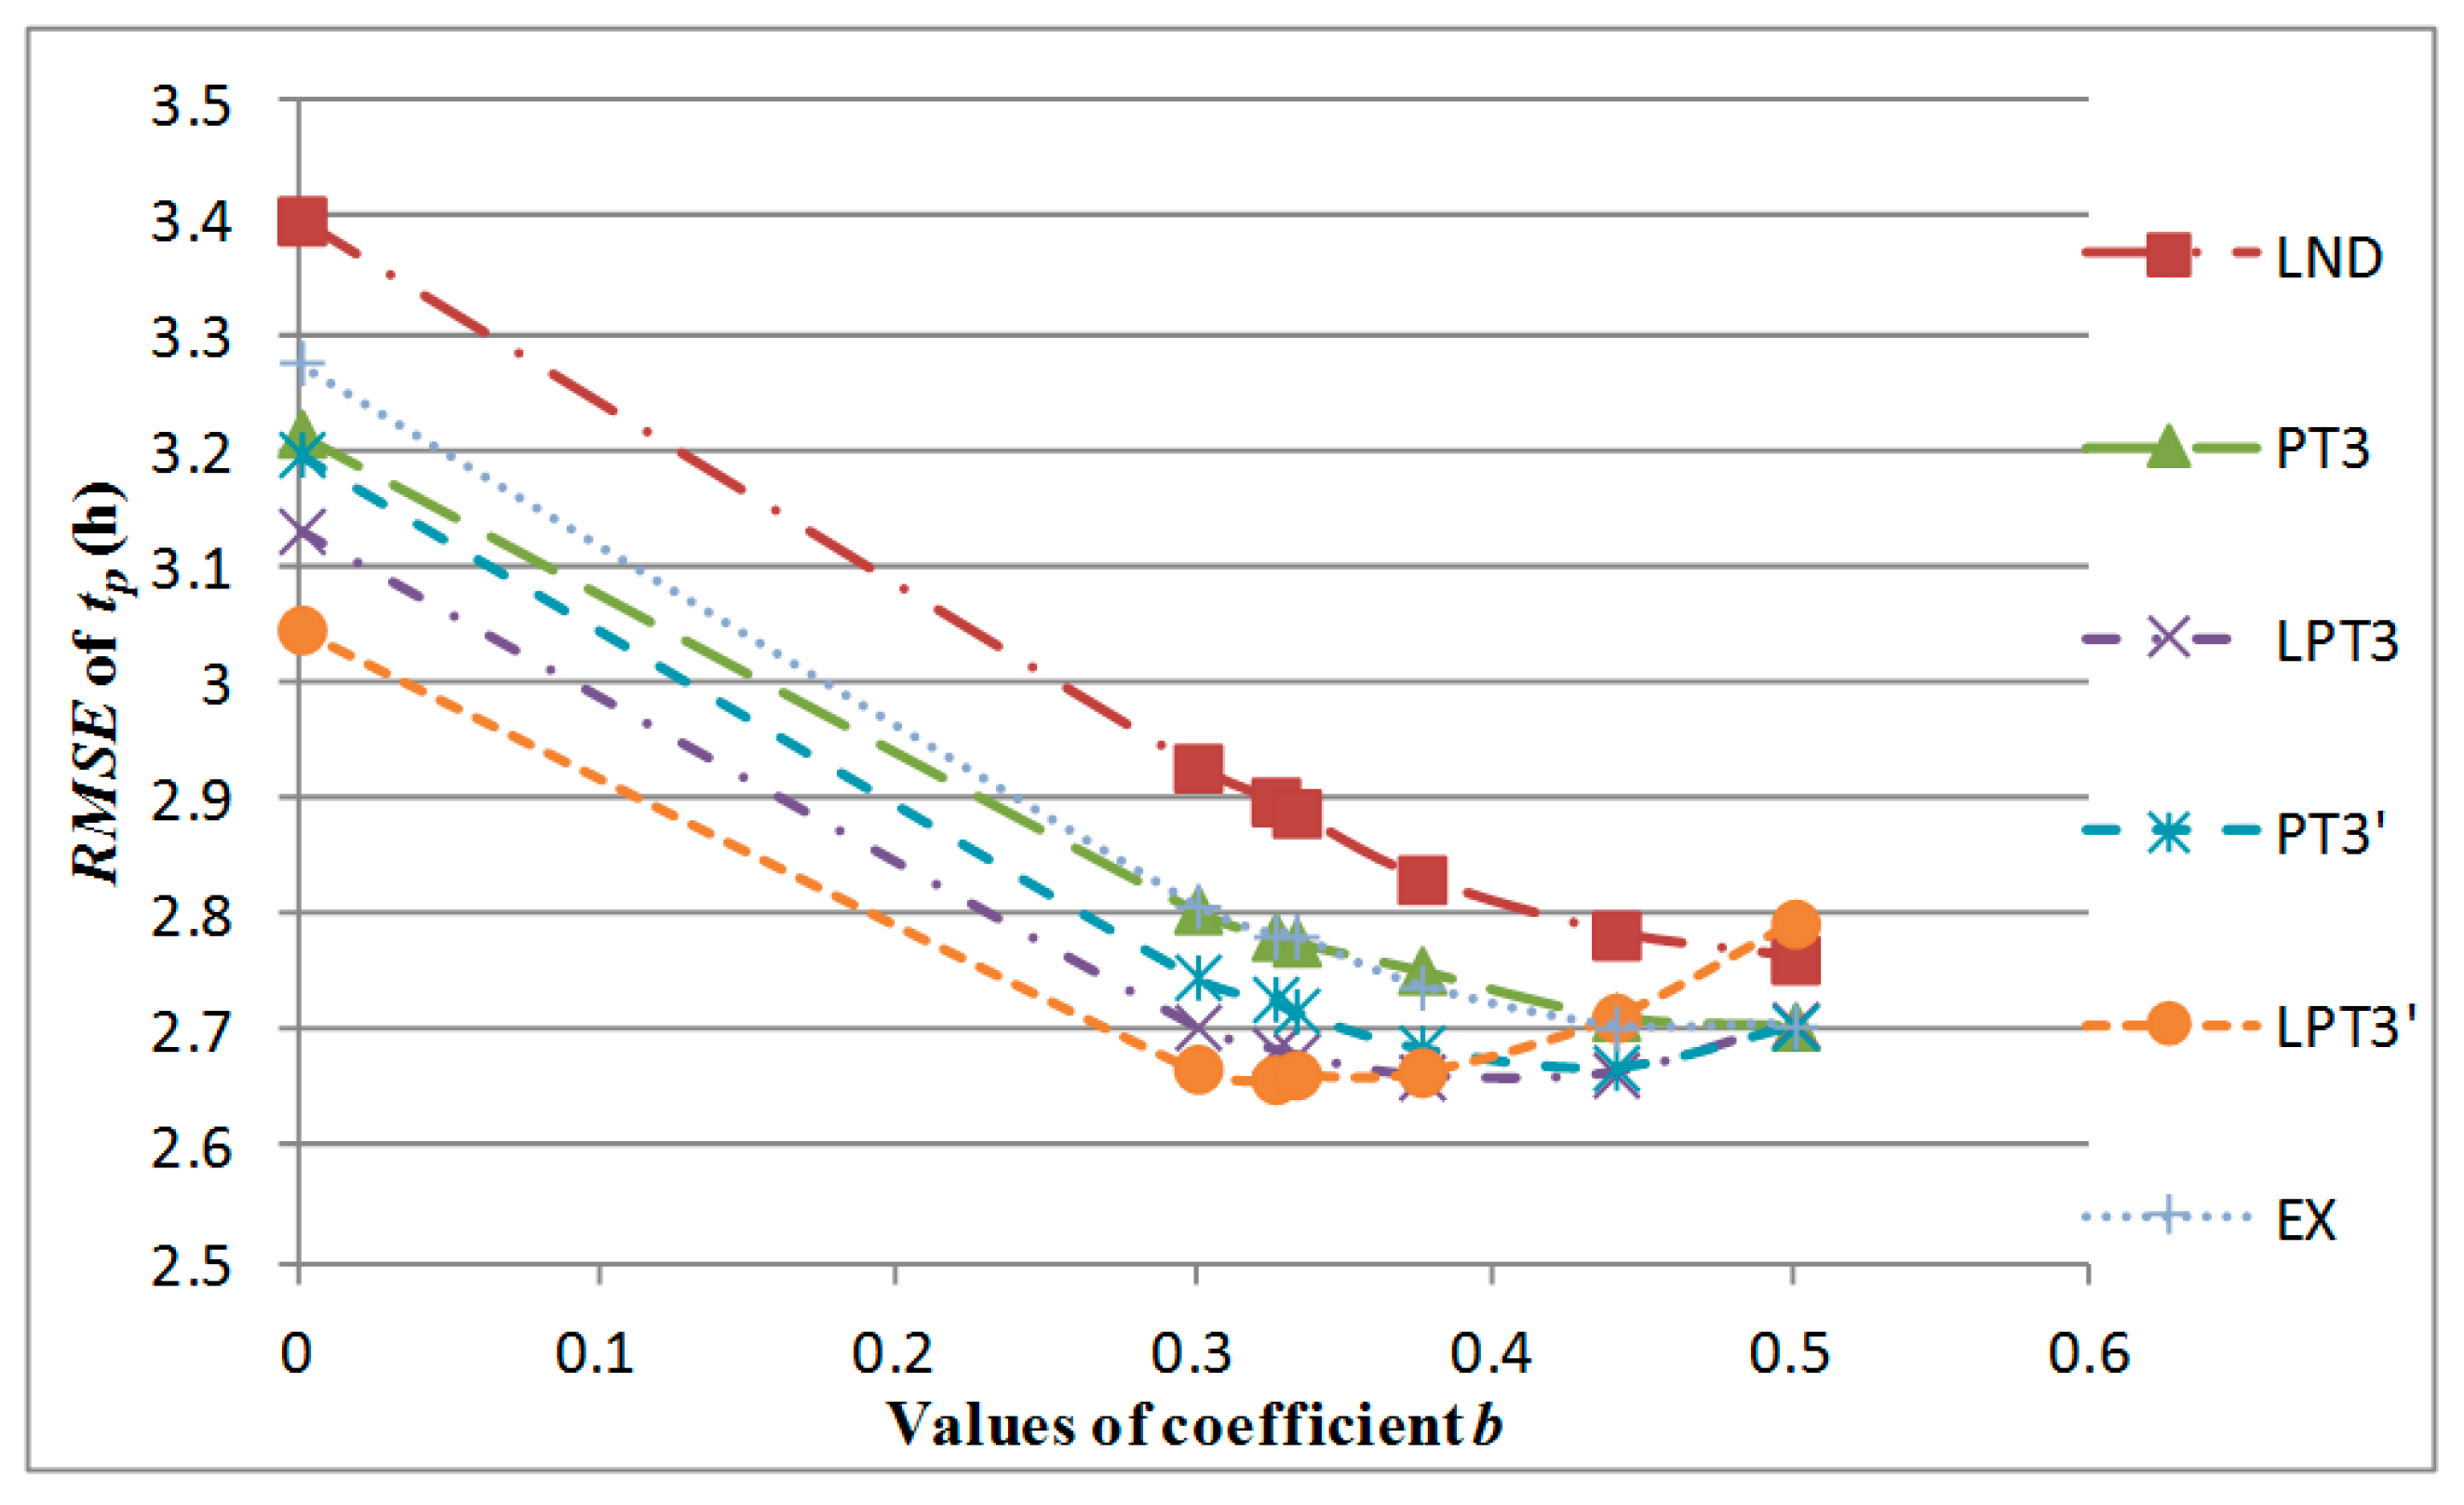
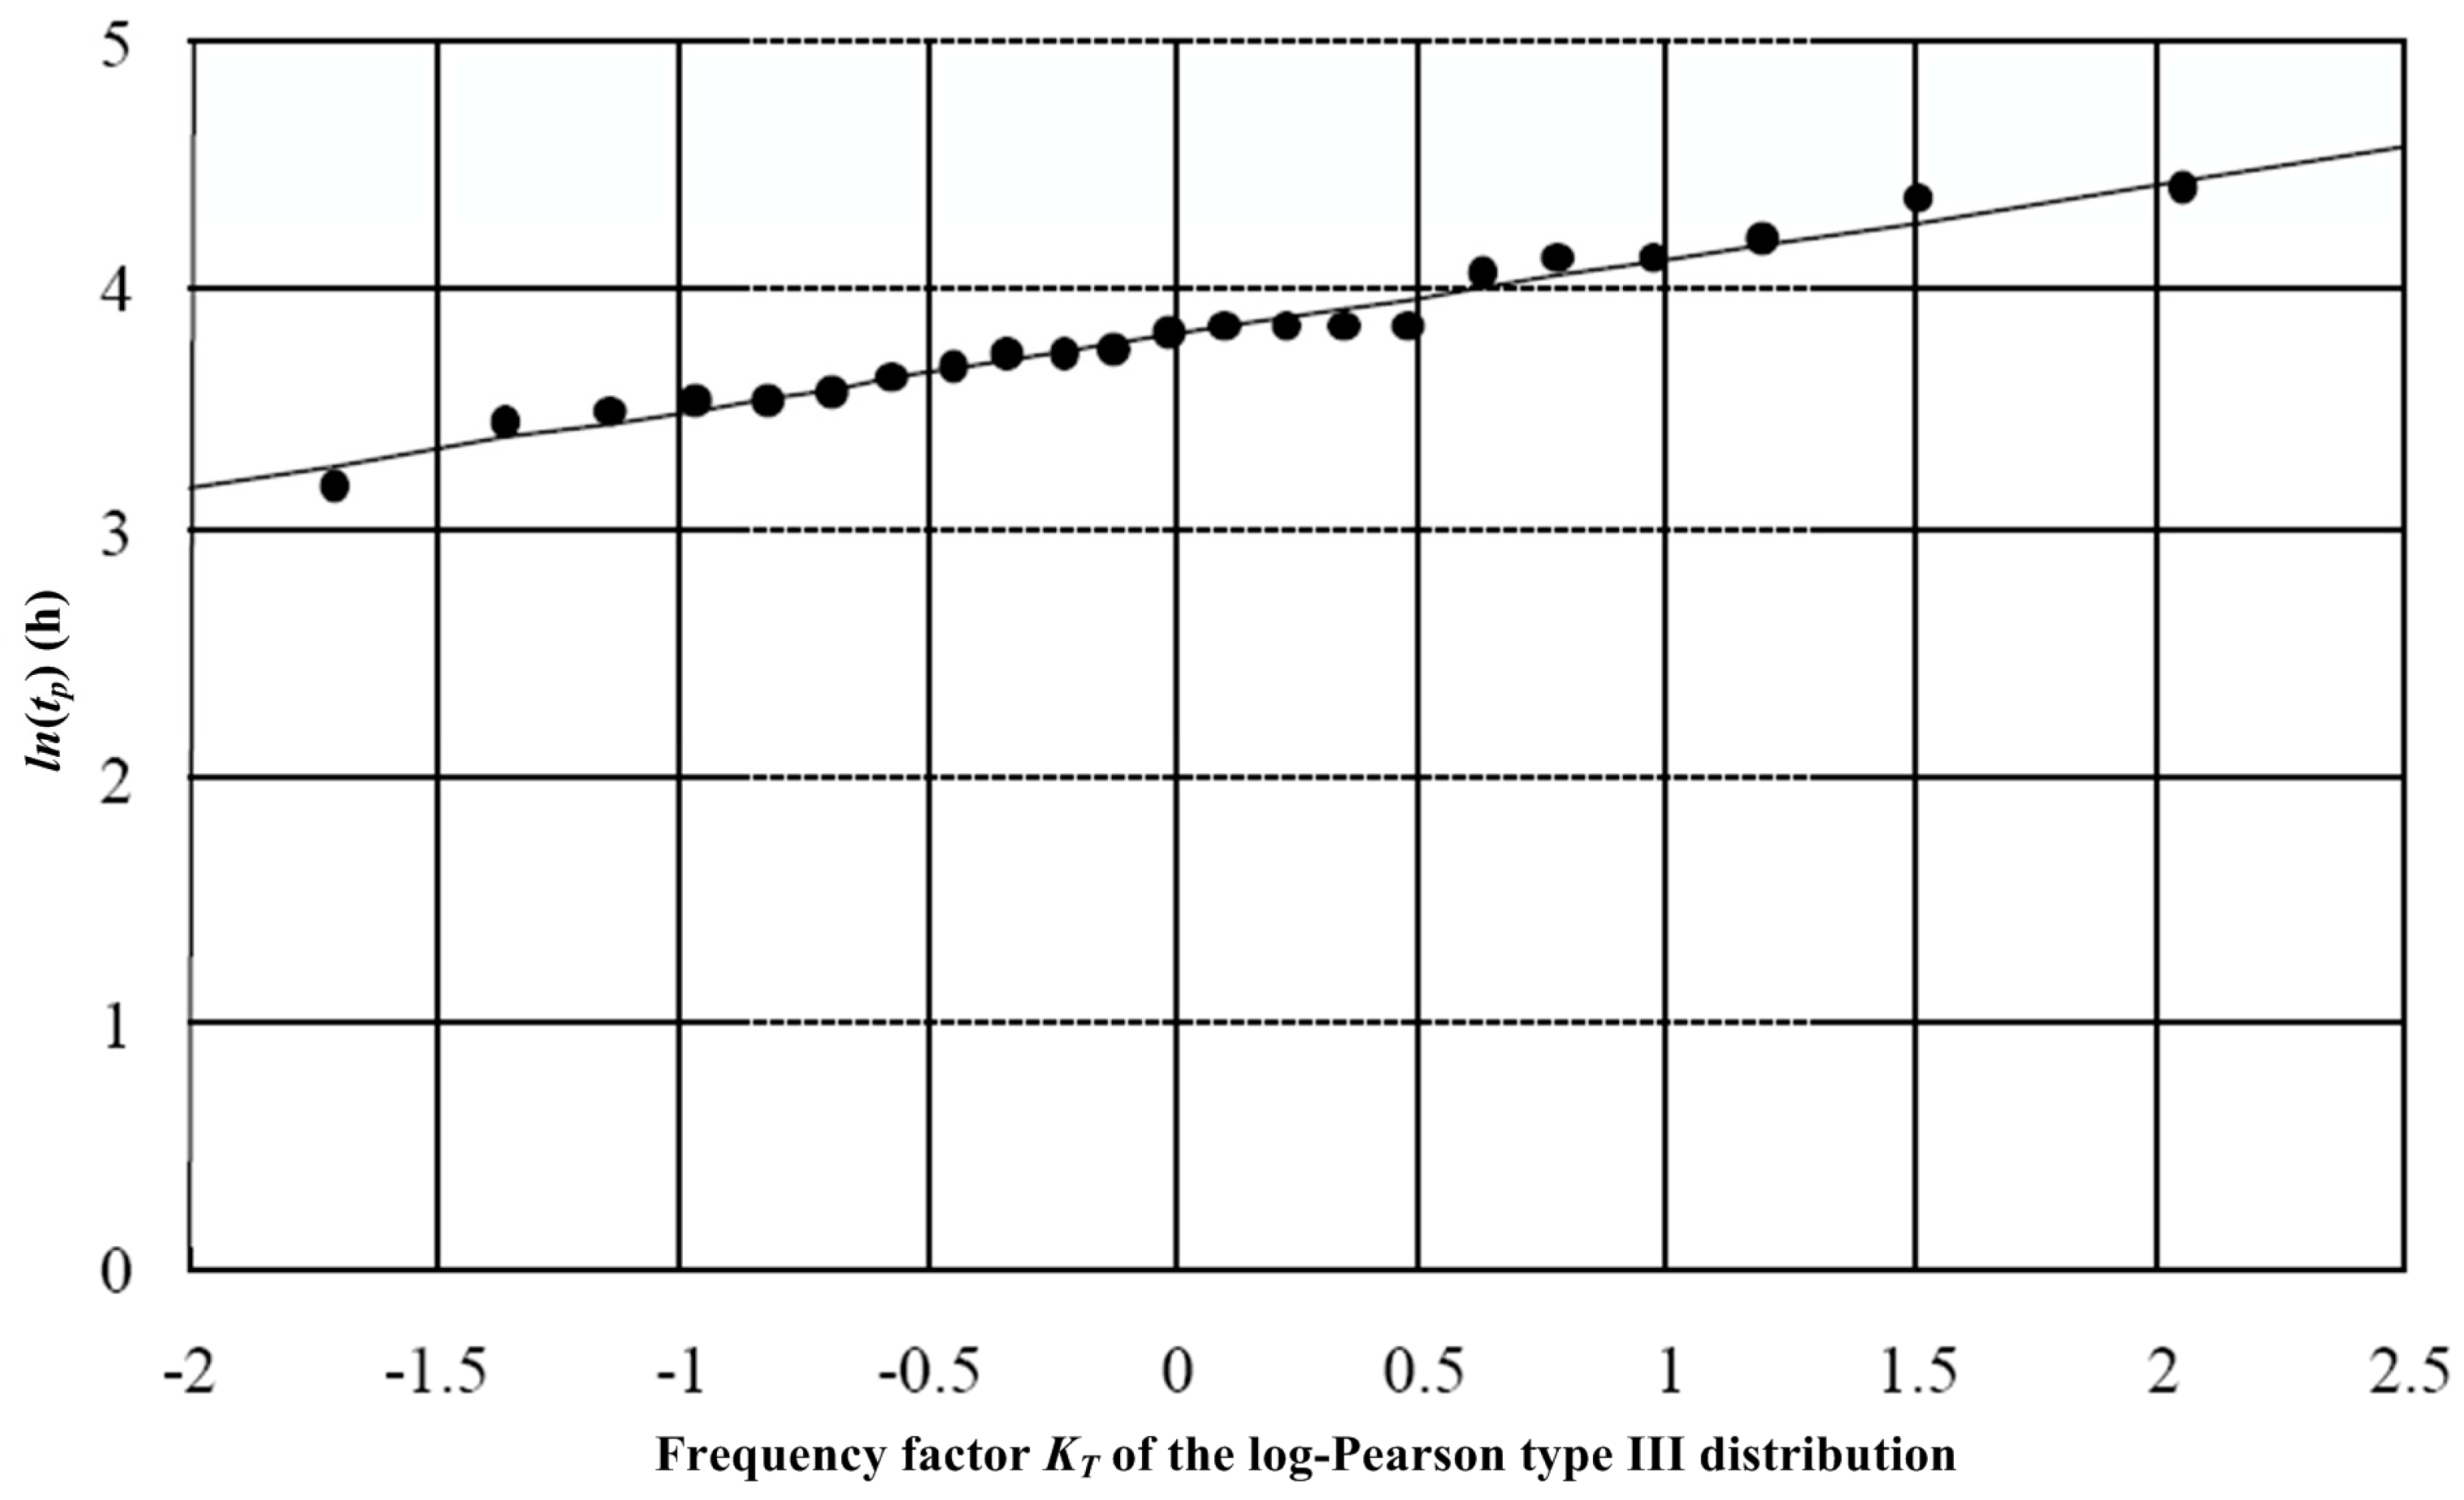
3.2.2. Synthetic Inflow Hydrographs

For generating synthetic hydrographs in this study, the parameters considered in the MCS are the peak inflow qp, base flow qb, storm runoff volume V, time to peak inflow tp and duration of the hydrograph td. We also assume some parameters: peak inflow (qp) and time to peak inflow (tp), which are independent of one another. To construct the multiphase inflow hydrograph during typhoons, this study adopted the methodology proposed by Bertoli and Moisello [37] and Hsu et al. [38], which generates an actual synthetic hydrograph using multiple integrated nonlinear regression formulae. They have formulated and validated that a reservoir inflow hydrograph during a typhoon is composed of a rising curve and a recession curve. The former and latter curves can be represented by a power function and exponential function, as shown in Equations (1) and (2), respectively.
q t = q p ( t t p ) r
q t = q p × exp ( t t p k )
where qt is the discharge during time period t, qp is the peak discharge, tp is the time to peak discharge, r is the power parameter of the ratio t/tp in the rising curve and k is the recessional parameter in the recession curve. The parameters and coefficients above are not the same for different historical flood events. Parameters qp and tp can be generated by random numbers with an appropriate distribution in the MCS. Parameters r and k are constants that influence the rising and receding slopes of the flood curve, respectively [37]. Parameters r and k for each historical flood event are calculated using Equations (3) and (4).
For each historical flood hydrograph, the volume of the inflow flood in the hydrograph under the rising curve is calculated by integrating the following equation from the starting period (t = 0) to the time to peak inflow (t = tp).
V 1 = 0 t p q p ( t t p ) r d t = q p t p r + 1
where V1 is the volume of the inflow flood in the hydrograph of the rising curve. Similarly, for every historical flood hydrograph, the volume of the inflow flood in the hydrograph of the recession curve is calculated by integrating the following equation from the time to peak discharge (t = tp) to infinity (t = ∞).
V 2 = t p q p × exp ( t t p k ) d t = q p k
where V2 is the volume of the inflow flood under the hydrograph of the recession curve.
This study first analyzes the probability distribution function of qp, tp and td according to actual inflow data collected during historical typhoon events. Based on the optimal PDFs generated by probability plotting and the criterion of error index (RMSE), the random variables generated by MCS can be transformed into corresponding parameter values for the synthetic inflow hydrographs.
(1)  Statistic distributions:
This study selects the most widely-used probability distribution functions as candidates: normal (ND), lognormal (LND), Pearson Type III using a coefficient of skewness (PT3), log-Pearson Type III distribution using a coefficient of skewness (LPT3), Pearson Type III using a modified coefficient of skewness (PT3’), log-Pearson Type III distribution using a coefficient of skewness (LPT3’) and extreme value Type I (EX). The probability plotting method and smaller RMSE are used to select the most suitable distribution function for the parameters considered.
The probability plotting method checks the fitness of the hydrologic data for a specific probability distribution. The probability plotting function can be written as follows [31]:
P ( X x m ) = m b n + 1 2 b
where n is the total number of variables in the sample, m is the rank of a variable in a list ordered by descending magnitude and P ( X x m ) is the exceedance probability of the m-th largest variable xm, for a large value of n. Note that the value of parameter b differs from the commonly suggested probability distributions (b = 0.0 in Weibull’s, b = 0.3 in Chegodayev’s, b = 0.326 in Yu’s, b = 0.33 in Tukey’s, b = 0.375 in Blom’s, b = 0.44 in Gringorten’s and b = 0.5 in Hazen’s distribution). The value of b that results in the lowest RMSE is chosen in this study.
R M S E = [ ( x t x ^ t ) 2 n ] 1 / 2
where x t is the variable of the probability distribution and x ^ t is the variable of the probability plotting data.
(2)  Sampling generation of qp, tp and td:
To generate qp, a random number between 0 and 1 is sampled using MCS. This value represents a probability density value for the parameter, for the chosen distribution. The actual value of qp is then derived by reversing the optimal PDF with its corresponding random number.
This generation method is also applied for the time to peak flow t p . For generating the duration of the hydrograph t d , instead of generating directly, we adopt a ratio (η) to ensure that the duration of the hydrograph is always longer than the time to peak discharge.
η   =   t p t d
This ratio is calculated from historical data. The probability distribution of η has been validated to be approximated by the Beta distribution [37].

3.3. Water Level Simulation at Downstream Control Point

This study developed an innovative simulation surrogate model to calculate the water level at a downstream control point using BPNN under unsteady reservoir operations. The BPNN is embedded into the optimization model for reservoir operations and water distribution to allow for rapid, automated risk evaluations. BPNN was developed by Rosenblatt [39] and Rumelhart and McClelland [40]. It belongs to a multilayer feed-forward network and manages the nonlinear relationship between inputs and outputs using a supervised learning approach. A commonly-used BPNN is a three-tier structure neural network, which includes an input layer, a hidden layer and an output layer. The input value for the neurons, which are connected by the associated weights of different layers in the network, is directly transferred into the hidden layer. Then, after performing the weighted accumulation ( n e t j n ) and transfer functions ( f ) , we obtain an output value and pass it to the output layer following the same rules. The output value ( y j n ) of j in the n-th layer is the conversion function value of the n − 1 layer neuron output value, which is given as follows:
y j n = f ( n e t j n )
The weight-accumulated value of the output value of the n − 1 layer n e t j n is:
n e t j n = i w j i n y i n 1 b j n
In this study, the hidden layer adopts the tan-sigmoid (Equation (10)) as the transfer function, while the output layer is linear. BPNN uses the steepest gradient descent method to calculate and adjust the network weight and bias values. This minimizes errors in the output value and actual target value for obtaining a calculation mode of precise learning.
y j = e n e t j e n e t j e n e t j + e n e t j
Figure 5 shows the structure of the BPNN-based simulation model. The BPNN structure includes five neurons in the input layer and one neuron in the output layer. The input data for the BPNN model include: (1) the inflow to the reservoir over the previous time period (t − 1) and current time period (t); (2) the reservoir release at time period (t − 1) and time period t; and (3) the water level at time period (t − 1) at the downstream control point, which is the San-Ying Bridge station. The output is the water level of the current period (t) at the downstream control point.
The BPNN-based water level simulation model is constructed in three parts: single-moment training, single-moment validation and complete-event unsteady simulation and verification. The single-moment simulation primarily involves the calculation mechanism for the water level simulation at a steady state. Complete-event simulation and verification adds single-moment calculation units and provides feasibility verification for the unsteady simulation.
The number of neurons in the hidden layer is decided by a constructive algorithm with indicators for precision, stability and practicability. This study adopted the mean absolute error (MAE), mean squared error (MSE) and goodness of fit ( G b e n c h ) as indicators for selecting the number of neurons, as shown below:
M A E = t = 1 n | H t ^ H t | n
M S E = t = 1 n ( H t ^ H t ) 2 n
G b e n c h = 1 t = 1 n ( H t H t ^ ) 2 t = 1 n ( H t H t bench ) 2
where H ^ t is the simulated water level at period t, H t is the observed water level and H t bench is a standard sequence value for the water level (which was set as H t 1 in this study). MAE is suitable for evaluating the simulated accuracy among all water level time series, whereas MSE is suitable for high water level periods. Smaller values of MAE and MSE indicate that the simulated accuracy and stability of the model is high. Moreover, G b e n c h is applied to evaluate the simulated efficiency of the model; a larger value indicates that the model effectiveness is high.

3.4. Optimization Model for Reservoir Operations and Water Allocation

For short-term flood control during typhoons, an optimization model is applied to optimize the reservoir release hydrograph and simulate the corresponding operational outcome. The details of the optimization model, operation rules and calculation of reservoir storage during typhoon events can be found in Hsu and Wei [3]. The objective functions of the optimization model include minimizing the downstream peak flow water level at a specified control point and maximizing final reservoir storage at the end of the flood, as shown below:
M i n i m i z e Z = W 1 ( x DC H max H RiverBed H Levee H RiverBed ) + W 2 ( | S full x t III S | S full ) | W 1 + W 2 = 1 0 < W 1 < 1 0 < W 2 < 1
where H Levee and H RiverBed are the elevation of the river levee and the riverbed at a downstream control point, respectively; W 1 and W 2 are the weighted coefficients for minimizing the downstream water level and for maximizing the final reservoir storage, respectively. In this study, we consider the two weighted objective functions to have equal importance. Reservoir storage routing is formulated on the basis of a mass balance equation, in which the difference between the reservoir inflow and outflow must be equal to the variation in storage, as shown below:
Δ t 2 ( I t 1 + I t ) Δ t 2 ( x t 1 R + x t R ) = x t S x t 1 S t 0 t t III
where ∆t is a short time interval in hours for routing; It is the reservoir inflow at time t; x t R is the reservoir release variable at time t, which is also the decision variable for the optimization model; x t S is the reservoir storage variable at time t; and t 0 and t III are the starting and ending time of flood control operations, respectively. The final reservoir storage at the end of flood control operations x t III S is devised as the initial storage capacity for water supply in drought periods.
Furthermore, this study applied a network flow-based water allocation optimization model to estimate water supply and shortage characteristics. The applied regional water distribution system for water supply allocation considers practical reservoir operation criteria, including rule curves and hedging rules, can be formulated as a mixed integer linear programming-based minimum-cost problem [9,13]:
M i n i m i z e t = 1 T ( i , j ) A c ( i , j ) , t x ( i , j ) , t
s . t . { (17) ( j , i ) A x ( j , i ) , t ( i , j ) A x ( i , j ) , t = b j , t , j Ν (18) x ( i , j ) , t min x ( i , j ) , t x ( i , j ) , t max , ( i , j ) A
where t = time index; T = total number of time periods; i,j = node index; (i,j) = an arc that emanates from node i and terminates at node j; x ( i , j ) , t = nonnegative flow in arc (i,j); x ( i , j ) , t min = lower bound of x ( i , j ) , t ; x ( i , j ) , t max = upper bound of x ( i , j ) , t ; c ( i , j ) , t = weighting factor (unit cost) for arc (i,j); b j , t = source/sink term at node j; N = node set of the network; and A = arc set of the network.
The decision variables in the optimization model are the directional flows in each arc in the configuration. In the composite objective function, Equation (16), the weighting factor c ( i , j ) , t for each x ( i , j ) , t , reflects the priority of each objective. Equation (17) is the general form of a set of continuity equations, which can be applied to inflow, diversion, junction, demand or reservoir nodes. Equation (18) specifies the lower and upper bounds of each flow variable. Moreover, the total water supply for the regional water distribution system should be lower than the difference between the initial reservoir storage capacity x t III S and the dead storage S dead , as shown below:
t = 1 T [ ( j , i ) A x ( j , i ) , t ( i , j ) A x ( i , j ) , t ] x t III S S dead

3.5. Risk Analysis

Uncertainty and risk analysis provide a means to comprehend the relationship between the parameters and system responses. The U.S. began requesting uncertainty and risk analyses in 1976 for water resources planning and management, in addition to cost and benefit analyses [41]. This study applies risk analysis to evaluate the risk of over-levee conditions and drought during reservoir operations. We define the system reliability, Ps, as the probability of non-failure, in which the resistance of the system (R) exceeds the load (L) [42]; that is,
P s = P ( L R )
where P ( L R ) denotes the reliability (i.e., non-occurrence probability, safe probability) of over-levee and drought conditions. The failure probability, Pf, is the opposite of reliability and can be expressed as:
P f = P ( L > R ) = 1 P s
Load (L) and resistance (R) are functions of a number of random variables, which are:
L = g ( X L ) = g ( X 1 , X 2 , .... , X m )
R = h ( X R ) = h ( X m + 1 , X m + 2 , .... , X n )
where X 1 , X 2 , X n are random variables used to define the load function, g(XL), and the resistance function, h(XR).
This study selects the performance function ( W ( X ) ) as W ( X ) = R L = h ( X R ) g ( X L ) . From the risk values for different variables and setting resistances, the mean ( μ W ) and standard deviation ( σ W ) of the performance function are obtained. The reliability index, β, is calculated as μ W / σ W . In practice, the CDF is a normal distribution, and the reliability, Ps, is obtained by P S = 1 F W ( 0 ) = 1 F W ( β ) , where F W ( ) is the CDF of the performance function W and W’ is the standardized performance function, which is defined as W = ( W μ W ) / σ W . By subtracting Ps from 1, the risk ( P f ) is obtained.

3.6. Shortage Index Definition

In this study, a shortage index (SI) is devised as an indicator of the degree of shortage. SI was proposed by the Hydrologic Engineering Center, U.S. Army [13]. It is the square of the shortage rate, showing the degree of influence of water deficit on society. This study employs the modified shortage index (MSI) proposed by Hsu and Cheng (2002) [8] to calculate the water supply risk in a drought period using different upper limits. MSI is shown as Equation (24), where n is the number of 10-day periods, DSt is the shortage in the tth 10-day period and DDt is the demand in the tth 10-day period.
M S I = 100 n t = 1 n ( D S t D D t ) 2

4. Application

4.1. Adopted Typhoon Events for Risk Analysis and Construction of the BPNN-Based Water Level Simulation Model

This study analyzed multiple reservoir operation risks, considering over-levee events and water shortages in the Da-Han Creek basin. Complete official records for hydrometeorology and reservoir operations are available from 1996. The outlet-intake engineering of Shih-Men Reservoir was rebuilt in 2005 after the flood-sedimentation invasion of Typhoon Aere in 2004 [43]. To assess the risks of over-levee events and water shortages prior to the rebuild, this study adopted storm inflow data from 23 typhoon events during 1996 and 2004 for risk analysis, as listed in Table 1. The data source is the Shih-Men Reservoir Management Bureau, Water Resources Agency, Taiwan. Among these adopted storm events, five are super typhoons. The average peak inflow is 1869 m3/s, and the average flood duration per typhoon event is 84 h. This study adopted flood events occurring prior to Typhoon Aere (i.e., 28 August 2004) for the single-moment training of the BPNN-based water level simulation model and flood events after Typhoon Aere for single-moment validation and complete-event verification of the BPNN-based model, because of data acquirability in that time.

4.2. Synthetic Inflow Hydrograph of Shih-Men Reservoir

To generate synthetic hydrographs, the parameters, peak inflow qp and time to peak inflow tp must be generated individually and are assumed to be independent of one another. To validate this assumption, the correlation coefficient (R2) is calculated. The R2 value between qp and tp is 0.00865 for the historical data of typhoon events, indicating that the assumption of independence is valid.
In practice, hours are typically used as the units for an observed inflow hydrograph. To enhance the precision of tp, this study computed tp considering the hydrological characteristic of the studied basin. The value of tp can be computed from the time to maximum rainfall intensity ( t max rain ) plus the time of concentration ( T c ). When the return period ( T R ) for typhoon rainfall is less than 100 y, T c can be calculated by length ( L 0 ) divided by the velocity ( ν ) and slope ( S 0 ) of overland flow. When the return period is larger than 100 y, T c can be calculated by Manning’s equation, which can be expressed as follows:
t p = t max rain + T c = t max rain + { L 0 ν S 0 0.5 , T R < 100 419.3 i ¯ 0.4 ( n 0 L 0 S 0 ) 0.6 , T R 100
where n 0 , L 0 , ν and S 0 are the roughness coefficient, length (m), velocity constant (m/s) and average slope of overland flow, respectively; and i ¯ is the average rainfall intensity for a rainfall duration equal to T c (mm/h).
The relationship between different kinds of probability functions for different values of coefficient b and the corresponding RMSE values for the peak inflow (qp) and the time to peak inflow (tp) of the Shih-Men Reservoir are shown in Figure 6 and Figure 7, respectively. For the peak inflow (qp) of Shih-Men Reservoir, the RMSE value for the PT3’probability distribution function is lower than those for other distributions under 0.3 < b < 0.5. For the time to peak inflow (tp), the RMSE value for the LPT3’ probability distribution function is lower than those for other distributions under 0.3 ≤ b ≤ 0.44. According to Figure 6 and Figure 7 and Table 2, the results show that the optimal probability distributions (i.e., that with the lowest RMSE) for the peak inflow and time to peak inflow are PT3’ with b = 0.5 (RMSE = 297.48 m3/s) and LPT3’ with b = 0.326 (RMSE = 2.659 h), respectively. The ND is not acceptable for use with tp for Shih-Men Reservoir (RMSE > 5 h), so it is not shown in Figure 7. The probability plotting of qp and tp for the best distributions is shown in Figure 8 and Figure 9. Additionally, this study analyzed historical inflow data to obtain the values for these parameters for the synthetic inflow hydrograph of Shih-Men Reservoir: n = 2.83 and k = 16.42.
The main advantage of MCS is that it typically considers a much broader range of possible results than the historical returns method. After a sensitivity analysis, we found that the minimum number of simulation runs was 10,000 for obtaining reasonably accurate values of over-levee and water shortage risks.

4.3. Construction Outcomes of the BPNN-Based Water Level Simulation Model

To evaluate the validity of the selected inputs for the developed BPNN-based water level simulation model, we analyzed the correlation coefficients (R2) between the candidate inputs and the output (i.e., water level at the San-Ying Bridge at time t). The R2 values between the selected inputs (i.e., the inflow to the reservoir at time t − 1 and t, the outflow from the reservoir at time t − 1 and t and the water level at the downstream control point at time t − 1) and the output are 0.633, 0.629, 0.680, 0.674 and 0.987, respectively. These R2 values show that all of the selected model inputs are highly correlated with the simulation outputs. This means that the inputs are suitable potential simulators for predicting the outputs.
After several repeated tests of neurons in the hidden layer, with numbers ranging from 1 to 20, we compared appraisal indicators and determined that the optimal number of hidden layer neurons was 11. With 11 neurons, we obtained the highest G b e n c h training and validating values (0.992 and 0.956, respectively). Moreover, the training and validating MAE values (0.143 and 0.151 m, respectively) and MSE values (0.532 and 0.579 m, respectively) for the best model with 11 hidden layer neurons are smaller than those for models with other numbers of hidden layer neurons, indicating that this structure is optimal for the BPNN-based model. The simulated results for the single-moment training and validation for the water level at San-Ying Bridge are shown in Figure 10a,b, respectively. The results showed that the single-moment errors of MAE and MSE were small, demonstrating an accurate simulation trend (proven by the G b e n c h values). Therefore, the training and validation results of the single-moment simulation were satisfactory and could be continued for the entire event simulation.
Figure 10c depicts the verification results for the complete-event iterative unsteady simulation of the developed BPNN-based model during Typhoon Haima. The MAE values for the water level simulation during the three verification events (typhoons Haima, Nock-ten and Nanmadol) were small: 0.161, 0.154 and 0.166 m, respectively. The corresponding MSE values were 0.625, 0.608 and 0.643 m, respectively. Although iterative unsteady simulations sometimes have one-hour shifts (because of the lack of unknown future hydrological information for model inputs), the best-constructed BPNN-based model still can capture fluctuation trends during high water level periods. Moreover, the Gbench values for typhoon Haima, Nock-ten and Nanmadol were 0.898, 0.927 and 0.861, respectively (that is, all Gbench values reached at least 0.86). These results indicate that the BPNN-based model developed in our research can effectively and rapidly simulate unsteady-state water level changes during typhoon events. Therefore, this alternative model can be embedded in the optimization model to quickly and automatically determine an optimal reservoir release hydrograph for each synthetic typhoon inflow event. However, the BPNN-based water level simulation model had been validated for the typhoon events with smaller return periods due to the availability of data when the research was conducted, but the validated events lack data with higher return periods. Hence, the BPNN-based simulation model may underestimate the downstream water level and the corresponding over-levee risk on the synthetic typhoon inflow events with higher return periods. This study suggests that the sufficient typhoon inflow events with different return periods could be collected for the model establishment and risk analysis to resolve this problem in the future research.

4.4. Risk Analysis Parameter Setting

4.4.1. Setting of the Threshold Value of Resistance of the Shortage Index

The first task when evaluating shortage risk is setting the resistance threshold. This threshold can reflect the shortage risk by reasonably considering the shortage tolerance degree for the demand node. This study sets an expected shortage rate ( D S t / D D t ) in Equation (24) for the public demand node at every period t, according to the practical value at which the water supply must begin to decompress and at which water rationing must begin. Additionally, an expected shortage rate is set for the agricultural demand node, according to the practical value at which cultivation needs to start to fallow [44]. Then, the expected shortage rate is transformed to an MSI as the threshold for risk analysis. The tolerance degree for shortages to the public supply (which differ for each location) is more severe than for agricultural supplies, because of economic benefits. Based on the above principles, the expected shortage rate ( D S t / D D t ) of the Shih-Men public supply is set as 7%, and the corresponding MSI is 0.50. The expected shortage rate of the Ban-Xin public supply is 3%, and the corresponding MSI is 0.09. The expected shortage rate of all agricultural supplies (downstream of Da-Han Creek, Shih-Men, Tao-Yuan and upstream of Da-Han Creek) is 10%, and the corresponding MSI is 1.00.

4.4.2. Setting the Threshold Value for Over-Levee Risk

The Water Resources Agency in Taiwan has predetermined the water level of the Da-Han Creek at the control location that will result in an over-levee event. This was done with in situ investigation and numerical computation. This specific threshold value at the San-Ying Bridge station is at 46 m at mean sea level [3]. This study used this characteristic value to determine the occurrence of over-levee events and compute the corresponding over-levee risk.

4.5. Results and Discussions of the Risk Analysis

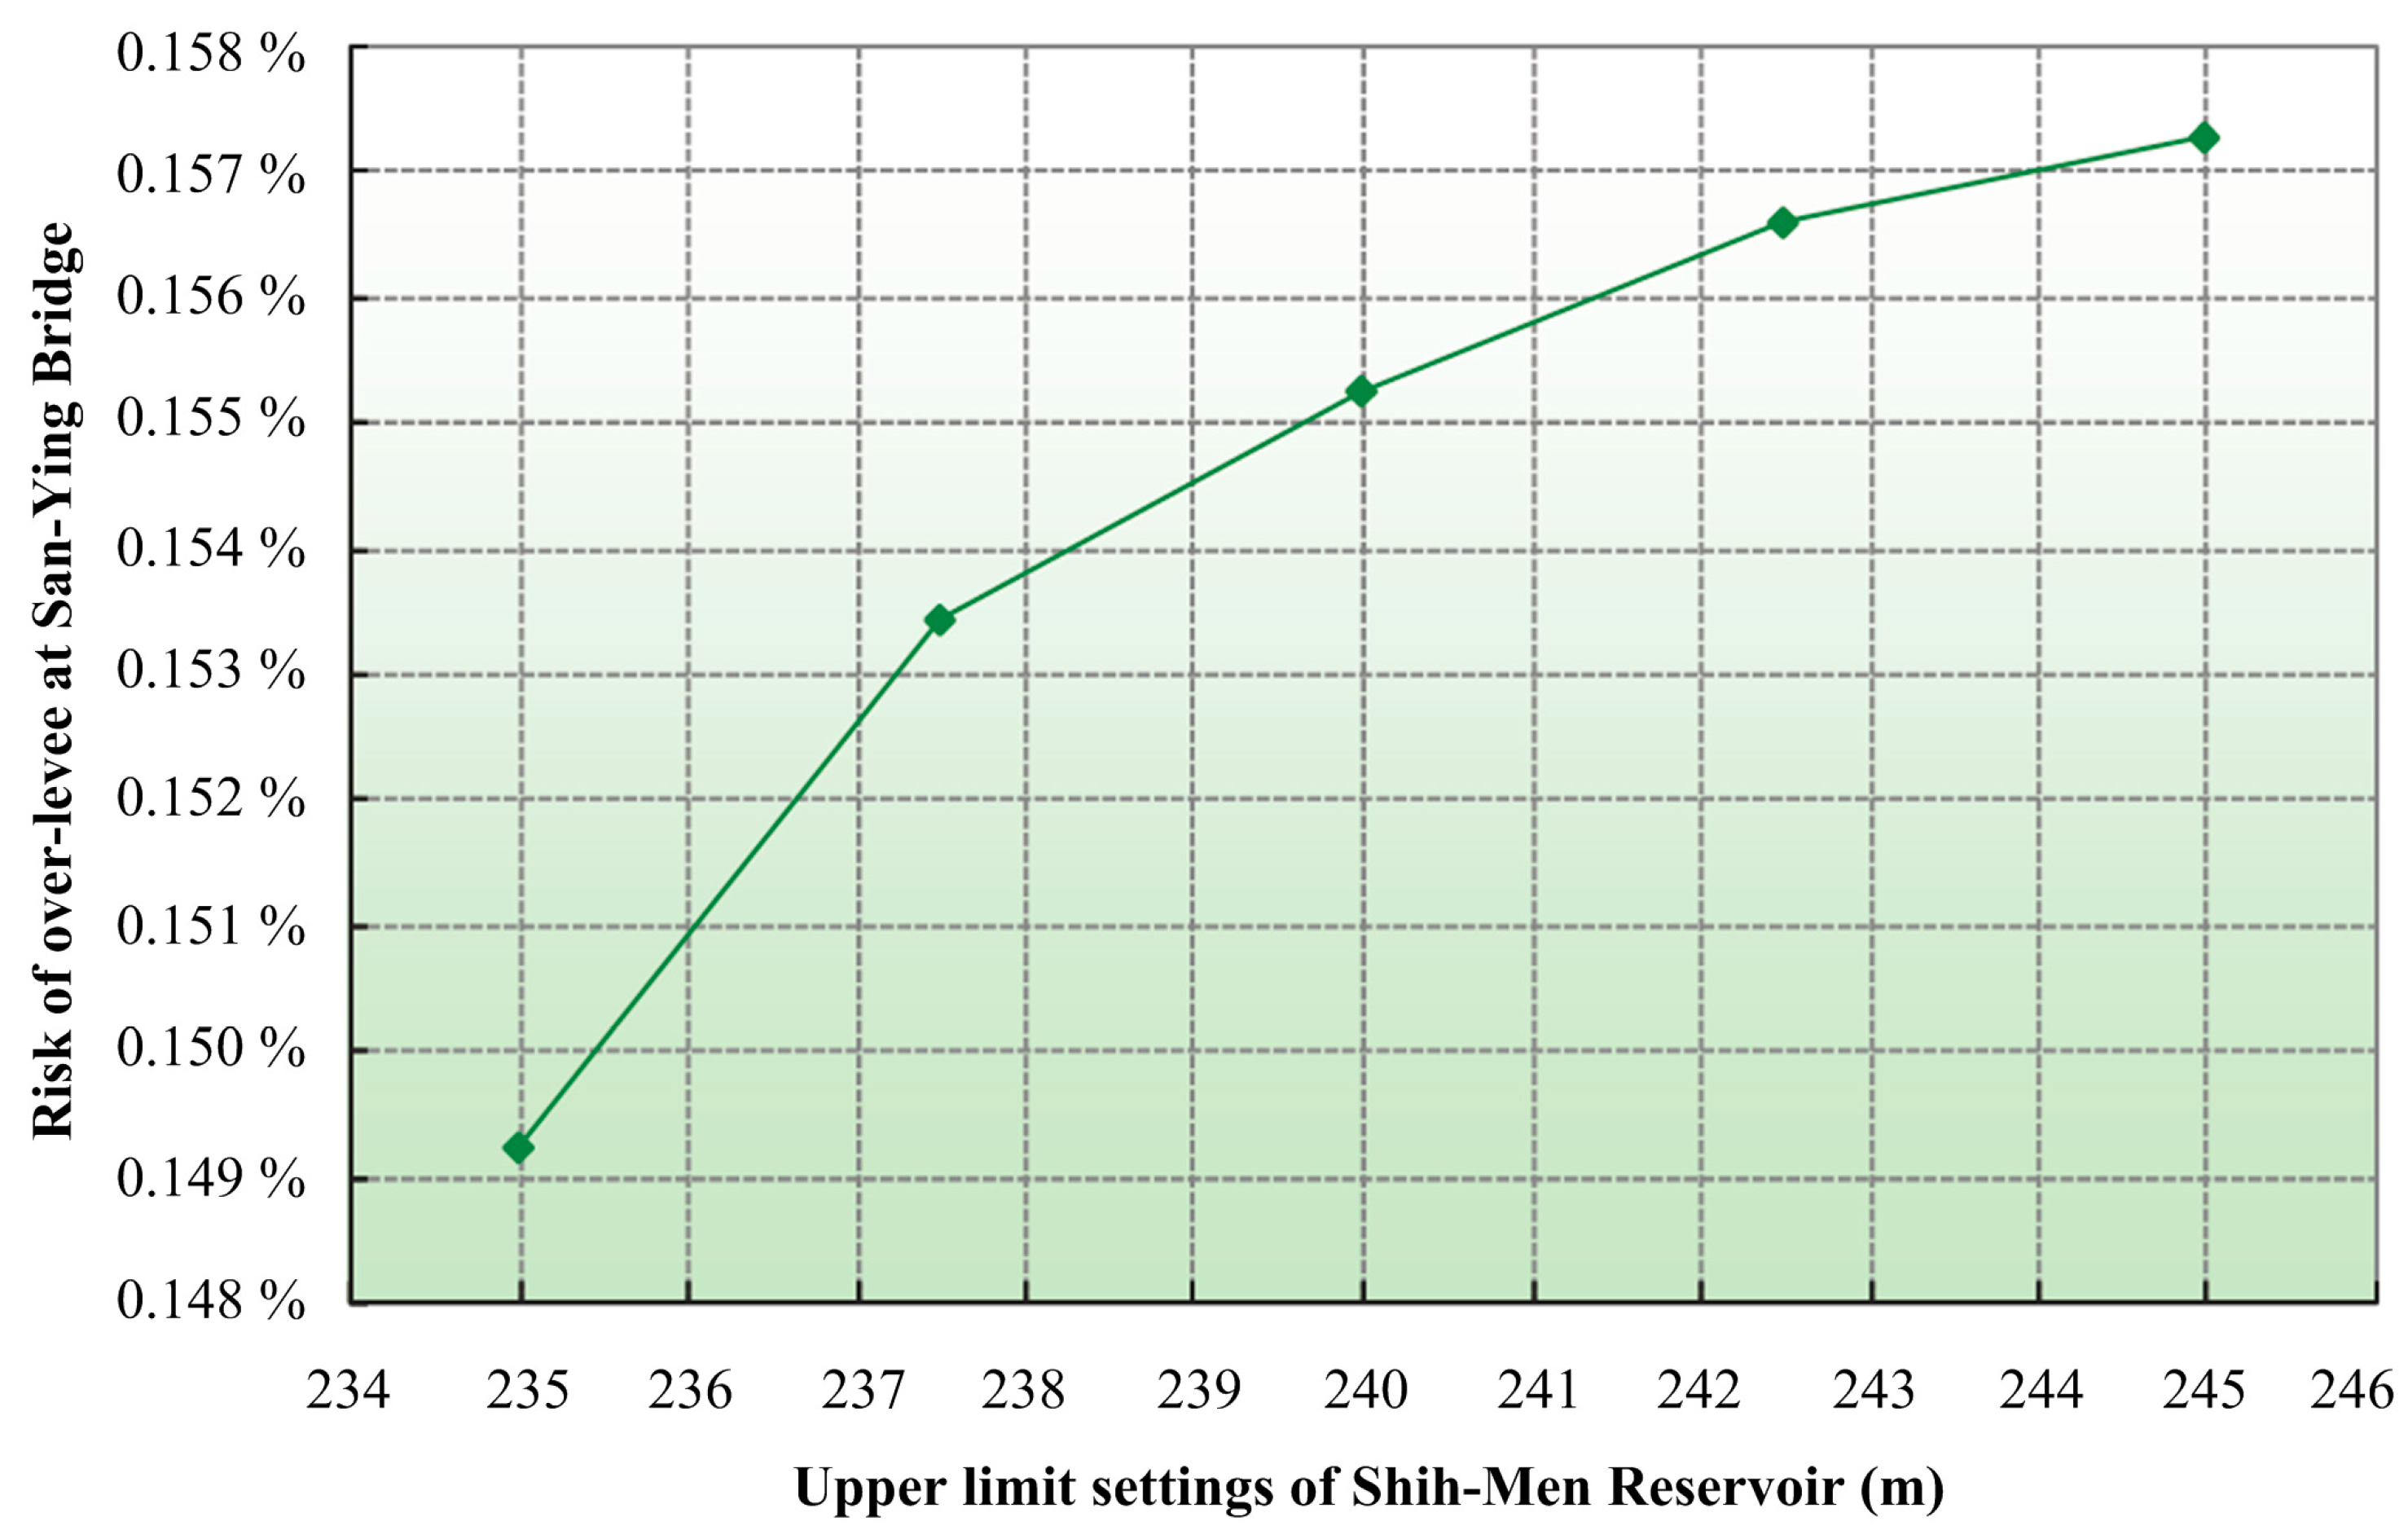
4.5.1. Over-Levee Risk during Typhoon Period

The upper limit levels for the Shih-Men Reservoir ( H m Res , UL , i.e., the target level for flood control at the final period of a typhoon and the initial level for water supply) are 245.0 m from November to January, 242.5 m at the beginning of March and at middle October, 240.0 m at the beginning of April and in the middle of September, 237.5 m at the beginning of May and in the middle of August and 235.0 m in the middle June, as shown in Figure 2. These values are selected for simulating over-levee and shortage risks. The over-levee risks during typhoon periods for different upper limit settings of the reservoir are shown in Figure 11. This figure indicates that the different upper limit levels of the reservoir have limited effects on the over-levee risk at the downstream control point. When the set upper limit of the reservoir increased from 235 to 245 m, the over-levee risk downstream of San-Ying Bridge increased accordingly, from 0.149% to 0.157%. On average, a 1-m increase in the set upper limit increases the over-levee risk by only approximately 0.0008%. This result shows that the over-levee risk for the Shih-Men Reservoir is not sensitive to different upper limit settings, because the protection standard (i.e., the return period) of the height of the constructed embankment downstream of the Da-Han Creek is greater than 200 years.

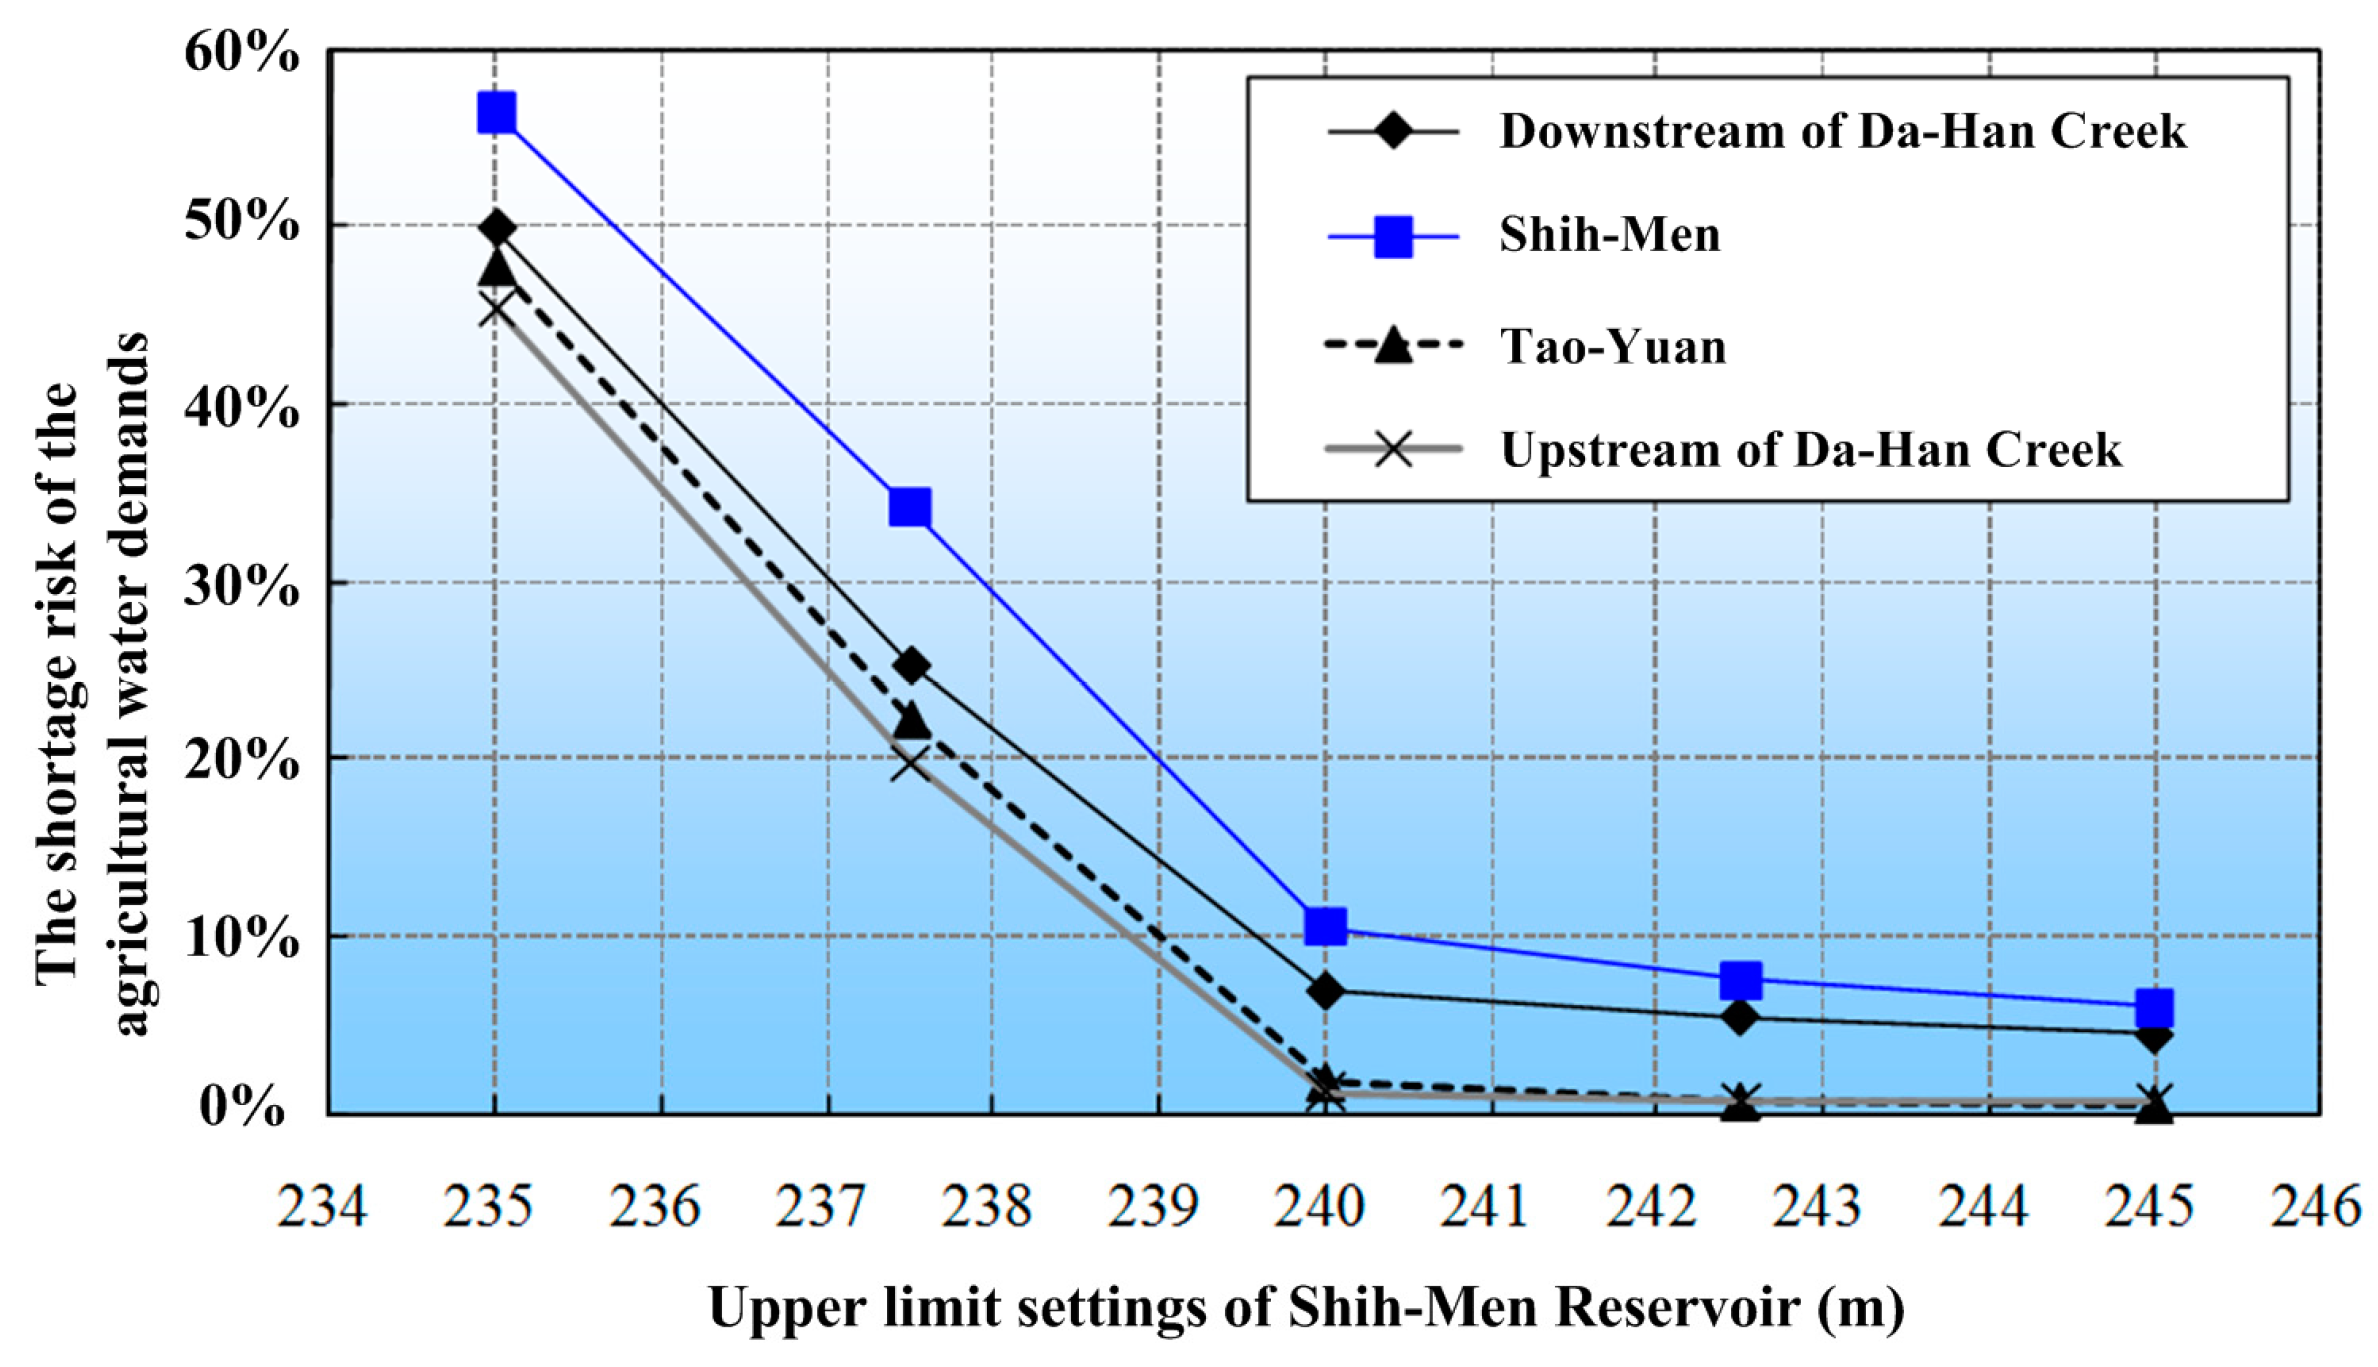
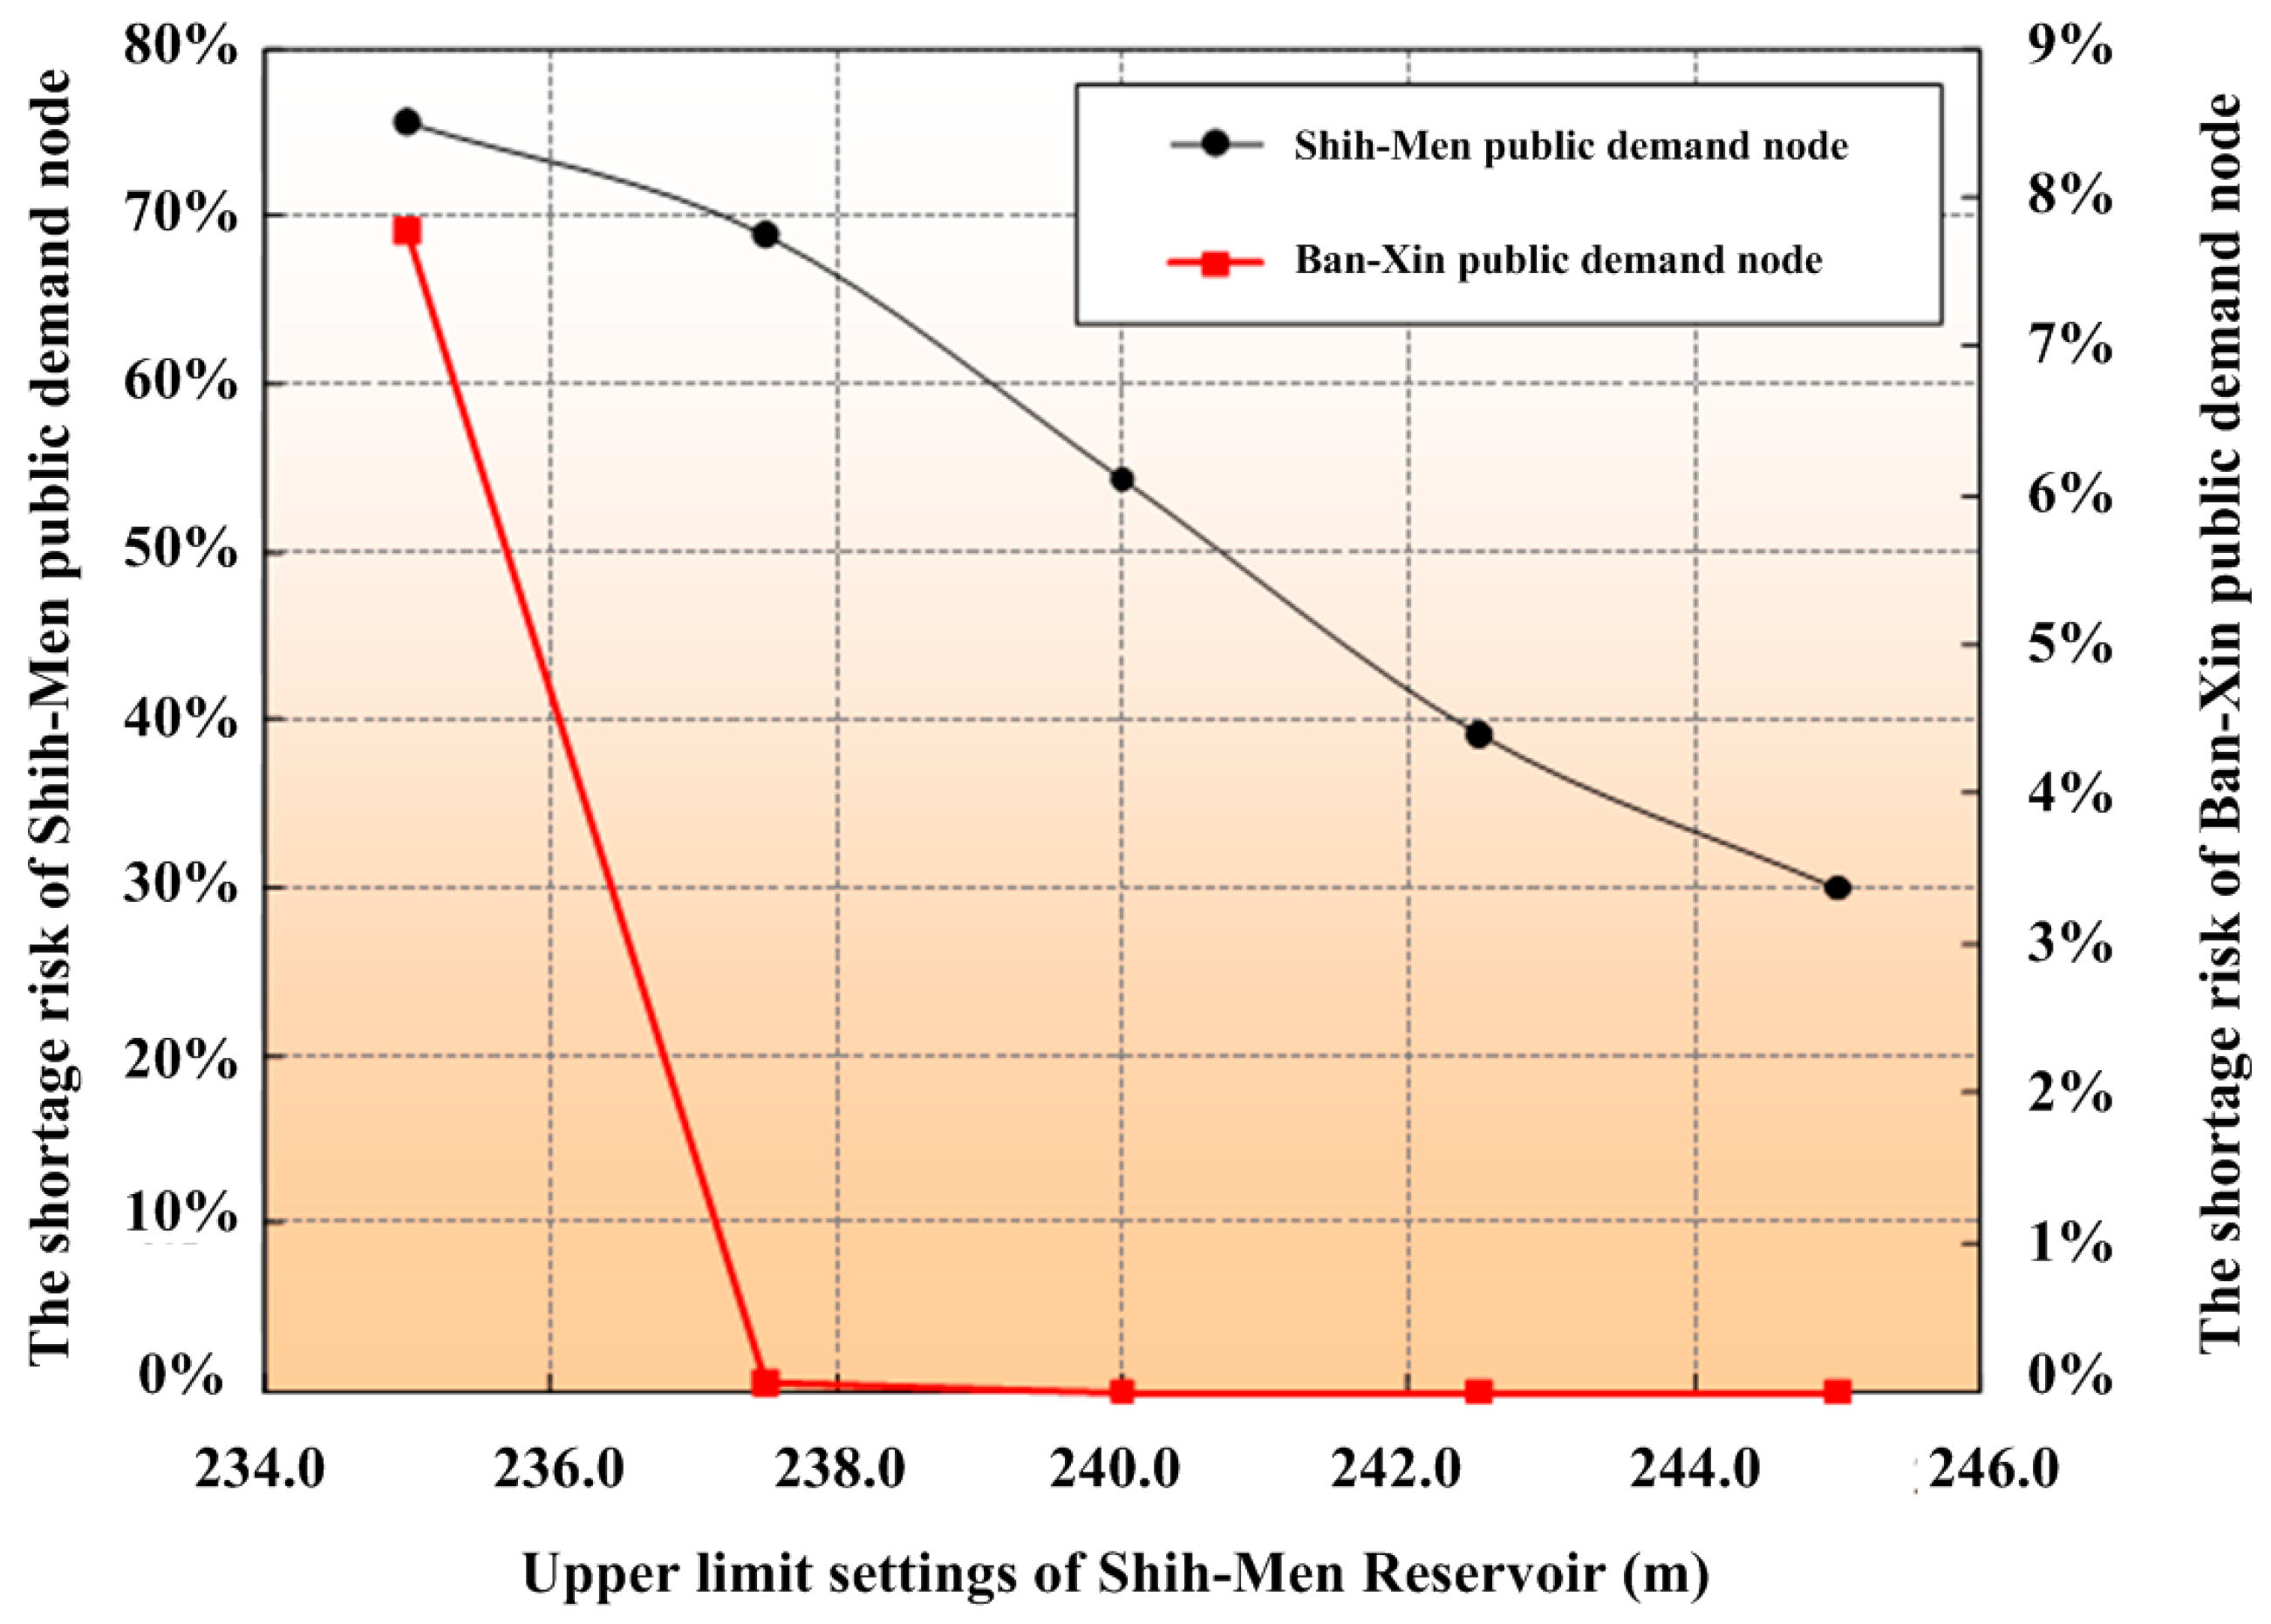
4.5.2. Shortage Risks during Drought Period

Figure 12 and Figure 13 show the shortage risks for the public and agricultural demands, respectively. Figure 12 indicates that the shortage risk to the Ban-Xin municipal demand during the drought period decreases from 7.8% to 1.19 × 10⁻⁵% with an increase in the upper limit settings of the Shih-Men Reservoir from 235 to 245 m. The shortage risk for Ban-Xin municipal demand becomes insensitive at upper limits higher than 240 m, indicating that this value represents the approximate critical storage value for ensuring sufficient water supplies. In contrast, the shortage risk for Shih-Men municipal demand decreases from 75.6% to 30.0% for a corresponding increase in the upper limits of the Shih-Men Reservoir from 235 to 245 m. This means that the shortage risk for the Shih-Men municipal demand during a drought period is consistently sensitive to decreases in the upper limit settings. The shortage risk for the Shih-Men municipal demand subsequently decreases after a stable recessional rate of 4.56% with the unit increase in the upper limit. The difference between the two curves in Figure 12 is caused by the following conditions: (1) the water demand of Shih-Men is 8.9% less than that of Ban-Xin; and (2) the threshold value of resistance for the shortage index of Shih-Men (i.e., MSI = 0.5) is larger than that for Ban-Xin (i.e., MSI = 0.09).
Figure 13 indicates that all shortage risks for the four agricultural water demand nodes of the Da-Han Creek during the drought period obviously decrease along a recessional rate of 8.8% with the unit increase of the upper limit level before it reaches 240 m. When the upper limit level is larger than 240 m, all shortage risks are lower than 10%. The shortage risks for agricultural demand for the irrigation zones of Shih-Men, downstream of Da-Han Creek, Tao-Yuan and upstream of Da-Han Creek, decrease from 56.7% to 6.2%, 49.8% to 4.1%, 47.8% to 0.26% and 45.1% to 1.4%, respectively, for a corresponding increase in the upper limits of the Shih-Men Reservoir from 235 m to 245 m. The results show that between the risk curves of the four agricultural demand nodes in Figure 13, the agricultural shortage risks upstream of the Da-Han Creek and in Tao-Yuan are respectively less than those downstream and in Shih-Men. This is because the agricultural water demand of the downstream region is 21.3% lower than that of the upstream region, and the demand of Shih-Men is 62.4% lower than that of Tao-Yuan. Hence, the water demand nodes upstream of the Da-Han Creek and in Tao-Yuan have higher priority for water supply allocation than the others, according to the same threshold value of resistance of the shortage index (i.e., MSI = 1.0).
The Shih-Men Reservoir, which is the only storage space in the system, greatly influences shortage risks with regard to the different upper limit settings. This is particularly true for the Shih-Men municipal demand. However, if the upper limit is higher than 240 m, the effect on municipal demands is strictly limited, and the effect on agriculture demands is below 10%.

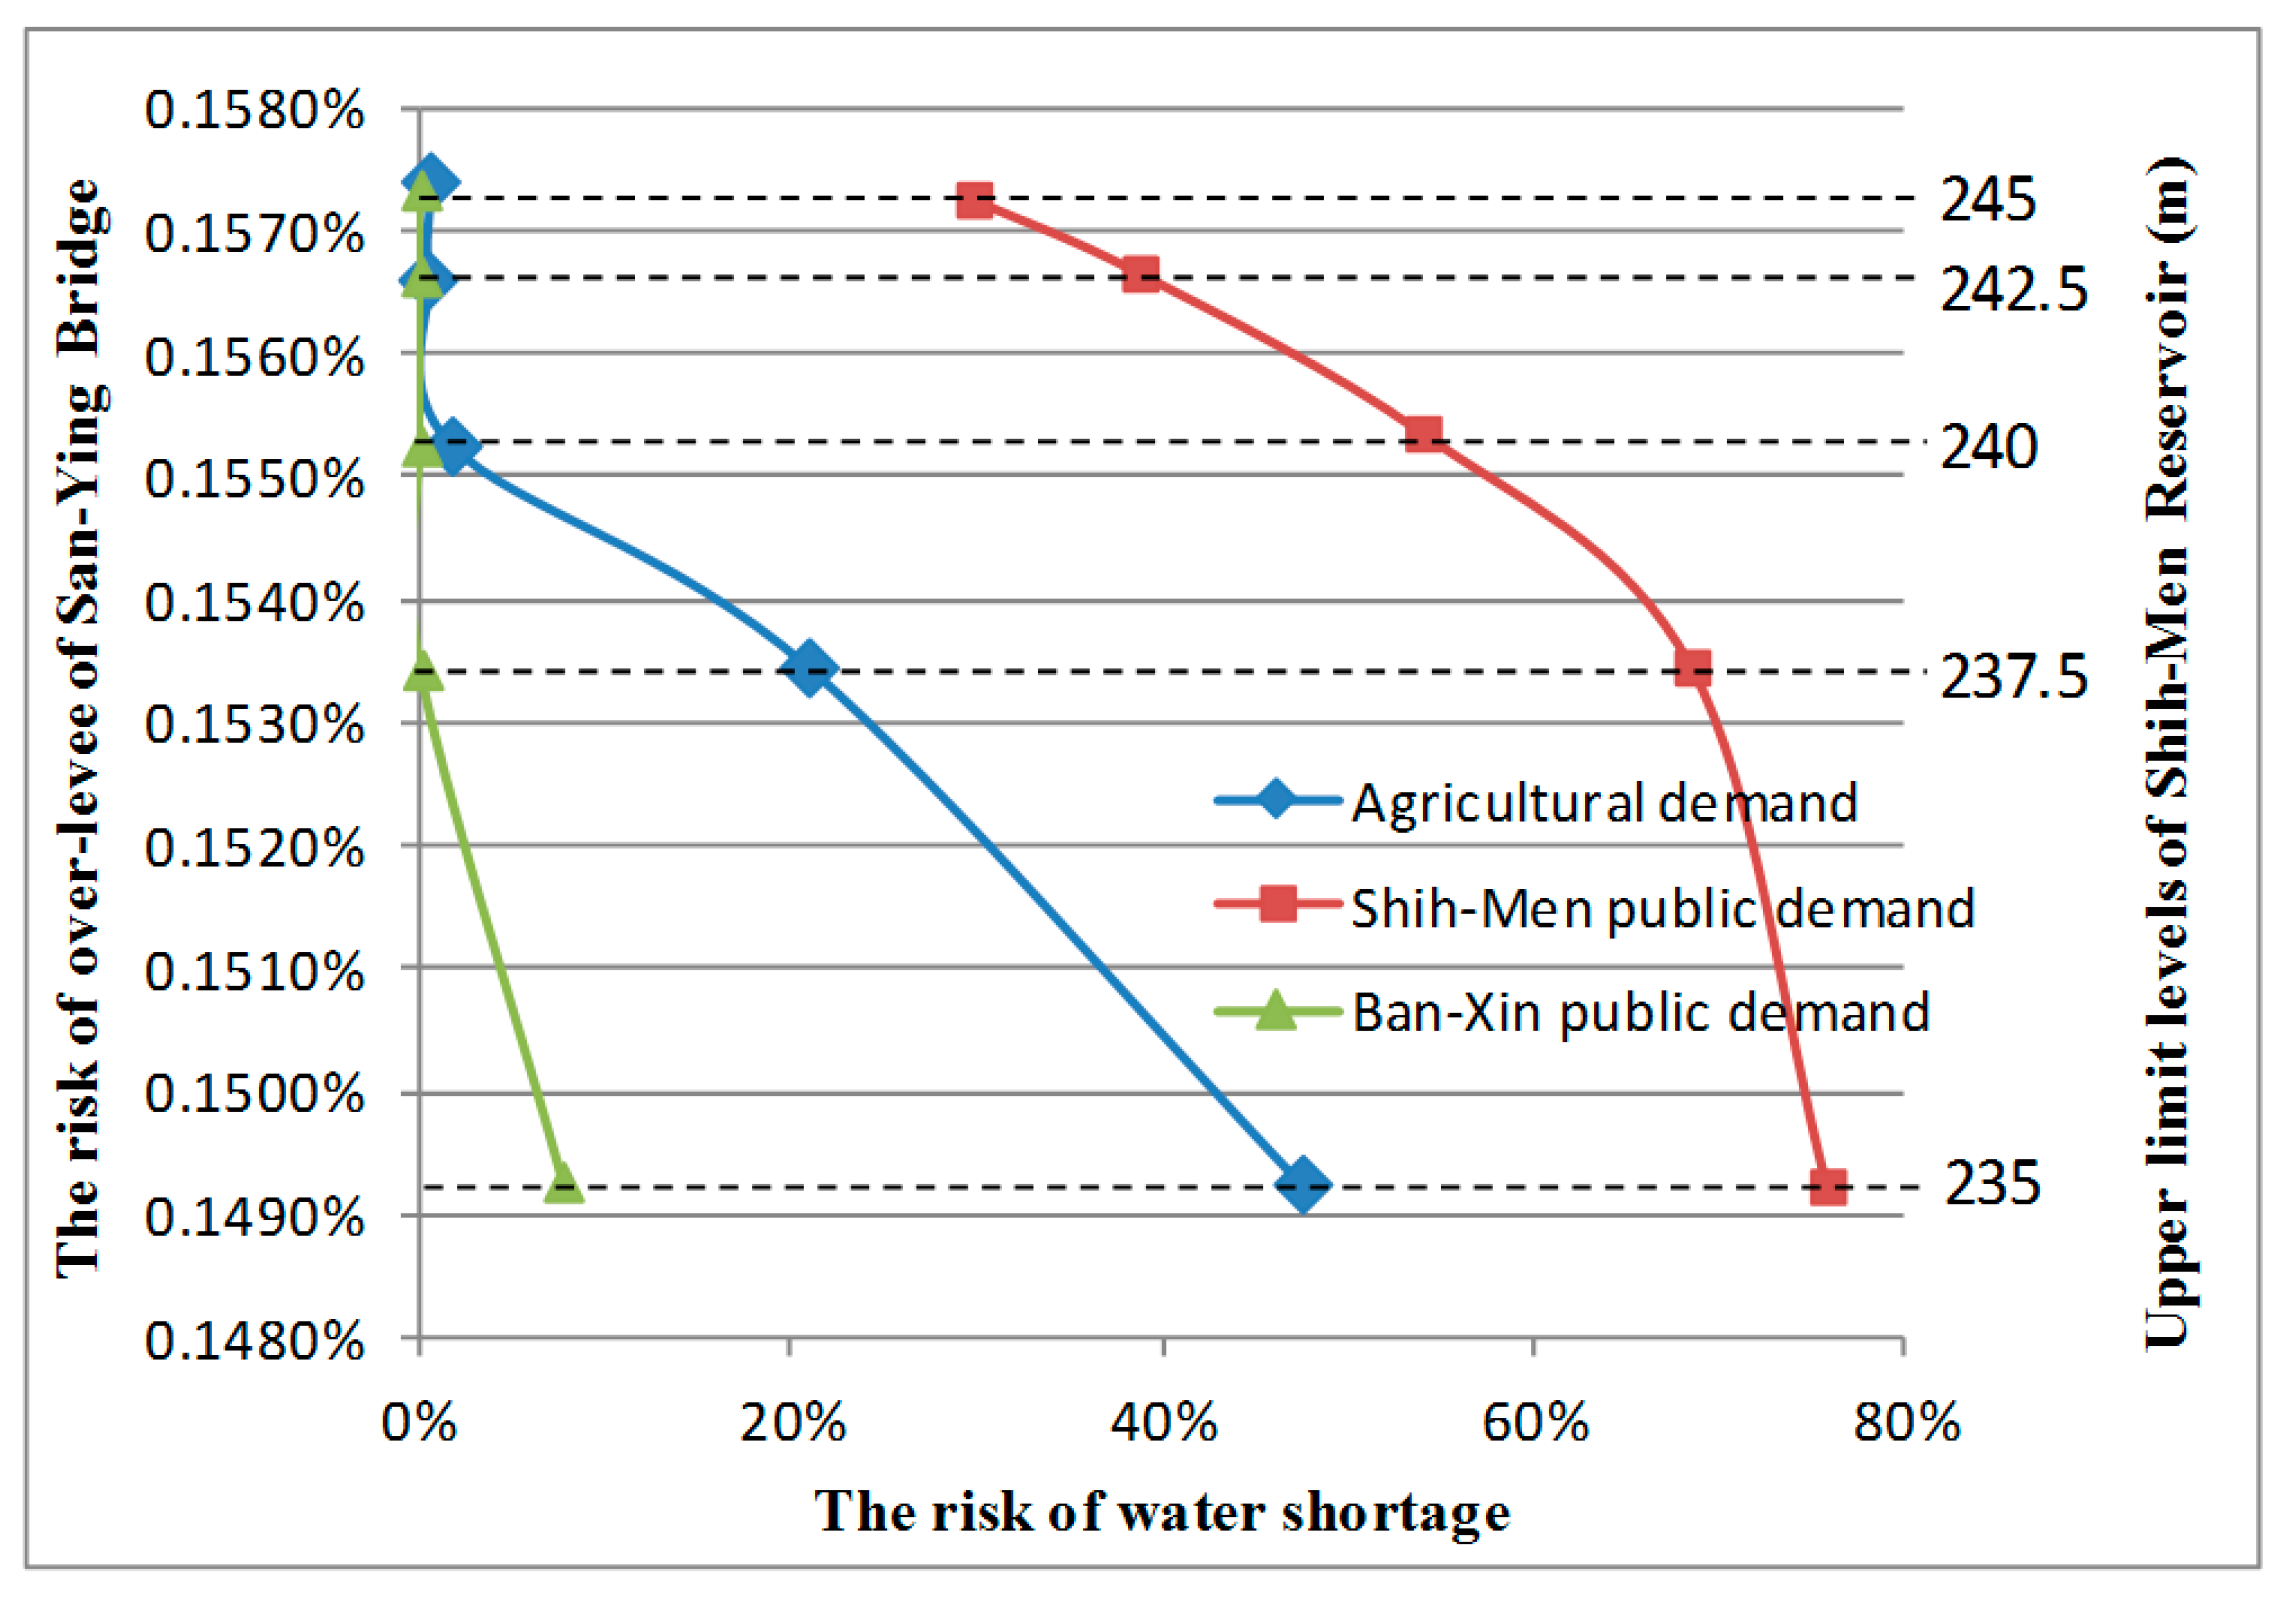
4.5.3. Comparison between Risk and Different Upper Limit Settings of the Reservoir

Figure 14 shows the over-levee risk versus the risk of agriculture demands, Shih-Men public demand and Ban-Xin public demands. As can be observed in the figure, the upper limit of the reservoir greatly influences shortages risk during a drought period, causing a huge variation (1.19 × 10⁻⁵% to 75.6%). However, it has a small effect on over-levee risk during a typhoon period, with a variation of 0.149% to 0.157%, because the constructed height standard (i.e., the return period) of the downstream embankment of the Da-Han Creek for overflow prevention is above 200 years. This means that the small storage capacity and inflow patterns of the Shih-Men Reservoir during drought periods cause extremely high shortage risks when the upper limit of the reservoir is low. Shortage during a drought period is the key point for evaluating the time-varying upper limit levels of the Shih-Men Reservoir.
Moreover, Figure 14 illustrates that the risk relationships between shortages and over-levee events for demand nodes with lower threshold values of resistance in the shortage index and higher water demand can be expressed as a concave quadratic curve. The critical upper limit of the reservoir for sufficient water supply in a drought period can be clearly identified (i.e., approximately 240 m); otherwise, it can be expressed as a convex quadratic curve, and the critical upper limit is not clear. These characteristics are caused by the trade-offs and water allocation priorities between the various types of demand nodes. In the future, the researchers can apply the proposed integrated methodology to determine the optimal upper limit sets of a reservoir and elevation of river embankment under future forecasted meteorological and hydrological scenarios.

5. Conclusions

This study proposed an integrated methodology for simultaneously estimating over-levee risks during typhoon periods and shortage risks during drought periods for different upper limit settings of hedging operation rules in the Shih-Men Reservoir. The study area is the Da-Han Creek basin, in which the most important flood control and water storage system in Taiwan is located. The actual discharge time series of the Shih-Men Reservoir during typhoons was analyzed to generate a sufficient number of representative hydrographs in MCS. Those hydrographs were then used as inputs to the flood operation optimization model for flood control. After simulating optimal reservoir operations in typhoon periods, the maximum water level downstream and corresponding over-levee risk were also calculated by an innovatively-developed BPNN model. This model was developed to reduce computational burdens and achieve automatic and rapid MCS risk evaluation. The final reservoir storage is used as the initial condition for the water allocation distribution optimization model, to estimate the shortage risk for multiple demand nodes.
This study found that the different upper limit settings for the Shih-Men Reservoir have a significant influence on changes in shortage risk during drought periods, causing huge risk variation (1.19 × 10⁻⁵% to 75.6%). This occurred because of the insufficient inflow patterns and narrow storage capacity of the Shih-Men Reservoir during drought periods, resulting in extremely high shortage risks for low upper limits. However, the upper limit settings have only a minor influence on changes to the over-levee risk during typhoon periods at the control point of the Da-Han Creek (with a variation of only 0.149% to 0.157%), because the constructed standard (i.e., the return period) height of the downstream embankment for overflow prevention is greater than 200 years. This result shows that the downstream levee is suitably designed for flood control purposes and that reservoir operation should focus more on long-term shortage management. Furthermore, the risk relationships between shortages and over-levee events for demand nodes with lower threshold values of resistance of the shortage index and higher water demands can be expressed as a concave quadratic curve. Dominated by trade-offs and water allocation priorities, the critical upper limit of reservoir water levels for sufficient water supply in drought periods can be clearly identified (i.e., approximately 240 m). The analytical results show that the integrated methodology is a powerful tool that will allow decision makers to determine the upper limits of the reservoir by simultaneously considering short-term flooding risk during typhoons and long-term water supply shortage risks. In the future, we suggest that the proposed integrated methodology be used to determine the optimal upper limit for a reservoir and the elevation of river embankments, using forecasted meteorological and hydrological scenarios.

Acknowledgments

The research reported here is supported by the Ministry of Science and Technology, Taiwan (Grant No. MOST 104-2625-M-002-024).

Author Contributions

Wen-Ming Cheng performed the model construction, experiments and analysis. Chien-Lin Huang analyzed the results and wrote the paper. Nien-Sheng Hsu conceived of and designed the models and experiments. Chih-Chiang Wei edited the paper.

Conflicts of Interest

The authors declare no conflict of interest.

References

  1. Wasimi, S.A.; Kitanidis, P.K. Real-time Forecasting and Daily Operation of a Multireservoir System during Floods by Linear Quadratic Gaussian Control. Water Resour. Res. 1983, 19, 1511–1522. [Google Scholar] [CrossRef]
  2. Unver, O.I.; Mays, L.W. Model for Real-time Optimal Flood Control Operation of a Reservoir System. Water Resour. Manag. 1990, 4, 21–46. [Google Scholar] [CrossRef]
  3. Hsu, N.S.; Wei, C.C. A Multipurpose Reservoir Real-time Operation Model for Flood Control during Typhoon Invasion. J. Hydrol. 2007, 336, 282–293. [Google Scholar] [CrossRef]
  4. Wei, C.C.; Hsu, N.S. Multireservoir Real-time Operations for Flood Control using Balanced Water Level Index Method. J. Environ. Manag. 2008, 88, 1624–1639. [Google Scholar] [CrossRef] [PubMed]
  5. Wei, C.C.; Hsu, N.S. Optimal Tree-based Release Rules for Real-time Flood Control Operations on a Multipurpose Multireservoir System. J. Hydrol. 2009, 365, 213–224. [Google Scholar] [CrossRef]
  6. Chang, L.C. Guiding Rational Reservoir Flood Operation Using Penalty-type Genetic Algorithm. J. Hydrol. 2008, 354, 65–74. [Google Scholar] [CrossRef]
  7. Hsu, N.S.; Huang, C.L.; Wei, C.C. Multi-phase Intelligent Decision Model for Reservoir Real-time Flood Control during Typhoons. J. Hydrol. 2015, 522, 11–34. [Google Scholar] [CrossRef]
  8. Hsu, N.S.; Cheng, K.W. Network Flow Optimization Model for Basin Scale Water Supply Planning. J. Water Resour. Plan. Manag. ASCE 2002, 128, 102–112. [Google Scholar] [CrossRef]
  9. Hsu, N.S.; Cheng, W.C.; Cheng, W.M.; Wei, C.C.; Yeh, W.W.G. Optimization and Capacity Expansion of a Water Distribution System. Adv. Water Resour. 2008, 31, 776–786. [Google Scholar] [CrossRef]
  10. Sadati, S.K.; Speelman, S.; Sabouhi, M.; Gitizadeh, M.; Ghahraman, B. Optimal Irrigation Water Allocation Using a Genetic Algorithm under Various Weather Conditions. Water 2014, 6, 3068–3084. [Google Scholar] [CrossRef]
  11. Bekri, E.; Disse, M.; Yannopoulos, P. Optimizing Water Allocation under Uncertain System Conditions for Water and Agriculture Future Scenarios in Alfeios River Basin (Greece)—Part B: Fuzzy-Boundary Intervals Combined with Multi-Stage Stochastic Programming Model. Water 2015, 7, 6427–6466. [Google Scholar] [CrossRef]
  12. Levin, O. Optimal Control of a Storage Reservoir during a Flood Season. Automatica 1969, 5, 27–34. [Google Scholar] [CrossRef]
  13. Tu, M.Y.; Hsu, N.S.; Yeh, W.W.G. Optimization of Reservoir Management and Operation with Hedging Rules. J. Water Resour. Plan. Manag. ASCE 2003, 129, 86–97. [Google Scholar] [CrossRef]
  14. Ahmadi, A.; Karamouz, M.; Moridi, A. Robust Methods for Identifying Optimal Reservoir Operation Strategies using Deterministic and Stochastic Formulations. Water Resour. Manag. 2010, 24, 2527–2552. [Google Scholar] [CrossRef]
  15. Schardong, A.; Simonovic, S.P. Coupled Self-adaptive Multiobjective Differential Evolution and Network Flow Algorithm Approach for Optimal Reservoir Operation. J. Water Resour. Plan. Manag. 2015, 141, 04015015. [Google Scholar] [CrossRef]
  16. Hu, T.; Zhang, X.Z.; Zeng, X.; Wang, J.A. Two-Step Approach for Analytical Optimal Hedging with Two Triggers. Water 2016, 8, 52. [Google Scholar] [CrossRef]
  17. Ji, Y.; Lei, X.; Cai, S.; Wang, X. Hedging Rules for Water Supply Reservoir Based on the Model of Simulation and Optimization. Water 2016, 8, 249. [Google Scholar] [CrossRef]
  18. Su, M.D.; Kang, J.L.; Chang, L.F.; Chen, A.S. A grid-based GIS approach to regional flood damage assessment. J. Mar. Sci. Technol. 2005, 13, 184–192. [Google Scholar]
  19. Suiadee, W.; Tingsanchali, T. A combined simulation–Genetic algorithm optimization model for optimal rule curves of a reservoir: A case study of the Nam Oon Irrigation Project, Thailand. Hydrol. Process. 2007, 21, 3211–3225. [Google Scholar] [CrossRef]
  20. Voisin, N.; Li, H.; Ward, D.; Huang, M.; Wigmosta, M.; Leung, L.R. On an improved sub-regional water resources management representation for integration into earth system models. Hydrol. Earth Syst. Sci. 2013, 17, 3605–3622. [Google Scholar] [CrossRef]
  21. Mateo, C.M.; Hanasaki, N.; Komori, D.; Tanaka, K.; Kiguchi, M.; Champathong, A.; Oki, T. Assessing the impacts of reservoir operation to floodplain inundation by combining hydrological, reservoir management, and hydrodynamic models. Water Resour. Res. 2014, 50, 7245–7266. [Google Scholar] [CrossRef]
  22. Wood, E.A. An Analysis of Flood Levee Reliability. Water Resour. Res. 1977, 13, 665–671. [Google Scholar] [CrossRef]
  23. Kuo, J.T.; Yen, B.C.; Hsu, Y.C.; Lin, H.F. Risk Analysis for Dam Overtopping—Feitsui Reservoir as a Case Study. J. Hydraul. Eng. 2007, 133, 955–963. [Google Scholar] [CrossRef]
  24. Paik, K. Analytical Derivation of Reservoir Routing and Hydrological Risk Evaluation of Detention Basins. J. Hydrol. 2008, 352, 191–201. [Google Scholar] [CrossRef]
  25. Klemes, V. Reliability of Water Supply Performed by Means of a Storage Reservoir within a Limited Period of Time. J. Hydrol. 1967, 5, 70–92. [Google Scholar] [CrossRef]
  26. Klemes, V. Reliability Estimates for a Storage Reservoir with Seasonal Input. J. Hydrol. 1969, 7, 198–216. [Google Scholar] [CrossRef]
  27. Wurbs, R.A. Modeling River/Reservoir System Management, Water Allocation, and Supply Reliability. J. Hydrol. 2005, 300, 100–113. [Google Scholar] [CrossRef]
  28. Yamout, G.M.; Hatfield, K.; Romeijn, H.E. Comparison of New Conditional Value-At-Risk-Based Management Models for Optimal Allocation of Uncertain water supplies. Water Resour. Res. 2007, 43. [Google Scholar] [CrossRef]
  29. Higgins, A.; Archer, A.; Hajkowicz, S. A Stochastic Non-linear Programming Model for a Multi-period Water Resource Allocation with Multiple Objectives. Water Resour. Manag. 2008, 22, 1445. [Google Scholar] [CrossRef]
  30. Kuo, C.L.; Hsu, N.S. An Optimization Model for Crucial Key Pipes and Mechanical Reliability: A Case Study on a Water Distribution System in Taiwan. Water Resour. Manag. 2011, 25, 763–775. [Google Scholar] [CrossRef]
  31. Chow, V.T.; Maidment, D.R.; Mays, L.W. Applied Hydrology; McGraw-Hill: New York, NY, USA, 1988; pp. 394–398. [Google Scholar]
  32. Panda, R.K.; Pramanik, N.; Bala, B. Simulation of River Stage Using Artificial Neural Network and MIKE 11 Hydrodynamic Model. Comput. Geosci. 2010, 36, 735–745. [Google Scholar] [CrossRef]
  33. Huang, C.L.; Hsu, N.S.; Wei, C.C.; Luo, W.J. Optimal Spatial Design of Capacity and Quantity of Rainwater Harvesting Systems for Urban Flood Mitigation. Water 2015, 7, 5173–5202. [Google Scholar] [CrossRef]
  34. Shiau, J.T.; Lee, H.C. Derivation of Optimal Hedging Rules for a Water-Supply Reservoir through Compromise Programming. Water Res. Manag. 2005, 19, 111–132. [Google Scholar] [CrossRef]
  35. Shiau, J.T. Water Release Policy Effects on the Shortage Characteristics for the Shihmen Reservoir System during Droughts. Water Res. Manag. 2003, 17, 463–480. [Google Scholar] [CrossRef]
  36. Vose, D. Risk Analysis: A Quantitative Guide; John Wiley & Sons: New York, NY, USA, 2008. [Google Scholar]
  37. Bertoli, L.; Moisello, U. A Regional Model for Estimating the Probability Distribution of Routed Peak Discharges. J. Hydrol. 1993, 153, 103–138. [Google Scholar] [CrossRef]
  38. Hsu, N.S.; Huang, C.L.; Wei, C.C. Real-time Forecast of Reservoir Inflow Hydrographs Incorporating Terrain and Monsoon Effects during Typhoon Invasion by Novel Intelligent Numerical-statistic Impulse Techniques. J. Hydrol. Eng. 2015, 20, 04015019. [Google Scholar] [CrossRef]
  39. Rosenblatt, F. The perceptron: A probabilistic model for information storage and organization in the brain. Psychol. Rev. 1958, 65, 386–408. [Google Scholar] [CrossRef] [PubMed]
  40. Rumelhart, D.E.; McClelland, J.L. Parallel Distributed Processing: Explorations in the Microstructure of Cognition; MIT Press: Cambridge, MA, USA, 1986. [Google Scholar]
  41. Eisel, L.M. Risk/Benefit Analysis in Water Resources Planning and Management; Haimes, Y.Y., Ed.; Springer: Pacific Grove, CA, USA, 1981; Chapter 1; pp. 5–11. [Google Scholar]
  42. Tung, Y.K.; Yen, B.C. Hydrosystems Engineering Reliability Assessment and Risk Analysis; McGraw-Hill: New York, NY, USA, 2005; pp. 7.1–7.55. [Google Scholar]
  43. Chang, K.-T.; Chiang, S.-H.; Lei, F. Analysing the Relationship between Typhoon-Triggered Landslides and Critical Rainfall Conditions. Earth Surf. Process. Landf. 2008, 33, 1261–1271. [Google Scholar] [CrossRef]
  44. Tsai, A.Y.; Huang, W.C. Impact of Climate Change on Water Resources in Taiwan. Terr. Atmos. Ocean. Sci. 2011, 22, 507–519. [Google Scholar] [CrossRef]
Figure 1. Map of the study area at Da-Han Creek basin.
Water 09 00424 g001
Figure 2. Hedging rule curves and characteristic elevations of Shih-Men Reservoir water surface level (WSL).
Water 09 00424 g002
Figure 3. Water supply system for Da-Han Creek.
Water 09 00424 g003
Figure 4. Flowchart of the proposed methodology.
Water 09 00424 g004
Figure 5. Structure of the back-propagation neural network (BPNN) for water level simulation at a downstream control point.
Water 09 00424 g005
Figure 6. Values of RMSE for various probability functions for peak inflow (qp) of Shih-Men Reservoir.
Water 09 00424 g006
Figure 7. Values of RMSE for various probability functions for time to peak inflow (tp) of Shih-Men Reservoir.
Water 09 00424 g007
Figure 8. Probability plot of peak inflow (qp) of Shih-Men Reservoir for the Pearson Type III distribution.
Water 09 00424 g008
Figure 9. Probability plot of time to peak inflow (tp) for Shih-Men Reservoir for the log-Pearson Type III distribution.
Water 09 00424 g009
Figure 10. Relationships between simulated and observed water levels at San-Ying Bridge during the construction process of the BPNN-based model: (a) single-moment training; (b) single-moment validation; and (c) complete-event verification.
Water 09 00424 g010aWater 09 00424 g010b
Figure 11. Over-levee risk analysis of San-Ying Bridge in a typhoon period for different upper limit settings of Shih-Men Reservoir.
Water 09 00424 g011
Figure 12. Shortage risk analysis during drought periods for different upper limit settings of Shih-Men Reservoir: public demand.
Water 09 00424 g012
Figure 13. Shortage risk analysis in drought periods for different upper limit settings of Shih-Men Reservoir: agricultural demand.
Water 09 00424 g013
Figure 14. Risk relationship between shortages of each kind of demand node in a drought period and over-levee risk of San-Ying Bridge in a typhoon period for different upper limit levels of Shih-Men Reservoir.
Water 09 00424 g014
Table 1. Adopted typhoon events for construction of the BPNN-based water level simulation model.
Stage of Model ConstructionStarting Time (Day/Month/Year)Name of TyphoonDuration (h)Peak Inflow (m3/s)Return Period of Peak Inflow (y)
Single-moment training and validation30 July 1996Herb104636315.4
17 August 1997Winnie8034115.3
28 August 1997Amber8413512.4
26 September 1998Yanni1204861.5
3 October 1998Flood1448101.7
15 October 1998Zeb9646438.7
23 October 1998Babs1203281.2
8 July 2000Kai-Tak723931.3
22 August 2000Bilis6022304.3
28 August 2000Prapiroon728371.9
10 September 2000Bopha722571.0
31 October 2000Xangsane7218523.6
15 September 2001Nari11741236.6
23 September 2001Lekima16815052.7
15 October 2001Haiyan726621.6
9 July 2002Nakri483171.1
5 September 2002Sinlaku684091.4
2 July 2004Mindulle482761.1
11 August 2004Rananim4812082.2
23 August 2004Aere93859438.5
Single-moment validation and complete-event verification11 September 2004Haima6416373.2
24 October 2004Nock-ten579582.0
3 December 2004Nanmadol443351.3
Table 2. Optimal probability distribution coefficients for the inflow hydrograph for Shih-Men Reservoir.
Probability Distribution ParametersPeak Inflow (qp)Time to Peak Inflow (tp)
Average1869 (m3/s)46.90 (h)
Standard deviation2180 (m3/s)15.12 (h)
Coefficient of skewness1.910.93
Modified coefficient of skewness2.801.38
Best probability distributionPT3’LPT3’
RMSE297.48 (m3/s)2.66 (h)
Correlation coefficient of probability plotting0.9940.987
Coefficient b0.53/8

