Article

Successes of Restoration and Its Effect on the Fish Community in a Freshwater Tidal Embayment of the Potomac River, USA

1
Department of Environmental Science & Policy, George Mason University, 4400 University Dr., Fairfax, VA 22030, USA
2
Environmental Consulting & Technology. Inc., Ann Arbor, MI 48105, USA
*
Author to whom correspondence should be addressed.
Water 2017, 9(6), 421; https://doi.org/10.3390/w9060421
Submission received: 10 April 2017 / Revised: 8 June 2017 / Accepted: 9 June 2017 / Published: 11 June 2017

Abstract

:
After a local wastewater treatment plant significantly reduced phosphorus loading into a phytoplankton-dominated tributary of the Potomac River in the early 1980s, water quality and biological communities were monitored bi-weekly from April to September. After a 10-year time-lag, submerged aquatic vegetation (SAV), once abundant in this freshwater tidal embayment, returned to the area in 1993. After additional reductions in nitrogen load starting in 2000, the system switched to an SAV-dominated state in 2005. Fish abundance did not change during these distinct phase changes, but the fish community structure did. Increases in SAV provided refuge and additional spawning substrate for species with adhesive eggs such as Banded Killifish (Fundulus diaphanus), which is now the most abundant species in the embayment. Other changes observed were a decrease in the relative contribution of open water dwelling species such as White Perch (Morone americana), and an increase of visual predators such as Largemouth Bass (Micropterus salmoides). The 30-year record of data from this Potomac River tributary has revealed important long-term trends that validate the effectiveness of initiatives to reduce excess nutrient inputs, and will aid in the continued management of the watershed and point-source inputs.

1. Introduction

Estuarine and tidal freshwater ecosystems are often sites that receive treated wastewater, which has historically resulted in the eutrophication of many valuable habitat areas [1]. Eutrophication impacts include water quality impairment, harmful algal blooms (HABs), expansive hypoxic zones, alteration of food webs, alternation in the composition of fish communities and population dynamics, and the degradation of essential fish habitats [1,2,3,4,5]. In many estuaries, including Chesapeake Bay and its tributaries, the most common result of eutrophication is an increase in phytoplankton biomass and a decrease in water clarity [5]. When nutrient loading is persistent and pervasive the ecosystem can become hyper-eutrophic, an advanced state of nutrient loading, most commonly resulting in frequent and persistent HABs [6]. Decreases in water clarity related to eutrophication can reduce or prevent the growth of submerged aquatic vegetation (SAV) [1,4,5]. Much of the Chesapeake Bay, including the Potomac River, had shifted from benthic to pelagic primary productivity in the mid-1900s due to eutrophication [5]. The loss of expansive SAV beds due to eutrophication, as seen in the Potomac River after the 1930s, can be particularly problematic in shallow freshwater ecosystems because of the loss of buffering services provided by the vegetation, which, when not impaired, assimilates N and reduces turbidity by collecting particulate organic materials [5,7,8,9]. In the Potomac River, the largest tributary to the Chesapeake Bay, extensive eutrophication was dominant until the 1970s, when active reductions in point-source P and N loadings in wastewater treatment were made [5,9].
After reductions were initiated, notable decreases in the frequency of seasonal HABs and algal biomass as well as increases in water clarity were apparent in the early 1990s [5,9]. However, the immediate responses of SAV were not as prevalent. In the Potomac River, SAV exhibited a hysteretic or a delayed non-linear feedback, before responding with expansive growth to increases in water clarity and overall quality in the mid-2000s. In Gunston Cove, a small tributary of the Potomac River, the changes in SAV cover were not gradual, and exhibited clear ‘tipping points’ at two times during the recovery, during which a small increase in water clarity resulted in rapid expansion of SAV [10]. These re-emerged SAV beds potentially created new habitat areas for fish at different stages of their life history [5,9].
This study looks into the effects of stepwise changes in SAV cover on the local fish community over the period of 1985–2011 that took place in Gunston Cove, Virginia, which is an embayment of the Potomac River. This embayment receives the effluent of the Noman M. Cole, Jr. Pollution Control Plant that reduced phosphorus load over 85% in 1980, followed by a 75% nitrogen load reduction in 2000 [11]. While the history and management implications will be discussed in future manuscripts, this study is specifically focused on effects of these steady state shifts on the fish community in the embayment. We address how a shift from a phytoplankton-dominated state to an SAV-dominated state affects fish abundance and community structure in a freshwater tidal embayment.

2. Materials and Methods

2.1. Description of the Study Site

Gunston Cove (Figure 1) is a shallow tidal freshwater embayment, about 580 ha in size, formed by the confluence of Pohick Creek and Accotink Creek [12,13]. The cove is located just off the main stem of the Potomac River, 20 km south of Washington, D.C. Predictable seasonal variations in temperature and flow [14] make Gunston Cove a vital area for fish spawning and juvenile development. Surveys conducted in Gunston Cove in the early 1900s indicated the presence of large expanses of SAV in its shallow waters [7,8]. During this time, Gunston Cove was used extensively for recreational and commercial fishing, including seine fisheries targeting river herring [15]. However, water quality in Gunston Cove became notably poor by the 1930s, with surveys indicating a state shift to a degraded condition occurred, characterized by no SAV growth, poor water clarity, and high phytoplankton density [7,8,14]. According to Carter et al. [7], SAV taxa that were lost included Curly Pondweed (Potamogeton crispus, introduced in the early 1800s), Coontail (Ceratophyllum demersum, native), and Wild Celery (Vallisneria Americana, native). Degraded water quality, preventing SAV growth, was believed to be largely caused by two sources: urbanization and pollution from wastewater treatment plants in the watershed [15].
Since surveys conducted in the 1970s, which still reported a degraded, phytoplankton-dominated system [15], Gunston Cove has undergone many ecological changes over the course of several decades, contributing to the overall improvement of health and water quality. The loss of SAV was determined to be caused by high nutrient loadings contributing to reduced water quality and a lack of light penetration, which persisted in the cove’s waters during the 1980s [12]. Reductions in point-source nutrient loadings from wastewater effluent began in the late 1970s, and were followed by subsequent improvements in overall water quality [14]. Responses in vegetation during this time were not significant [14]. Recently, however, there was a substantial resurgence of once dominant SAV which became noticeable in 2005 [16] and has continued since. The recovered SAV community has a new invasive species, Hydrilla verticillata. While Hydrilla is the most abundant species, it has not stopped the recovery of native species; Coontail is widespread and common, and Wild Celery, Water Stargrass, and native pondweeds are also common. All these species are submerged, not floating-leaved. Overall, the recovered SAV community is expected to function very similar to the lost community regarding faunal utilization.

2.2. Methods

Fish samples were collected using a 15.24 m long, 1.22 m high seine net made of knotted nylon with a 6.35 mm square mesh. Seining was performed at sites A, B, C, and D (Figure 1) with one seine haul every other week from mid-April to mid-September from 1985–2011, resulting in 10 hauls per site per year. The seining procedure was standardized as much as possible. The net was stretched out perpendicular to the shore with the shore end right at the water’s edge. The net was then pulled parallel to the shore for a distance of 30 m by a worker at each end moving at a slow walk. At the end of the prescribed distance, the offshore end of the net was swung in an arc to the shore and the net was pulled up on the beach to trap the fish. Fish were counted, measured (standard length and total length), identified, and returned. All fish procedures were approved by the animal use committee of George Mason University (IACUC protocol 0194).
Water samples were collected for Chlorophyll a analysis from 1994–2011 semi-monthly from mid-April to Mid-September at site E (Figure 1), resulting in 10 samples per year. Chlorophyll a was determined by filtration through 0.45 um membrane filters followed by extraction in DMSO-acetone and fluorometry [9]. Secchi Depth was measured each trip at site E from 1994–2011, and the average of readings taken by at least two crewmembers was noted. Aerial imaging data for Chesapeake Bay SAV was collected by the United States Geological Survey (USGS) in collaboration with the Virginia Institute of Marine Science (VIMS) from 1984–2011 (http://web.vims.edu/bio/sav/gis_data.html).

2.3. Analyses

The aerial photography of Gunston Cove was accessed online as .e00 ArcInfo files for years 1984–2009 and ArcGIS .shp files for years 2010–2011 (http://web.vims.edu/bio/sav/gis_data.html). Within the ArcMap 10.3.1 software, the .e00 files were converted to .shp files using the provided conversion tools. After importing the SAV aerial imaging data files into ArcMap, the total SAV bed areas for Gunston Cove were determined for each year using the field calculator function in the attributes table. For the years 2001 and 2011, aerial imaging was not conducted at Gunston Cove in the VIMS and USGS surveys.
Based on SAV acreage, which displayed three distinct phases of cover, the years of fish data were divided in three groups; the years without SAV cover (‘no’ cover), the years with ‘medium’ SAV cover, and the years with ‘high’ SAV cover. An ANOVA was used to test for significant differences between the total abundance of fishes of these three times periods (1985–1992, 1993–2004, and 2005–2011) using SAS (v 9.4). The fish community structure based on abundance of these three time periods was compared using an analysis of similarity (ANOSIM). We used a similarity percentages analysis (SIMPER) to determine which species were mostly responsible for the differences between the community structures of the three time periods. The between-year community structure differences were visualized using non-metric multidimensional scaling. These non-parametric analyses were performed in PRIMER v6 [17].

3. Results

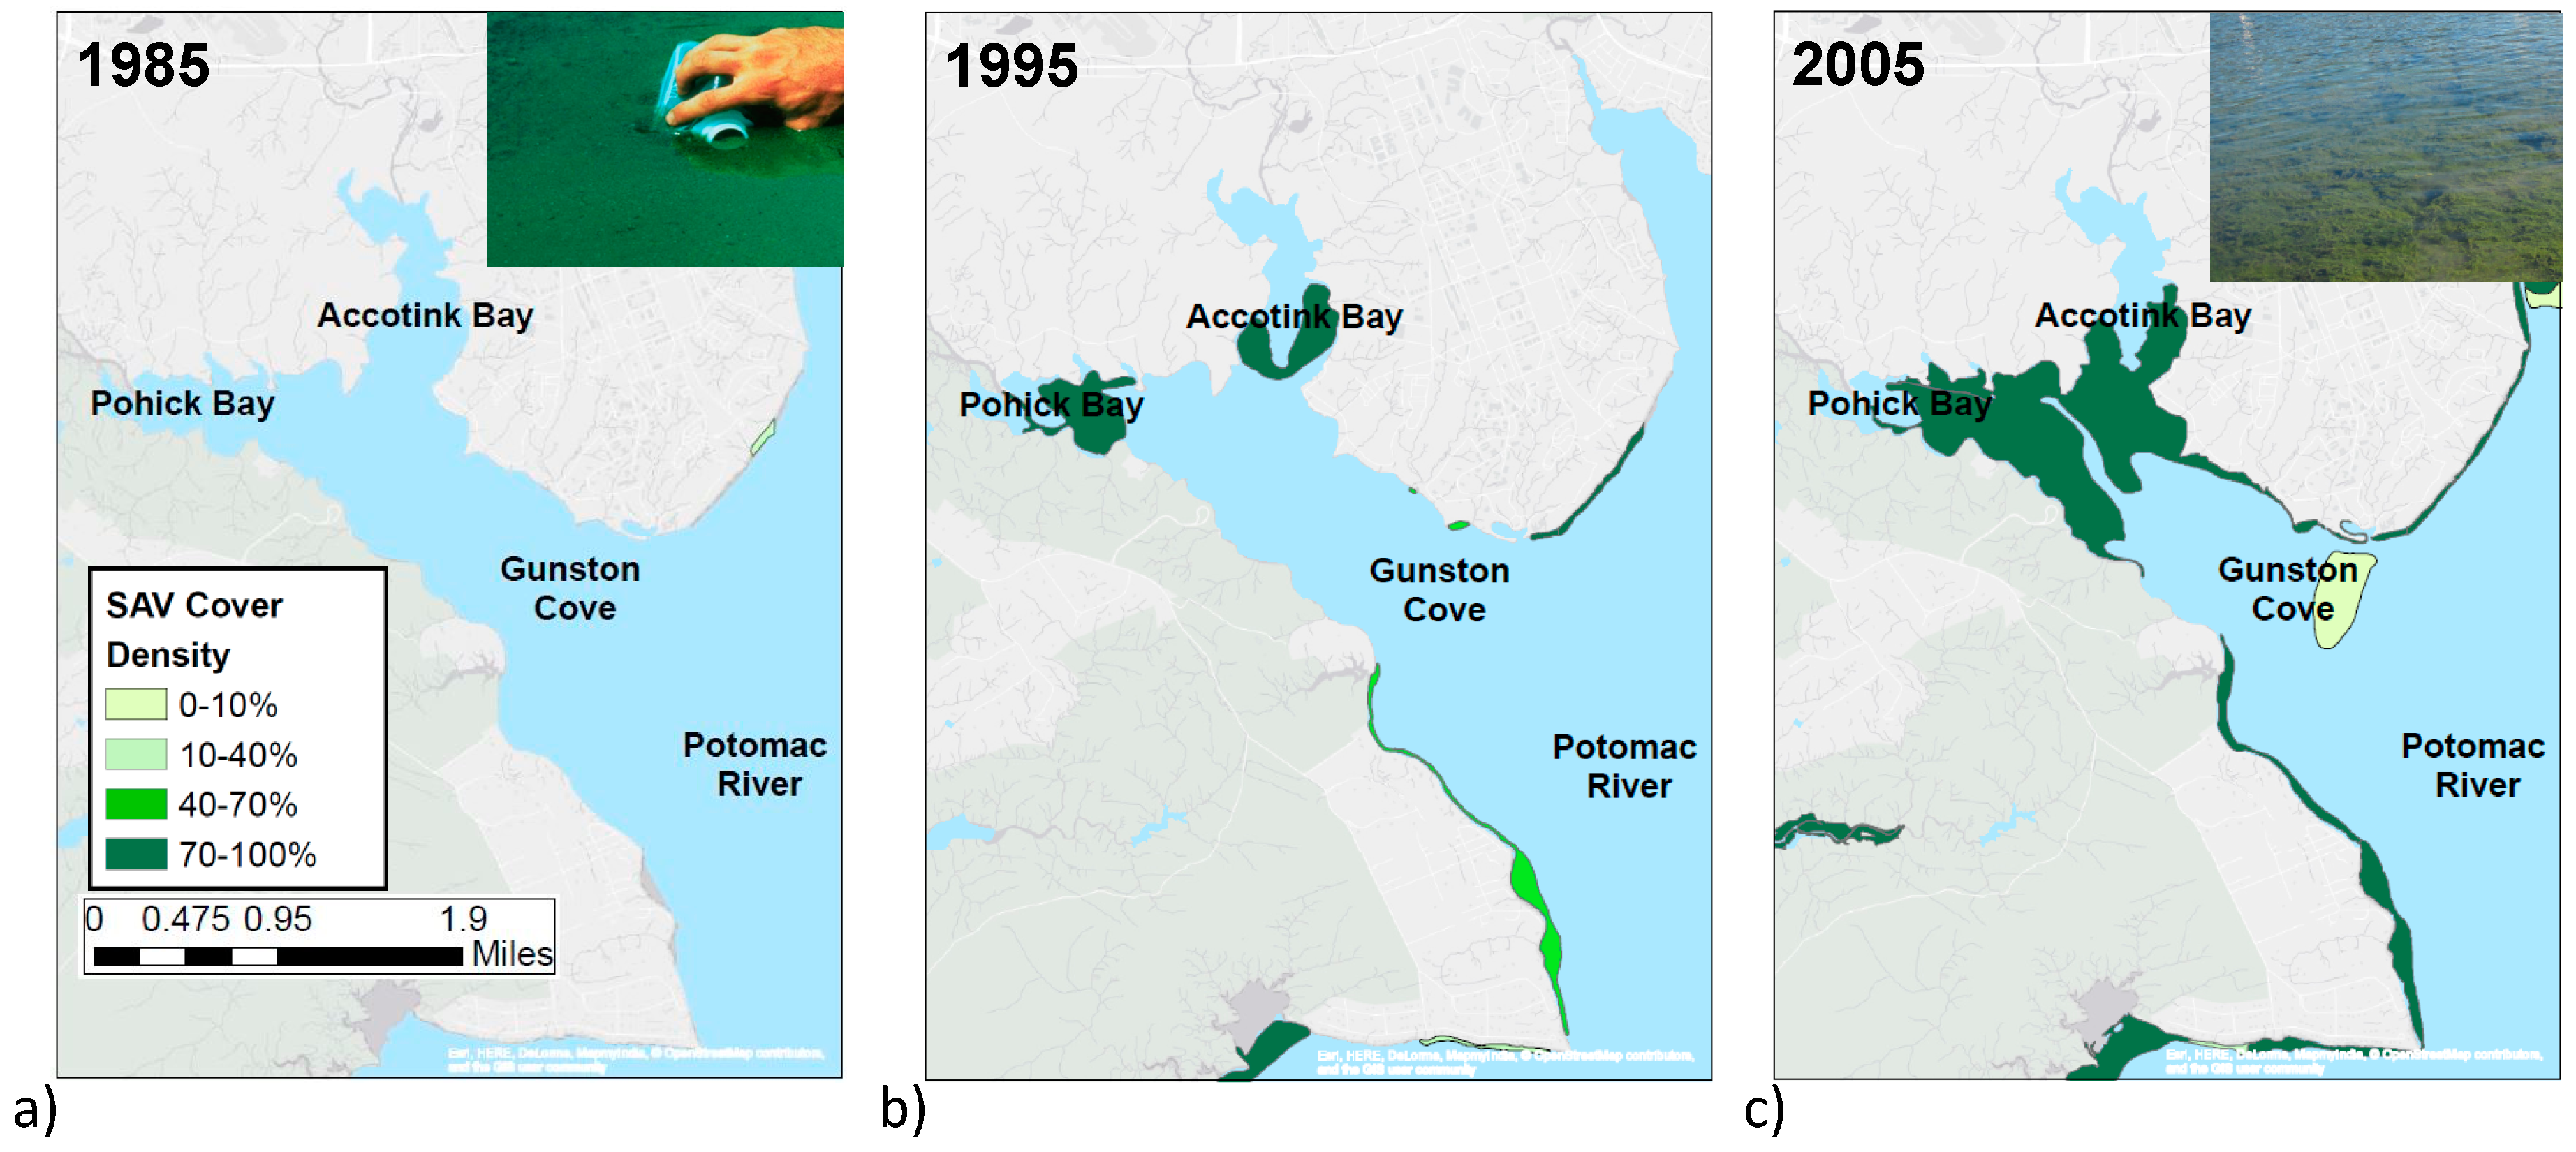
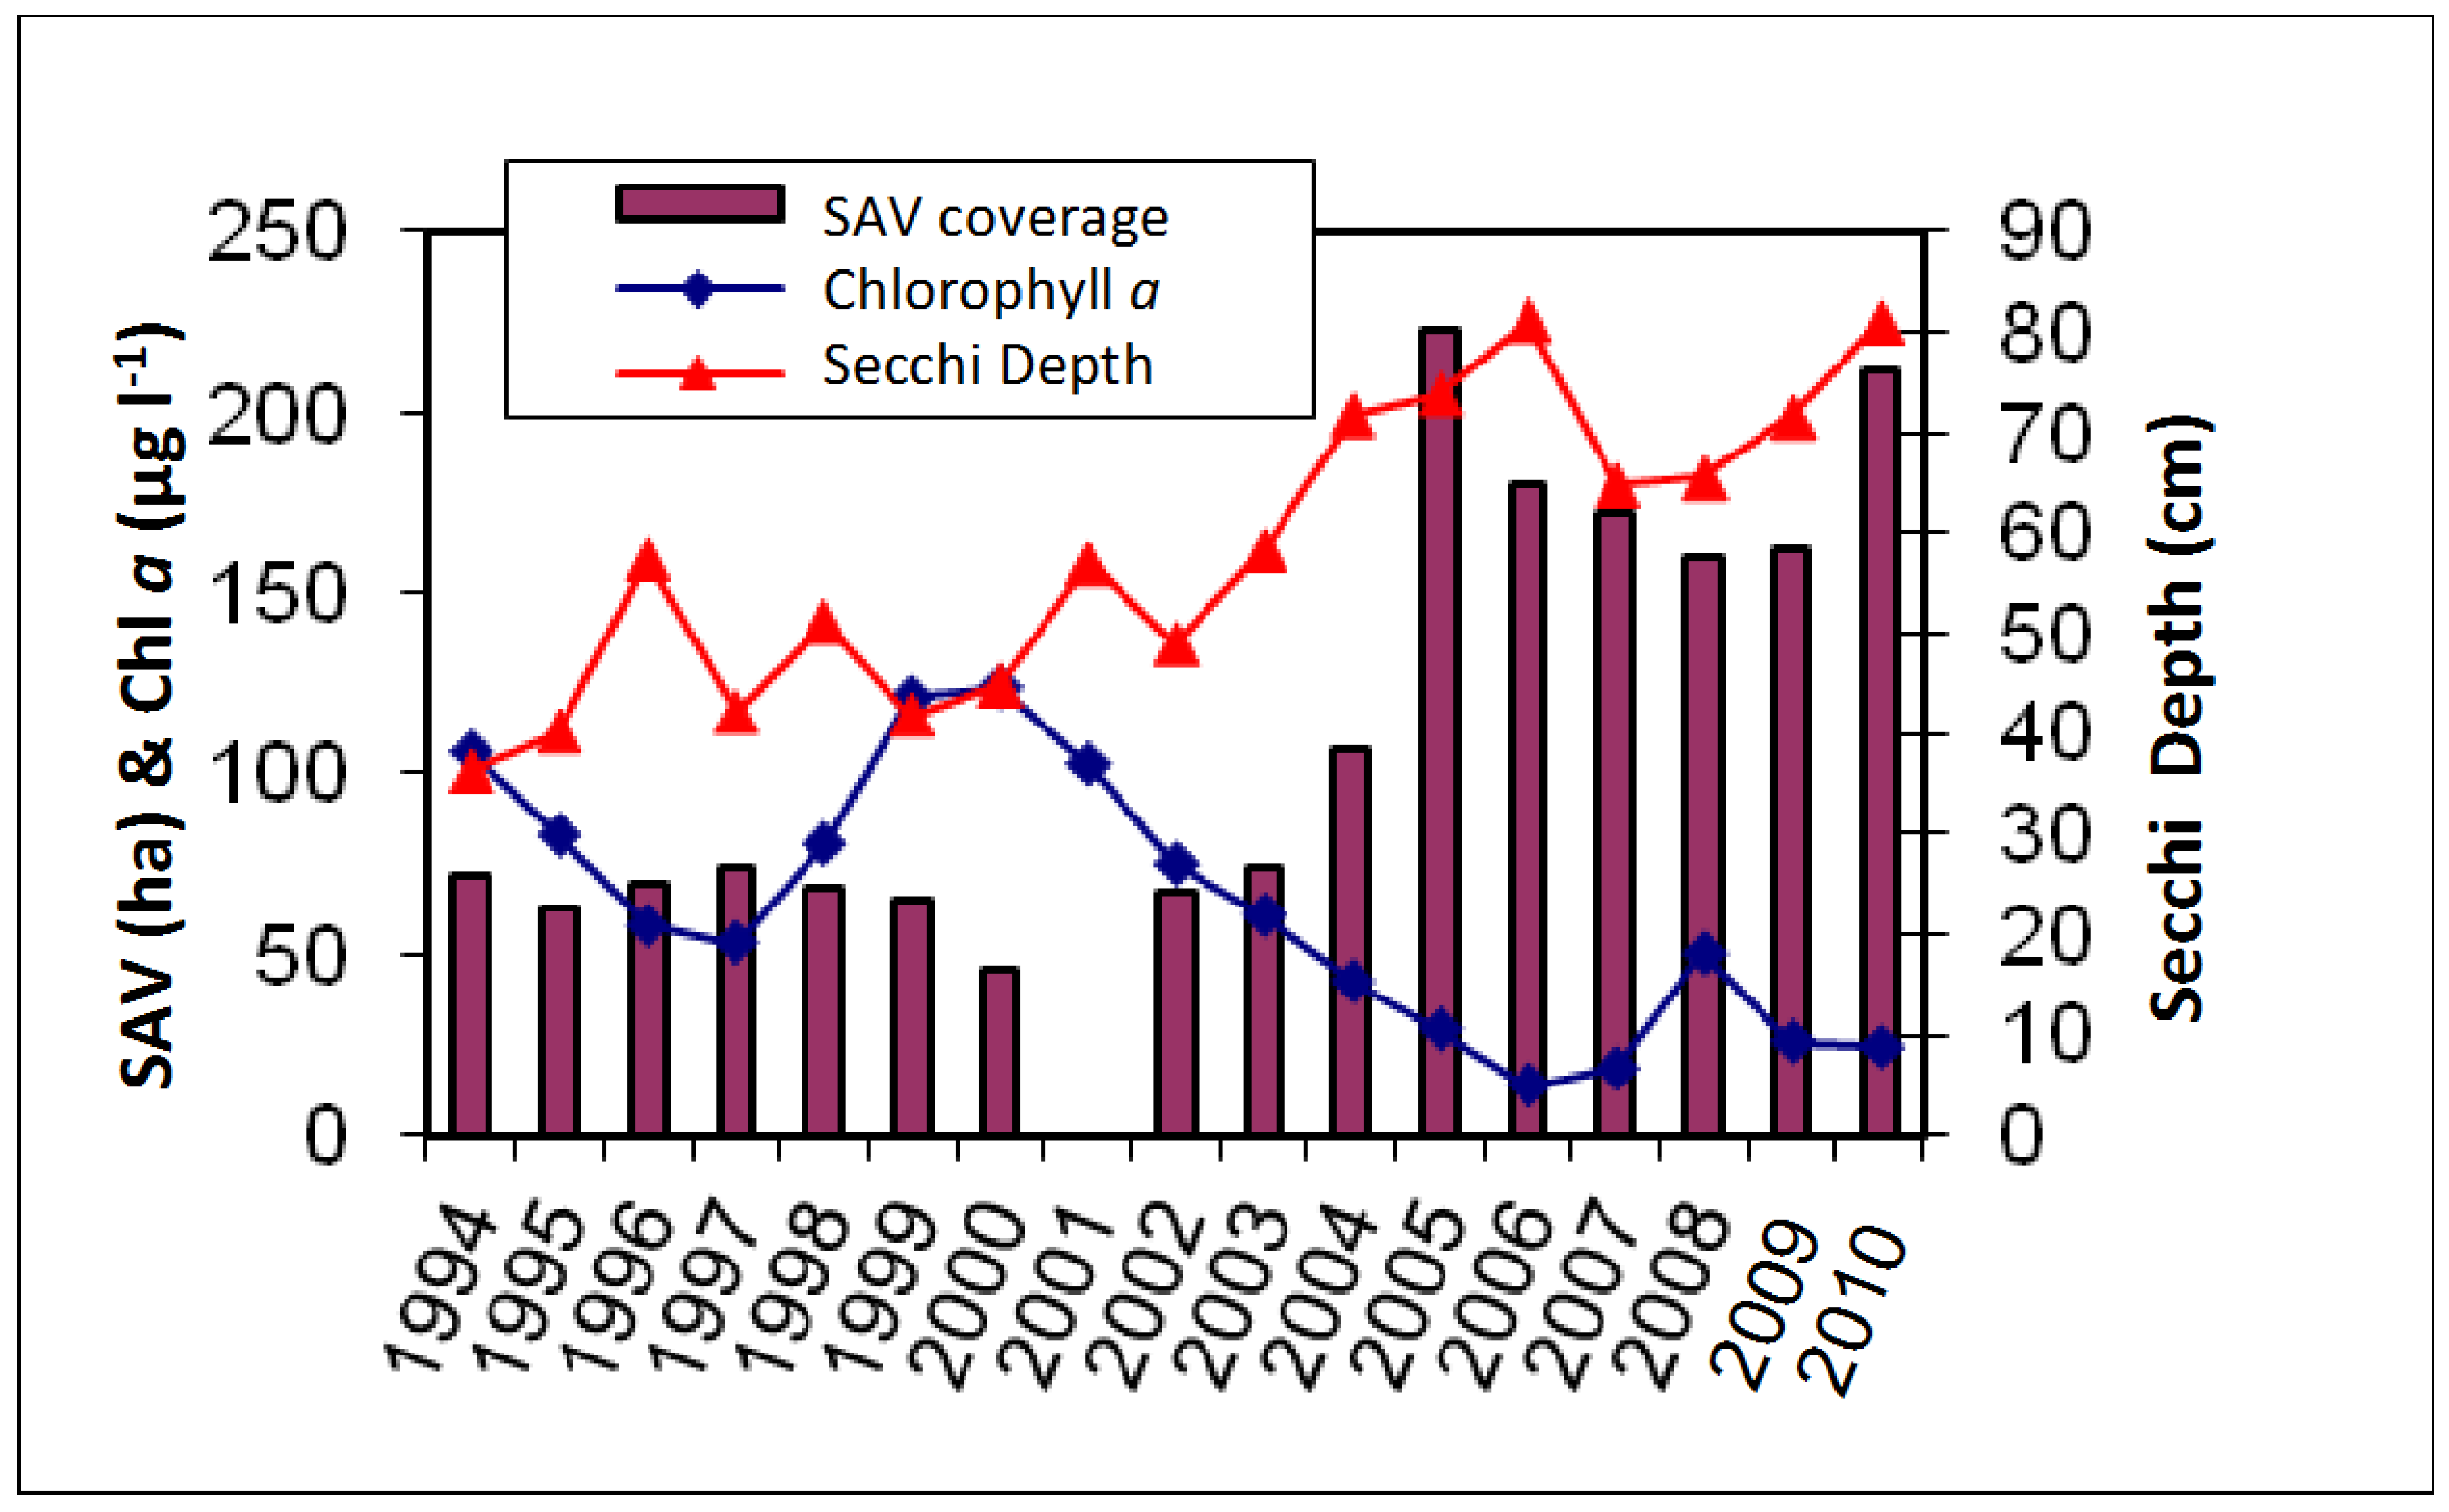
Aerial imaging reveals that SAV was absent from the cove from 1984–1992, and then small patches appeared in 1993 in Pohick Bay and Accotink Bay, which extended to a larger area in 2005 (Figure 2). Measurements of Chl a and Secchi disk depth, starting the year after SAV appeared, show an average Chl a concentration of 90 μg/L from 1994–2000, then a gradual decrease from 2000–2005, lowering the average to 30 μg/L (Figure 3). Secchi disk depth had an inversely related trend with low average values of 45 cm from 1994–2000, increasing to an average of 75 cm in 2005 (Figure 3). The change in SAV cover was not gradual but rather a two-step expansion: no SAV before 1993, then an average cover of 71 ha from 1993–2004, jumping up to an average cover of 180 ha from 2005–2011 (Figure 2 and Figure 3, http://web.vims.edu/bio/sav/gis_data.html).
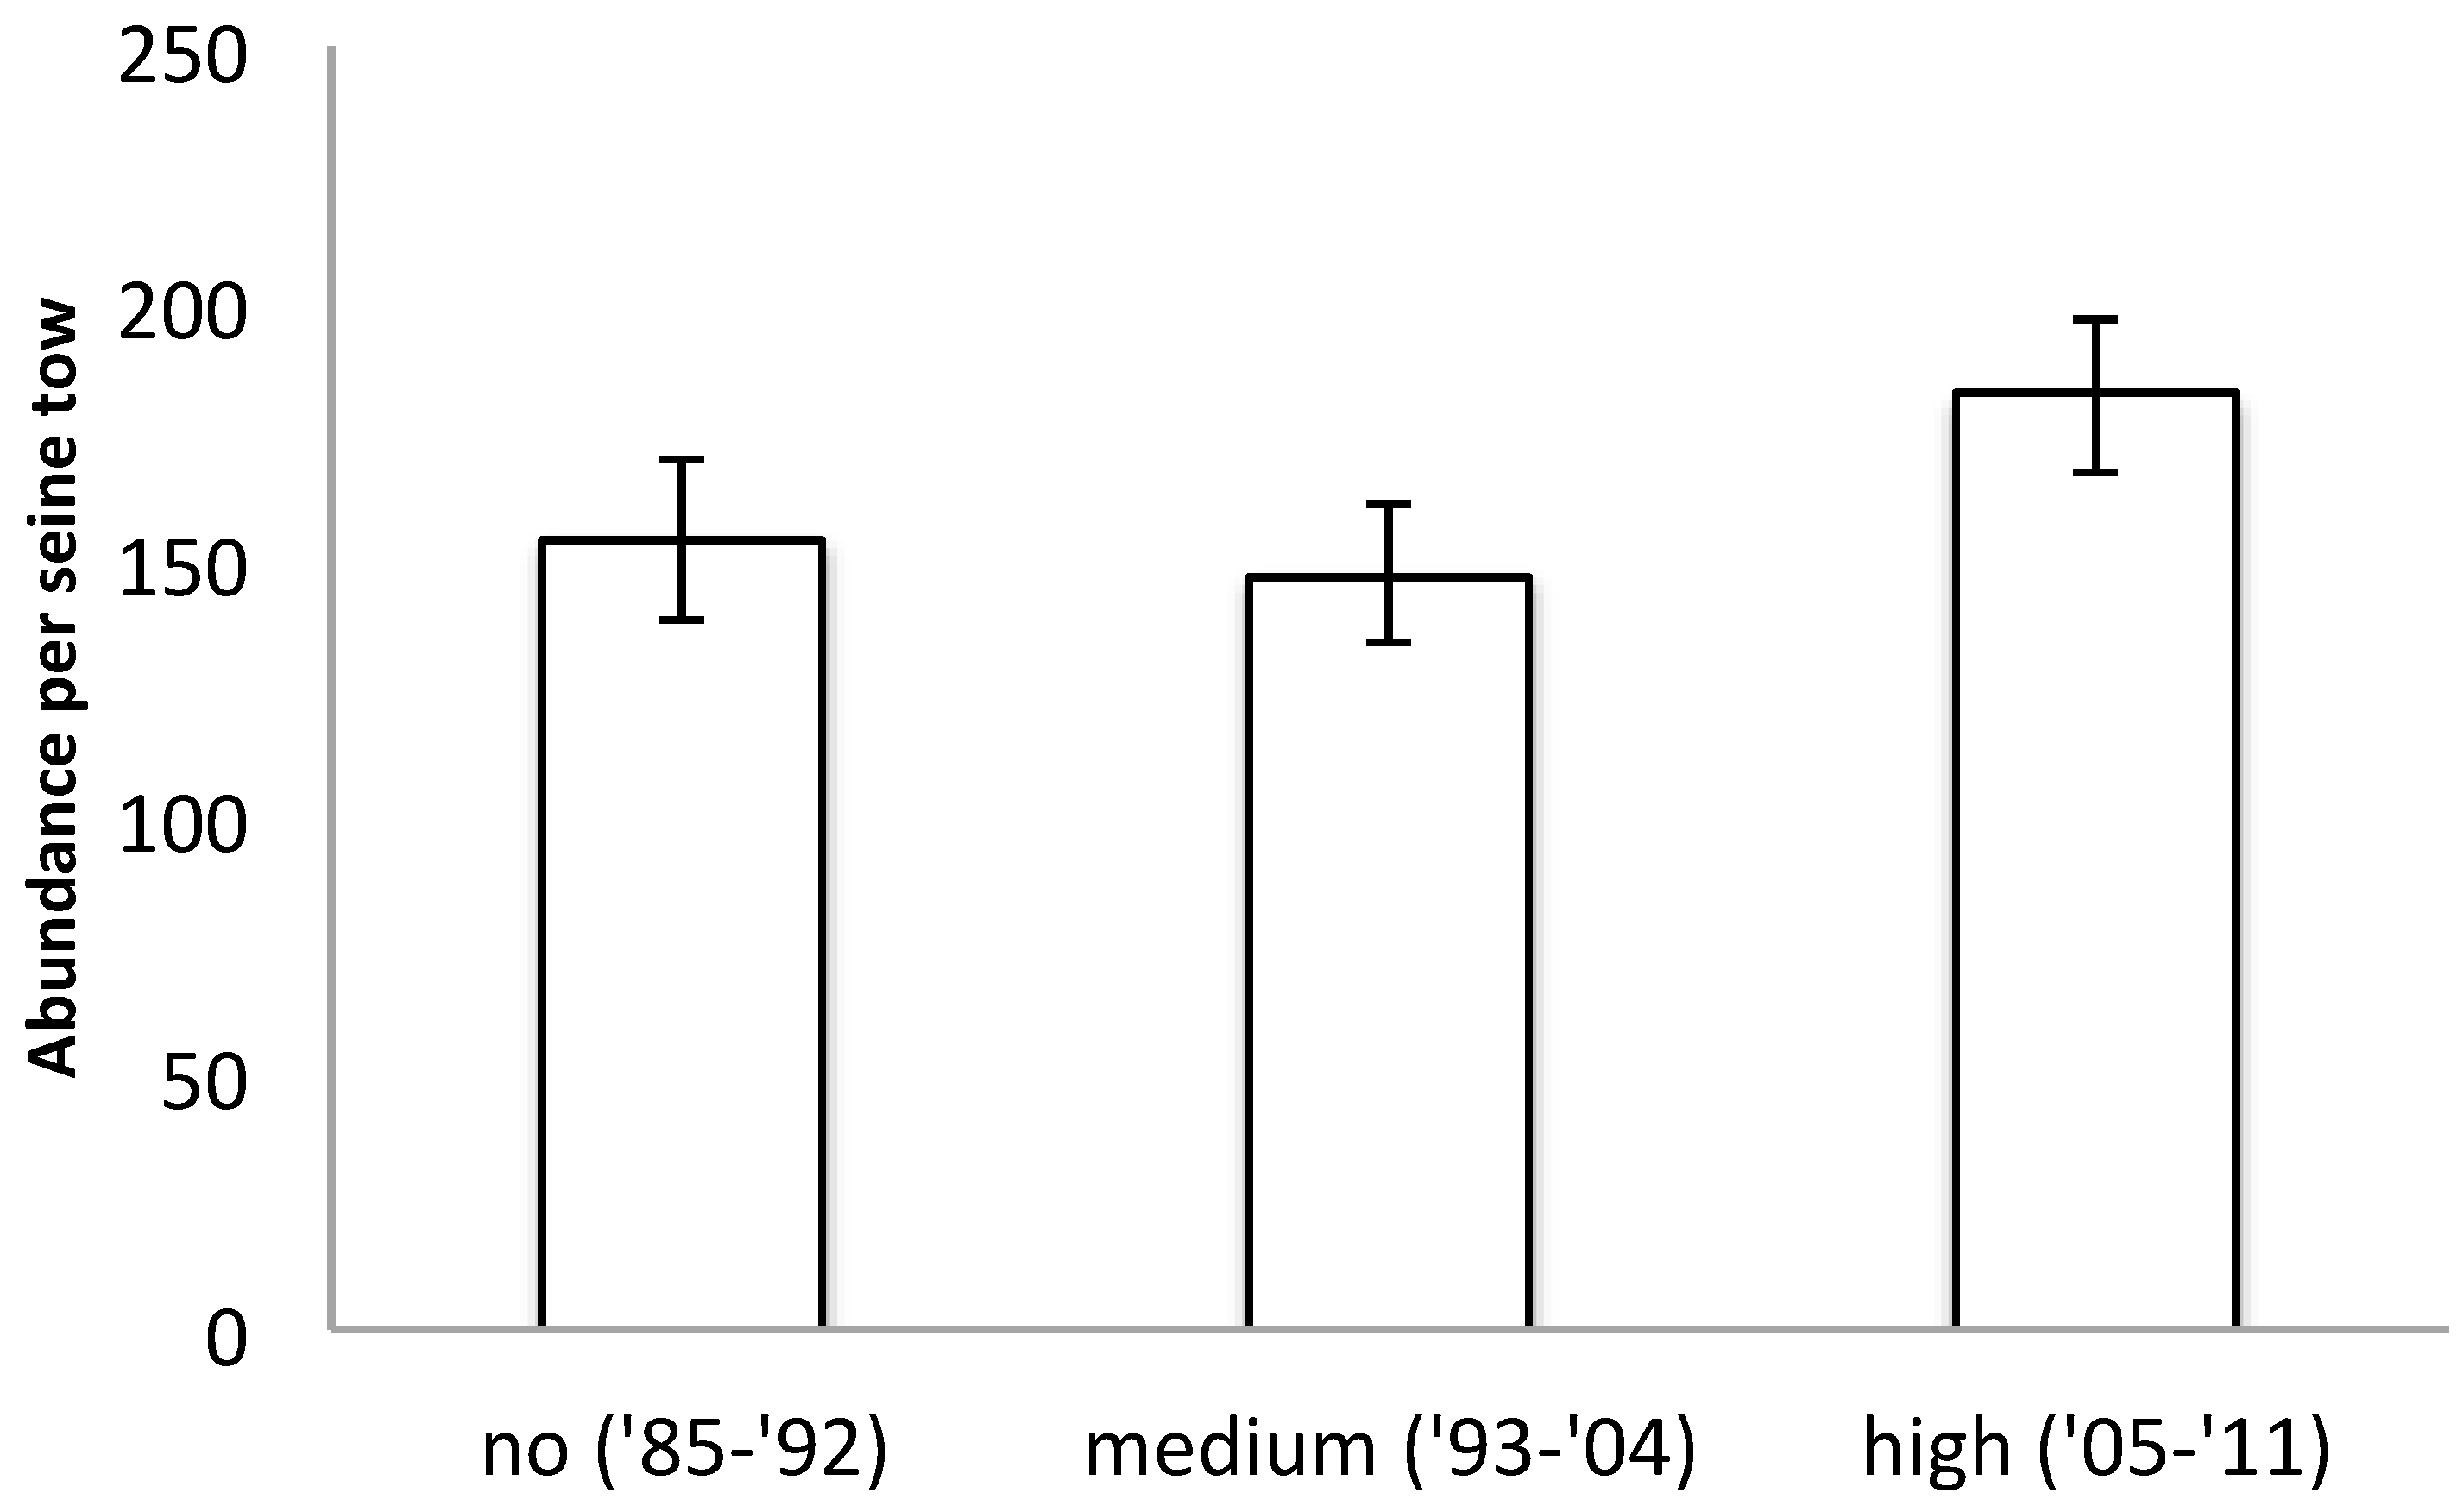
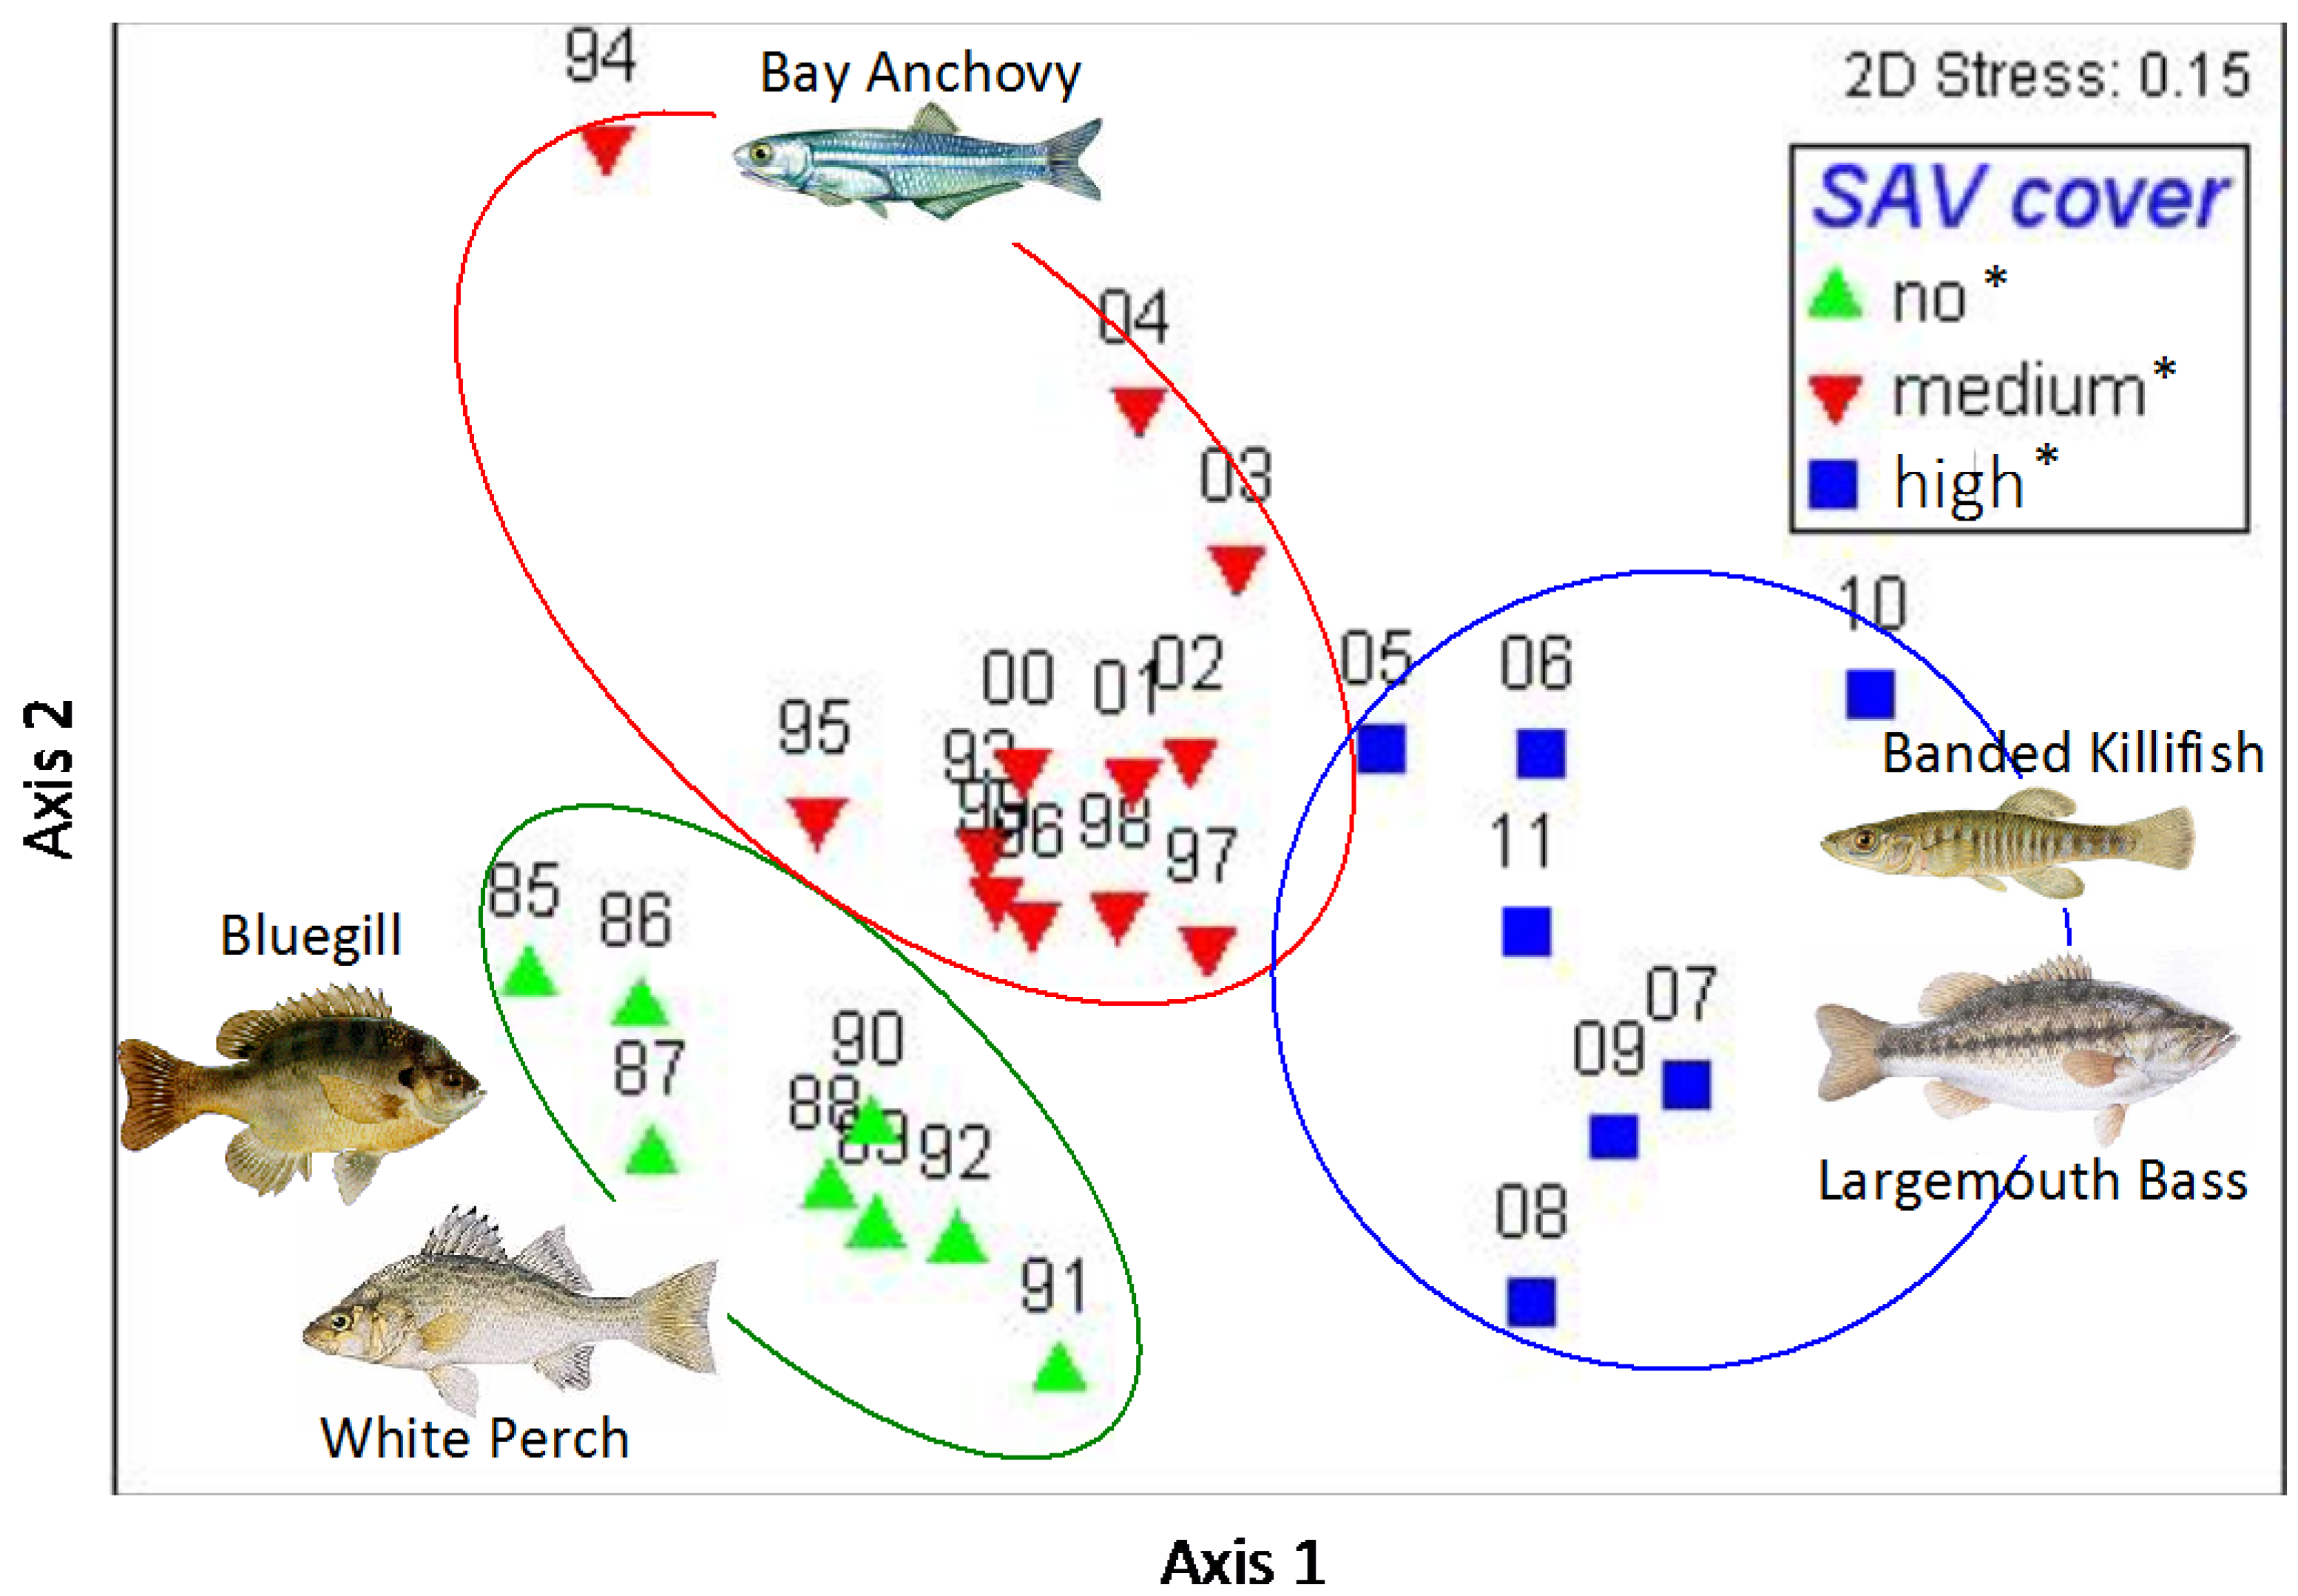
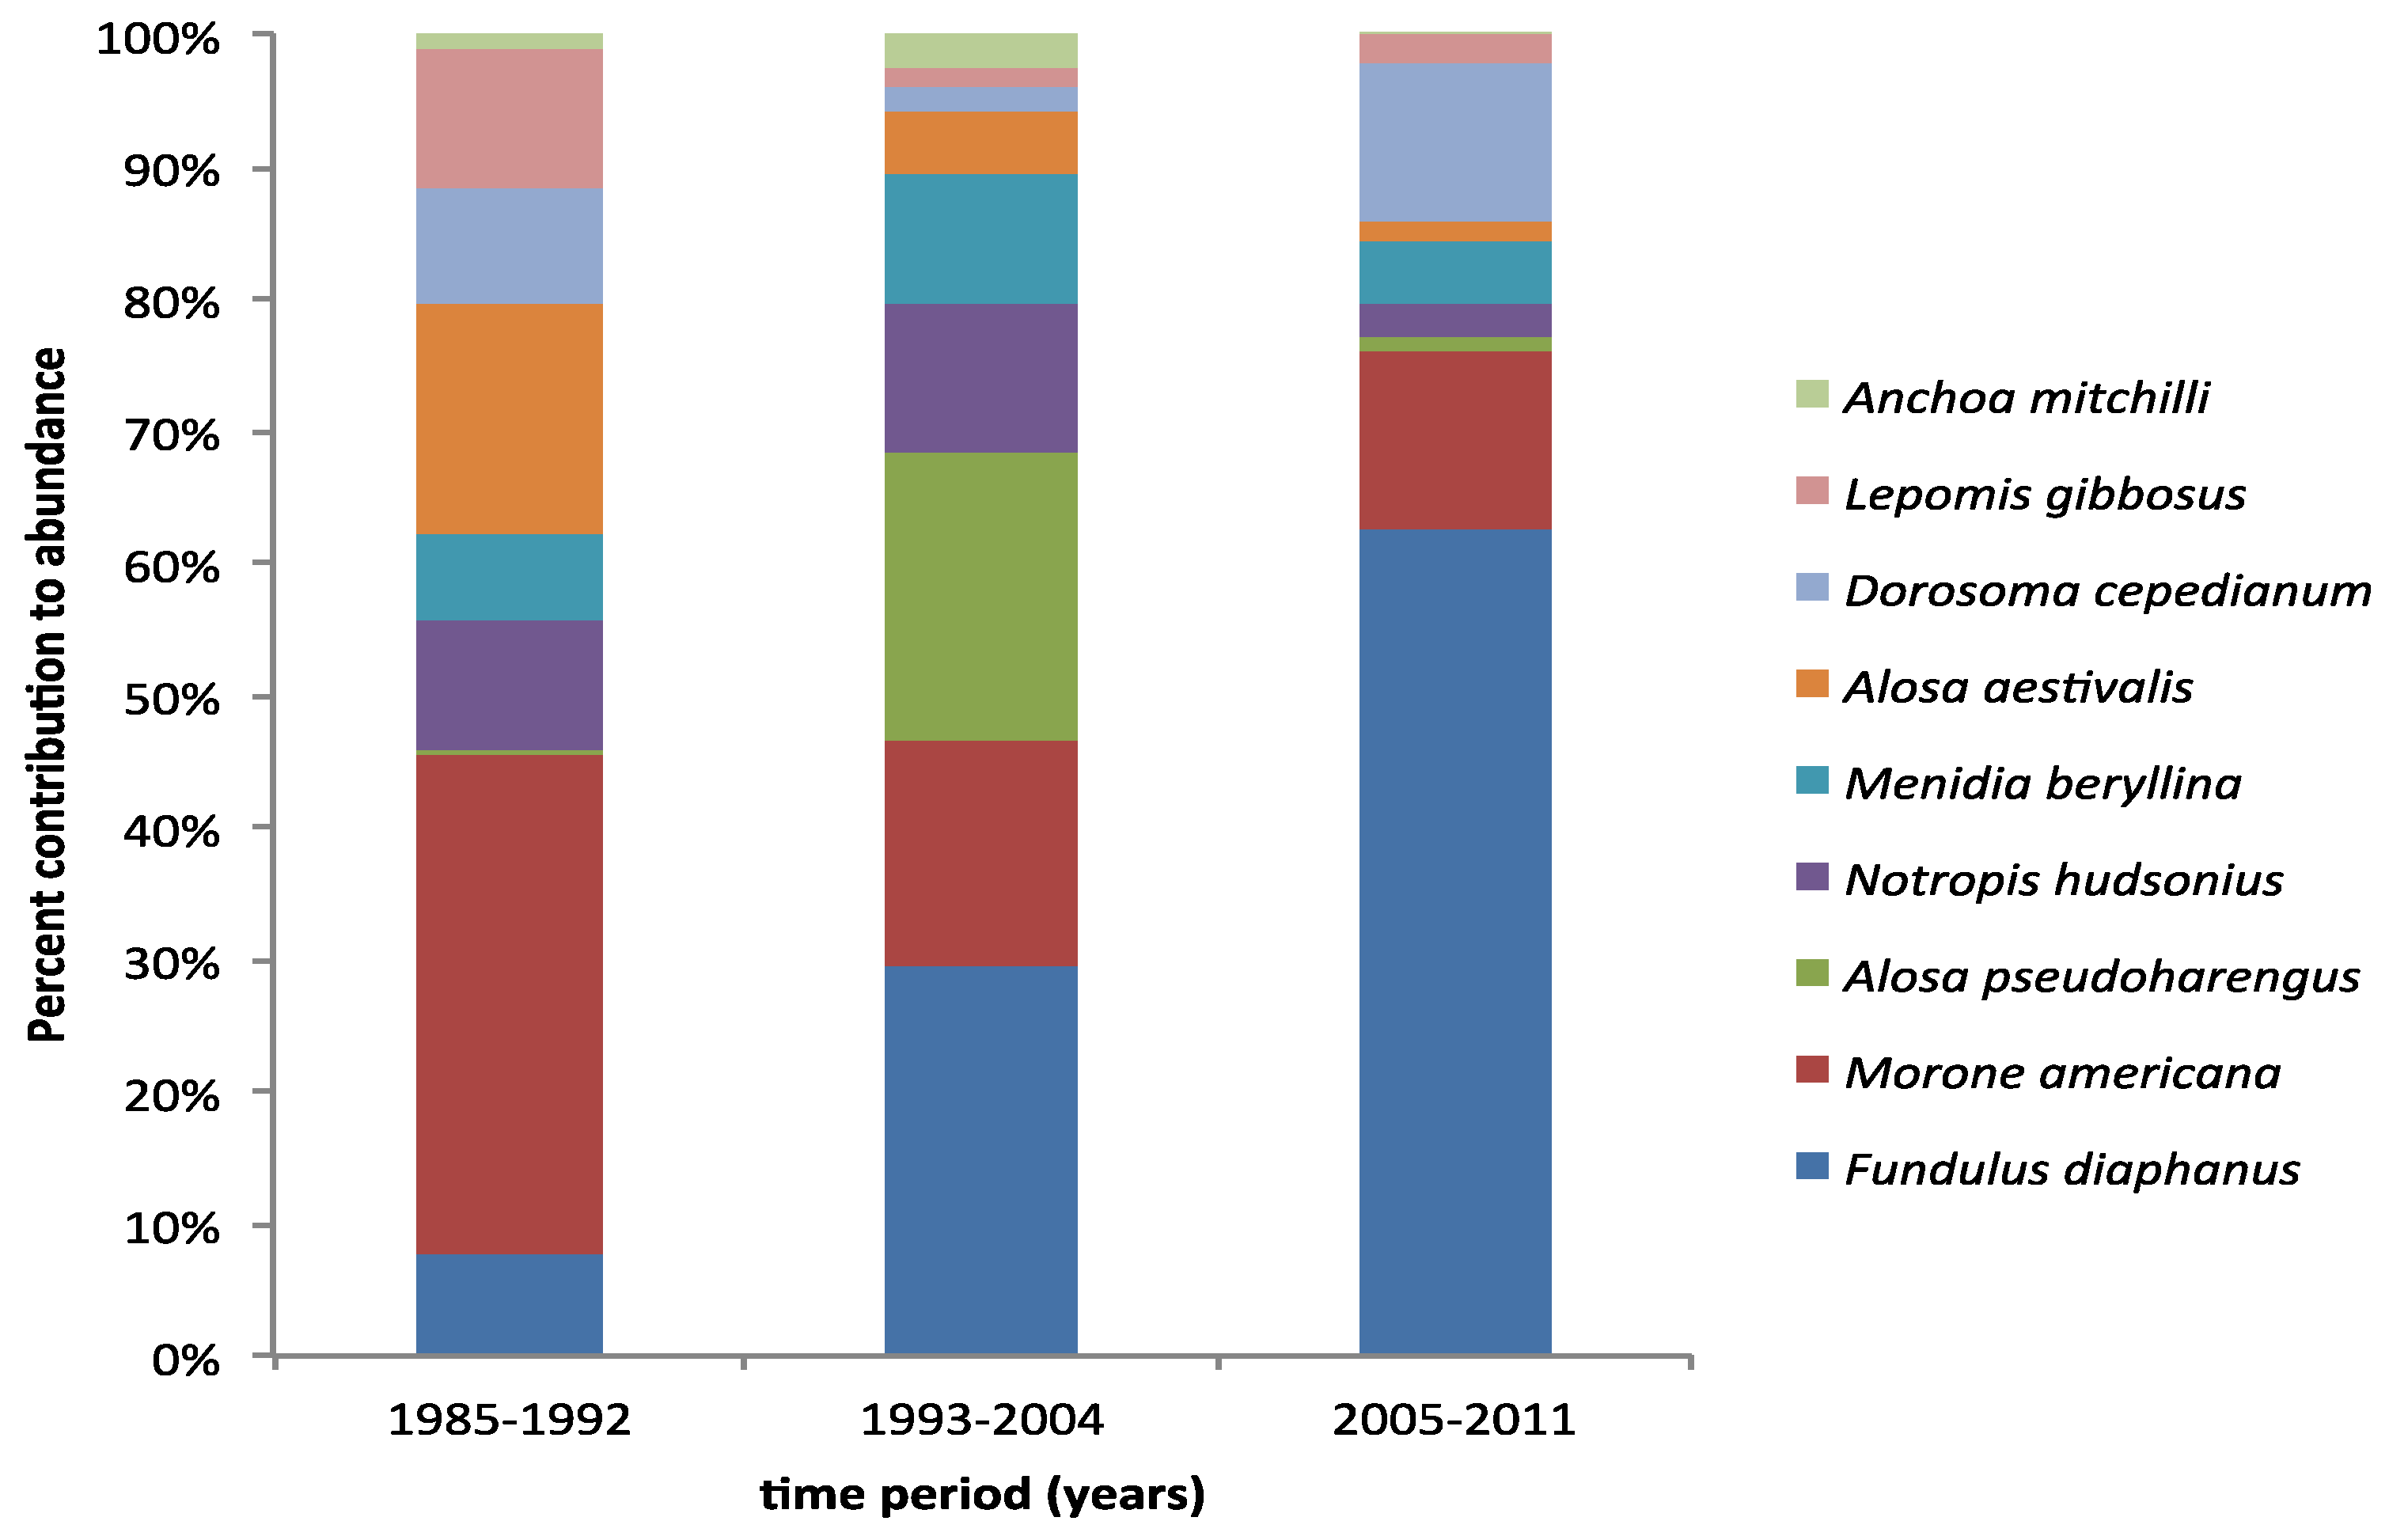
A total amount of 134,597 individual fishes from 54 different species were collected in seine hauls from 1985–2011. Fish samples collected during all three time periods, which are divided by SAV cover as ‘no’ (1985–1992), ‘medium’ (1993–2004), and ‘high’ (2005–2011), revealed no significant difference in total fish abundance between the three periods (ANOVA p = 0.1764; Figure 4). However, analyzing the community structure revealed significant changes in fish community that align with the three SAV cover states (ANOSIM R = 0.634, p = 0.01%; Figure 5). A SIMPER analysis revealed that the abundance of Banded Killifish (Fundulus diaphanus) was mostly responsible for the differences between all three time periods, which increased over time. Other species that contributed at least 5% to the differences between at least two time periods in order of contribution are Alewife (Alosa pseudoharengus), which first increased, then decreased; Blueback herring (Alosa aestivalis), which decreased over time; White Perch (Morone americana), which decreased over time; Bluegill (Lepomis gibbosus), which decreased over time; Gizzard Shad (Dorosoma cepedianum), which first decreased then increased; Inland Silverside (Menidia beryllina), which first increased then decreased; Spottail Shiner (Notropis hudsonius), which first slightly increased, then decreased; and Bay Anchovy (Anchoa mitchilli), which first increased, then decreased (Figure 6). Other notable changes include a three-fold increase in Striped Bass (Morone saxatilis) and Largemouth Bass (Micropterus salmoides) in the last time period; these changes did not contribute highly to the community structure changes because abundances of these higher predators remain low. In Figure 5, some of the characteristic members of the fish community of each time period are pictured. White Perch and Bluegill were recorded in high abundances in the first period and in much lower abundances since; Bay Anchovy was somewhat abundant in the second period, but virtually absent in the periods before and after; Banded Killifish has become a very dominant species in the third period; and Largemouth Bass saw a big increase relative to its own numbers in the previous periods, representing the increase in visual predators.

4. Discussion

Decrease in point-source nutrient loading into a Potomac River tributary resulted in classic [18] steady state shifts in the receiving tidal embayment from phytoplankton-dominated to SAV-dominated. This signified a recovery from eutrophication, which was responsible for the widespread loss of once-dominant SAV beds throughout the Chesapeake Bay and its tributaries five decades ago [5]. The two-phased nature of the shift during the recovery phase in Gunston Cove seems to indicate that this phosphorus-limited freshwater tidal ecosystem does show a response after nitrogen load reduction, stressing the importance of both phosphorus and nitrogen load reductions [19]. The first shift from a completely phytoplankton-dominated system to one where SAV could establish itself in a limited area occurred more than 10 years after phosphorus load reduction. This delay was a result of the phosphorus memory of the sediment [20]. The second shift to even higher water clarity and more extensive SAV cover coincides with the initiation of nitrogen load reductions from the Noman M. Cole, Jr. Pollution Control Plant in the early 2000s; a shift to an SAV-dominated state followed in 2005. While it is tempting to posit the nitrogen load reduction as a causative factor, measured N:P ratios in the embayment during the entire period of study have remained consistent with the phosphorus limitation of primary productivity (R. Christian Jones, pers. observation). The second shift may thus represent a further delayed response to the earlier phosphorus removal. It is also possible that temporary seasonal shifts in resource limitation, as has been observed in the Chesapeake Bay including the freshwater tidal portion of the Potomac River [21], may have been unnoticed. The positive feedback loop between SAV and turbidity, as described in Reference [10], contributed to the rapid expansion of SAV once the conditions were suitable for re-establishment. The bottom profile of the embayment played a role in these distinct shifts as well; the SAV established in 1993 appeared in areas that were shallower than the predicted maximum colonization depth of SAV. When the predicted maximum colonization depth increased with increasing water clarity, an extensive bottom area became suitable for colonization in 2005. The area covered with SAV in summer has remained relatively stable since then, as the area not colonized within the embayment is much deeper. These factors combined to establish the conditions for tipping points to occur, where a small change in water quality and clarity resulted in a large change in SAV cover at two distinct moments in time [10].
While the fish abundance did not change significantly with these state shifts, we found significant differences in the relative contribution of species to the fish community within the embayment. Similarly, changes in fish assemblage structure with increases in SAV habitat complexity were found by Wyda, et al. [22] in two mid-Atlantic estuaries. Wyda, et al. [22] examined fish abundances in addition to assemblage structures, and found that while fish abundances at SAV and non-SAV sampling locations did not consistently change, community composition between SAV and non-SAV sites did. Changes in species composition or the relative contribution of species in fish assemblages are often useful indicators of food web alterations [23], as well as habitat quality [22,24] and structure [25,26].
The observed species changes in the fish community mostly relate to the change in the type of available habitat, specifically the increase in SAV. The most significant change in relative contribution was that of Banded Killifish, which increased in abundance with each state shift. Banded Killifish are associated with aquatic vegetation, which they use as breeding habitat and predator refuge. Spawning occurs in dense vegetation where females attach adhesive eggs that adhere to plants and are subsequently fertilized by males [27]. The small-sized species also used dense vegetation to hide from predators such as Bluegill and Largemouth Bass, which are prevalent in this area. Another reason for the increase in Banded Killifish is likely to be an increase in prey, as aquatic invertebrates associated with SAV likely have increased in abundance as well [28]. A follow-up study into whole ecosystem food web changes is currently underway to investigate this assumption.
Conversely, the relative contribution of pelagic species, such as White Perch, declined. White Perch is still one of the most abundant species in the Potomac River and the larger Chesapeake Bay [29], and is mostly displaced to the open water of the Potomac mainstem [11]. It is a semi-anadromous species, which uses a larger Potomac and Chesapeake Bay estuary in different stages of its lifecycle. Some open-water dwelling species such as Bay Anchovy, Inland Silverside, and Alewife first saw an increase with the first state shift, then a decrease with the second shift. This response was likely related to the increased water quality, allowing these species to utilize the area, followed by SAV dominance, which led to these species finding other open water areas. These species are planktivorous, and the juveniles (the life stage we mostly collected in this survey) have a high proportion of phytoplankton in their diet. This made the second period ideal, with its improved water quality but still high amount of phytoplankton. The species decreasing in abundance are mostly migratory species that moved on to utilize other areas when open water in the embayment decreased, which contributed to the rapid response of the fish community to the steady state shift in primary production.
Other changes more directly related to a decrease in phytoplankton (rather than an increase in SAV) are the increases in visual predators, such as Largemouth Bass and Striped Bass. Decreased visibility disproportionately affects piscivorous fish in their ability to feed, reducing their relative abundance in fish communities [30]. While abundances of both Largemouth Bass and Striped Bass remain low in the region studied, they did both experience a three-fold increase in abundance from 1985 to 2011. With the significant recreational value of these species [31], and the ecological importance of these high trophic level predators to the food web [32], these small increases are nonetheless of value. Through trophic interactions, their increase likely contributed to the decrease in small pelagic planktivorous fishes as well.
Although much of the observed change in fish community is likely due to changes in local habitat, broader-scale changes in populations due to regional factors could also have played a role. Striped Bass has experienced a Chesapeake Bay-wide recovery after a fishing moratorium was implemented from 1985–1990 in Maryland and 1989–1990 in Virginia [33]. In addition, the decrease in abundance of Blueback Herring over the period of study is likely a result of overfishing [34,35,36]. A moratorium was placed on both Blueback Herring and Alewife fishing in Virginia in 2012 to reduce harvests of these species that have seen population declines along the mid-Atlantic area since the 1970s [34]. Another factor that plays a role in fish assemblage changes is the introduction of invasive species such as Blue Catfish (Ictalurus furcatus) and Northern Snakehead (Channa argus) in the Potomac River [37,38].
Still, while other factors inevitably contribute to fish assemblage changes in a long-term field study, this study revealed three strikingly distinct fish assemblages that align exactly with the state shifts in primary productivity. The fact that feeding and breeding is highly associated with the presence and type of primary producer that provides food, shelter, and spawning habitat, as well as the fact that fish assemblage changes can occur relatively quickly in this open freshwater tidal ecosystem, contribute to the responsiveness of the fish assemblage structure to steady state shifts in primary producers. This study adds a new example to the comprehensive analysis of Reference [39], in which management attributes lead to successful restoration of aquatic systems impacted by nutrient pollution. The recovery is a result of a management strategy that shares several qualities with what the authors of [39] described as attributes most associated with management goals; a future manuscript is focused on detailing the management strategy that led to Gunston Cove’s recovery. The observed state shifts themselves add a freshwater tidal example of alternative equilibria mostly observed in freshwater lakes [40], and provides a compelling case for the effectiveness of nutrient reductions as components of restoration management.

Acknowledgments

We are much indebted to Don Kelso and Richard Kraus who were previous co-PI’s on this long-term study, and responsible for collecting the fish samples. We also want to acknowledge the numerous George Mason University students who have helped with sample collection over the years. We would like to thank three anonymous reviewers whose comments have improved the manuscript. This study is funded by Fairfax County through its Department of Public Works and Environmental Services.

Author Contributions

R.C.J. conceived and designed the study; R.C.J., K.d.M., A.S. and C.J.C.S collected field data; R.C.J. and K.d.M. analyzed the data; K.d.M., A.S. and C.J.C.S. wrote the paper.

Conflicts of Interest

The authors declare no conflict of interest. The sponsor had no role in the design of the study; in the collection, analyses, or interpretation of data presented in this manuscript; in the writing of the manuscript, and in the decision to publish the results.

References

  1. Smith, V.H. Eutrophication of freshwater and coastal marine ecosystems: A global problem. Environ. Sci. Pollut. Res. 2003, 10, 126–139. [Google Scholar] [CrossRef]
  2. Allan, J.D.; Castillo, M.M. Stream Ecology: Structure and Function of Running Waters, 2nd ed.; Springer: Dordrecht, The Netherlands, 2007; ISBN 978-1-4020-5583-6. [Google Scholar]
  3. Bowen, J.L.; Valiela, I. The ecological effects of urbanization of coastal watersheds: Historical increases in nitrogen loads and eutrophication of Waquoit Bay estuaries. Can J. Fish. Aquat. Sci. 2001, 58, 1489–1500. [Google Scholar] [CrossRef]
  4. Paerl, H.W. Controlling eutrophication along the freshwater–marine continuum: Dual nutrient (N and P) reductions are essential. Estuar. Coasts 2009, 32, 593–601. [Google Scholar] [CrossRef]
  5. Kemp, W.M.; Boynton, W.R.; Adolf, J.E.; Boesch, D.F.; Bolcourt, W.C.; Brush, G.; Cornwell, J.C.; Fisher, T.R.; Gilbert, P.M.; Hagy, J.D.; et al. Eutrophication of Chesapeake Bay: Historical trends and ecological interactions. Mar. Ecol. Prog. Ser. 2005, 303, 1–29. [Google Scholar] [CrossRef]
  6. Paerl, H.W.; Xu, H.; McCarthy, M.J.; Zhu, G.; Qin, B.; Li, Y.; Gardner, W.S. Controlling harmful cyanobacterial blooms in a hyper-eutrophic lake (Lake Taihu, China): The need for a dual nutrient (N & P) management strategy. Water Res. 2011, 45, 1973–1983. [Google Scholar] [PubMed]
  7. Carter, V.; Gammon, P.T.; Bartow, N.C. Submersed Aquatic Plants of the Tidal Potomac River; U.S. Geological Survey: Alexandria, VA, USA, 1983.
  8. Carter, V.; Rybicki, N. Resurgence of submersed aquatic macrophytes in the tidal Potomac River, Maryland. Estuaries 1986, 9, 368–375. [Google Scholar] [CrossRef]
  9. Jones, R.C. Long term reponse of water quality to changes in nutrient loading at a mainstem site in the tidal freshwater Potomac River. Verh. Int. Ver. Limnol. 2008, 30, 633–637. [Google Scholar]
  10. Van Nes, E.H.; Arani, B.M.S.; Staal, A.; van der Bolt, B.; Flores, B.M.; Bathiany, S.; Scheffer, M. What do you mean ‘tipping point’? TREE 2016, 31, 902–904. [Google Scholar] [CrossRef] [PubMed]
  11. Jones, R.C.; de Mutsert, K. An Ecological Study of Gunston Cove 2012, Final Report; Potomac Environmental Research and Education Center (PEREC), George Mason University: Fairfax, VA, USA, 2013; 160p. [Google Scholar]
  12. Kraus, R.T.; Jones, R.C. Fish abundances in shoreline habitats and submerged aquatic vegetation in a tidal freshwater embayment of the Potomac River. Environ. Monit. Assess. 2012, 184, 3341–3357. [Google Scholar] [CrossRef] [PubMed]
  13. Jones, R.C.; Buchanan, C.; Andrle, V. Spatial, seasonal, and interannual patterns in the phytoplankton communities of a tidal freshwater ecosystem. Va. J. Sci. 1992, 43, 25–40. [Google Scholar]
  14. Jones, R.C.; Kelso, D.P.; Schaeffer, E. Spatial and seasonal patterns in water quality in an embayment-mainstem reach of the tidal freshwater Potomac River, USA: A multiyear study. Environ. Monit. Assess. 2008, 147, 351–375. [Google Scholar] [CrossRef] [PubMed]
  15. Kelso, D.P.; Jones, R.C.; DeFur, P. An Ecological Study of Gunston Cove 1984, Final Report; Potomac Environmental Research and Education Center (PEREC), George Mason University: Fairfax, VA, USA, 1985. [Google Scholar]
  16. Jones, R.C.; de Mutsert, K. An Ecological Study of Gunston Cove 2011, Final Report; Potomac Environmental Research and Education Center (PEREC), George Mason University: Fairfax, VA, USA, 2012; 148p. [Google Scholar]
  17. Clarke, K.R.; Warwick, R.M. Change in Marine Communities: An Approach to Statistical Analysis and Interpretation, 2nd ed.; PRIMER-E Ltd.: Plymouth, UK, 2001; ISBN 1855311402, 9781855311404. [Google Scholar]
  18. Scheffer, M. Multiplicity of stable states in freshwater systems. In Biomanipulation Tool for Water Management; Gulati, R.D., Lammens, E.H.R.R., Meijer, M.-L., van Donk, E., Eds.; Springer: Amsterdam, The Netherlands, 1990; ISBN 978-94-017-0924-8. [Google Scholar]
  19. Conley, D.J.; Paerl, H.W.; Howarth, R.W.; Boesch, D.F.; Seitzinfer, S.P.; Lancelot, C.; Likens, G.E. Controlling eutrophication: Nitrogen and phosphorous. Science 2009, 323, 1014–1015. [Google Scholar] [CrossRef] [PubMed]
  20. Søndergaard, M.; Jensen, J.P.; Jeppesen, E. Role of sediment and internal loading of phosphorus in shallow lakes. Hydrobiologia 2003, 506–509, 135–145. [Google Scholar] [CrossRef]
  21. Fisher, T.R.; Gustafson, A.B.; Sellner, K.; Lacouture, R.; Haas, L.W.; Wetzel, R.L.; Magnien, R.; Everitt, D.; Michaels, B.; Karrh, R. Spatial and temporal variation of resource limitation in Chesapeake Bay. Mar. Biol. 1999, 133, 763–778. [Google Scholar] [CrossRef]
  22. Wyda, J.C.; Deegan, L.A.; Hughes, J.E.; Weaver, M.J. The response of fishes to submerged aquatic vegetation complexity in two ecoregions of the Mid- Atlantic Bight: Buzzards Bay and Chesapeake Bay. Estuaries 2002, 25, 86–100. [Google Scholar] [CrossRef]
  23. Bayley, S.E.; Prather, C.M. Do wetland lakes exhibit alternative stable states? Submersed aquatic vegetation and chlorophyll in western boreal shallow lakes. Limnol. Oceanogr. 2003, 48, 2335–2345. [Google Scholar] [CrossRef]
  24. Jaureguizar, A.J.; Menni, R.; Guerrero, R.; Lasta, C. Environmental factors structuring fish communities of the Rı́o de la Plata estuary. Fish. Res. 2004, 66, 195–211. [Google Scholar] [CrossRef]
  25. Nobriga, M.L.; Feyrer, F.; Baxter, R.D.; Chotkowski, M. Fish community ecology in an altered river delta: Spatial patterns in species composition, life history strategies, and biomass. Estuaries 2005, 28, 776–785. [Google Scholar] [CrossRef]
  26. Tonn, W.M.; Magnuson, J.J. Patterns in the species composition and richness of fish assemblages in northern Wisconsin Lakes. Ecology 1982, 63, 1149–1166. [Google Scholar] [CrossRef]
  27. Kraft, C.E.; Carlson, D.M.; Carlson, M. Inland Fishes of New York (Online); Version 4.0; Department of Natural Resources, Cornell University, and the New York State Department of Environmental Conservation: Albany, NY, USA, 2006.
  28. Rozas, L.P.; Odum, W.E. Occupation of submerged aquatic vegetation by fishes: Testing the roles of food and refuge. Oecologia 1988, 77, 101–106. [Google Scholar] [CrossRef] [PubMed]
  29. Lippson, A.J.; Lippson, R.L. Life in the Chesapeake Bay; The Johns Hopkins University Press: Baltimore, MD, USA, 2006; p. 324. ISBN 9780801883385. [Google Scholar]
  30. De Robertis, A.; Ryer, C.H.; Veloza, A.; Brodeur, R.D. Differential effects of turbidity on prey consumption of piscivorous and planktivorous fish. Can J. Fish. Aquat. Sci. 2003, 60, 1517–1526. [Google Scholar] [CrossRef]
  31. Chen, R.J.; Hunt, K.M.; Ditton, R.B. Estimating the economic impacts of a trophy largemouth bass fishery: Issues and applications. N. Am. J. Fish. Man. 2003, 23, 835–844. [Google Scholar] [CrossRef]
  32. Oksanen, L.; Fretwell, S.D.; Arruda, J.; Niemela, P. Exploitation ecosystems in gradients of primary productivity. Am. Nat. 1981, 118, 240–261. [Google Scholar] [CrossRef]
  33. NOAA. Striped Bass. Available online: https://chesapeakebay.noaa.gov/fish-facts/striped-bass (accessed on 4 June 2017).
  34. ASMFC. River Herring Benchmark Assessment: Stock Assessment Report; No.12-02; Atlantic States Marine Fisheries Commission: Washington, DC, USA, 2012. [Google Scholar]
  35. Greene, K.E.; Zimmerman, J.L.; Laney, R.W.; Thomas-Blate, J.C. Atlantic Coast Diadromous Fish Habitat: A Review of Utilization, Threats, Recommendations for Conservation, and Research Needs; ScholarWorks@UMass Amherst: Washington, DC, USA, 2009. [Google Scholar]
  36. Hightower, J.E.; Wicker, A.M.; Endres, K.M. Historical trends in abundance of American shad and river herring in Albemarle Sound, North Carolina. N. Am. J. Fish. Man. 1996, 16, 257–271. [Google Scholar] [CrossRef]
  37. Schloesser, R.W.; Fabrizio, M.C.; Latour, R.J.; Garman, G.C.; Greenlee, B.; Groves, M.; Gartland, J. Ecological role of blue catfish in Chesapeake Bay communities and implications for management. Am. Fish. Soc. Sym. 2011, 77, 369–382. [Google Scholar]
  38. Odenkirk, J.; Owens, S. Northern snakeheads in the tidal Potomac River system. Trans. Am. Fish. Soc. 2005, 134, 1605–1609. [Google Scholar] [CrossRef]
  39. Gross, C.; Hagy, J.D., 3rd. Attributes of successful actions to restore lakes and estuaries degraded by nutrient pollution. J. Environ. Man. 2017, 187, 122–136. [Google Scholar] [CrossRef] [PubMed]
  40. Scheffer, M.; Hosper, S.H.; Meijer, M.-L.; Moss, B.; Jeppesen, E. Alternative equilibria in shallow lakes. TREE 1993, 8, 275–279. [Google Scholar] [CrossRef]
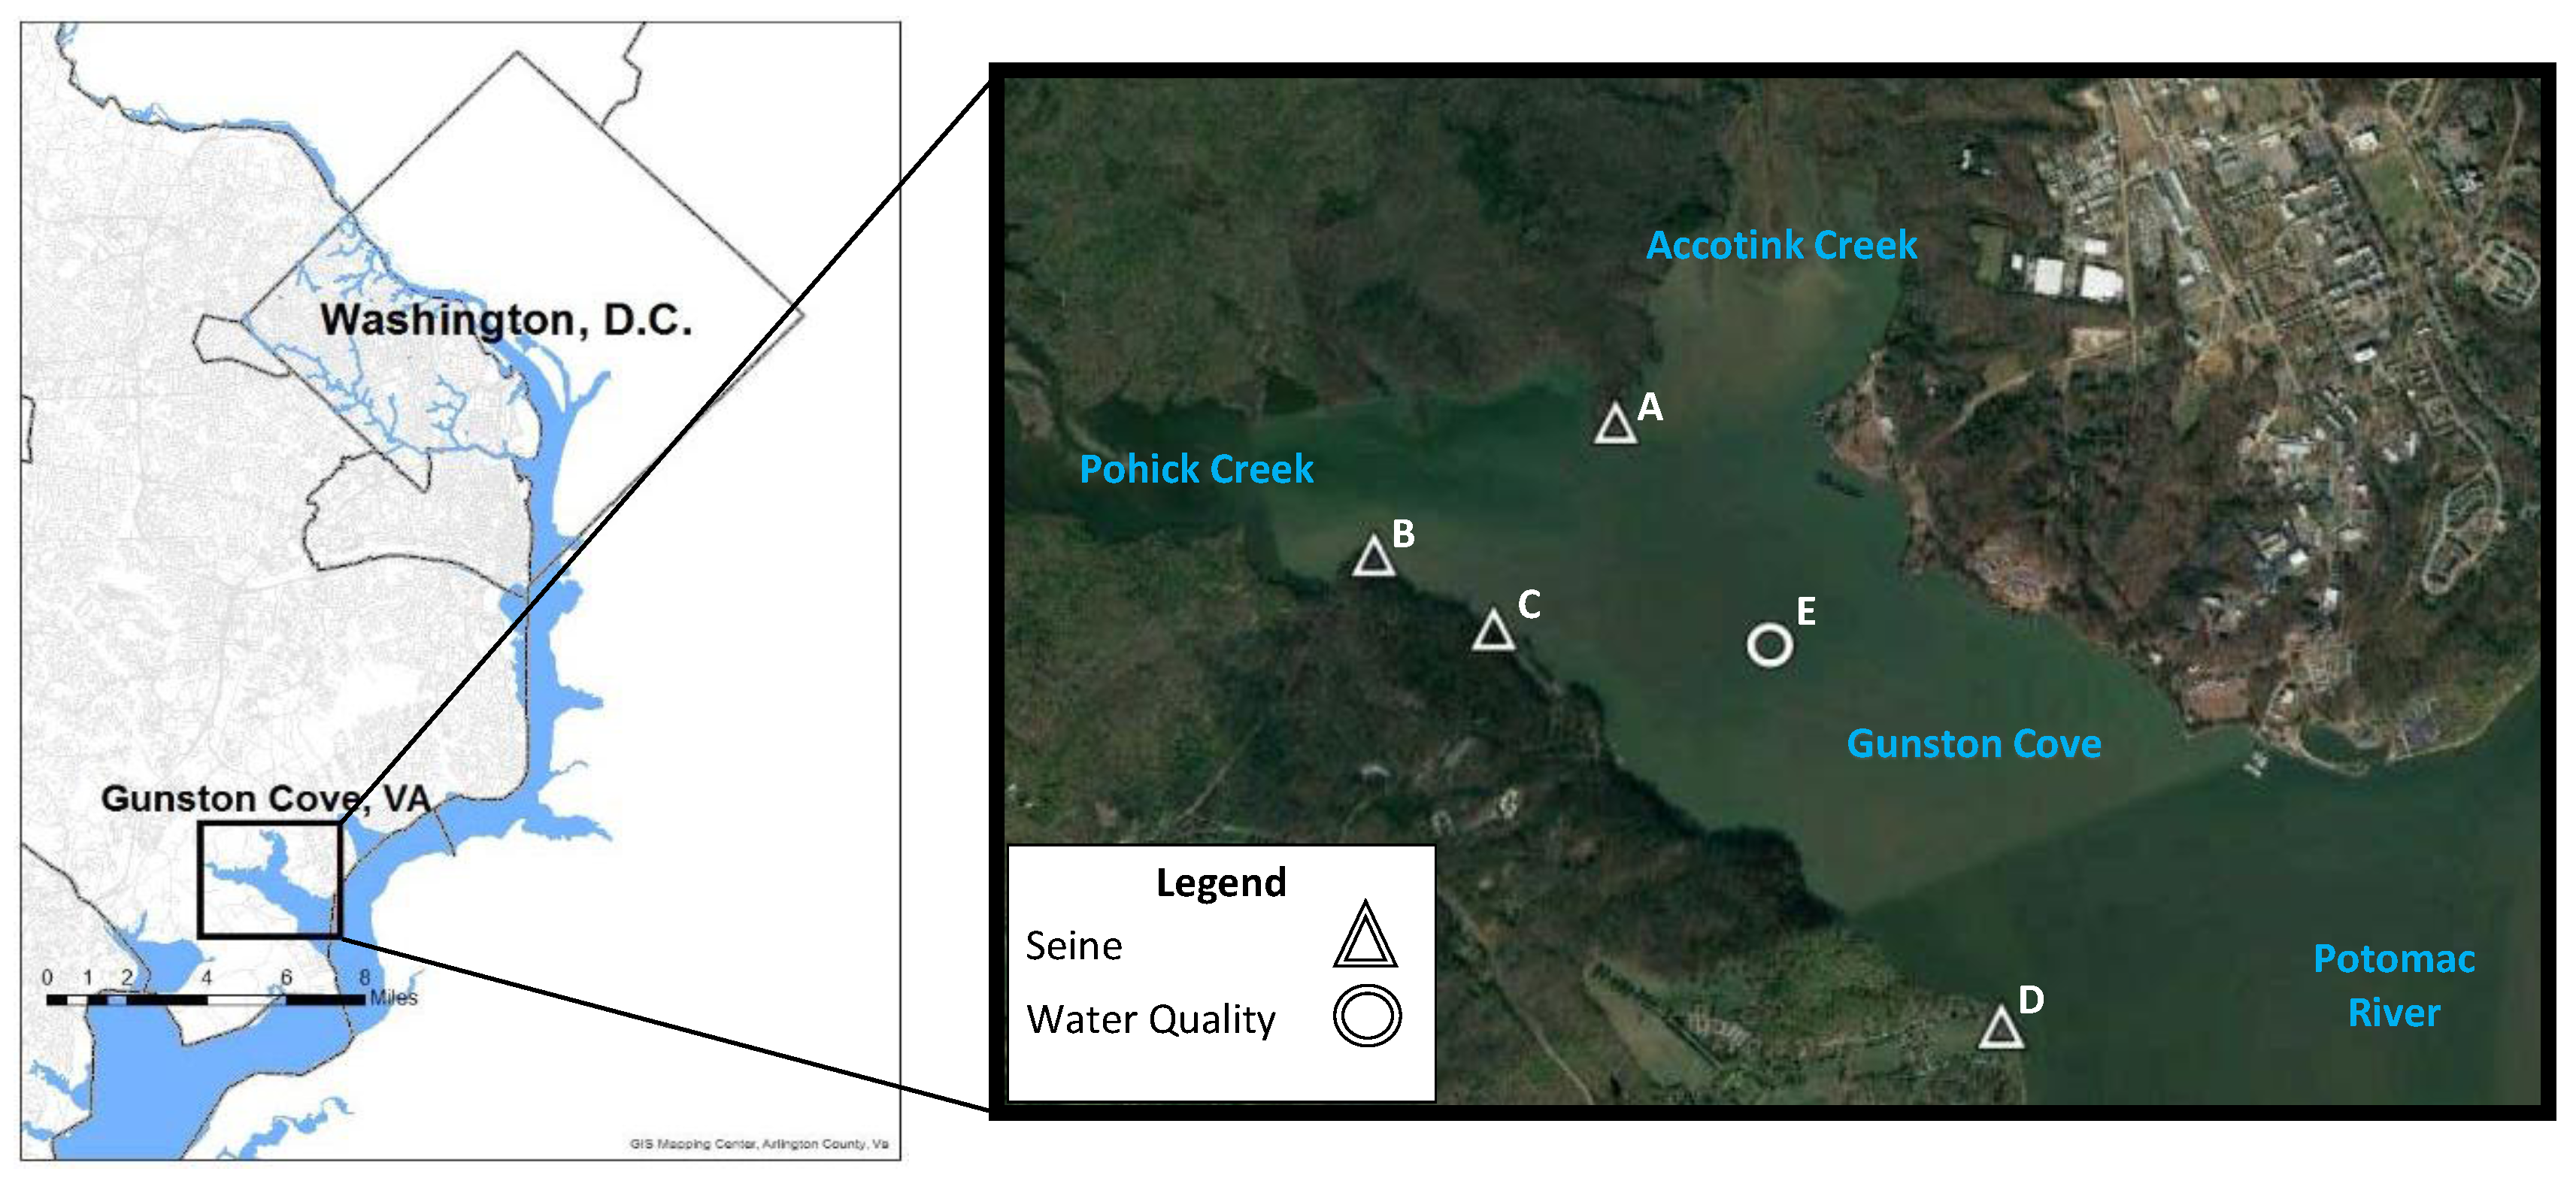
Figure 1. Location of study area and sampling sites. The sampling sites of seine hauls (AD) and water quality (E) are indicated in the figure.
Water 09 00421 g001
Figure 2. SAV coverage in Gunston Cove in years (a) 1984, (b) 1995, and (c) 2008 as representatives for the three time periods of 1984–1992, 1993–2004, and 2005–2011, respectively (data source: http://web.vims.edu/bio/sav/gis_data.html). The inset photographs are both taken in Gunston Cove, and are from an algal bloom in 1983 in the upper right corner of image (a), and the SAV growth in 2012 in the upper right corner of image (c).
Water 09 00421 g002
Figure 3. SAV acreage plotted with Chlorophyll a and Secchi Depth measurements in Gunston Cove from 1994–2010. Time series of measurements started a year after SAV appeared in Gunston Cove.
Water 09 00421 g003
Figure 4. Total fish abundance per seine haul for the three time periods of 1985–1992, 1993–2004, and 2005–2011. Error bars indicate standard error. The labels ‘no’, ‘medium’, and ‘high’ refer to the SAV cover.
Water 09 00421 g004
Figure 5. Non-metric multidimensional scaling plot of fish community structure. Each symbol represents the fish community structure in Gunston Cove of one year based on relative abundance. The color-coding of the years represents the amount of SAV cover in those years categorized as ‘no’, ‘medium’, and ‘high’ cover (see Figure 2). The asterisks in the legend indicate that the fish community structure between those three time periods was significantly different from each other.
Water 09 00421 g005
Figure 6. Relative abundance of the species that contribute at least 5% to the differences in fish community structure between the three time periods. Species are displayed in ascending order of total abundance from top to bottom.
Water 09 00421 g006