
Water versus Wireless Coverage in Rural Mali: Links and Paradoxes


Abstract
:1. Introduction
1.1. Background
1.2. The Link between Water and Telecommunications in Developing Contexts
1.3. Research Objectives
- (a)
- Research hypothesis 1: Wireless coverage in the study area is higher than drinking water coverage.
- (b)
- Research hypothesis 2: Widespread wireless coverage may be contributing to enhanced access to improved water sources.
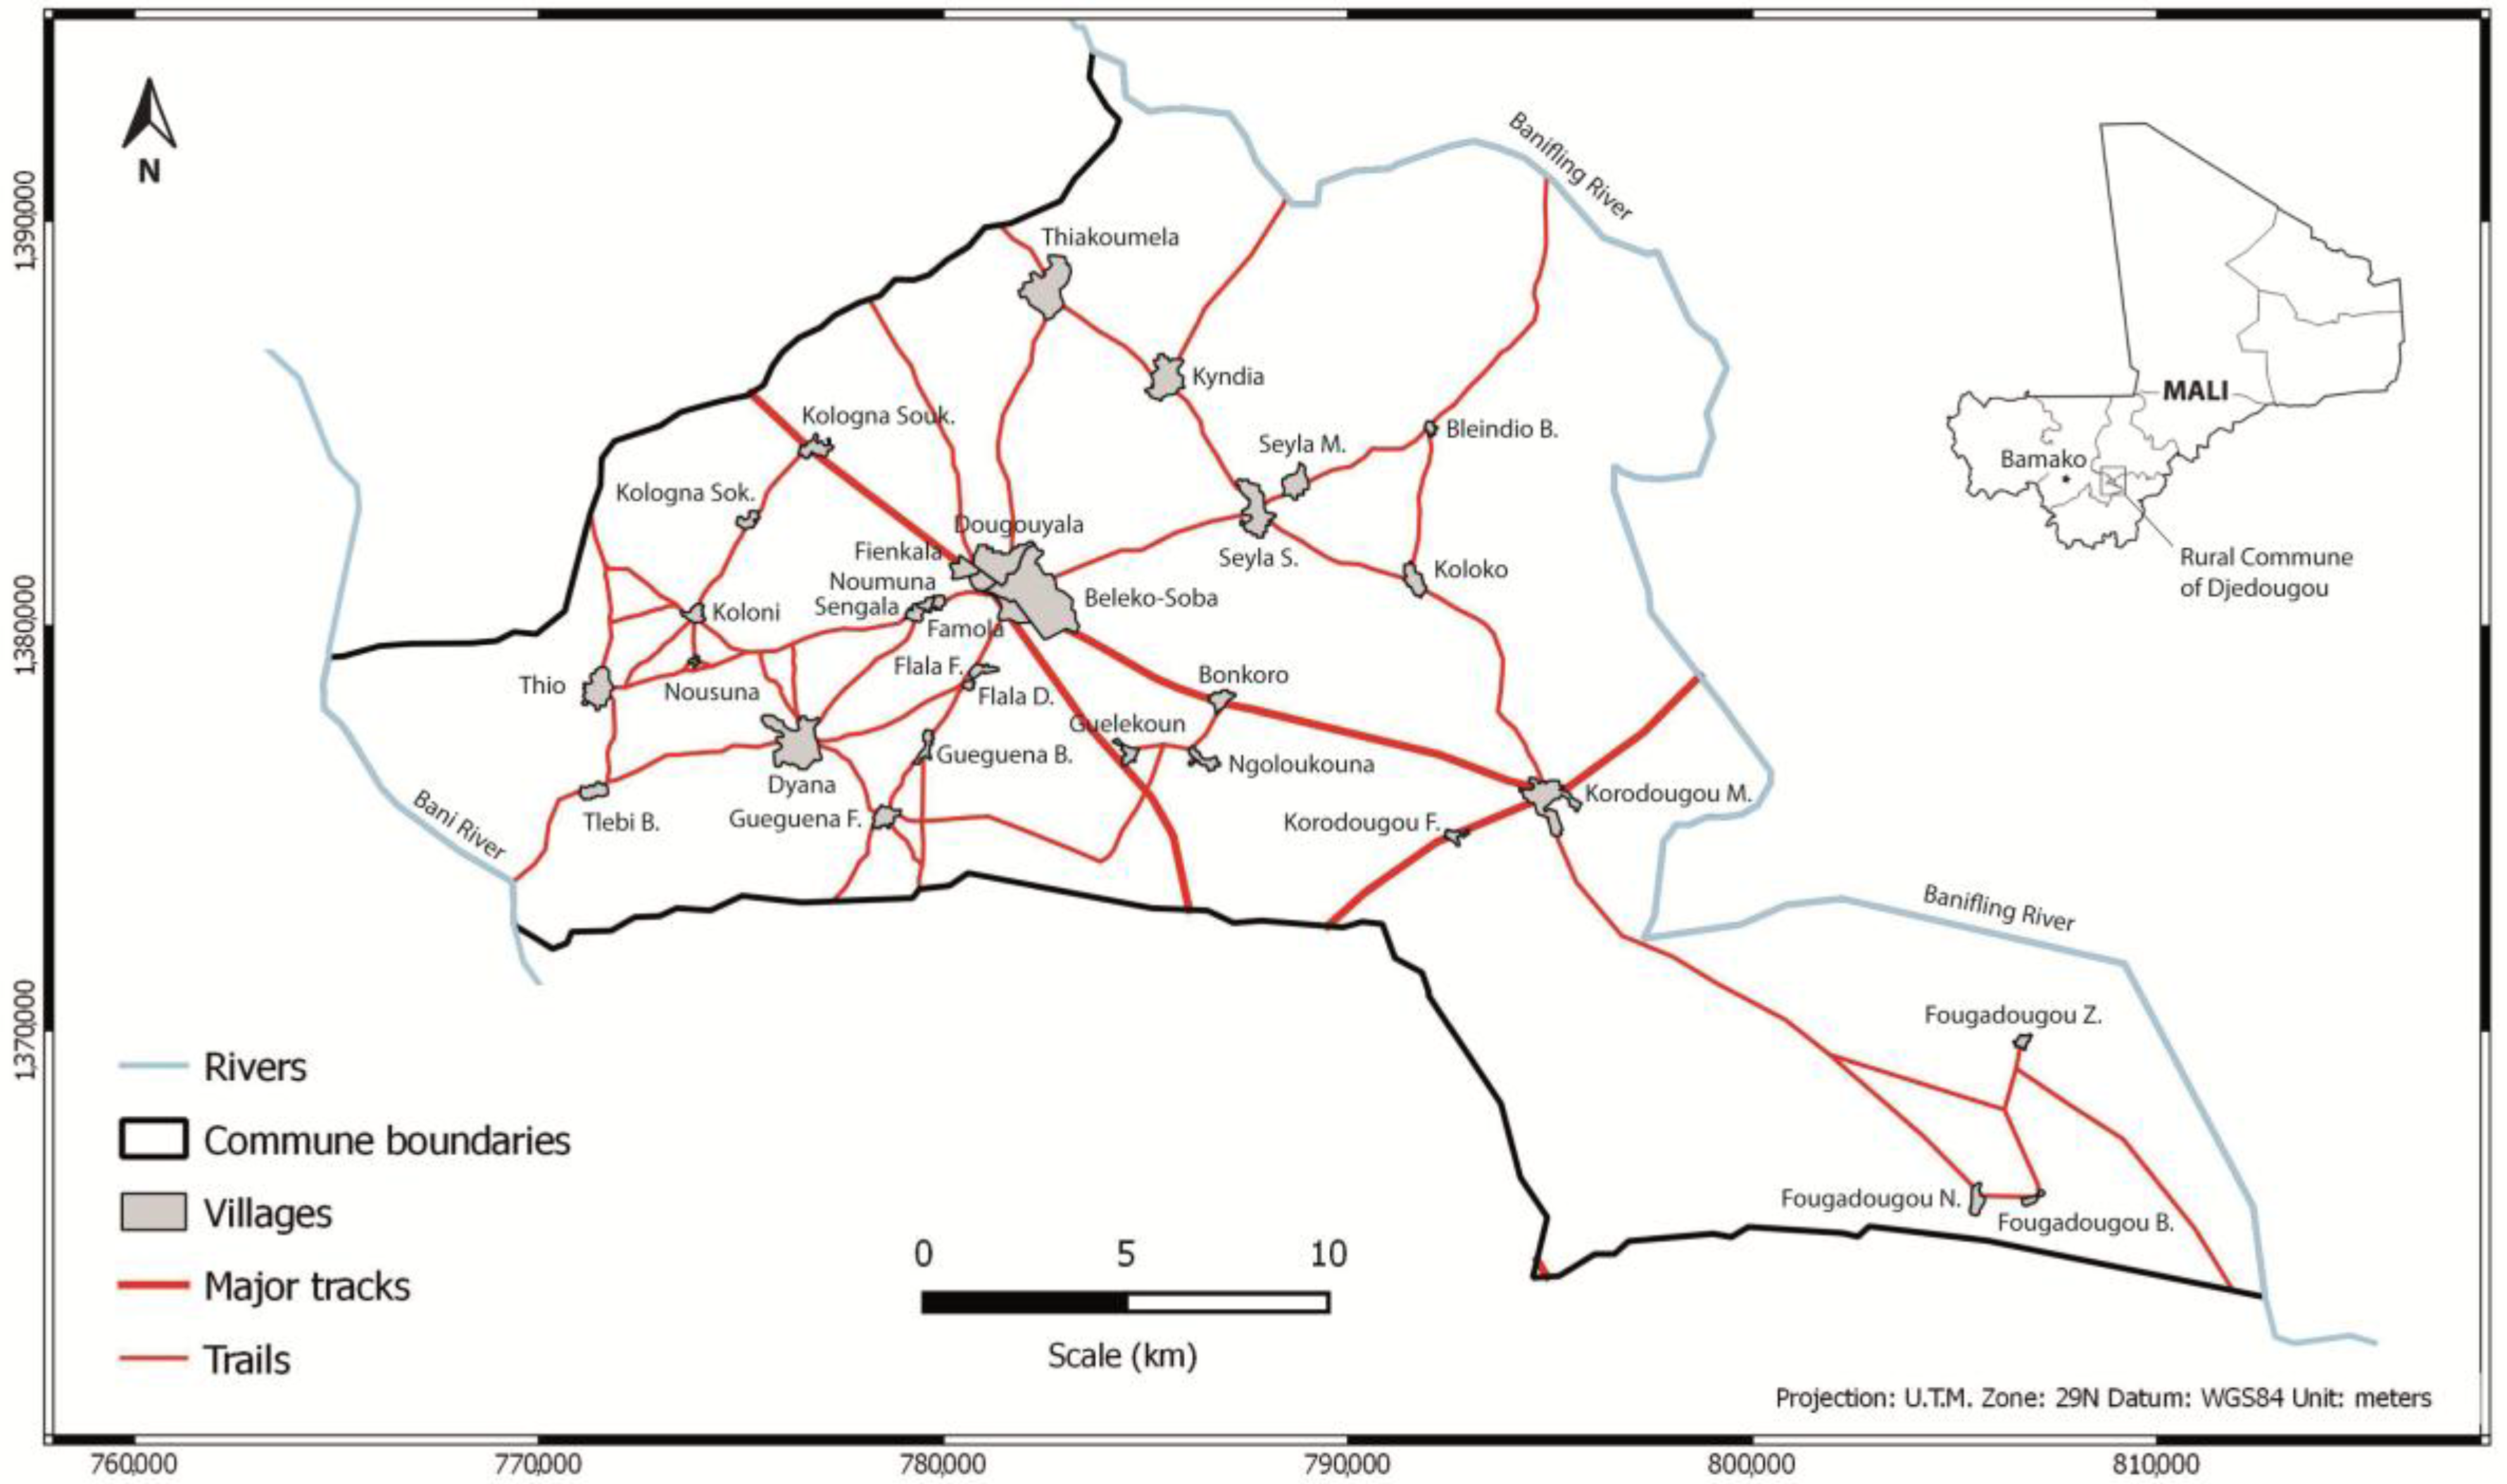
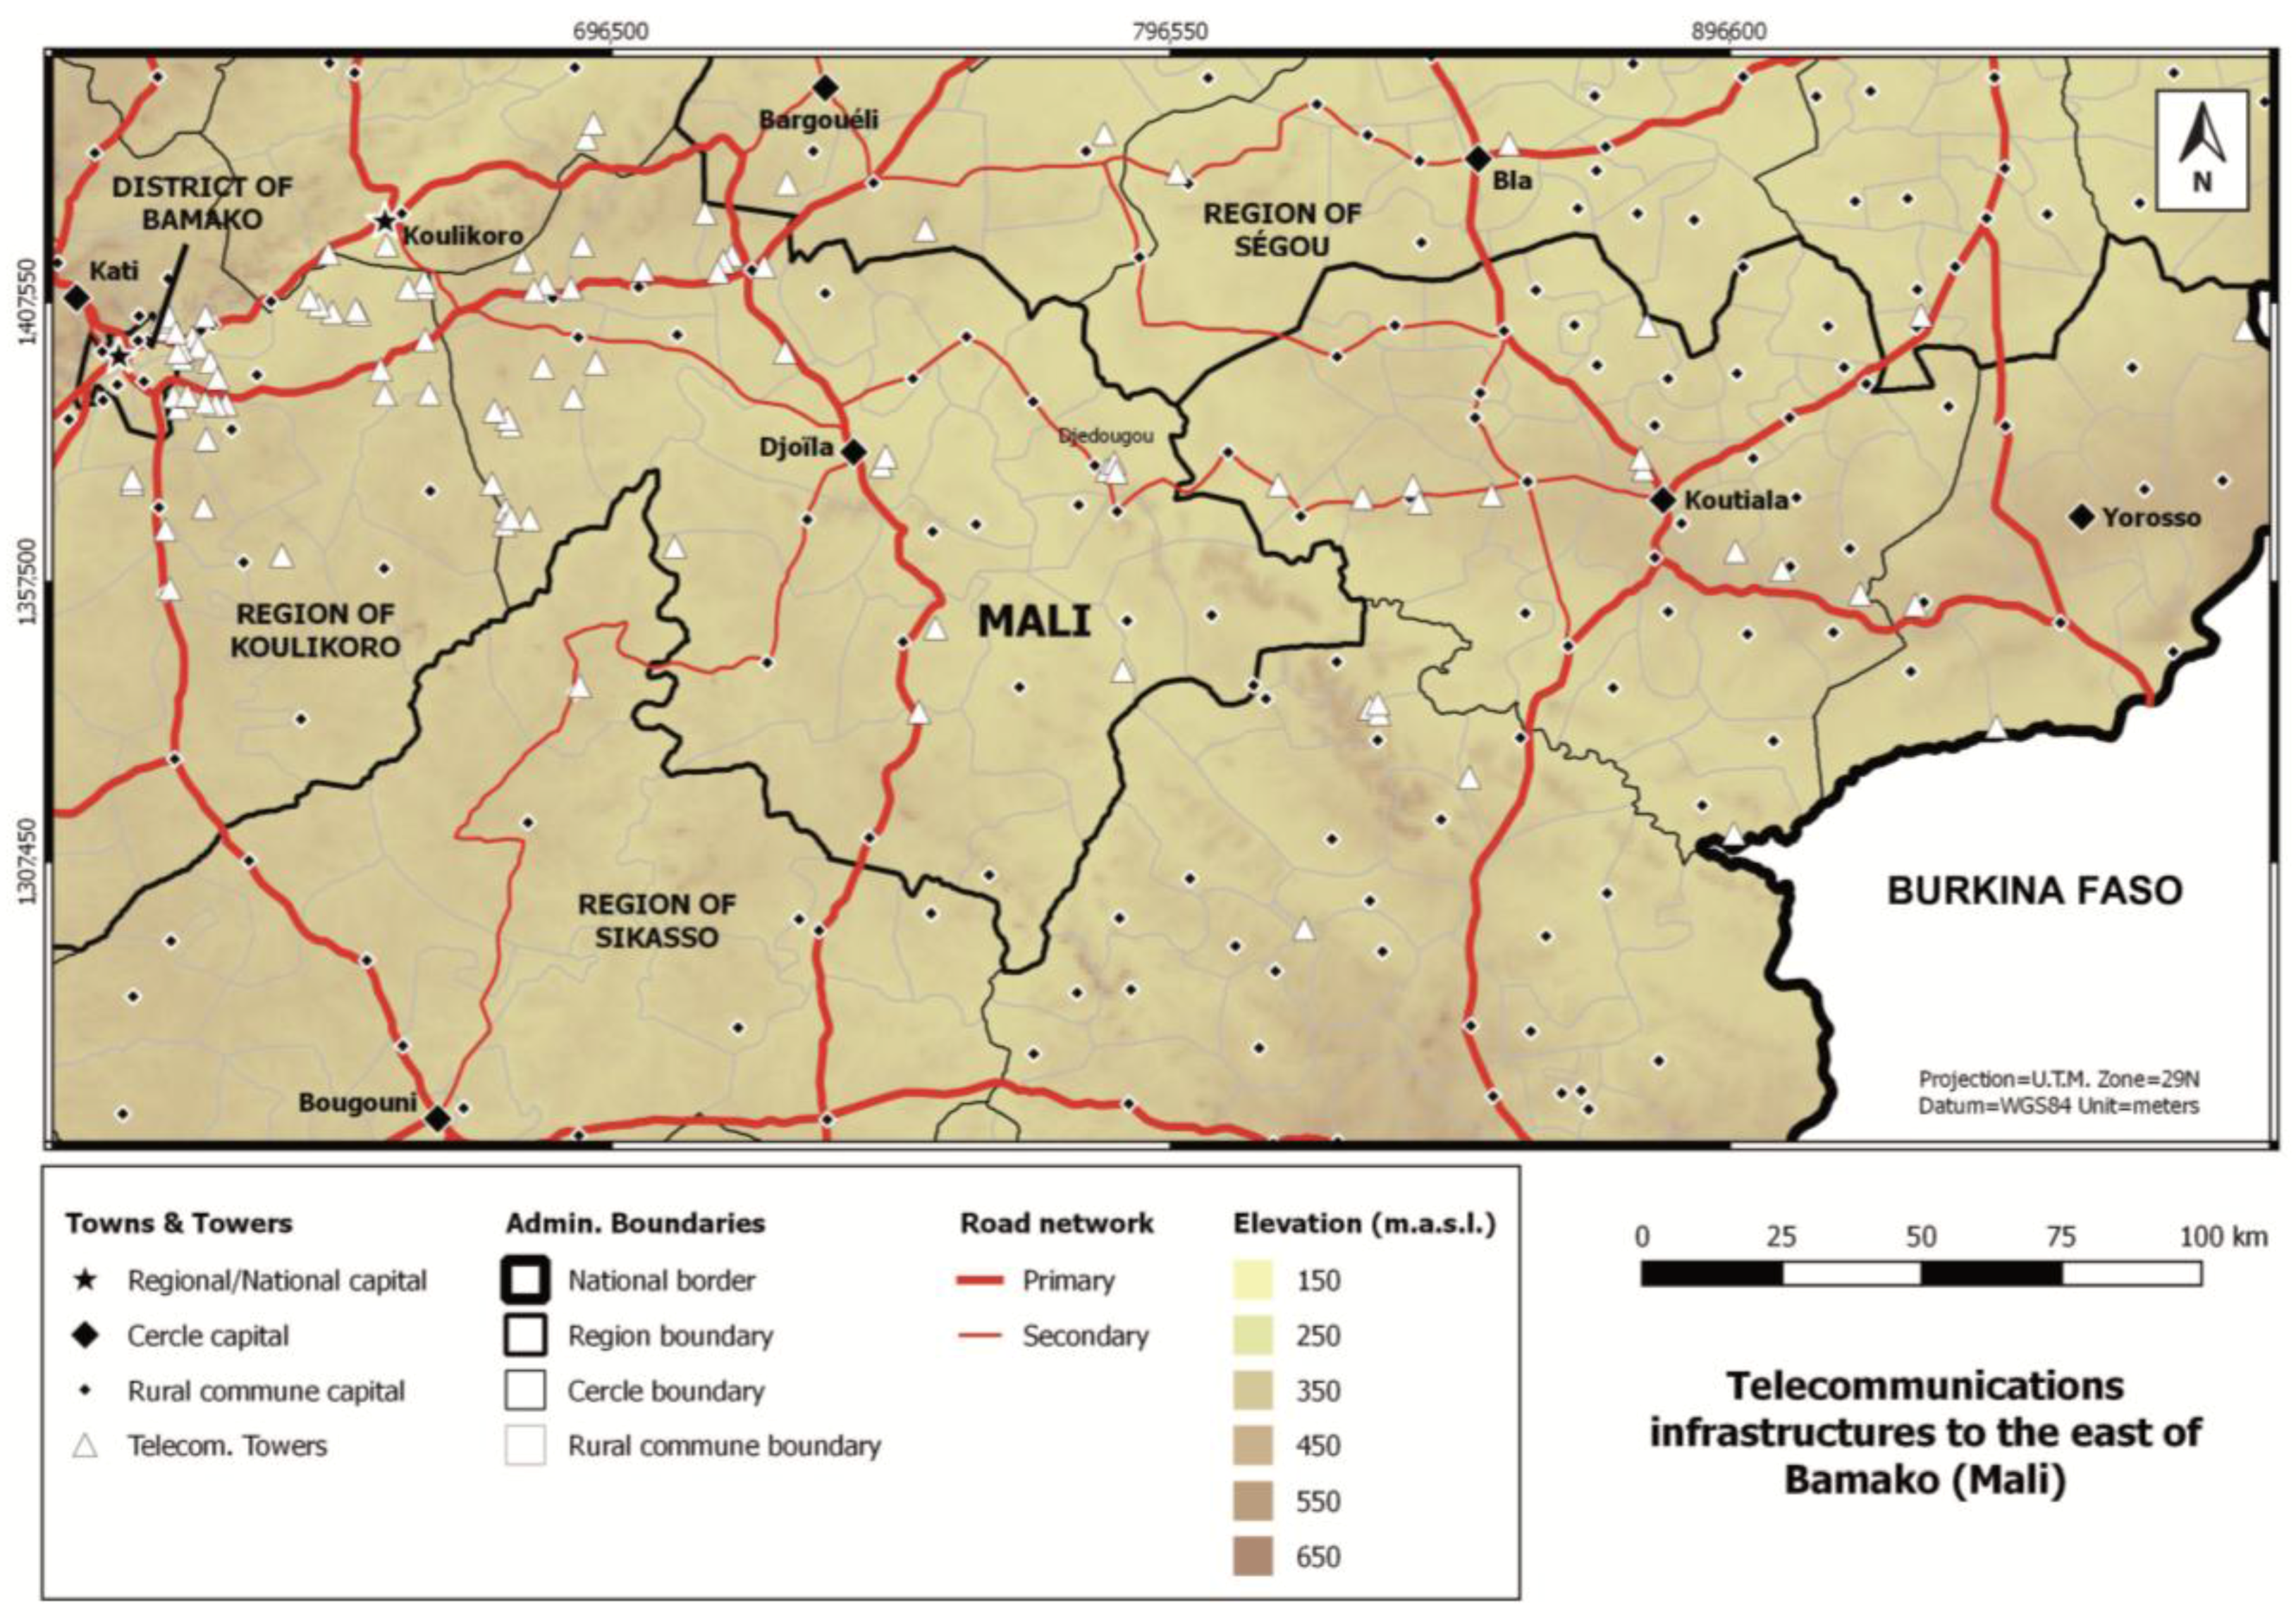
2. Study Area
3. Materials and Methods
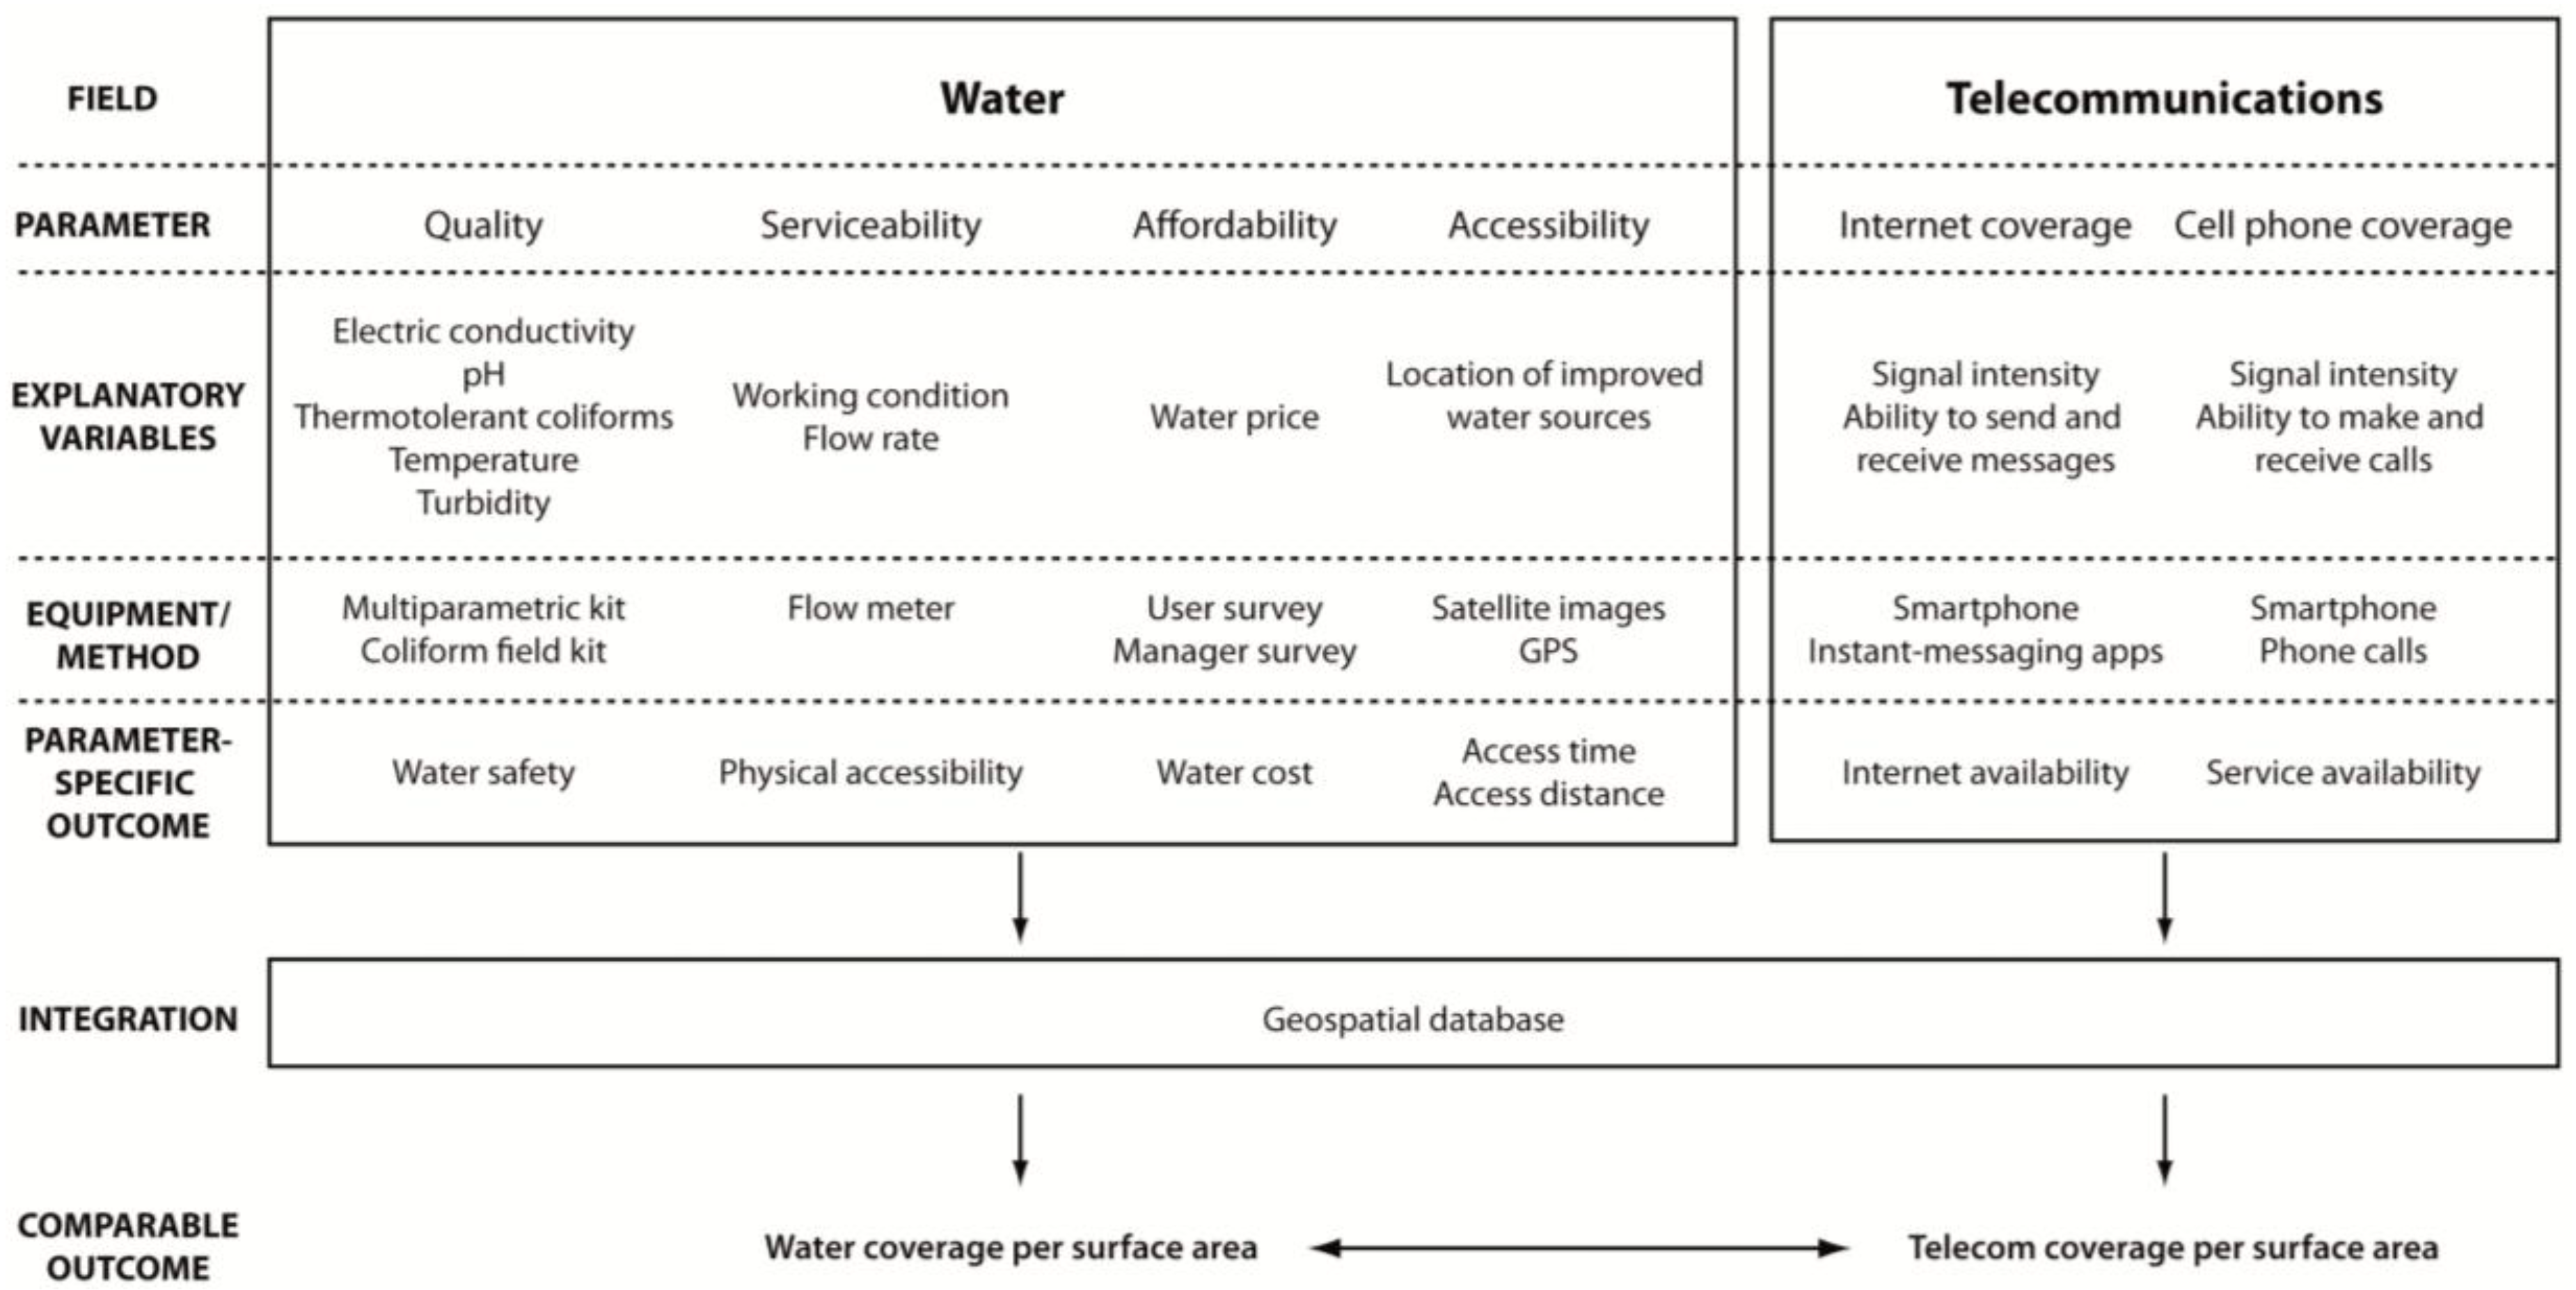
3.1. Conceptual Framework
3.2. Field Survey
3.2.1. Water Data
3.2.2. Wireless Data
3.3. GIS Database Development
3.4. Survey of Water Committees
4. Results
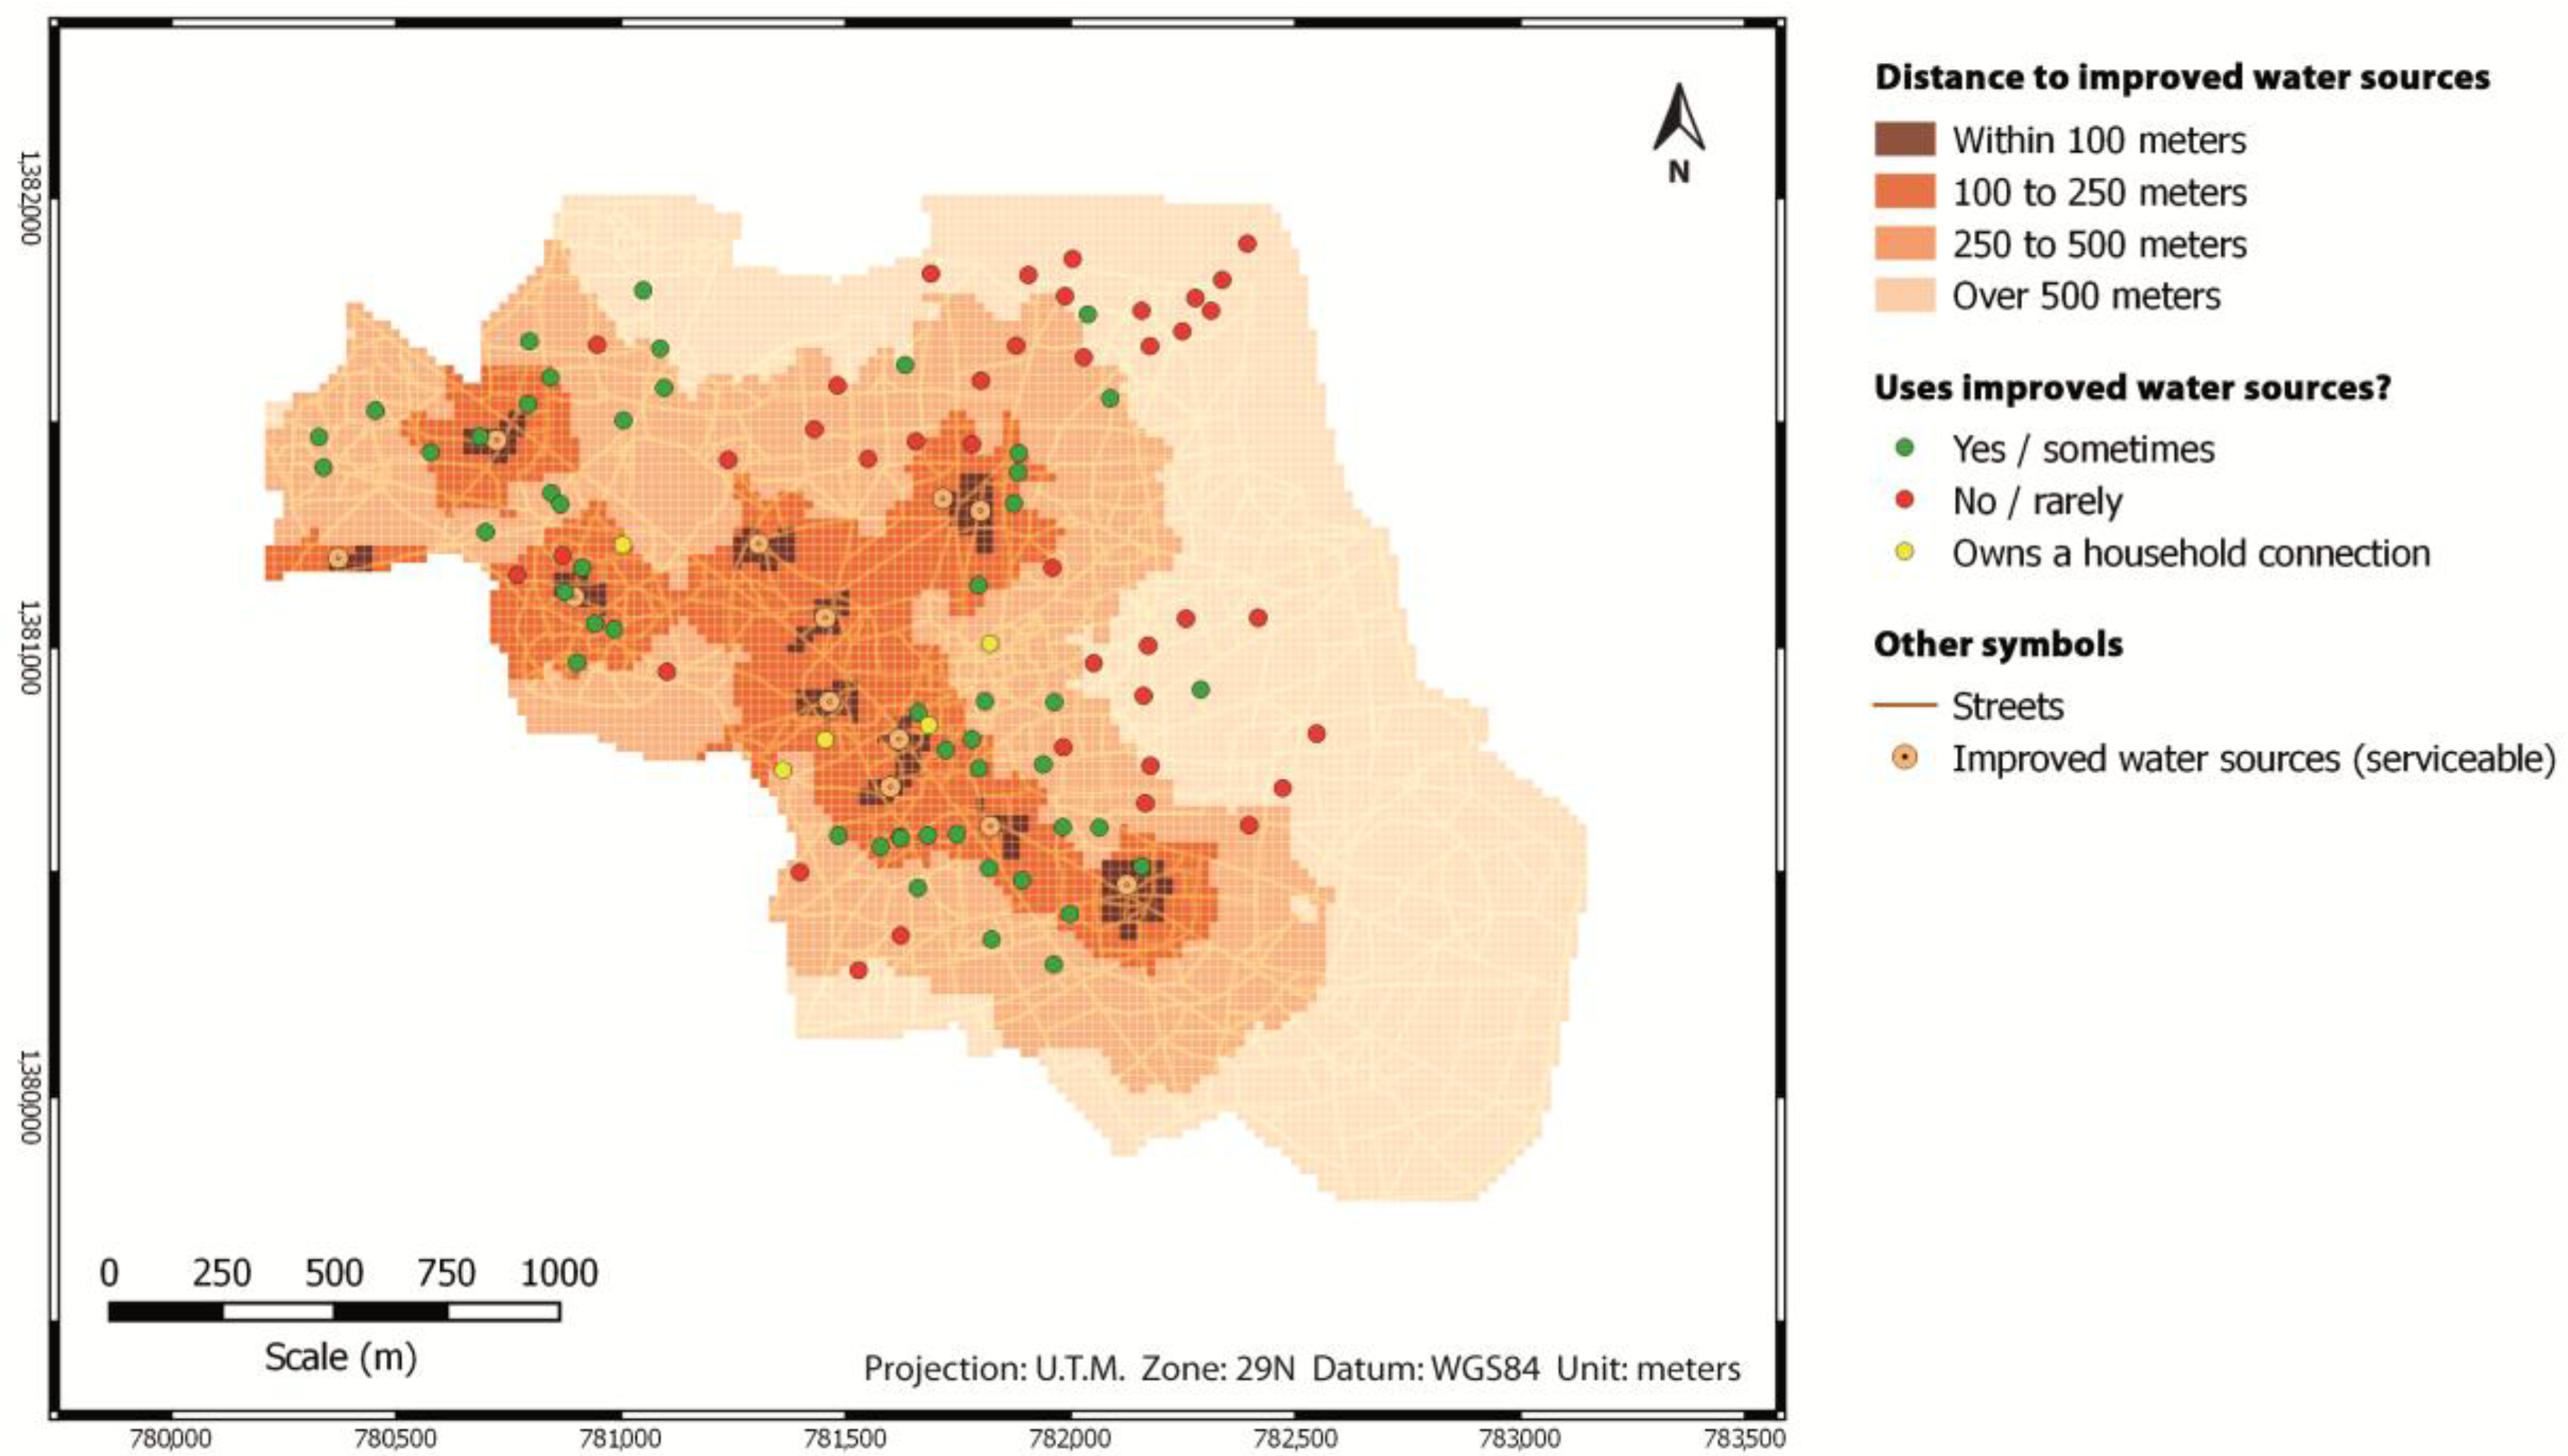
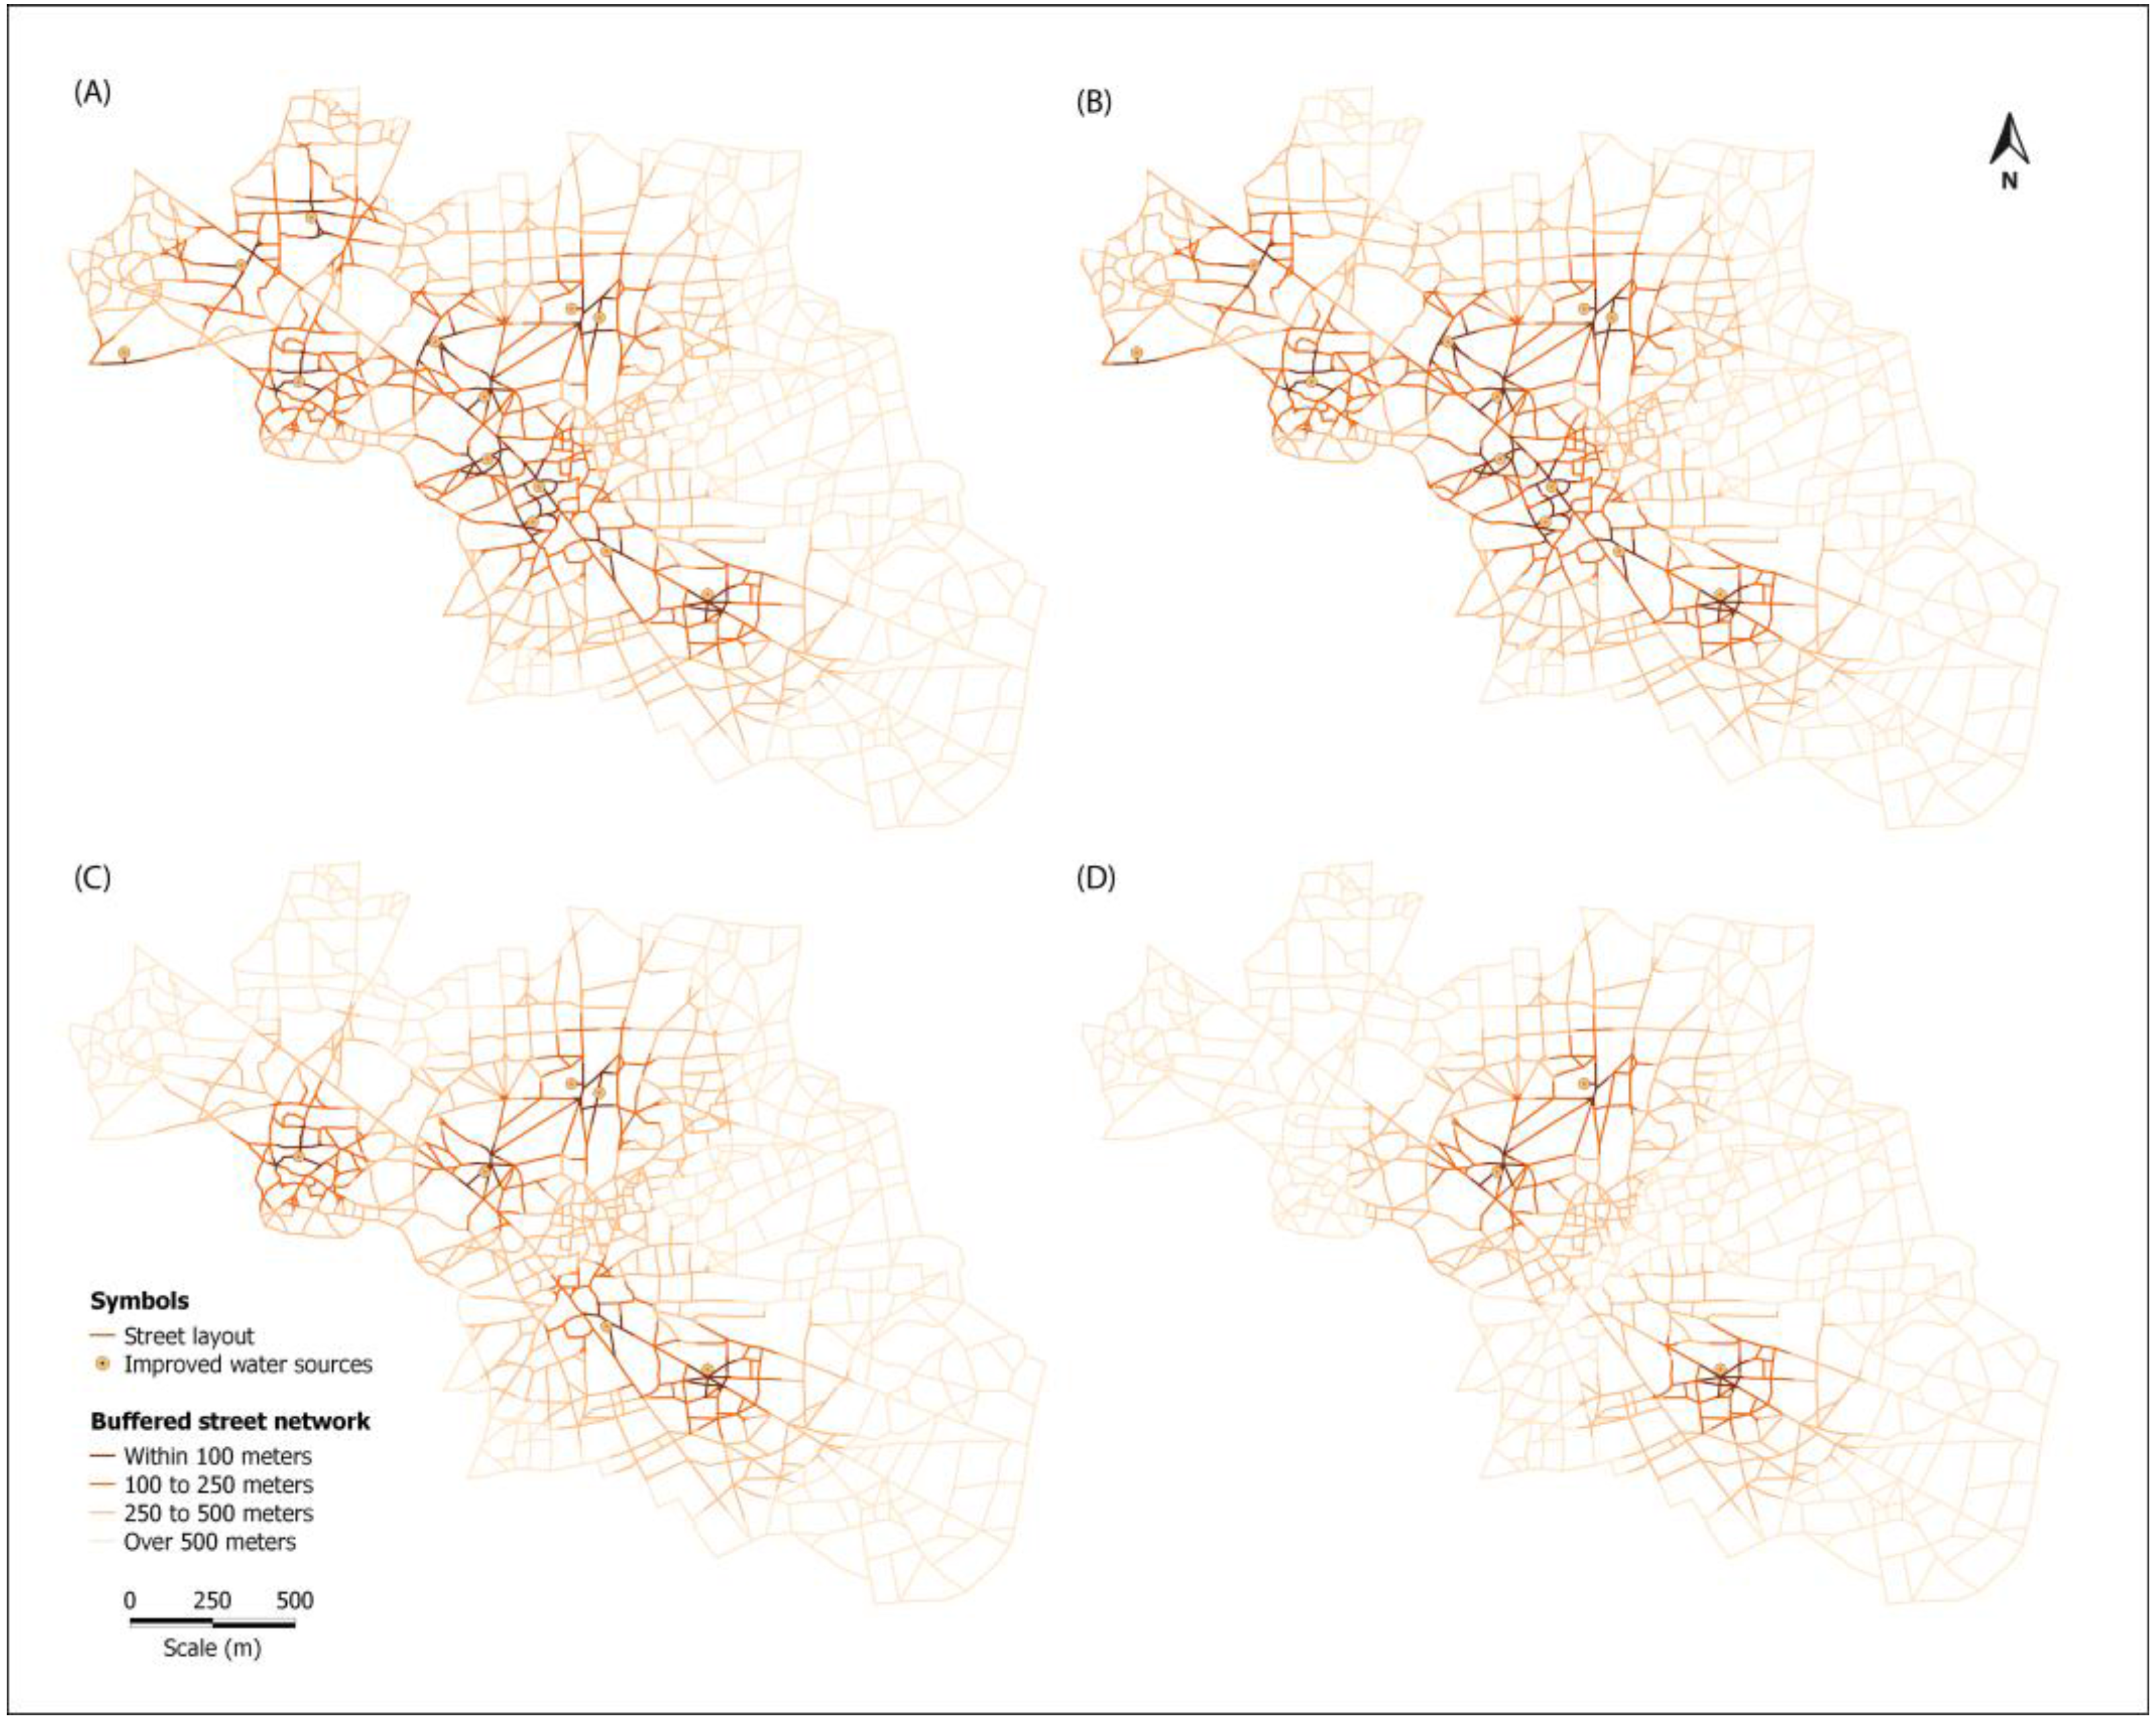
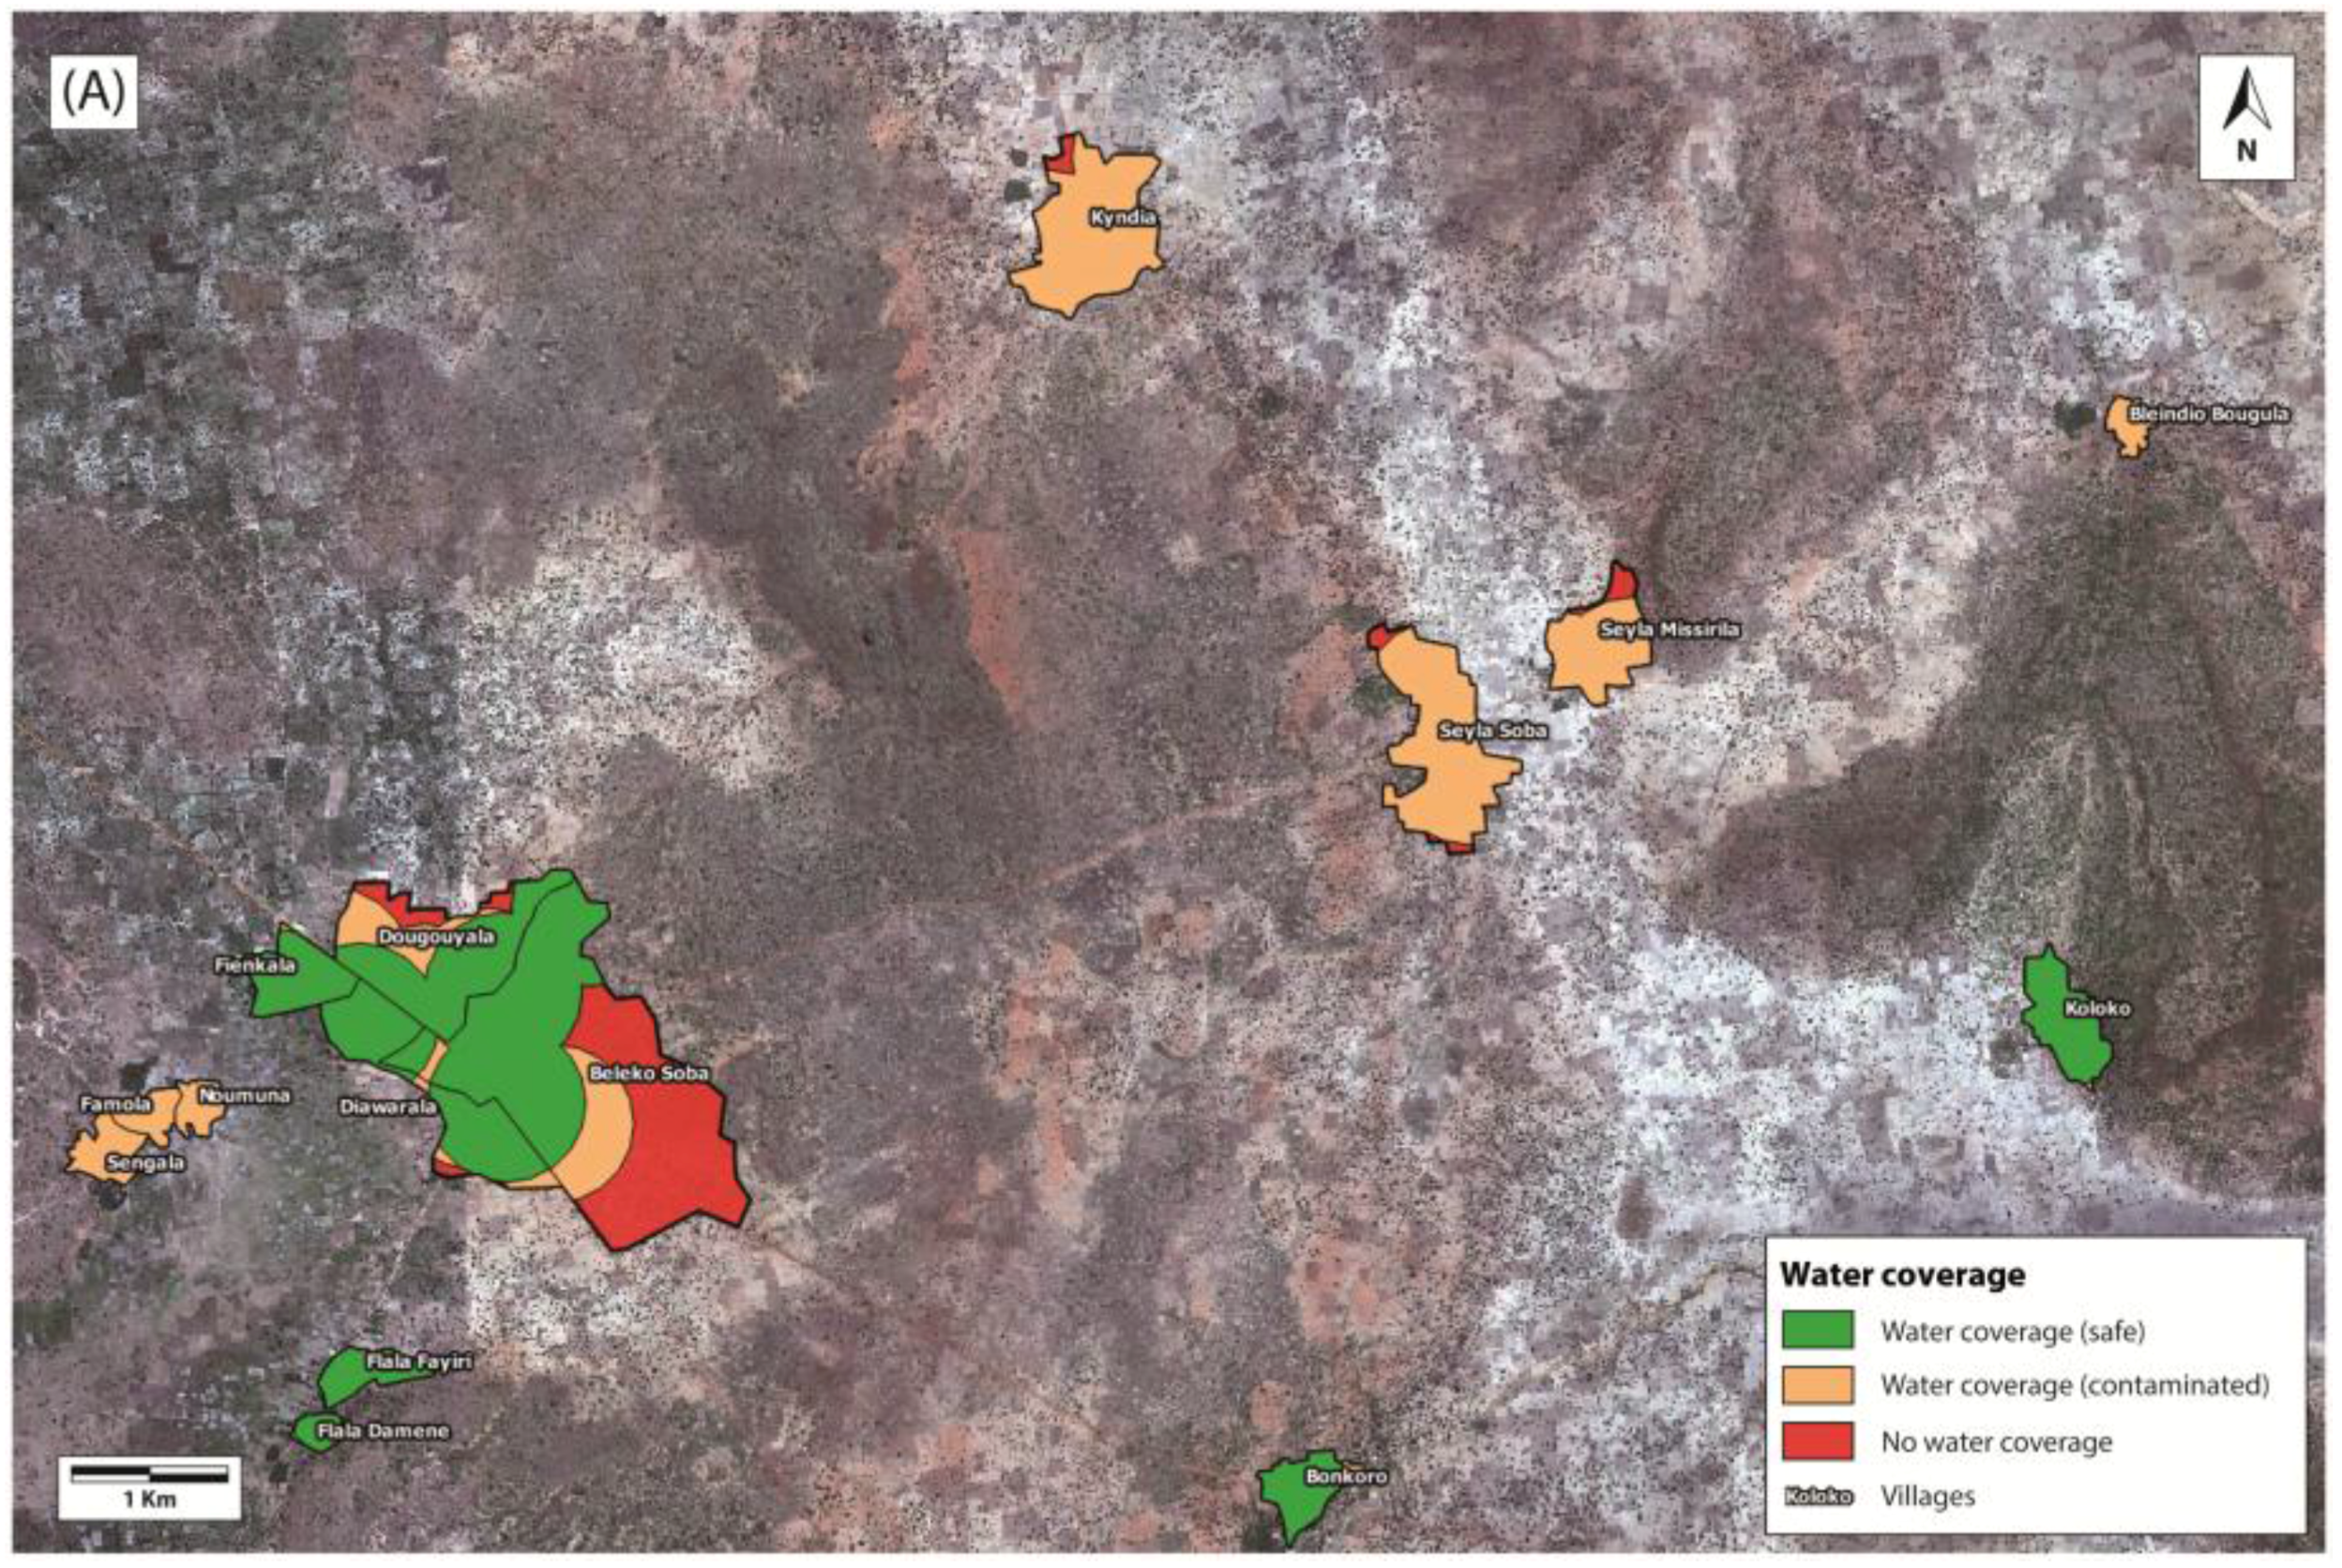
4.1. Water Coverage
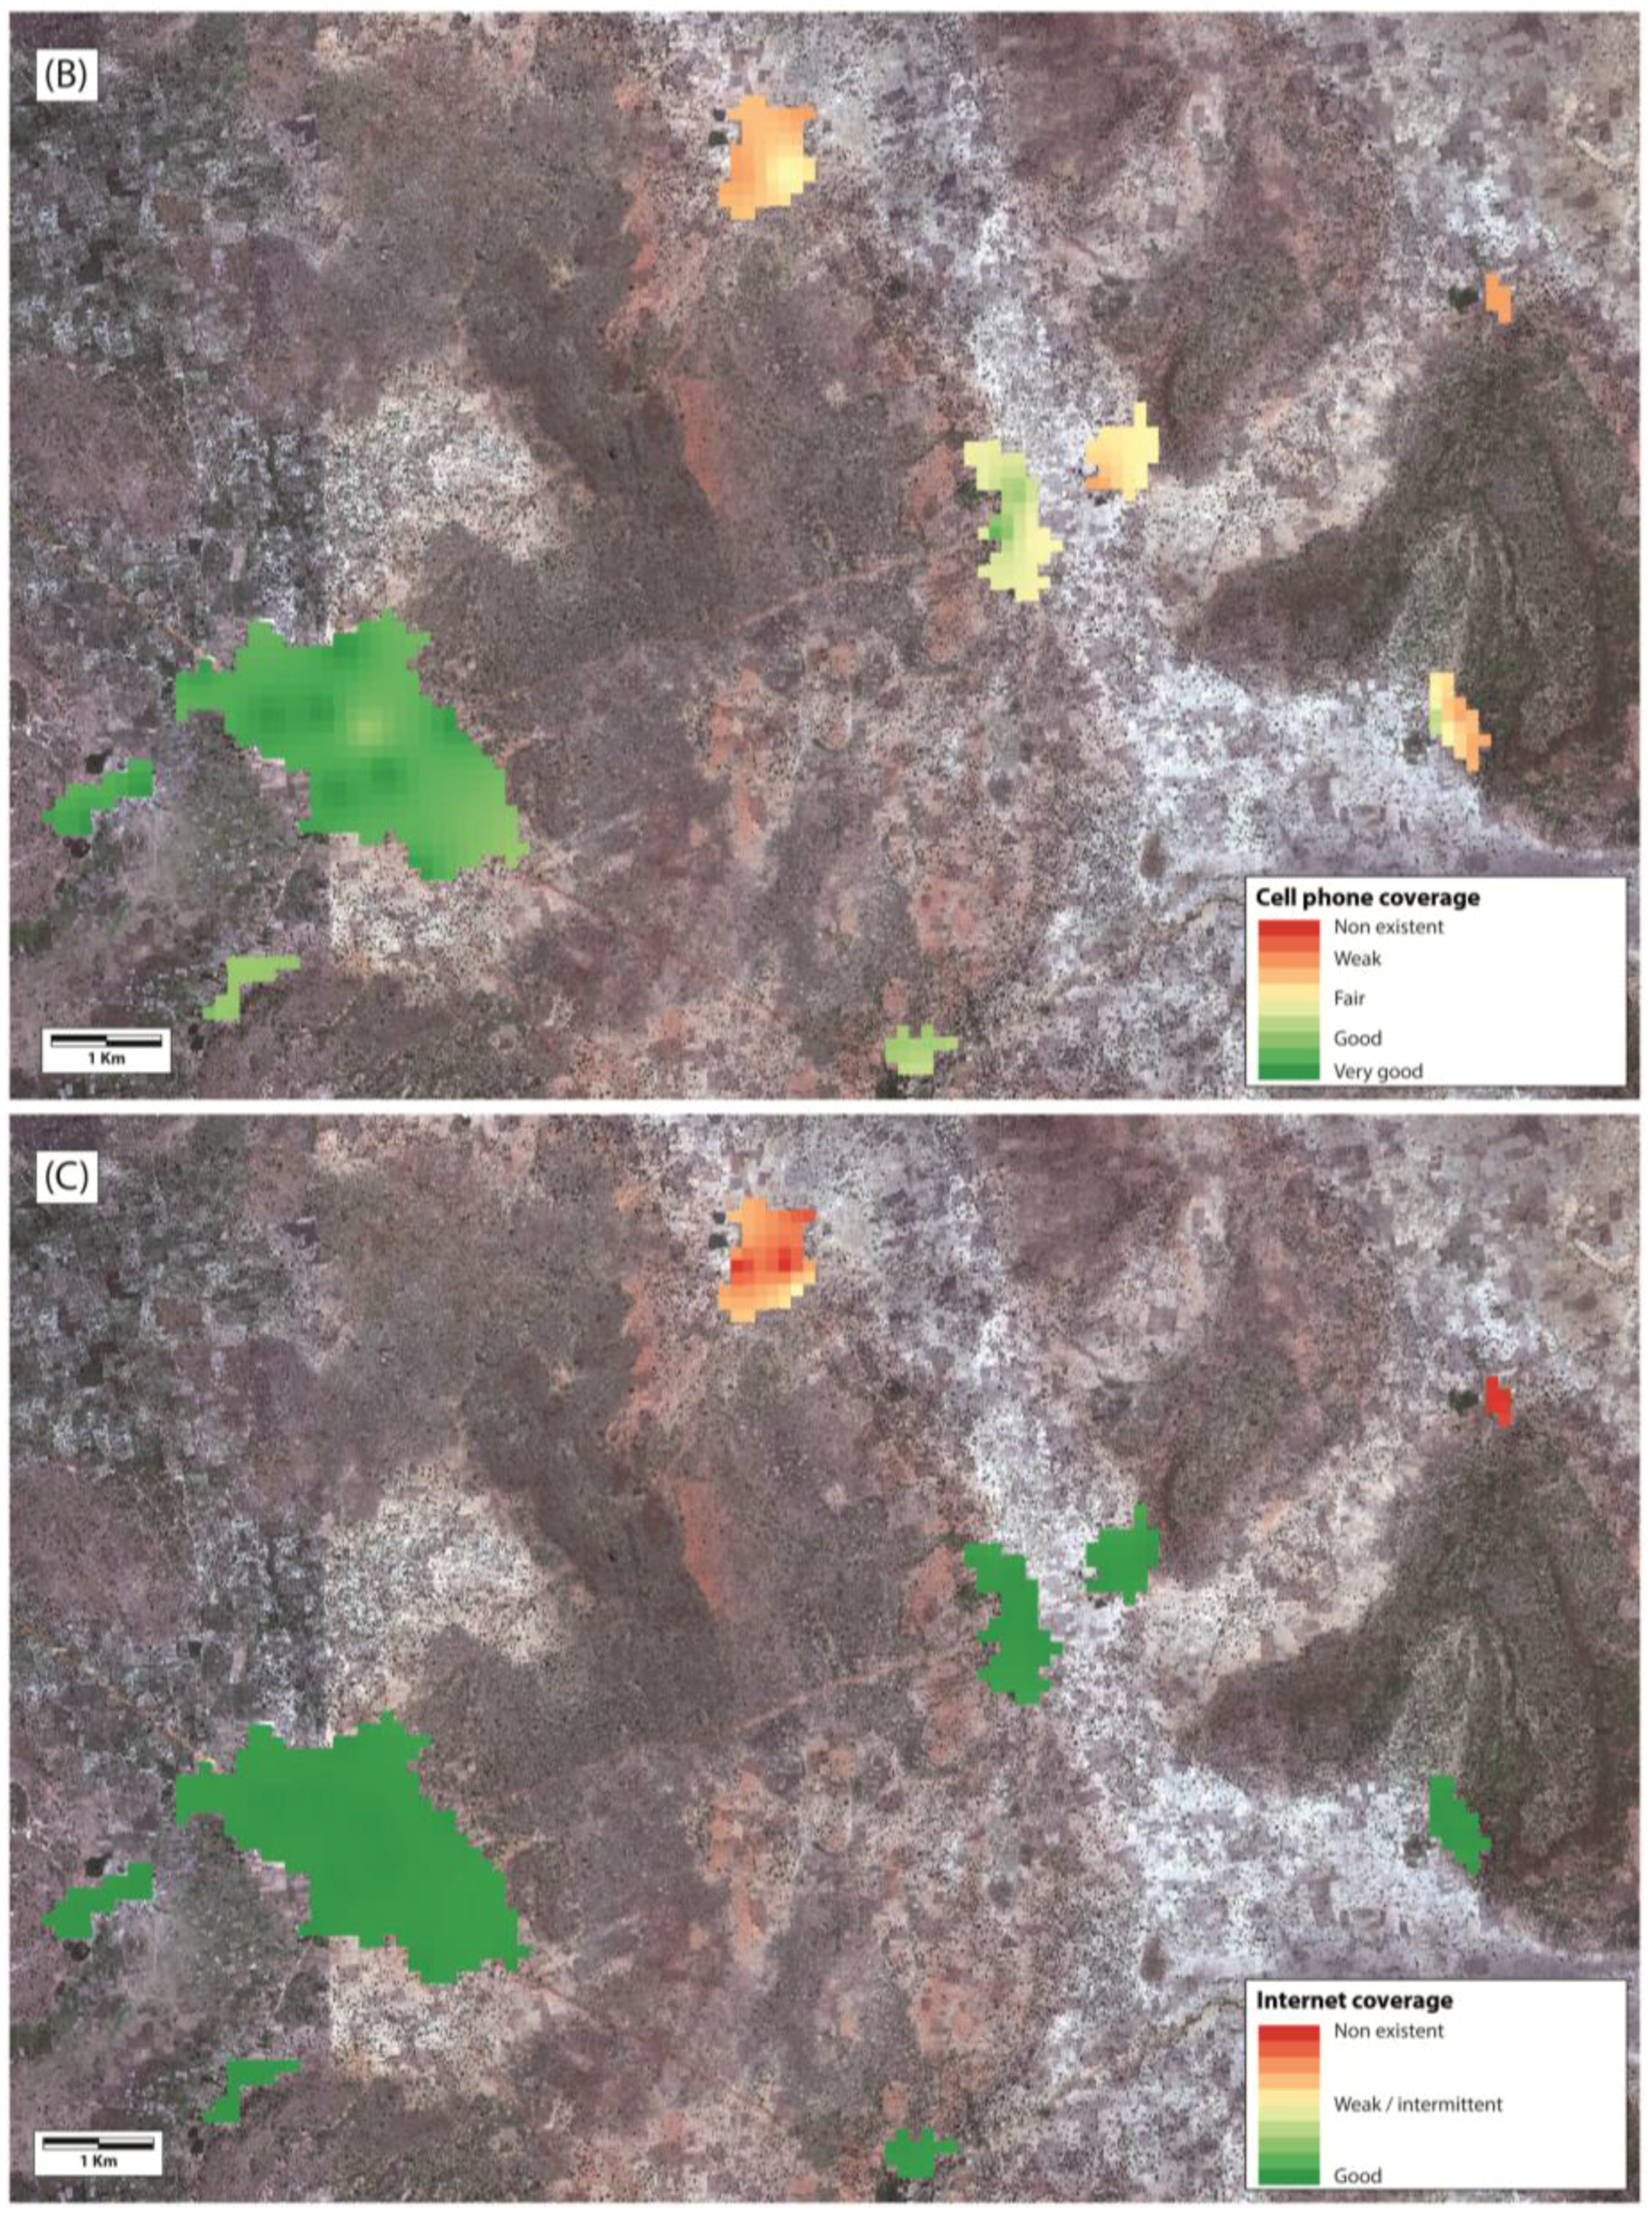
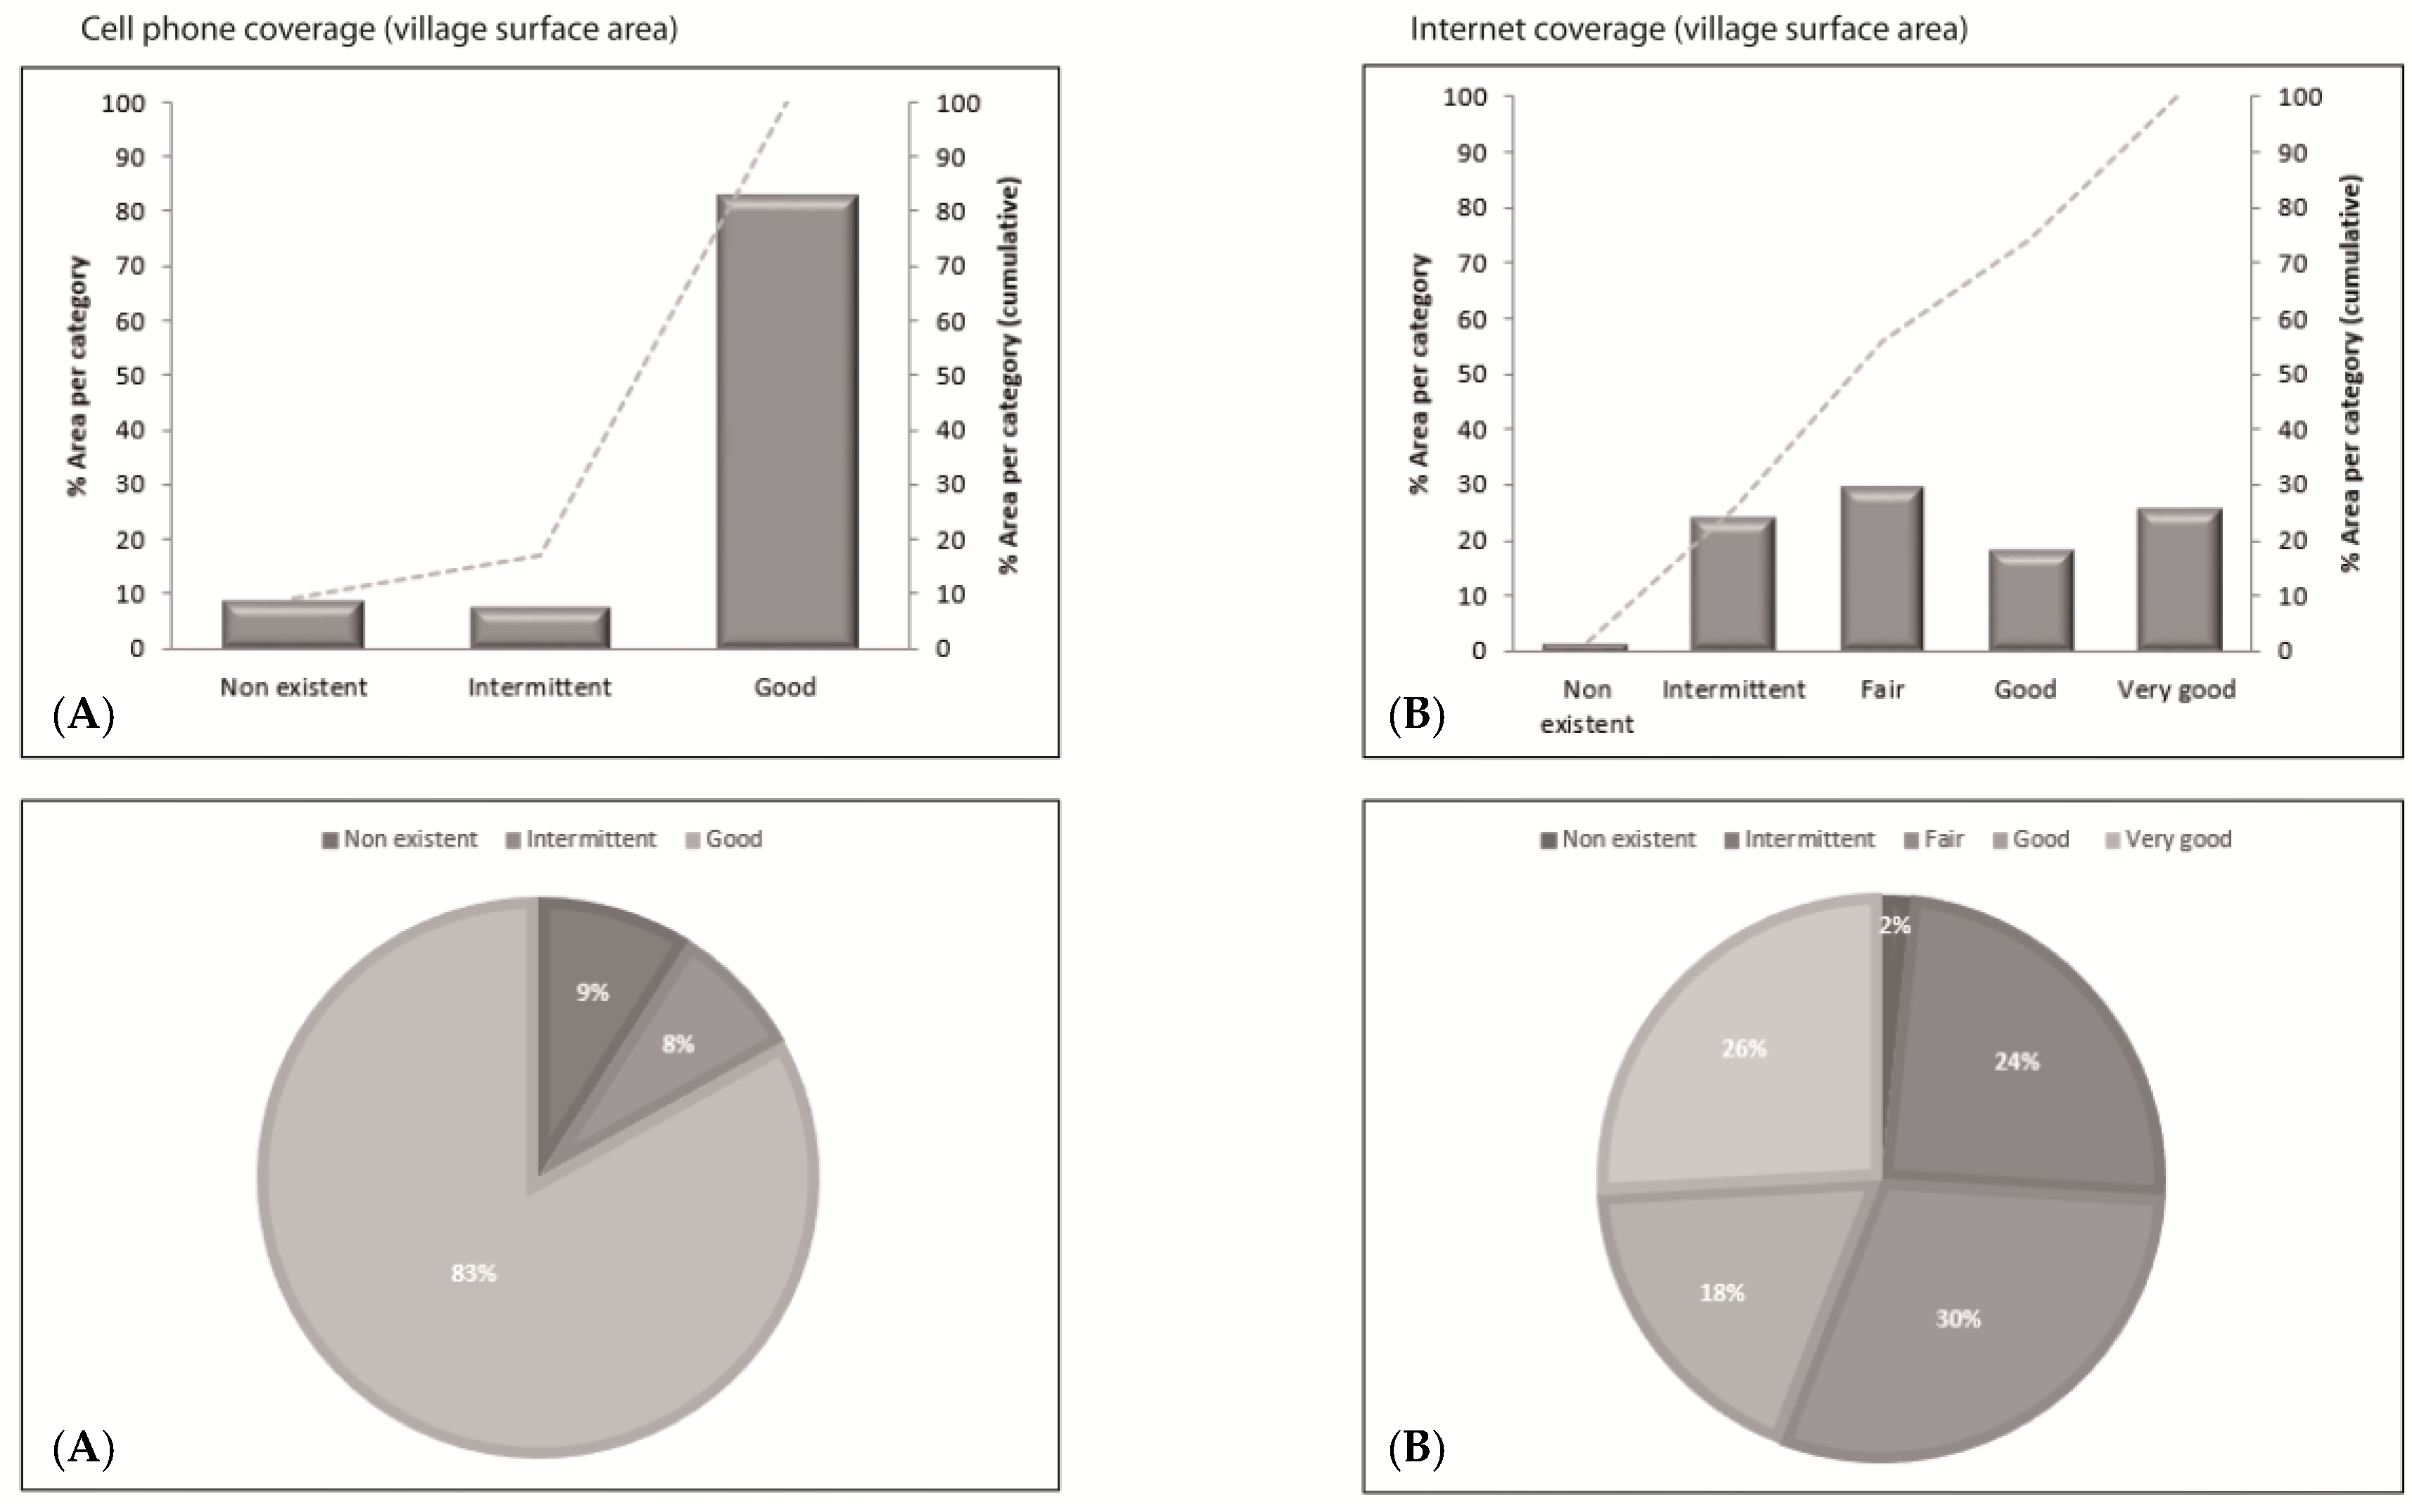
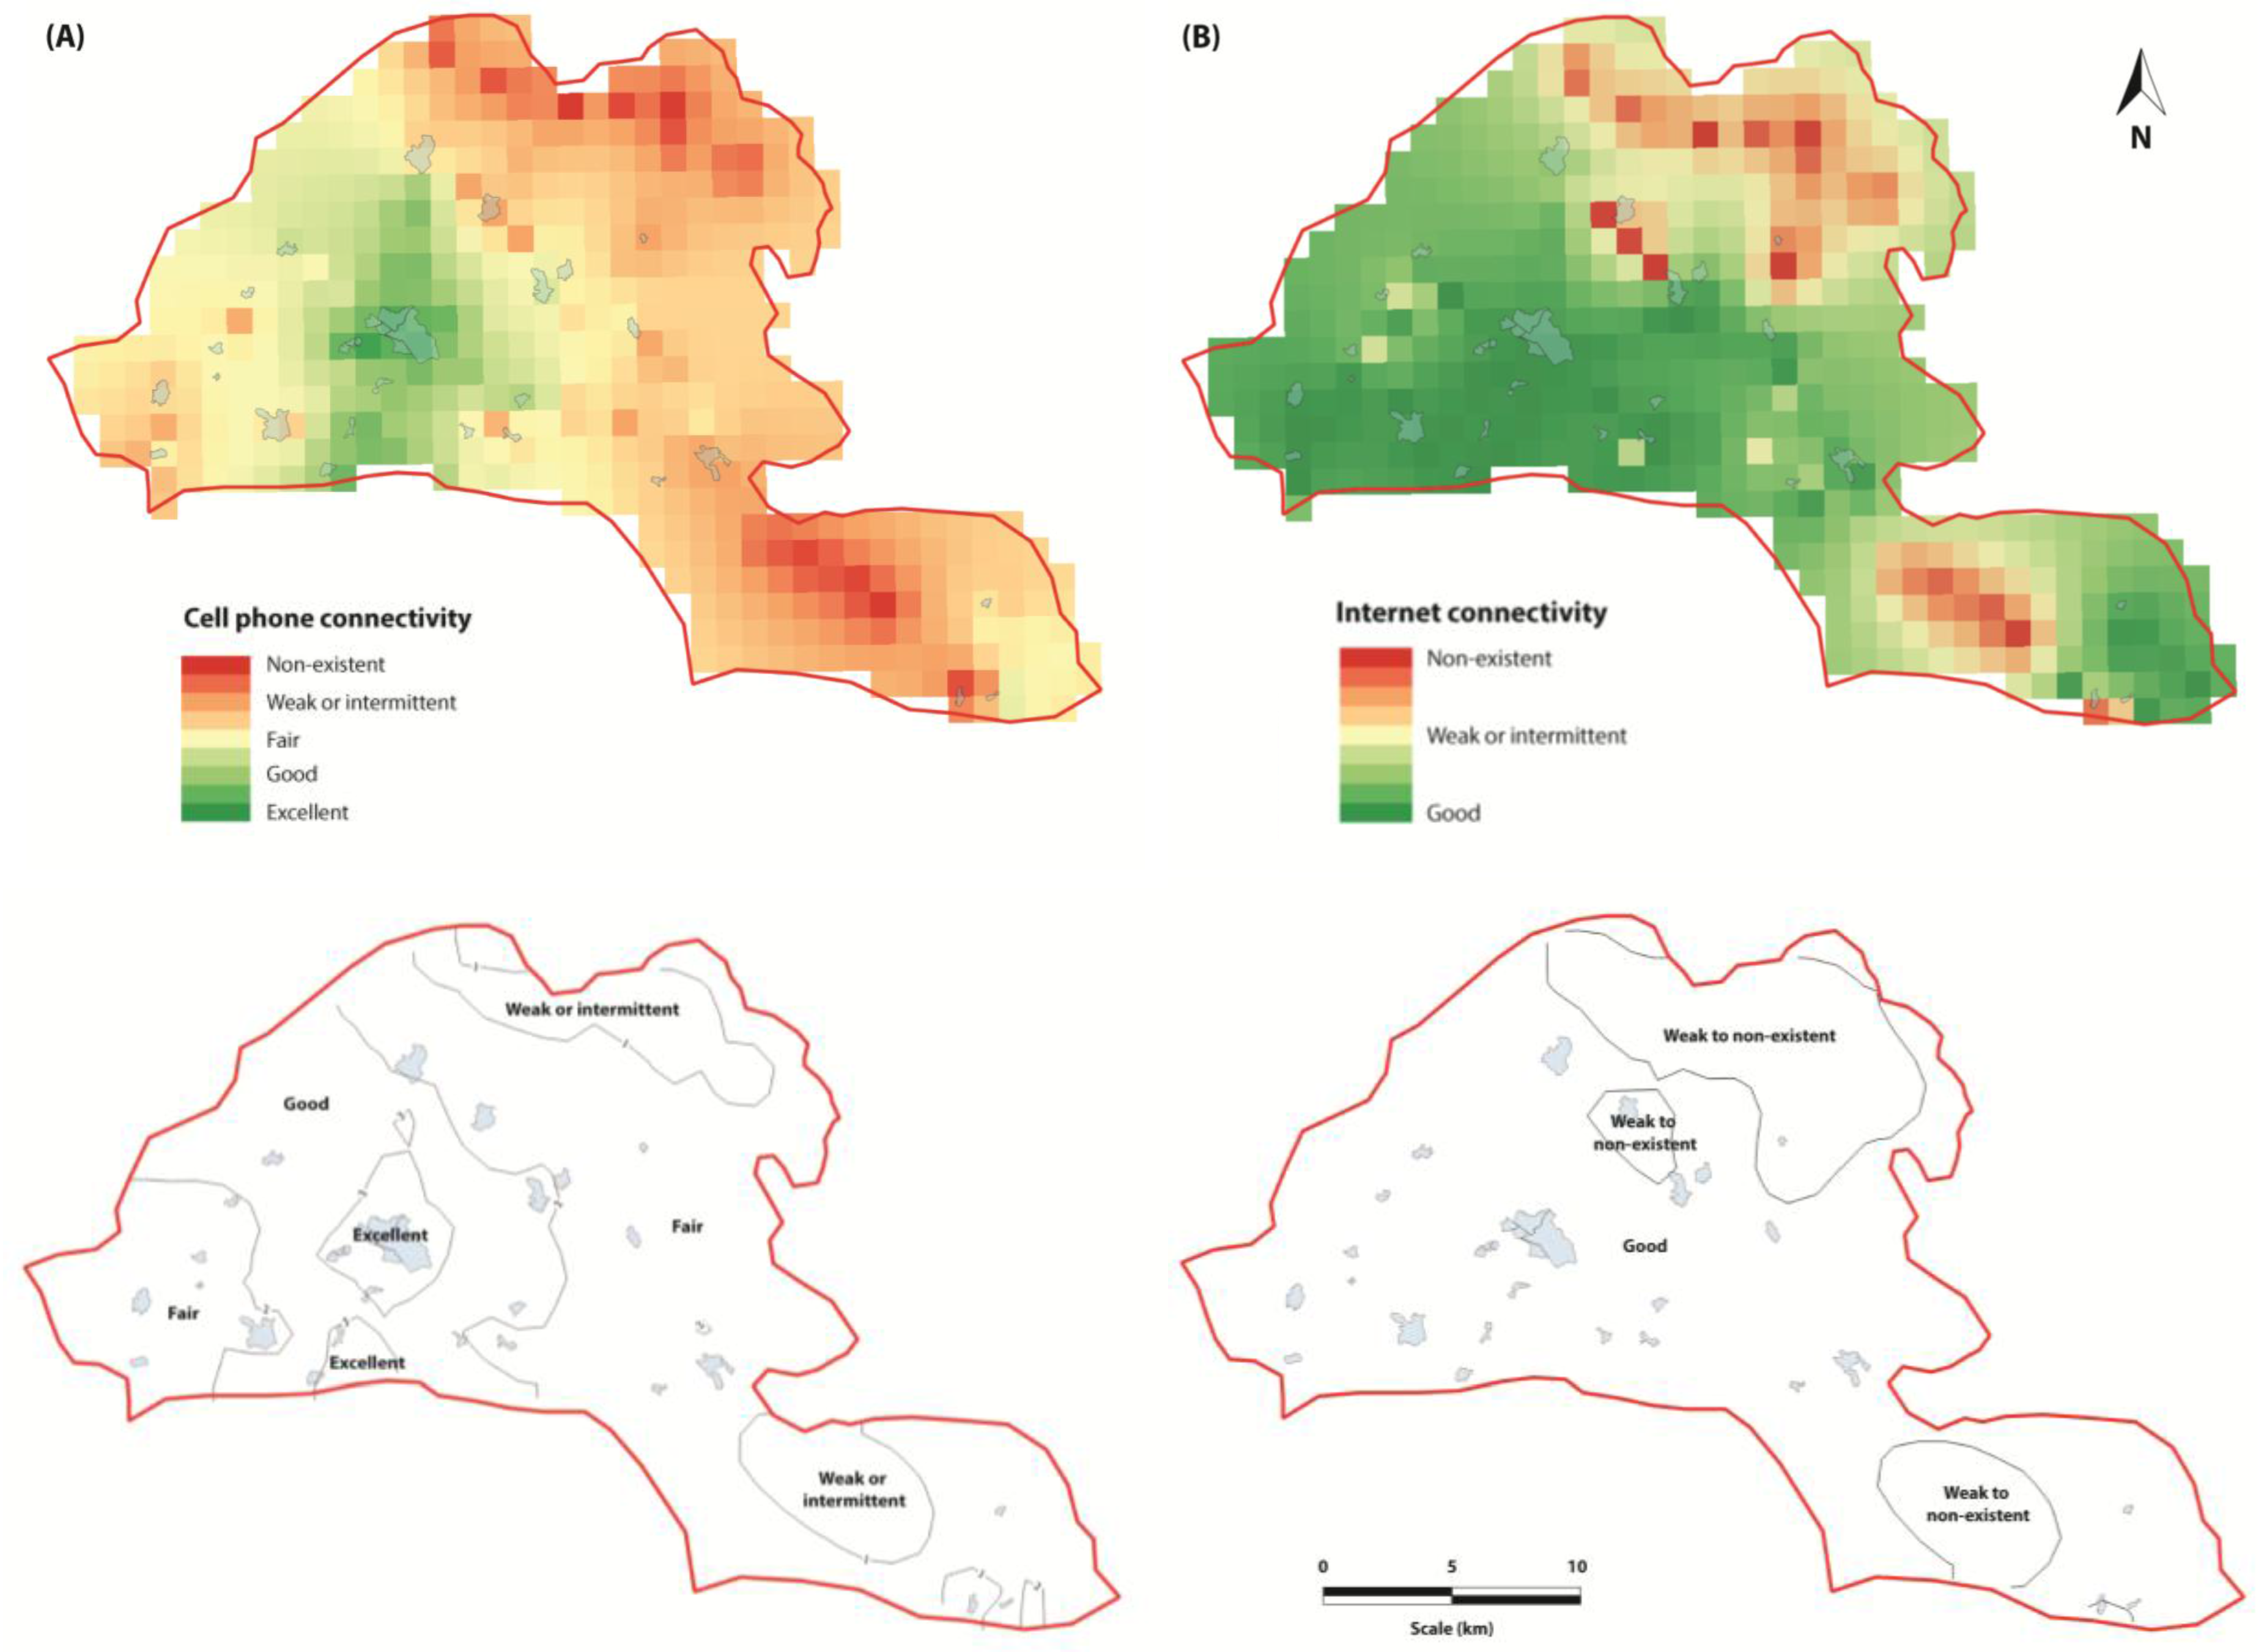
4.2. Wireless Coverage
4.3. Outcomes of the Survey of Water Committees
5. Discussion
5.1. Coverage versus Access
5.2. Exploring the Connections
“All the pumps in the village work. The technician is quick to come when we call him even though he lives far away.”[Interviewee #1]
“Three or four years ago we [the water committee] did not meet very often. One person would have to travel around trying to come up with a moment that suited us all. Some of the committee members live in other villages, so getting everyone to come was difficult. Since we all bought cell phones meetings have become more frequent.”[Interviewee #4]
“In the past there were times when water committees took a long time to find out about broken pumps. Pumps could take months to fix. This no longer happens. Even if a village has no member in the committee or if the member is away, anyone there can make the call and let us know that there is a problem.”[Interviewee #11]
“Before, when the pump broke, we had to raise funds to fix it. Some people would not want to pay and that created conflicts. Then we had to travel to Fana or to Djoïla to find a technician and hope for him to come quickly. He would usually take a long time because we could not stay there to press him and because he sometimes had to travel to Bamako to buy spare pieces. Now we have local technicians and repair kits. We call them whenever there is a problem and they come quickly. If we need spare parts, we can call and have them delivered from Bamako in a day or two. This saves us a lot of time and money”.[Interviewee #9]
6. Conclusions
Acknowledgments
Author Contributions
Conflicts of Interest
References
- United Nations. General Comment No. 15: The Right to Water. UN Committee on Economic, Social and Cultural Rights. Available online: http://www.refworld.org/docid/4538838d11.html (accessed on 25 May 2017).
- United Nations. Resolution A/RES/64/292. United Nations General Assembly. Available online: http://www.un.org/en/ga/search/view_doc.asp?symbol=A/RES/64/292 (accessed on 25 May 2017).
- World Health Organization-UNICEF. Progress on Sanitation and Drinking Water—2015 Update and MDG Assessment; UNICEF and World Health Organization: Geneva, Switzerland, 2015; p. 90. ISBN 9-789241-509145. [Google Scholar]
- Martínez-Santos, P. Does 91% of the world population really have “sustainable access to safe drinking water”? Int. J. Water Resour. Dev. 2017. [Google Scholar] [CrossRef]
- United Nations. Statement by Secretary General Koffi Annan. Available online: http://www.un.org/News/Press/docs/2003/sgsm8707.doc.htm (accessed on 25 May 2017).
- United Nations Children’s Fund. UNICEF Water, Sanitation and Hygiene Strategies for 2006–2015. Available online: https://www.unicef.org/about/execboard/files/06-6_WASH_final_ODS.pdf (accessed on 25 May 2017).
- Jewitt, S.; Ryley, H. It’s a girl thing: Menstruation, school attendance, spatial mobility and wider gender inequalities in Kenya. Geoforum 2014, 56, 137–147. [Google Scholar] [CrossRef]
- Shahidul, S.M.; Zehadul-Karim, A.H.M. Factors contributing to school dropout among the girls: A review of literature. Eur. J. Res. Reflect. Edu. Sci. 2015, 3, 2015. [Google Scholar]
- United Nations. The Millennium Development Goals Report. Available online: http://www.un.org/millenniumgoals/2015_MDG_Report/pdf/MDG%202015%20rev%20%28July%201%29.pdf (accessed on 25 May 2017).
- World Bank. World Bank Data (2016). Available online: http://data.worldbank.org/ (accessed on 25 May 2017).
- Auriol, E.; Blanc, A. Capture and corruption in public utilities: The cases of water and electricity in Sub-Saharan Africa. Util. Policy 2009, 17, 203–216. [Google Scholar] [CrossRef]
- Harvey, P.; Reed, B. Rural water supply in Africa: Building blocks for handpump sustainability. In Water, Engineering and Development Centre; Loughborough University: Leicestershire, UK, 2004; p. 281. [Google Scholar]
- Foster, T. Predictors of sustainability for community-managed handpumps in Sub-Saharan Africa: Evidence from Liberia, Sierra Leone, and Uganda. Environ. Sci. Technol. 2013, 47, 12037–12046. [Google Scholar] [CrossRef] [PubMed]
- Koehler, J.; Thomson, P.; Hope, R. Pump-priming payments for sustainable water services in rural Africa. World Dev. 2015, 74, 397–411. [Google Scholar] [CrossRef]
- United Nations. Report of the special rapporteur on the promotion and protection of the right to freedom of opinion and expression, Frank La Rue. In United Nations General Assembly; Report A/HRC/17/27; Available online: http://www2.ohchr.org/english/bodies/hrcouncil/docs/17session/A.HRC.17.27_en.pdf (accessed on 25 May 2017).
- International Telecommunication Union. ICT facts and figures. In ICT Data and Statistics Division; Telecommunication Development Bureau. International Telecommunication Union: Geneva, Switzerland, 2015; p. 6. [Google Scholar]
- Groupe Speciale Mobile Association (GSMA). The Mobile Economy. In Sub-Saharan Africa; Technical Report; GSMA Intelligence: London, UK, 2015; p. 59. [Google Scholar]
- Aker, J.C.; Mbiti, I.M. Mobile phones and economic development in Africa. J. Econ. Perspect. 2010, 24, 207–232. [Google Scholar] [CrossRef]
- Fosu, I. Exploring the potential of wireless technologies to accelerate universal Internet access in Ghana. Telecommun. Policy 2011, 35, 494–504. [Google Scholar] [CrossRef]
- Fuchs, C.; Horak, E. Africa and the digital divide. Telemat. Inform. 2008, 25, 99–116. [Google Scholar] [CrossRef]
- Birba, O.; Diagne, A. Determinants of adoption of Internet in Africa: Case of 17 sub-Saharan countries. Struct. Chang. Econ. Dyn. 2012, 23, 463–472. [Google Scholar] [CrossRef]
- Penard, T.; Poussing, N.; Mukoko, B.; Piaptie, G.B.T. Internet adoption and usage patterns in Africa: Evidence from Cameroon. Technol. Soc. 2015, 42, 71–80. [Google Scholar] [CrossRef]
- James, J. Mobile phones and safety in developing countries: Evidence from Sub-Saharan Africa. Geoforum 2015, 62, 47–50. [Google Scholar] [CrossRef]
- Howard, P.N.; Mazaheri, N. Telecommunications reform, Internet use and mobile phone adoption in the developing world. World Dev. 2009, 37, 1159–1169. [Google Scholar] [CrossRef]
- Groupe Speciale Mobile Association (GSMA). The Mobile Economy. In Sub-Saharan Africa; Technical Report; GSMA Intelligence: London, UK, 2014; p. 78. [Google Scholar]
- Muto, M.; Yamano, T. The impact of mobile phone coverage expansion on market participation: Panel data evidence from Uganda. World Dev. 2009, 37, 1887–1896. [Google Scholar] [CrossRef]
- Overa, R. Networks, distance, and trust: Telecommunications development and changing trading practices in Ghana. World Dev. 2006, 34, 1301–1315. [Google Scholar] [CrossRef]
- Buys, P.; Dasgupta, S.; Thomas, T.S.; Wheeler, D. Determinants of a digital divide in Sub-Saharan Africa: A spatial econometric analysis of cell phone coverage. World Dev. 2009, 37, 1494–1505. [Google Scholar] [CrossRef]
- Adams, E.A.; Zulu, L.C. Participants or customers in water governance? Community-public partnerships for peri-urban water supply. Geoforum 2015, 65, 112–124. [Google Scholar] [CrossRef]
- Wakeyo, M.B.; Gardebroek, C. Empty pockets, empty ponds? Disadoption of water harvesting technologies in Ethiopia. J. Arid Environ. 2015, 120, 75–86. [Google Scholar] [CrossRef]
- Mponela, P.; Tamene, L.; Ndengu, G.; Magreta, R.; Kihara, J.; Mango, N. Determinants of integrated soil fertility management technologies adoption by smallholder farmers in the Chinyanja Triangle of Southern Africa. Land Use Policy 2016, 59, 38–48. [Google Scholar] [CrossRef]
- Schnegg, M.; Bollig, M. Institutions put to the test: Community-based water management in Namibia during a drought. J. Arid. Environ. 2016, 124, 62–71. [Google Scholar] [CrossRef]
- Swan, A.; Cooper, N. Innovative funding methods for rural communities and their water pumps. Water Resour. Rural Dev. 2013, 1–2, 17–26. [Google Scholar] [CrossRef]
- García-Castro, N.; García-Rincón, J. Evaluación de la Situación Sanitaria en Beleko, Mali, y Propuestas Contra la Contaminación Microbiológica. Master’s Thesis, Universidad de Alcalá, Madrid, Spain, 2017. (In Spanish). [Google Scholar]
- Anell, A.; Willis, M. International comparison of health care systems using resource profiles. Bull. World Health Organ. 2000, 78, 770–778. [Google Scholar] [PubMed]
- Jaramillo, C.; Lizárraga, C.; Grindlay, A.L. Spatial disparity in transport social needs and public transport provision in Santiago de Cali (Colombia). J. Transp. Geogr. 2012, 24, 340–357. [Google Scholar] [CrossRef]
- Wang, C.H.; Chen, N. A GIS-based spatial statistical approach to modeling job accessibility by transportation mode: Case study of Columbus, Ohio. J. Transp. Geogr. 2015, 45, 1–11. [Google Scholar] [CrossRef]
- Schuurman, N.; Amram, O.; Crooks, V.A.; Johnston, R.; Williams, A. A comparative analysis of potential spatio-temporal access to palliative care services in two Canadian provinces. BMC Health Serv. Res. 2015, 17, 270. [Google Scholar] [CrossRef] [PubMed]
- Ursulica, T.E. The relationship between health care needs and accessibility to health care services in Botosani County—Romania. Procedia Environ. Sci. 2016, 32, 300–310. [Google Scholar] [CrossRef]
- Aldasouqi, I.; Salameh, W.A. Using GIS in designing and deploying wireless network in city plans. Int. J. Comput. Netw. 2014, 6, 66–75. [Google Scholar]
- Nayan, N.; Hashim, M.; Saleh, Y.; Mahat, H. Mapping internet coverage in Malaysia’s university campuses: A case study of the Sultan Idris Education University, Perak. Malays. J. Soc. Space 2016, 12, 118–125. [Google Scholar]
- Dhanasekarapandian, M.; Chandran, S.; Saranya Devi, D.; Kumar, V. Spatial and temporal variation of groundwater quality and its suitability for irrigation and drinking purpose using GIS and WQI in an urban fringe. J. Afr. Earth Sci. 2016, 124, 270–288. [Google Scholar] [CrossRef]
- Toure, N.M.; Kane, A.; Noel, J.F.; Turmine, V.; Nedeff, V.; Lazar, G. Water-poverty relationships in the coastal town of Mbour (Senegal): Relevance of GIS for decision support. Int. J. Appl. Earth Obs. Geoinf. 2012, 14, 33–39. [Google Scholar] [CrossRef]
- Wright, J.; Liu, J.; Bain, R.; Perez, A.; Crocker, J.; Bartram, J.; Gundry, S. Water quality laboratories in Colombia: A GIS-based study of urban and rural accessibility. Sci. Total Environ. 2014, 485–486, 643–652. [Google Scholar] [CrossRef] [PubMed]
- United Nations International Children’s Emergency Fund. The rights to safe water and to sanitation. UNICEF Curr. Issues 2014, 3, 1–5. [Google Scholar]
- World Health Organization-UNICEF. Progress on Drinking Water and Sanitation: 2012 Update; UNICEF and World Health Organization: Geneva, Switzerland, 2015; p. 66. ISBN 978-92-806-4632-0. [Google Scholar]
- OXFAM. Oxfam delagua portable water testing kit. In User Manual; University of Surrey: Guildford, UK, 2009; p. 65. [Google Scholar]
- Paruch, A.M.; Mæhlum, T. Specific features of Escherichia coli that distinguish it from coliform and thermotolerant coliform bacteria and define it as the most accurate indicator of faecal contamination in the environment. Ecol. Indic. 2012, 23, 140–142. [Google Scholar] [CrossRef]
- Hathaway, J.M.; Krometis, L.H.; Hunt, W.F. Exploring seasonality in E. coli/fecal coliform ratios in urban watersheds. J. Irrig. Drain. Eng. 2014, 140, 04014003. [Google Scholar] [CrossRef]
- Sphere Project. Humanitarian Charter and Minimum Standards in Humanitarian Response; The Sphere Project: Rugby, UK, 2011; ISBN 978-1-908176-00-4. [Google Scholar]
- World Health Organization. Guidelines for Drinking-Water Quality; Technical Report; World Health Organization: Geneva, Switzerland, 2011; p. 541. ISBN 978-92-4-154815-1. [Google Scholar]
- Hachich, E.M.; Di Bari, M.; Christ, A.P.G.; Lamparelli, C.C.; Ramos, S.S.; Sato, M.I.Z. Comparison of thermotolerant coliforms and Escherichia coli densities in freshwater bodies. Braz. J. Microbiol. 2012, 43, 675–681. [Google Scholar] [CrossRef] [PubMed]
- World Health Organization. Environmental Health in Emergencies and Disasters: A Practical Guide; World Health Organization: Geneva, Switzerland, 2002; p. 252. ISBN 92-4-154541-0. [Google Scholar]
- SASPlanet Software, Version 141212.8406; SASPlanet Development Team. Available online: www.sasgis.org (accessed on 25 May 2017).
- United Nations Office for the Coordination of Humanitarian Affairs. Mali—Humanitarian Data Exchange. Available online: https://data.humdata.org/group/mli (accessed on 25 May 2017).
- Obeng-Odoom, F. Beyond access to water. Dev. Pract. 2012, 22, 1135–1146. [Google Scholar] [CrossRef]
- Smiley, S.L. Complexities of water access in Dar es Salaam, Tanzania. Appl. Geogr. 2013, 41, 132–138. [Google Scholar] [CrossRef]
- Jones, S.D. Sharing the Recurrent Costs of Rural Water Supply in Mali: The Role of WaterAid in Promoting Sustainable Service Delivery. Ph.D. Thesis, University of London, London, UK, 2013. [Google Scholar]
- Kumpel, E.; Nelson, K.L. Intermittent water supply: Prevalence, practice, and microbial water quality. Environ. Sci. Technol. 2016, 50, 542–553. [Google Scholar] [CrossRef] [PubMed]
- Gulliford, M.; Figueroa-Munoz, J.; Morgan, M.; Hughes, D.; Gibson, B.; Beech, R.; Hudson, M. What does “access to health care” mean? J. Health Serv. Res. Policy 2002, 7, 186–188. [Google Scholar] [CrossRef] [PubMed]
- Mwamaso, A.A. Measuring and Mapping Citizens’ Access to Rural Water Supply in Tanzania. Master’s Thesis, University of Twente, Enschede, The Netherlands, February 2015. [Google Scholar]
- Nganyanyuka, K.; Martinez, J.; Wesselink, A.; Lungo, J.H.; Georgiadou, Y. Accessing water services in Dar es Salaam: Are we counting what counts? Habitat Int. 2014, 44, 358–366. [Google Scholar] [CrossRef]
- Xu, K.; Saksena, P.; Evans, D.B. Health Financing and Access to Effective Interventions; World Health Report (2010), Background Paper, No. 8; World Health Organization: Geneva, Switzerland, 2010; p. 18. [Google Scholar]
- Bartram, J. Improving on haves and have-nots. Nature 2008, 452, 283–284. [Google Scholar] [CrossRef] [PubMed]
- Heitzinger, K.; Rocha, C.A.; Quick, R.E.; Montano, S.M.; Tilley, D.H., Jr.; Mock, C.N.; Carrasco, A.J.; Cabrera, R.M.; Hawes, S.E. “Improved” but not necessarily safe: An assessment of fecal contamination of household drinking water in rural Peru. Am. J. Trop. Med. Hyg. 2015, 93, 501–508. [Google Scholar] [CrossRef] [PubMed]
- Onda, K.; LoBuglio, J.; Bartram, J. Global access to safe water: Accounting for water quality and the resulting impact on MDG progress. Int. J. Environ. Res. Public Health 2012, 9, 880–894. [Google Scholar] [CrossRef] [PubMed]
- Shaheed, A.; Orgill, J.; Montgomery, M.A.; Jeuland, M.A.; Brown, J. Why “improved” water sources are not always safe. Bull. World Health Organ. 2014, 92, 283–289. [Google Scholar] [CrossRef] [PubMed]
- Gundry, S.W.; Wright, J.A.; Conroy, R.; duPreez, M.; Genthe, B.; Moyo, S.; Mutisi, C.; Ndamba, J.; Potgieter, N. Contamination of drinking water between source and point-of-use in rural households of South Africa and Zimbabwe: Implications for monitoring the Millennium Development Goal for water. Water Pract. Technol. 2006. [Google Scholar] [CrossRef]
- Onabolu, B.; Jimoh, O.D.; Igboro, S.B.; Sridhar, M.K.C.; Onyilo, G.; Gege, A.; Ilya, R. Source to point of use drinking water changes and knowledge, attitude and practices in Katsina State, Northern Nigeria. Phys. Chem. Earth Parts A/B/C 2011, 36, 1189–1196. [Google Scholar] [CrossRef]
- Hutchings, P.; Parker, A.; Jeffrey, P. The political risks of technological determinism in rural water supply: A case study from Bihar, India. J. Rural Stud. 2016, 45, 252–259. [Google Scholar] [CrossRef]
- Zawahri, N.; Sowers, J.; Weinthal, E. The politics of assessment: Water and sanitation MDGs in the Middle East. Dev. Chang. 2011, 42, 1153–1177. [Google Scholar] [CrossRef]
- Bain, R.; Cronk, R.; Wright, J.; Yang, H.; Slaymaker, T.; Bartram, J. Fecal contamination of drinking-water in low- and middle-income countries: A systematic review and meta-analysis. PLoS Med. 2014, 11, e1001644. [Google Scholar] [CrossRef] [PubMed]
- Bain, R.E.S.; Wright, J.A.; Christenson, E.; Bartram, J.K. Rural: Urban inequalities in post 2015 targets and indicators for drinking water. Sci. Total Environ. 2014, 490, 509–513. [Google Scholar] [CrossRef] [PubMed]
- Foster, T.; Hope, R. A multi-decadal and social-ecological systems analysis of community waterpoint payment behaviours in rural Kenya. J. Rural Stud. 2016, 47, 85–96. [Google Scholar] [CrossRef]
- Lutz, A.; Thomas, J.M.; Diarra, S. Chemistry of hand-pump waters in Ghana, Mali, and Niger, West Africa: Potential health effects. Procedia Earth Planet. Sci. 2013, 7, 541–545. [Google Scholar] [CrossRef]
- James, J. Which developing countries have done the most to close the digital divide? Telemat. Inform. 2012, 29, 2–10. [Google Scholar] [CrossRef]
- James, J. Sharing mobile phones in developing countries: Implications for the digital divide. Technol. Forecast. Soc. Chang. 2011, 78, 729–735. [Google Scholar] [CrossRef]
- Van Dijk, J.; Hacker, K. The digital divide as a complex, dynamic phenomenon. Inf. Soc. 2003, 19, 315–326. [Google Scholar] [CrossRef]
- Porter, G. Living in a walking world: Rural mobility and social equity issues in Sub-Saharan Africa. World Dev. 2002, 30, 285–300. [Google Scholar] [CrossRef]
- Pritchett, L.; Woolcock, M. Solutions when the Solution is the Problem: Arraying the disarray in development. World Dev. 2004, 32, 191–212. [Google Scholar] [CrossRef]


| Village | Population | Surface | Theoretical Water Coverage | Water Coverage (Active Sources) | Water Coverage (Active Uncontaminated Sources) | |||
|---|---|---|---|---|---|---|---|---|
| km2 | km2 | % | km2 | % | km2 | % | ||
| Beleko Soba | 4687 | 2.31 | 1.32 | 57 | 1.32 | 57 | 1.02 | 44 |
| Bleindio B. | 455 | 0.07 | 0.07 | 100 | 0.07 | 100 | 0.00 | 0 |
| Bonkoro | 1233 | 0.19 | 0.19 | 100 | 0.19 | 100 | 0.18 | 93 |
| Sengala | 373 | 0.13 | 0.13 | 100 | 0.13 | 100 | 0.00 | 0 |
| Dyana M. | 1790 | 1.17 | 1.02 | 87 | 1.02 | 87 | 0.89 | 76 |
| Diawarala | 530 | 0.53 | 0.52 | 97 | 0.52 | 97 | 0.48 | 90 |
| Dougouyala | 640 | 0.80 | 0.77 | 97 | 0.70 | 88 | 0.52 | 65 |
| Famola | 159 | 0.09 | 0.09 | 100 | 0.09 | 100 | 0.00 | 0 |
| Fienkala | 363 | 0.24 | 0.24 | 100 | 0.24 | 100 | 0.24 | 99 |
| Flala D. | 219 | 0.05 | 0.05 | 100 | 0.05 | 100 | 0.05 | 98 |
| Flala F. | 309 | 0.14 | 0.14 | 100 | 0.14 | 100 | 0.14 | 100 |
| Fougad. B. | 665 | 0.08 | 0.08 | 100 | 0.08 | 100 | 0.08 | 100 |
| Fougad. N. | 1456 | 0.19 | 0.10 | 52 | 0.10 | 52 | 0.00 | 0 |
| Fougad. Z. | 672 | 0.09 | 0.09 | 100 | 0.09 | 100 | 0.00 | 0 |
| Gueguena B. | 469 | 0.16 | 0.16 | 99 | 0.16 | 99 | 0.00 | 0 |
| Gueguena F. | 665 | 0.25 | 0.25 | 100 | 0.25 | 100 | 0.25 | 100 |
| Guelekoun | 933 | 0.16 | 0.14 | 92 | 0.14 | 92 | 0.13 | 86 |
| Kyndia | 2884 | 0.67 | 0.64 | 96 | 0.64 | 96 | 0.00 | 0 |
| Kologna | 961 | 0.40 | 0.40 | 100 | 0.40 | 100 | 0.00 | 0 |
| Koloko | 2112 | 0.27 | 0.27 | 100 | 0.27 | 100 | 0.27 | 100 |
| Koloni N. | 474 | 0.20 | 0.20 | 99 | 0.20 | 99 | 0.00 | 0 |
| Korod. F. | 707 | 0.11 | 0.11 | 100 | 0.11 | 100 | 0.00 | 0 |
| Korod. M. | 2470 | 0.79 | 0.61 | 78 | 0.37 | 47 | 0.00 | 0 |
| Ngolokouna | 659 | 0.18 | 0.18 | 100 | 0.18 | 100 | 0.00 | 0 |
| Noumouna | 962 | 0.09 | 0.09 | 100 | 0.09 | 100 | 0.00 | 0 |
| Seyla M. | 1046 | 0.35 | 0.31 | 88 | 0.31 | 88 | 0.00 | 0 |
| Seyla Soba | 2250 | 0.68 | 0.65 | 95 | 0.65 | 95 | 0.00 | 0 |
| Thio | 2077 | 0.52 | 0.52 | 100 | 0.38 | 73 | 0.00 | 0 |
| Thiak. Soba | 2992 | 1.10 | 0.47 | 43 | 0.47 | 43 | 0.47 | 43 |
| Tlebi B. | 680 | 0.20 | 0.20 | 100 | 0.20 | 100 | 0.00 | 0.0 |
| Total | 35,892 | 12.21 | 10.01 | 82 | 9.56 | 78 | 4.73 | 39 |
| ID | X | Y | Location | Water Depth (m) | pH | EC (mS/cm) | Temp. (°C) | TDS | CFU/100 mL |
|---|---|---|---|---|---|---|---|---|---|
| 10101 | 782351 | 1381839 | Beleko Soba | 14.00 | 5.50 | 0.04 | 31.6 | 0.02 | 0 |
| 30101 | 781715 | 1381331 | Beleko Soba | - | 6.01 | 0.08 | 32.2 | 0.04 | 1 |
| 30209 | 782125 | 1380472 | Beleko Soba | - | 5.23 | 0.05 | 32.5 | 0.03 | 1 |
| 20101 | 781463 | 1380879 | Beleko Soba | - | 6.37 | 0.14 | 31.2 | 0.07 | >50 |
| 20103 | 781618 | 1380796 | Beleko Soba | - | 6.50 | 0.11 | 33.4 | 0.06 | 9 |
| 20104 | 781599 | 1380690 | Beleko Soba | - | 6.32 | 0.10 | 33.8 | 0.05 | 21 |
| 30102 | 781799 | 1381304 | Beleko Soba | - | 6.29 | 0.10 | 35.1 | 0.05 | 0 |
| 80211 | 792047 | 1384845 | Blendio B. | 9.80 | 7.11 | 0.37 | 33.6 | 0.19 | 1 |
| 80401 | 786599 | 1378274 | Bonkoro | - | 5.38 | 0.04 | 31.2 | 0.02 | 0 |
| 80402 | 786964 | 1378426 | Bonkoro | 8.80 | 6.63 | 0.20 | 30.8 | 0.10 | 1 |
| 40113 | 781022 | 1381220 | Diawarala | - | 6.75 | 0.26 | 35.2 | 0.13 | 8 |
| 40111 | 781306 | 1381231 | Diawarala | - | 6.96 | 0.26 | 32.8 | 0.13 | 7 |
| 40112 | 781454 | 1381066 | Diawarala | - | 7.24 | 0.25 | 31.9 | 0.12 | 1 |
| 40109 | 780896 | 1381112 | Diawarala | - | 6.39 | 0.11 | 33.8 | 0.06 | 0 |
| 80412 | 776611 | 1377508 | Dyana | 5.10 | 5.45 | 0.07 | 32.3 | 0.04 | 18 |
| 80413 | 776818 | 1376881 | Dyana | - | 6.85 | 0.41 | 32.4 | 0.21 | 25 |
| 80414 | 776624 | 1376804 | Dyana | - | 5.79 | 0.04 | 33.9 | 0.02 | 0 |
| 80415 | 776119 | 1377293 | Dyana | - | 7.38 | 0.56 | 35.5 | 0.28 | 0 |
| 60101 | 781821 | 1380602 | Dyawarala | - | 6.31 | 0.11 | 33.6 | 0.05 | 0 |
| 80103 | 779499 | 1380430 | Famola | 7.20 | 6.35 | 0.18 | 30.0 | 0.09 | >50 |
| 50101 | 780371 | 1381199 | Fienkala | 8.70 | 6.66 | 0.10 | 30.9 | 0.05 | 0 |
| 50107 | 780723 | 1381461 | Fienkala | - | 6.58 | 0.17 | 31.0 | 0.09 | 8 |
| 80410 | 780646 | 1378571 | Flala D. | 5.90 | 6.25 | 0.15 | 32.3 | 0.08 | 1 |
| 80411 | 780882 | 1378814 | Flala F. | - | 5.55 | 0.04 | 33.1 | 0.02 | 0 |
| 80306 | 805552 | 1366152 | Fougad. N. | - | 7.61 | 0.26 | 32.0 | 0.13 | 30 |
| 80309 | 807055 | 1366086 | Fougad. B. | - | 7.93 | 0.85 | 34.8 | 0.43 | 0 |
| 80310 | 807043 | 1365801 | Fougad.B. | 5.50 | 6.39 | 0.04 | 31.8 | 0.02 | 0 |
| 80307 | 806696 | 1369727 | Fougad. Z. | 10.60 | 7.31 | 0.28 | 34.6 | 0.14 | 2 |
| 80308 | 806504 | 1369593 | Fougad. Z. | - | 6.92 | 0.20 | 33.6 | 0.10 | 12 |
| 80405 | 784777 | 1376914 | Guelekoun | 9.50 | 6.55 | 0.16 | 36.4 | 0.08 | >50 |
| 80406 | 784815 | 1376751 | Guelekoun | - | 5.76 | 0.05 | 34.6 | 0.03 | 0 |
| 80408 | 779626 | 1376961 | Gweguena B. | 8.60 | 7.35 | 0.38 | 33.5 | 0.19 | 4 |
| 80409 | 779673 | 1377240 | Gweguena B. | - | 7.73 | 0.34 | 31.9 | 0.17 | 1 |
| 80407 | 778520 | 1375325 | Gweguena F. | 6.50 | 5.15 | 0.07 | 33.1 | 0.04 | 0 |
| 80202 | 785245 | 1385986 | Kindya | 6.90 | 5.15 | 0.02 | 32.2 | 0.01 | 19 |
| 80204 | 785883 | 1386571 | Kindya | - | 6.53 | 0.18 | 31.4 | 0.09 | >50 |
| 80301 | 791828 | 1380880 | Koloko | 9.10 | 7.62 | 0.56 | 31.4 | 0.28 | 8 |
| 80302 | 791674 | 1381213 | Koloko | - | 7.75 | 0.54 | 31.1 | 0.27 | 0 |
| 80303 | 791561 | 1380883 | Koloko | - | 8.13 | 0.55 | 30.1 | 0.28 | 8 |
| 80109 | 773628 | 1380211 | Koloni | 7.50 | 6.52 | 0.25 | 30.9 | 0.13 | >50 |
| 80110 | 774877 | 1382595 | Kologna | 10.45 | 7.20 | 0.37 | 31.0 | 0.19 | 9 |
| 80111 | 775205 | 1382615 | Kologna | - | 5.95 | 0.04 | 31.5 | 0.02 | 19 |
| 80112 | 776778 | 1384352 | Kologna | 9.75 | 5.94 | 0.06 | 32.4 | 0.03 | 16 |
| 80305 | 792616 | 1374888 | Korod. F. | - | 7.63 | 0.40 | 31.6 | 0.20 | 1 |
| 80304 | 794666 | 1375515 | Korod. M. | 7.70 | 7.75 | 0.30 | 31.0 | 0.15 | 1 |
| 80203 | 785695 | 1386009 | Kyndia | - | 6.88 | 0.45 | 31.6 | 0.23 | 7 |
| 80205 | 785793 | 1385722 | Kyndia | 8.70 | 7.21 | 0.64 | 33.9 | 0.32 | 13 |
| 80403 | 786006 | 1376862 | Ngoloukouna | 6.00 | 7.40 | 0.18 | 33.2 | 0.09 | 19 |
| 80404 | 786486 | 1376593 | Ngoloukouna | - | 6.97 | 0.42 | 32.0 | 0.21 | 8 |
| 80101 | 779915 | 1380536 | Noumuna | 6.40 | 6.62 | 0.46 | 29.8 | 0.23 | >50 |
| 80102 | 779866 | 1380679 | Noumuna | 10.60 | 6.77 | 0.26 | 31.0 | 0.13 | >50 |
| 80108 | 773840 | 1379160 | Nousuma | 7.45 | 5.60 | 0.05 | 30.2 | 0.03 | 20 |
| 80104 | 779314 | 1380331 | Sengala | 7.60 | 6.14 | 0.08 | 30.8 | 0.04 | 23 |
| 80209 | 788418 | 1383209 | Seyla M. | - | 7.25 | 0.46 | 35.5 | 0.23 | 30 |
| 80210 | 788909 | 1383292 | Seyla M. | 10.90 | 7.21 | 0.31 | 33.0 | 0.16 | >50 |
| 80206 | 787716 | 1383152 | Seyla Soba | 7.30 | 5.87 | 0.04 | 31.9 | 0.02 | 5 |
| 80207 | 787878 | 1382733 | Seyla Soba | - | 5.40 | 0.05 | 32.2 | 0.03 | 4 |
| 80208 | 787537 | 1382800 | Seyla Soba | - | 5.69 | 0.05 | 31.8 | 0.03 | 1 |
| 80201 | 782458 | 1388686 | Thiak. Soba | 5.80 | 5.59 | 0.04 | 30.5 | 0.02 | 0 |
| 80105 | 771477 | 1378708 | Thio | 8.45 | 5.33 | 0.05 | 31.6 | 0.03 | 16 |
| 80106 | 771216 | 1375950 | Tlebi B. | 6.45 | 5.95 | 0.05 | 32.1 | 0.03 | 13 |
| 80107 | 770995 | 1375859 | Tlebi B. | - | 5.99 | 0.10 | 30.4 | 0.05 | >50 |
| Village | Cell Phone Coverage (% Surface Area) | Internet Coverage (% Surface Area) | ||||||
|---|---|---|---|---|---|---|---|---|
| Non-Existent | Weak or Intermittent | Fair | Good | Excellent | Non-Existent | Weak or Intermittent | Good | |
| Beleko Soba | 0 | 0 | 15 | 72 | 13 | 0 | 0 | 100 |
| Bleindio B. | 14 | 86 | 0 | 0 | 0 | 100 | 0 | 0 |
| Bonkoro | 0 | 0 | 40 | 60 | 0 | 0 | 0 | 100 |
| Sengala | 0 | 0 | 0 | 27 | 63 | 0 | 0 | 100 |
| Dyana M. | 0 | 21 | 79 | 0 | 0 | 0 | 0 | 100 |
| Diawarala | 0 | 0 | 0 | 26 | 74 | 0 | 0 | 100 |
| Dougouyala | 0 | 0 | 1 | 74 | 25 | 0 | 0 | 100 |
| Famola | 0 | 0 | 0 | 44 | 56 | 0 | 0 | 100 |
| Fienkala | 0 | 0 | 0 | 42 | 58 | 0 | 0 | 100 |
| Flala D. | 0 | 0 | 83 | 16 | 0 | 0 | 0 | 100 |
| Flala F. | 0 | 8 | 85 | 8 | 0 | 0 | 0 | 100 |
| Fougad. B. | 0 | 0 | 83 | 17 | 0 | 0 | 0 | 100 |
| Fougad. N. | 86 | 14 | 0 | 0 | 0 | 47 | 53 | 0 |
| Fougad. Z. | 0 | 71 | 29 | 0 | 0 | 0 | 0 | 100 |
| Gueguena B. | 0 | 0 | 21 | 36 | 43 | 0 | 0 | 100 |
| Gueguena F. | 0 | 0 | 70 | 25 | 5 | 0 | 0 | 100 |
| Guelekoun | 0 | 33 | 67 | 0 | 0 | 0 | 0 | 100 |
| Kyndia | 0 | 68 | 32 | 0 | 0 | 0 | 0 | 100 |
| Kologna | 0 | 0 | 71 | 29 | 0 | 0 | 0 | 100 |
| Koloko | 0 | 62 | 29 | 9 | 0 | 0 | 0 | 100 |
| Koloni N. | 0 | 0 | 100 | 0 | 0 | 0 | 0 | 100 |
| Korod. F. | 0 | 37 | 63 | 0 | 0 | 0 | 0 | 100 |
| Korod. M. | 10 | 83 | 7 | 0 | 0 | 15 | 11 | 74 |
| Ngolokouna | 0 | 85 | 15 | 0 | 0 | 0 | 0 | 100 |
| Noumouna | 0 | 0 | 0 | 14 | 86 | 0 | 0 | 100 |
| Seyla M. | 0 | 24 | 76 | 0 | 0 | 0 | 0 | 100 |
| Seyla Soba | 0 | 0 | 70 | 28 | 2 | 0 | 0 | 100 |
| Thio | 5 | 74 | 21 | 0 | 0 | 0 | 0 | 100 |
| Thiak. Soba | 0 | 69 | 27 | 4 | 0 | 2 | 83 | 15 |
| Tlebi B. | 0 | 12 | 88 | 0 | 0 | 0 | 0 | 100 |
© 2017 by the authors. Licensee MDPI, Basel, Switzerland. This article is an open access article distributed under the terms and conditions of the Creative Commons Attribution (CC BY) license (http://creativecommons.org/licenses/by/4.0/).
Share and Cite
Martínez-Santos, P.; Cerván, J.A.; Cano, B.; Díaz-Alcaide, S. Water versus Wireless Coverage in Rural Mali: Links and Paradoxes. Water 2017, 9, 375. https://doi.org/10.3390/w9060375
Martínez-Santos P, Cerván JA, Cano B, Díaz-Alcaide S. Water versus Wireless Coverage in Rural Mali: Links and Paradoxes. Water. 2017; 9(6):375. https://doi.org/10.3390/w9060375
Chicago/Turabian StyleMartínez-Santos, Pedro, José Antonio Cerván, Beatriz Cano, and Silvia Díaz-Alcaide. 2017. "Water versus Wireless Coverage in Rural Mali: Links and Paradoxes" Water 9, no. 6: 375. https://doi.org/10.3390/w9060375
APA StyleMartínez-Santos, P., Cerván, J. A., Cano, B., & Díaz-Alcaide, S. (2017). Water versus Wireless Coverage in Rural Mali: Links and Paradoxes. Water, 9(6), 375. https://doi.org/10.3390/w9060375