
Mapping Dynamic Water Fraction under the Tropical Rain Forests of the Amazonian Basin from SMOS Brightness Temperatures


 , ,
, ,  ,
, 

Abstract
:1. Introduction
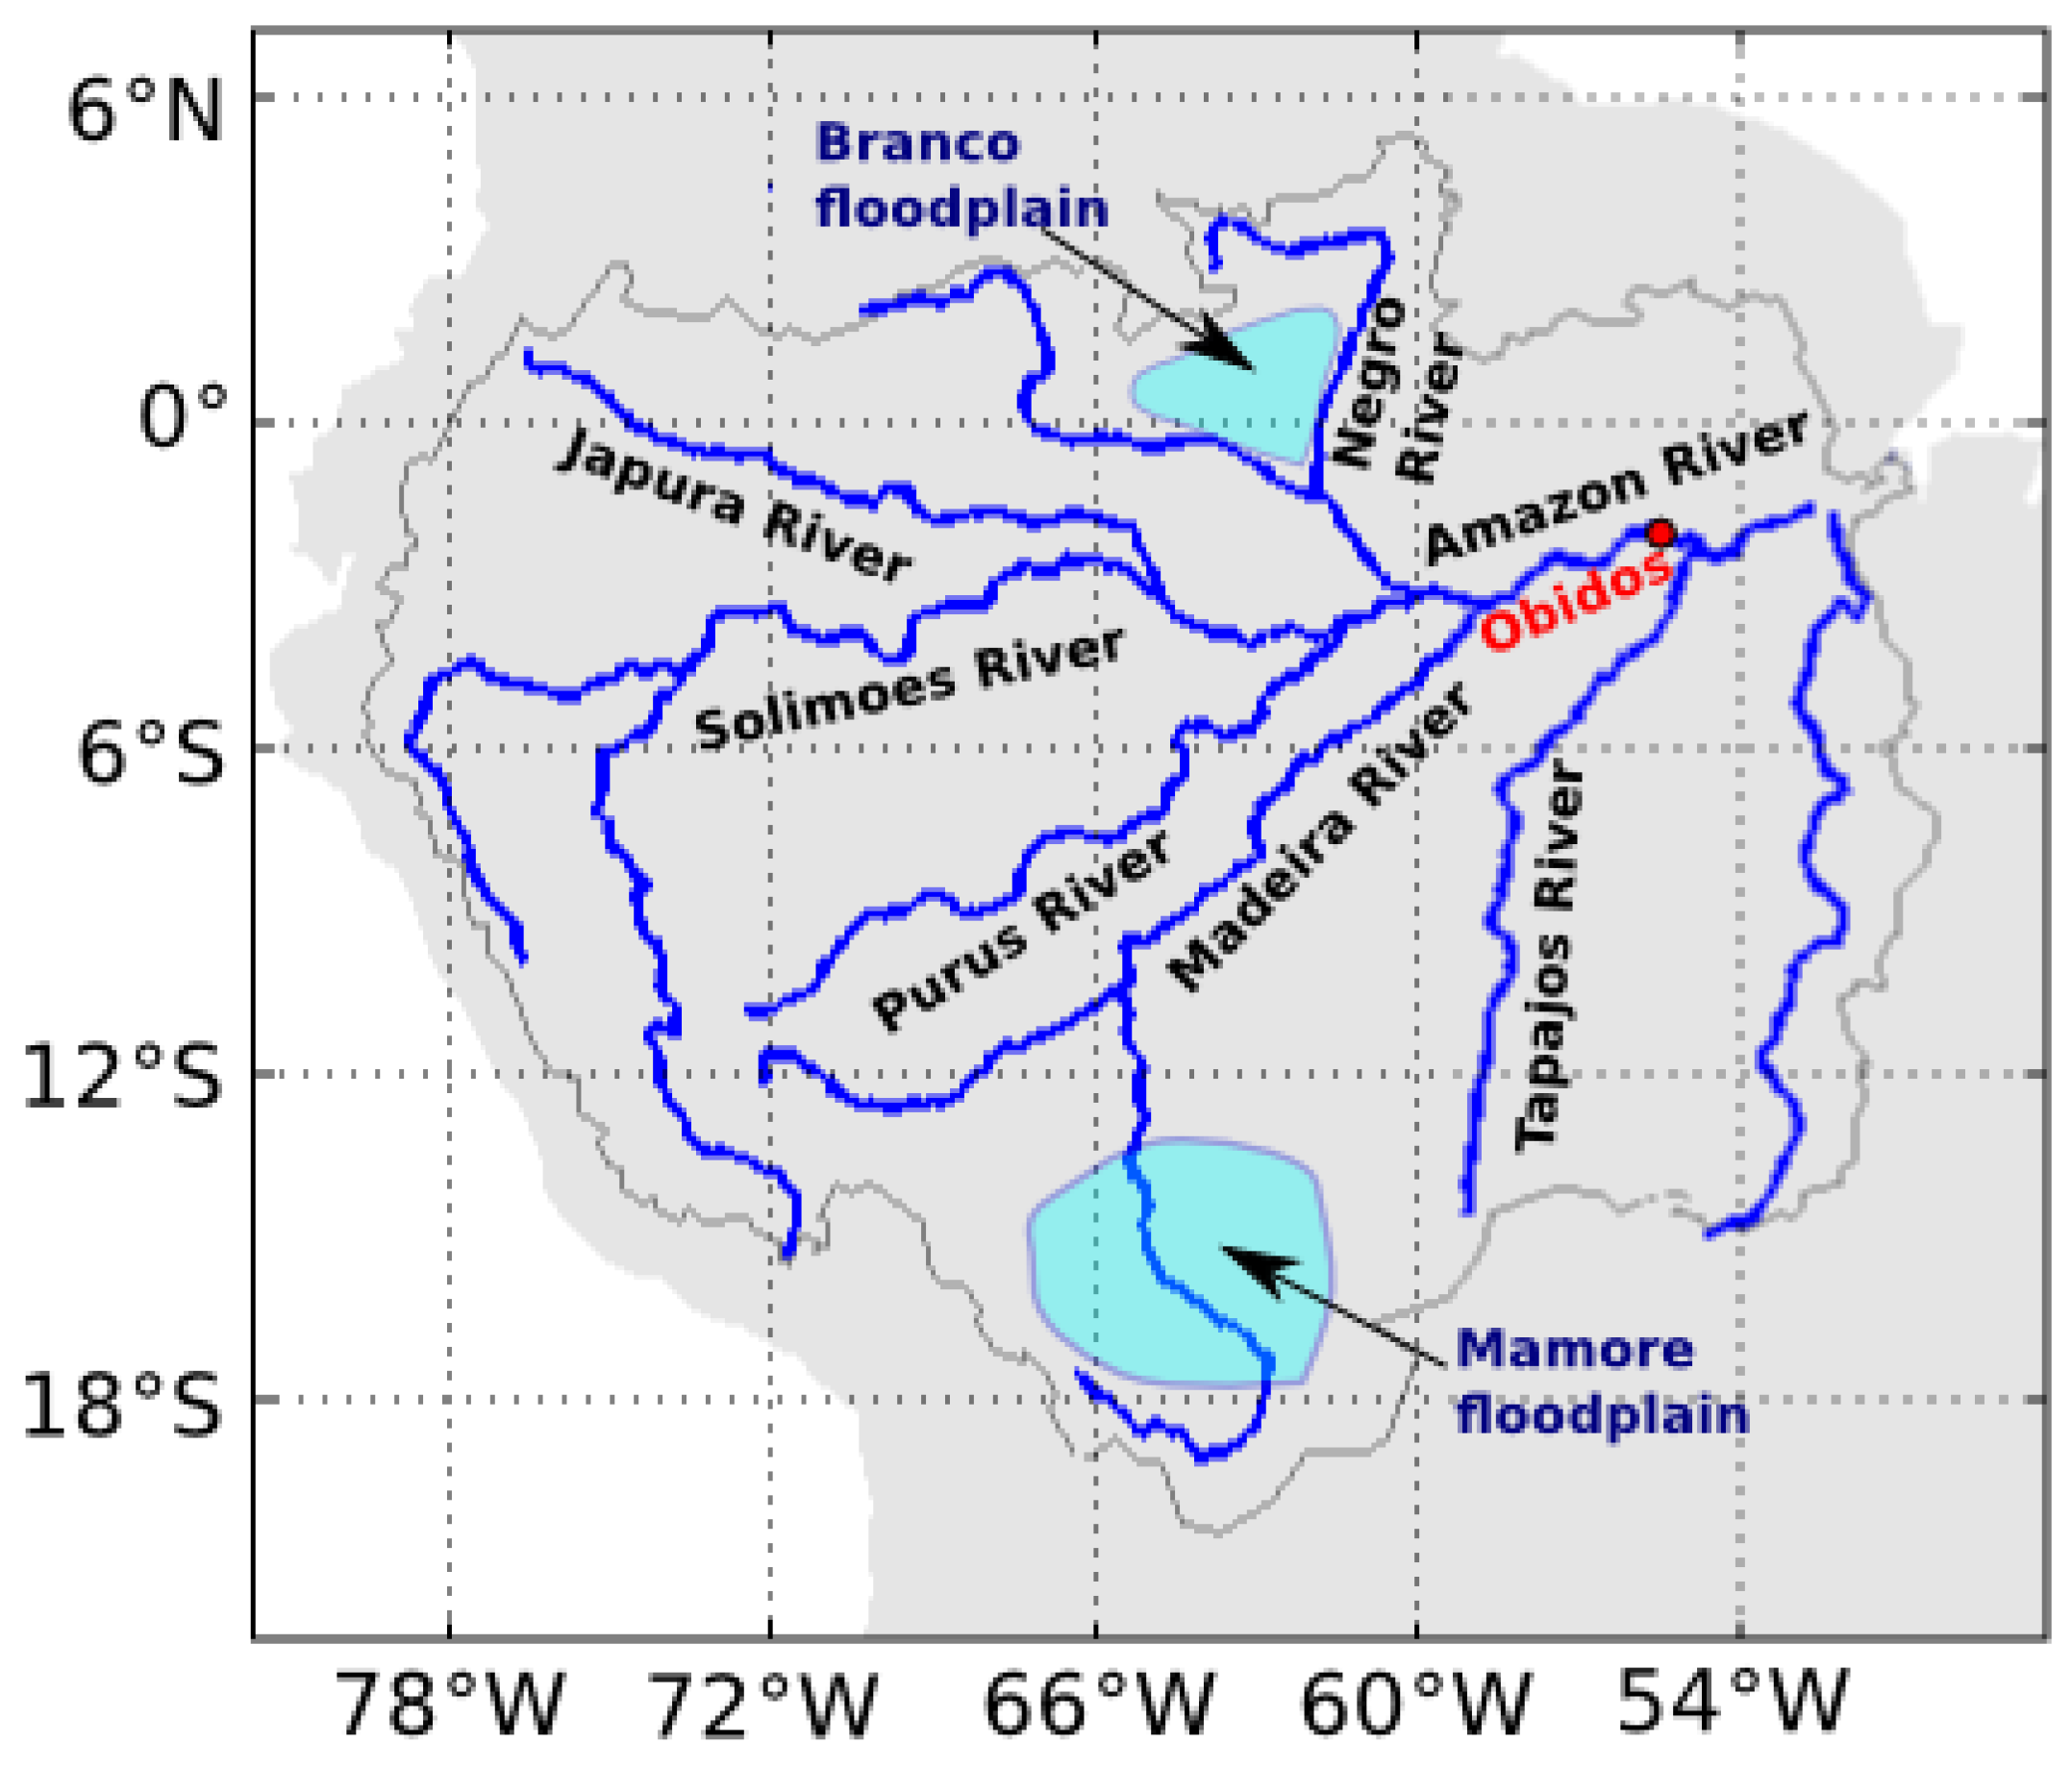
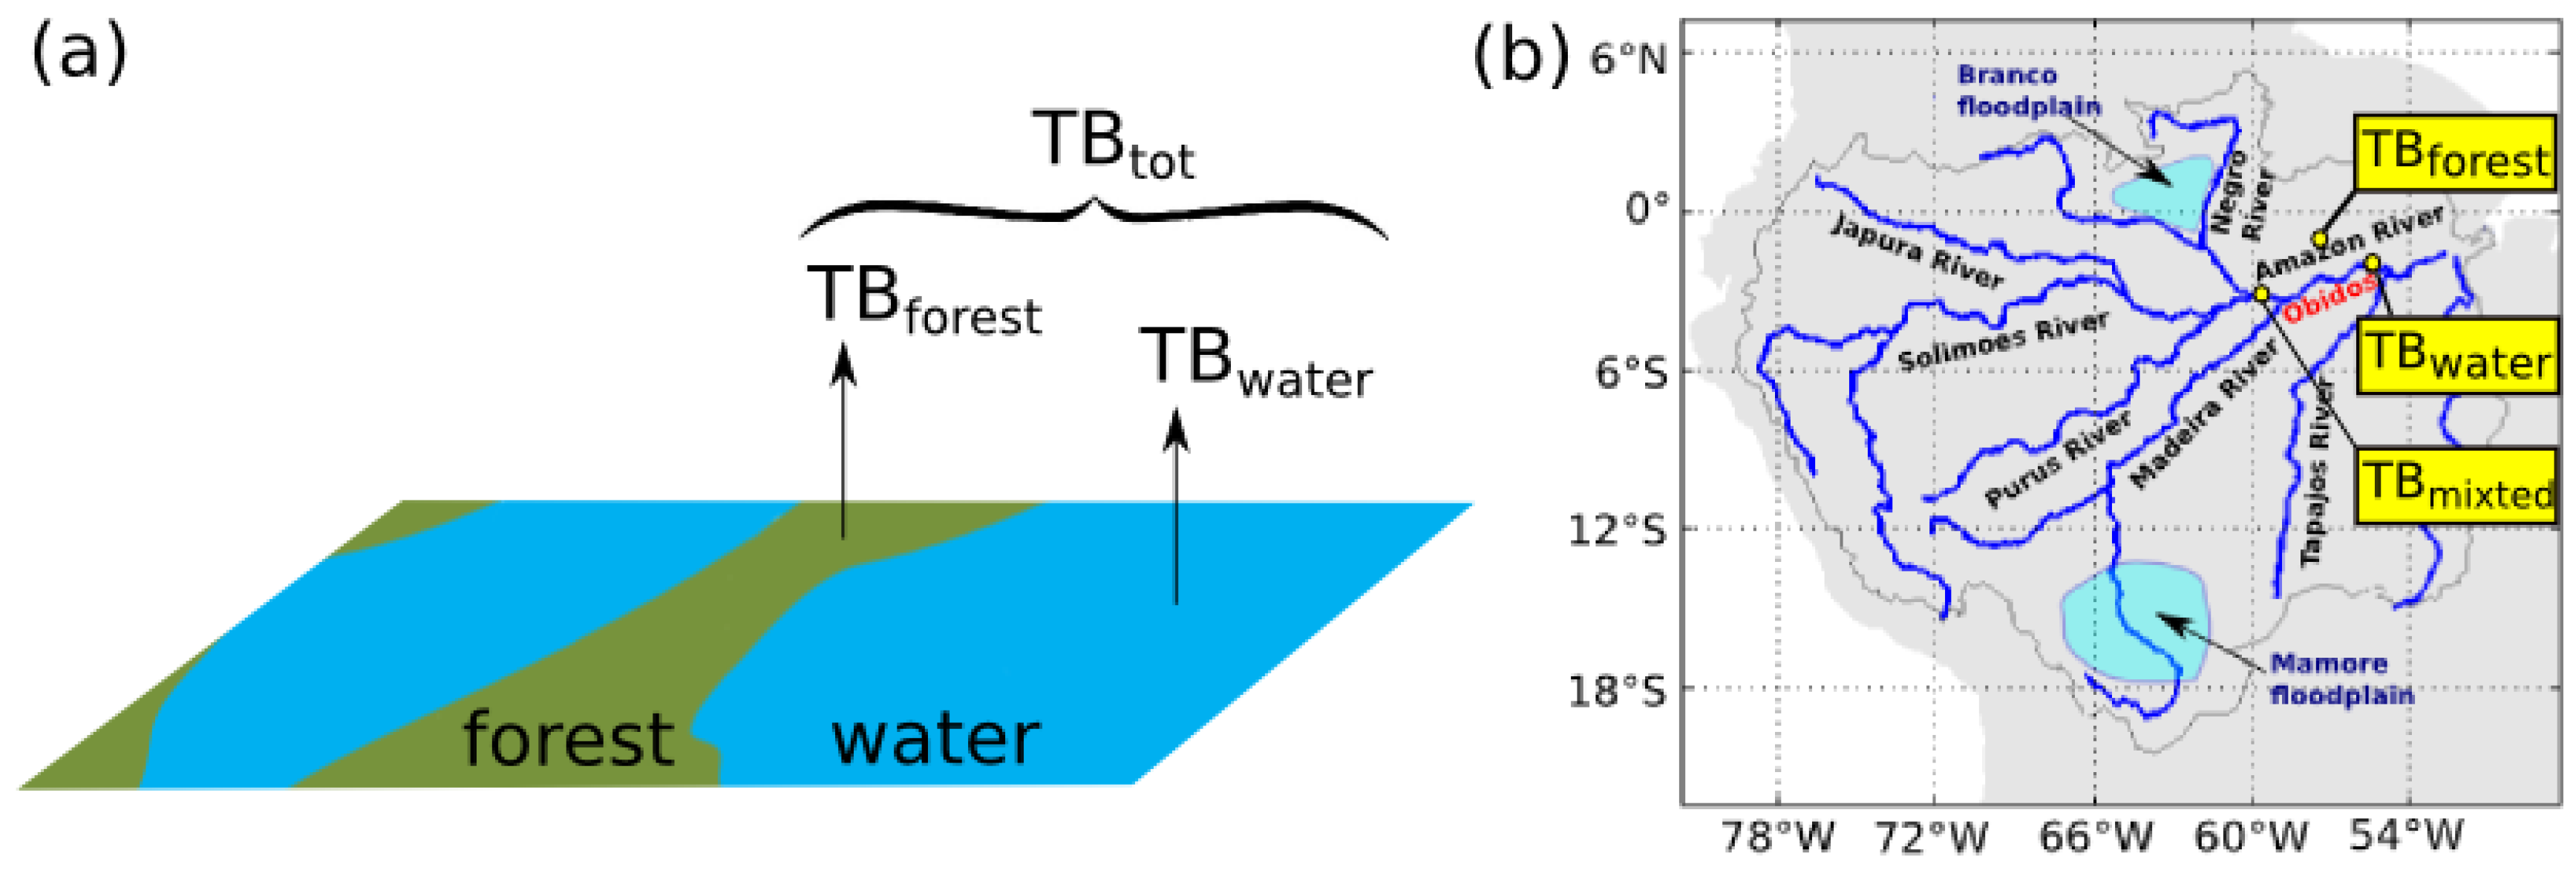
2. Study Areas
3. Data
3.1. L-Band Brightness Temperatures from SMOS
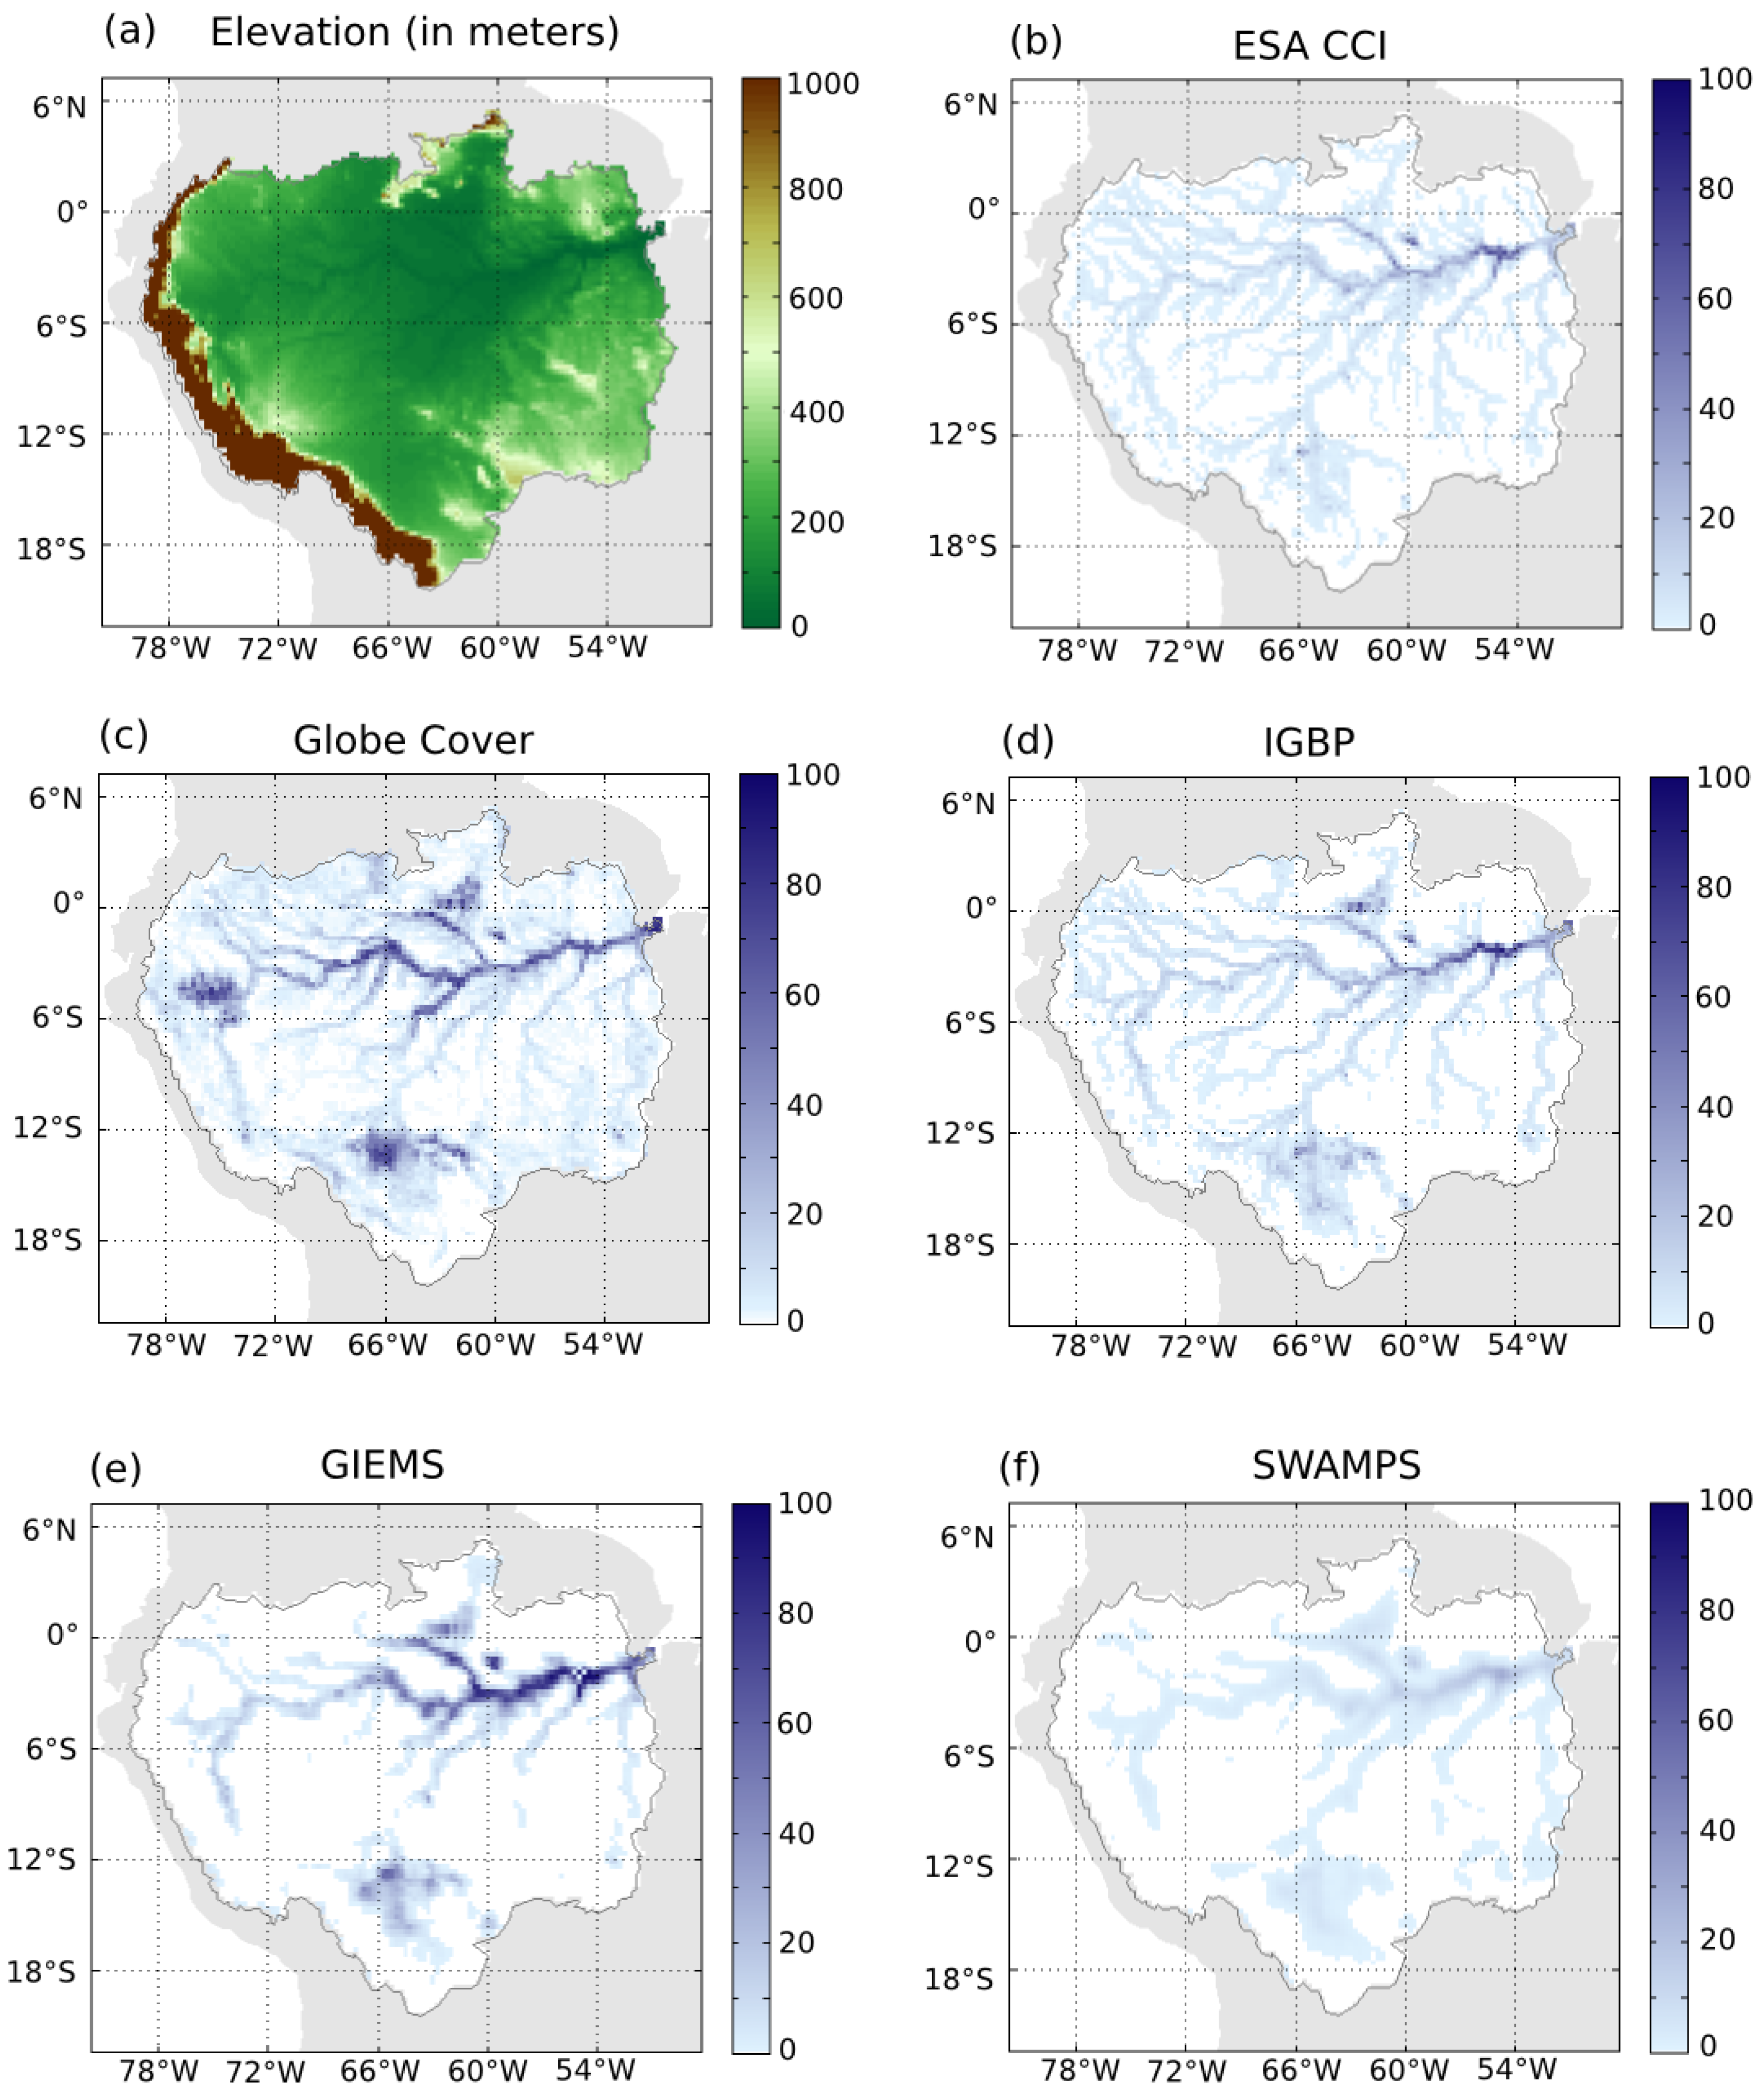
3.2. Topography
3.3. Skin Temperature
3.4. Precipitation Data
3.5. Static Land Cover Maps
3.6. Dynamics and Climatoloy of Water Fraction Data
3.7. Water Level from Satellite Altimetry
3.8. In Situ River Discharge Data
4. Methods
4.1. Contextual Radiative Transfer Model to Retrieve the Water Fraction under Dense Forests
4.1.1. Description of the SWAF Algorithm
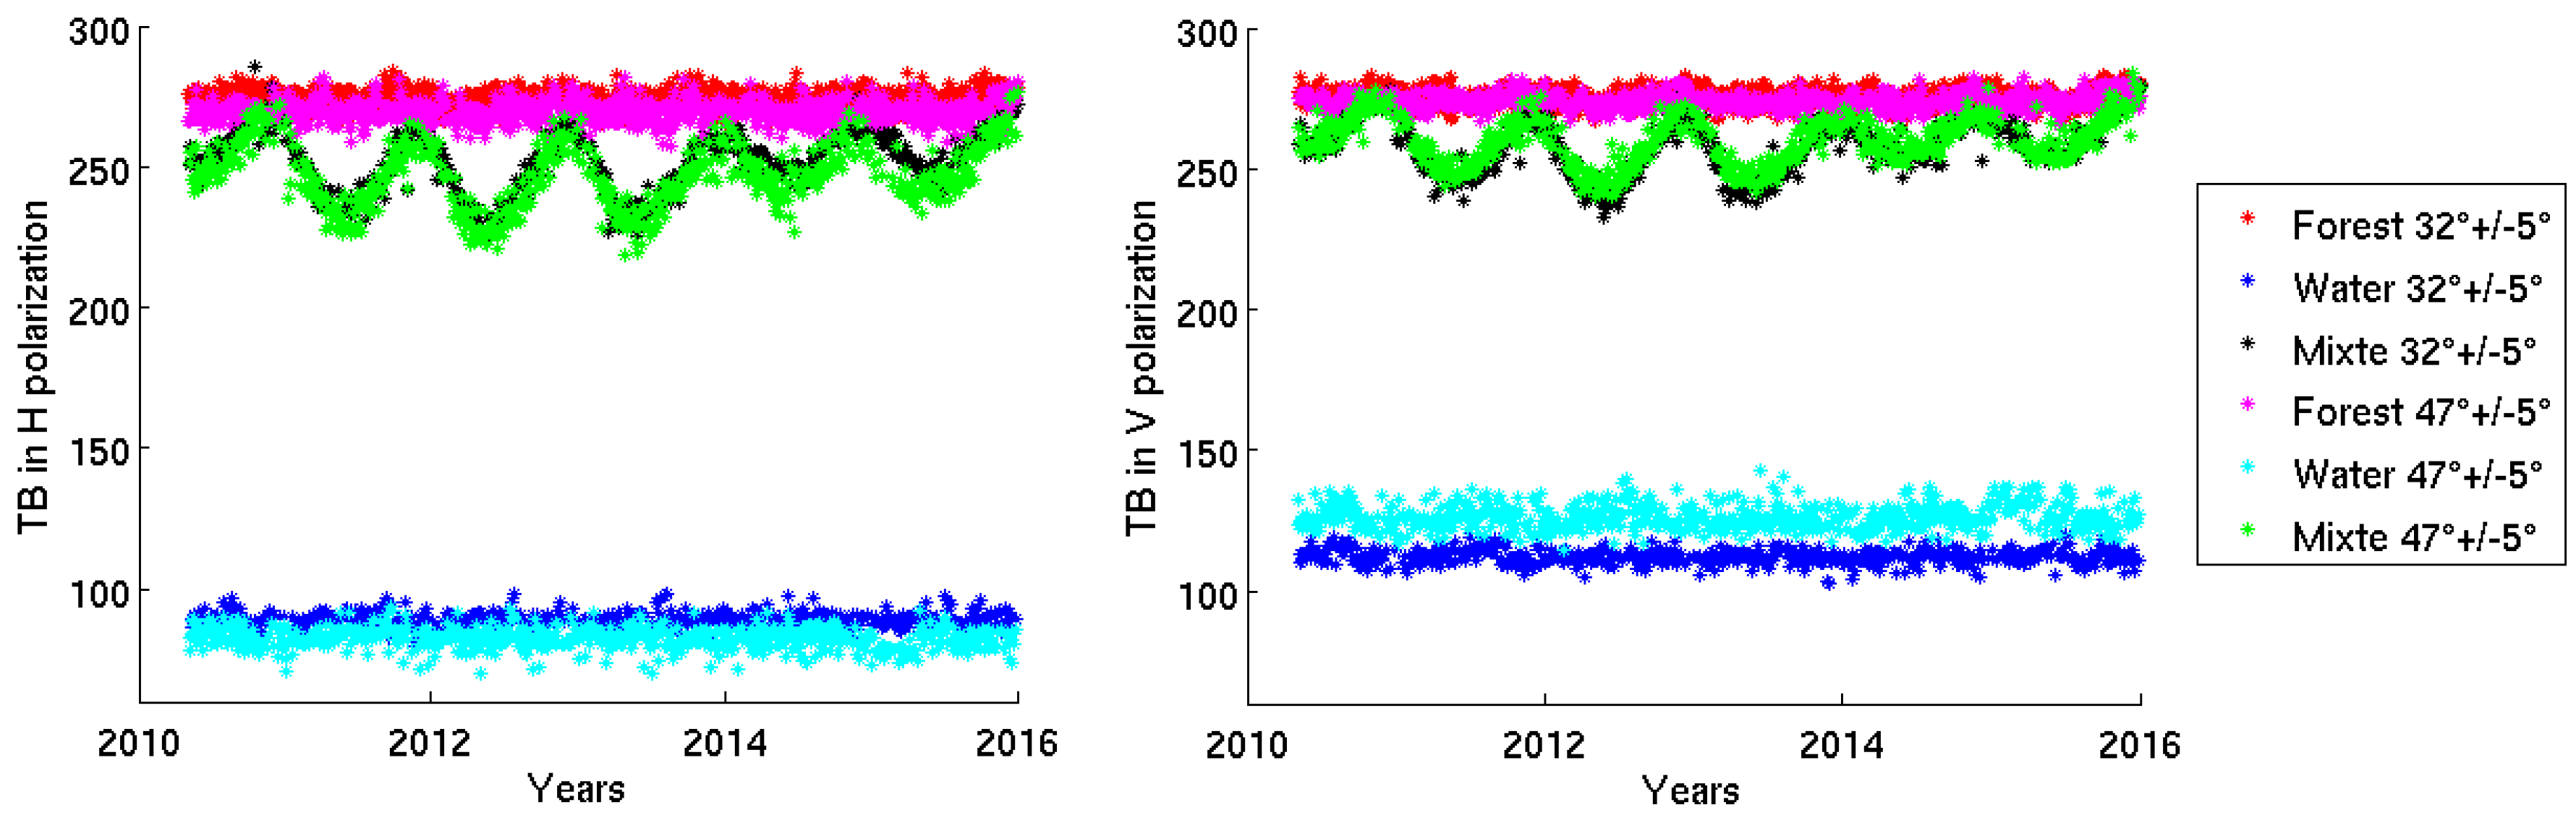
4.1.2. Forest and Water TB Reference
4.2. Statistic Scores’ Computation
5. Results over the Amazon Basin
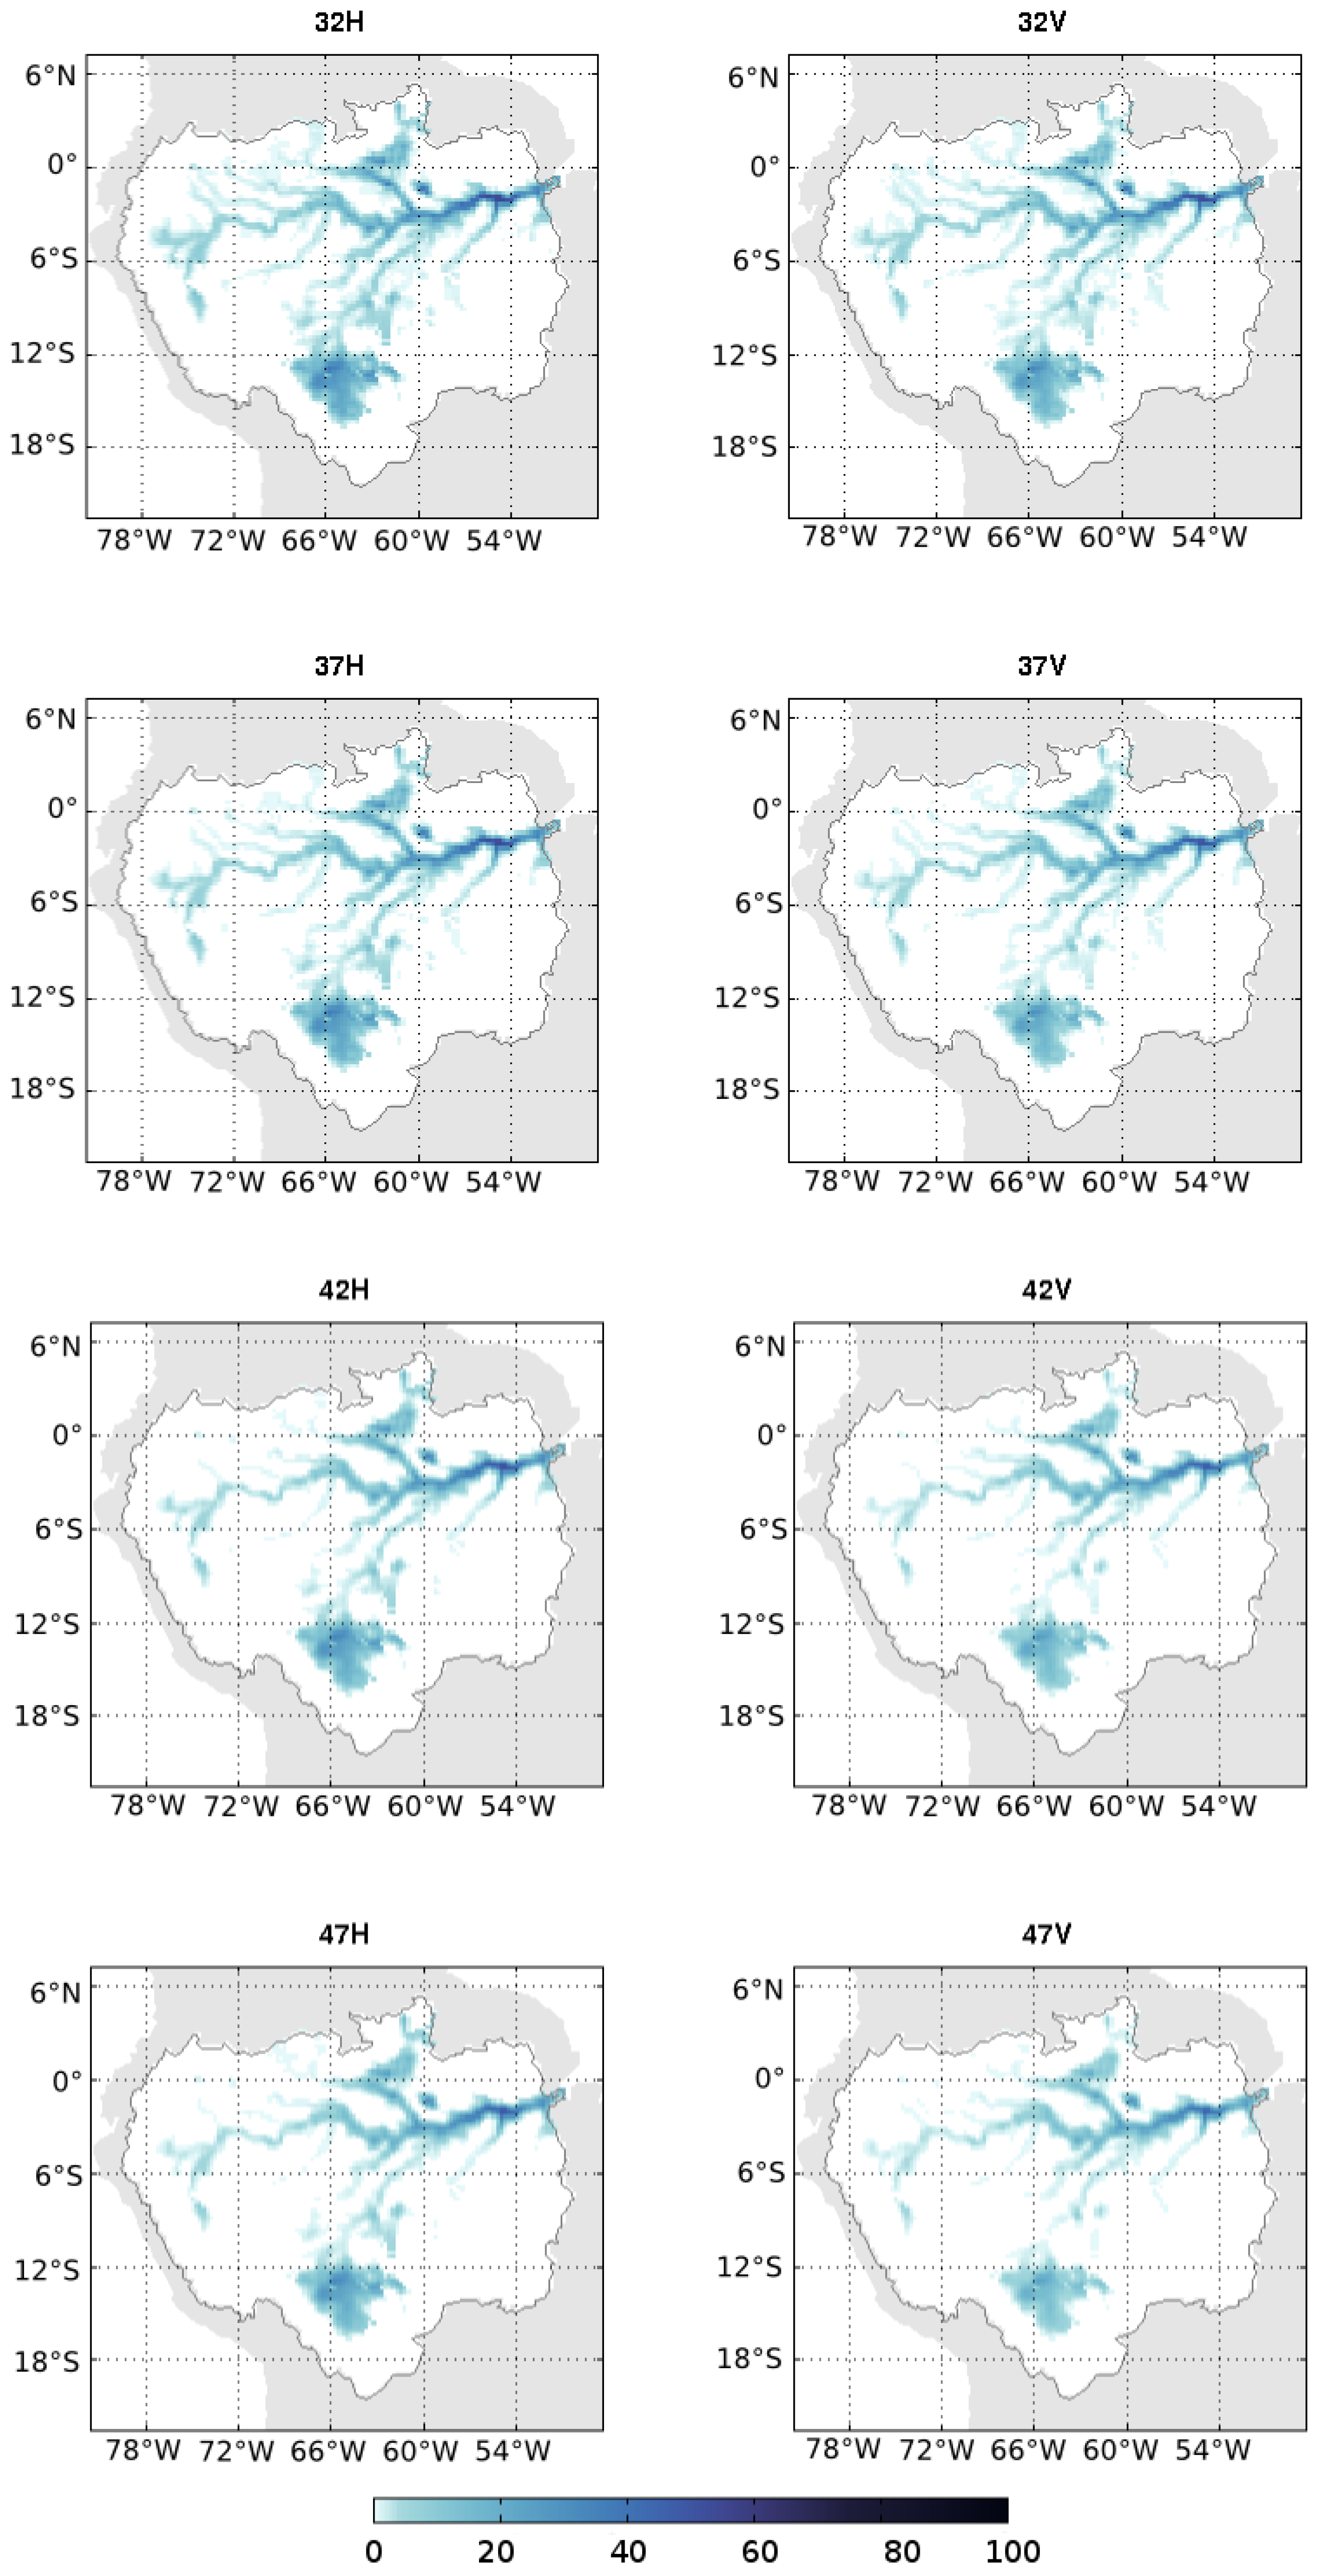
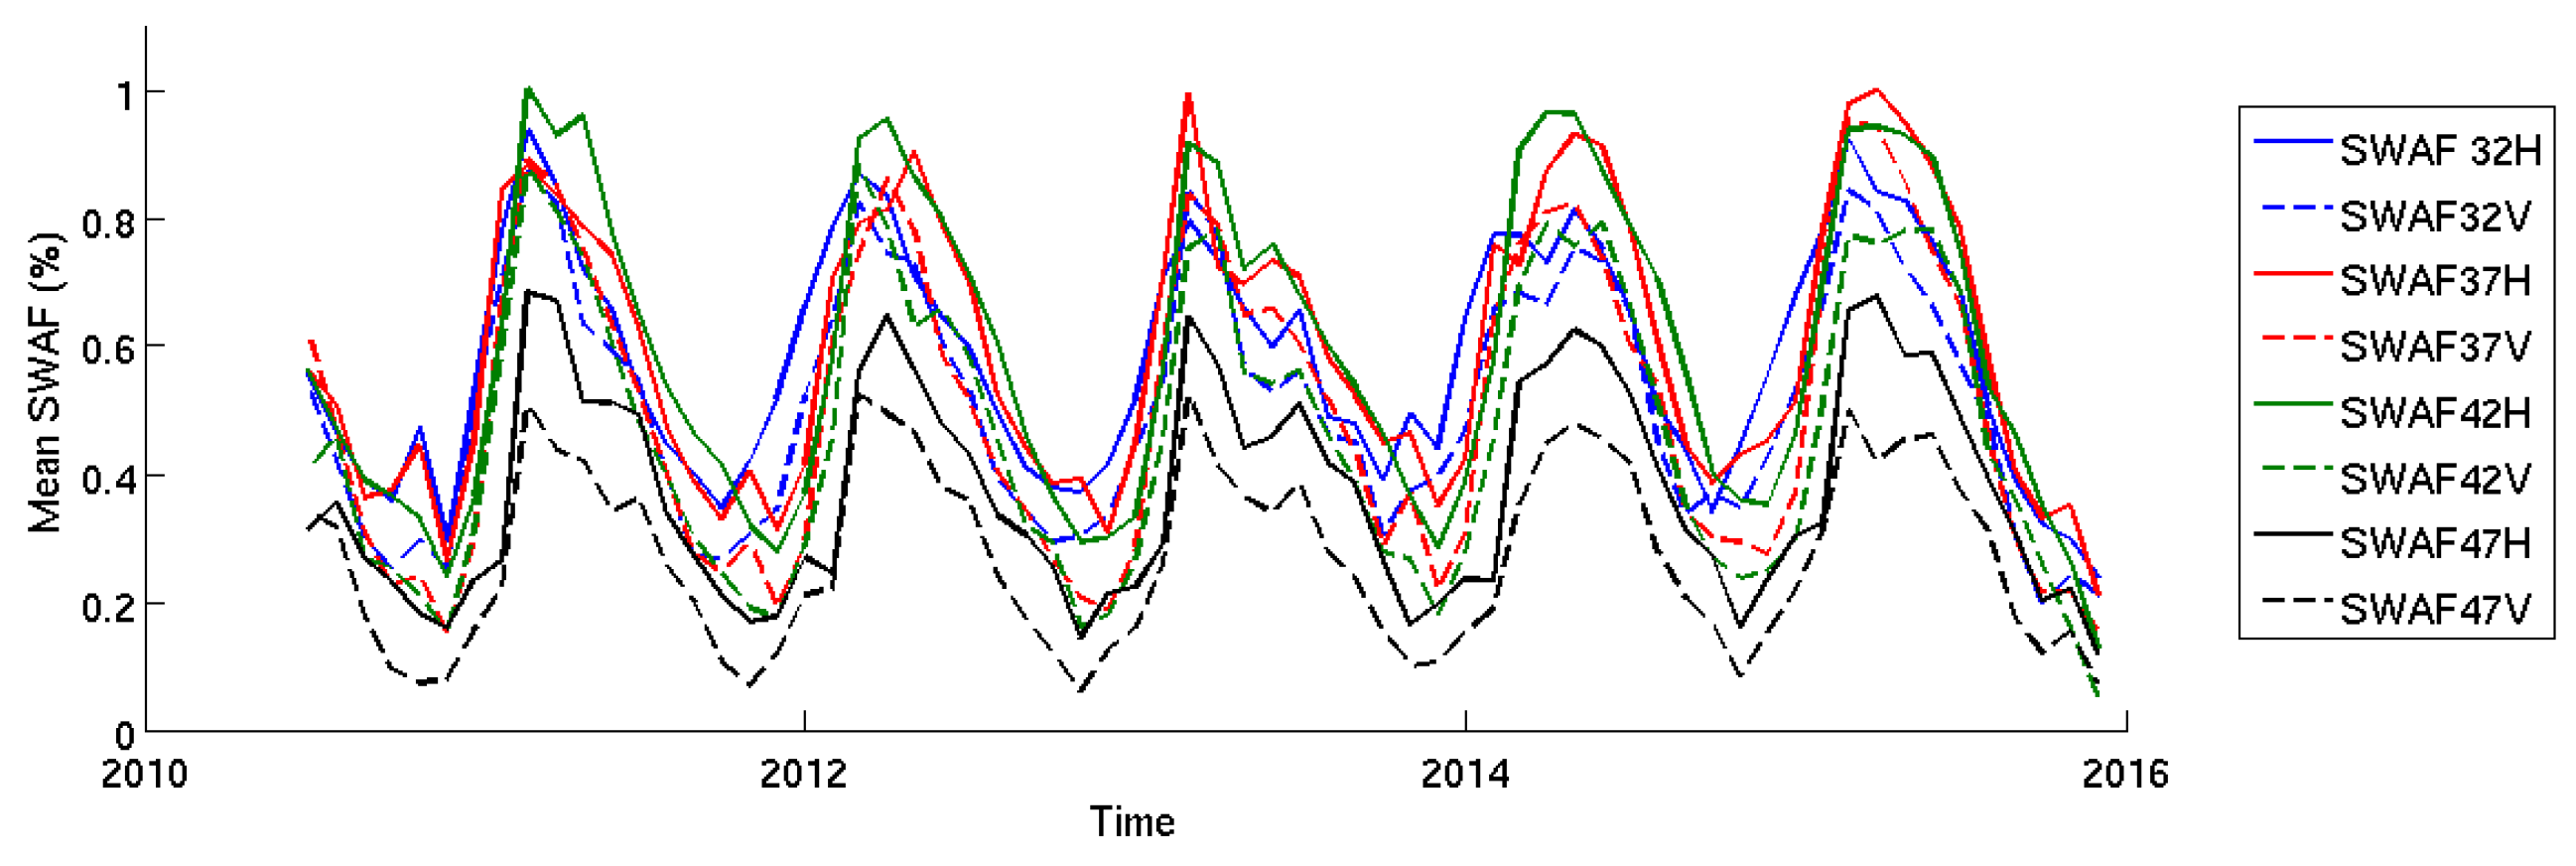
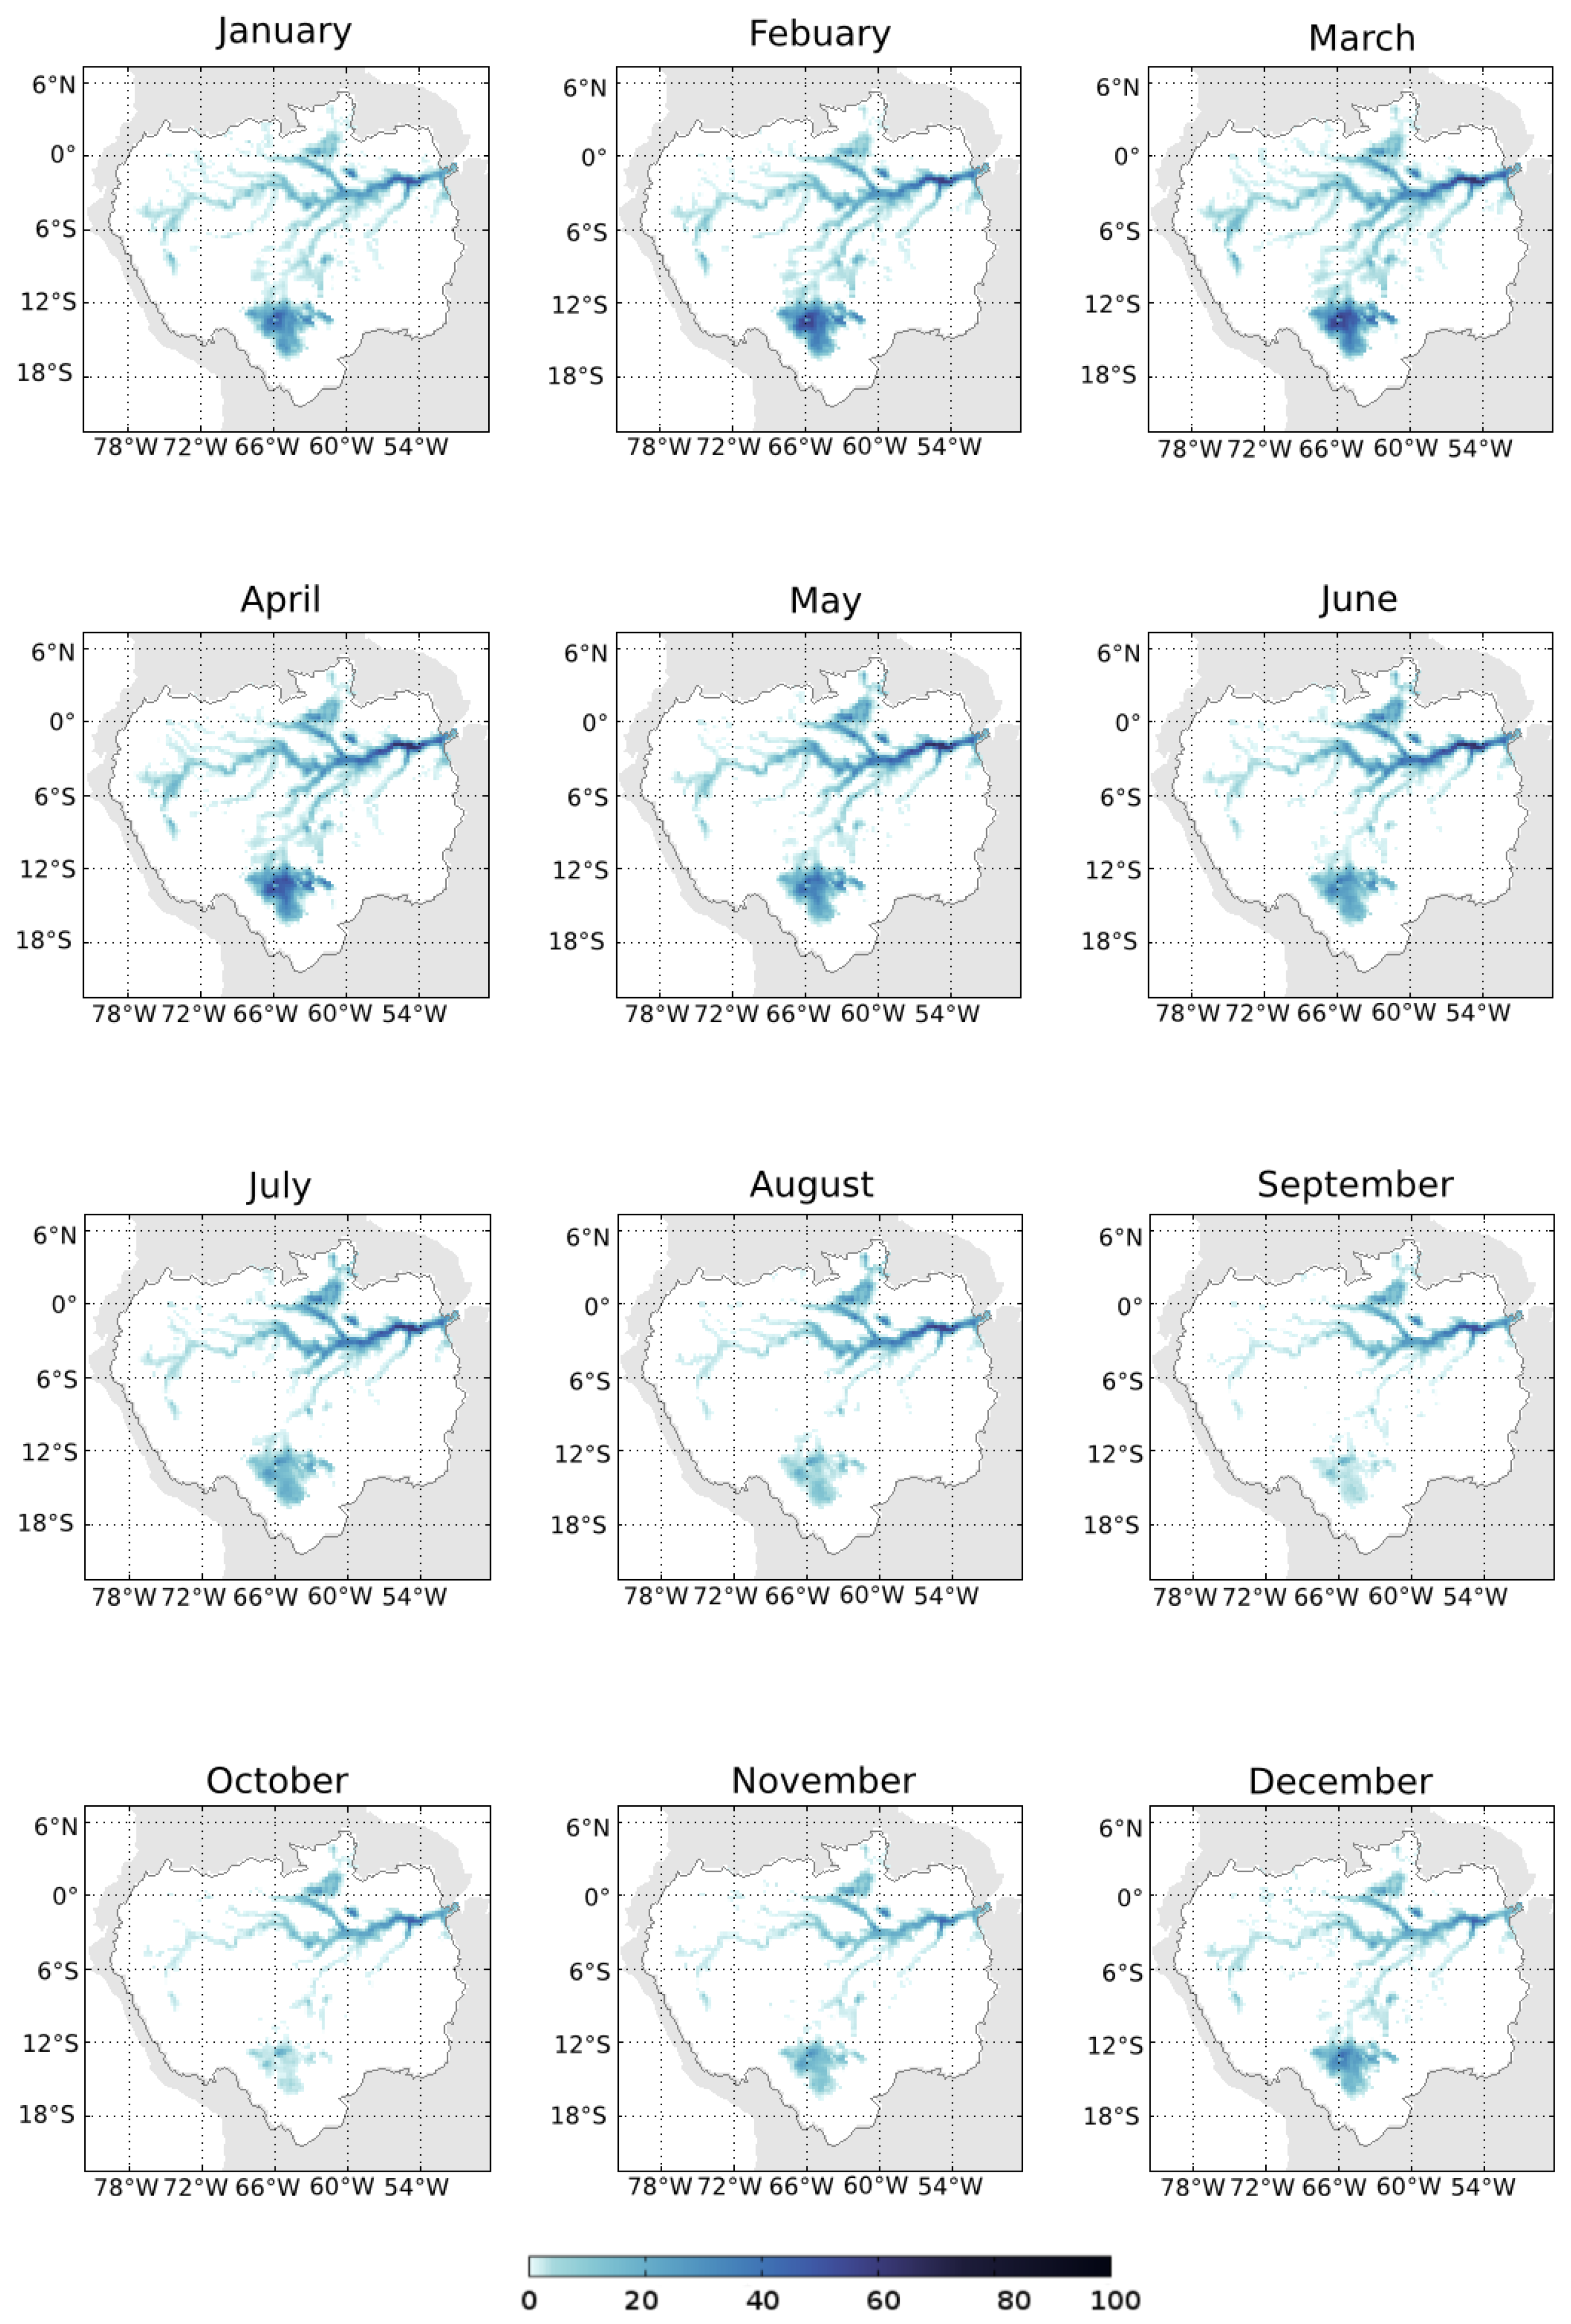
5.1. Spatial Patterns and Temporal Dynamics of the SWAF Maps
5.2. Comparison and Validation
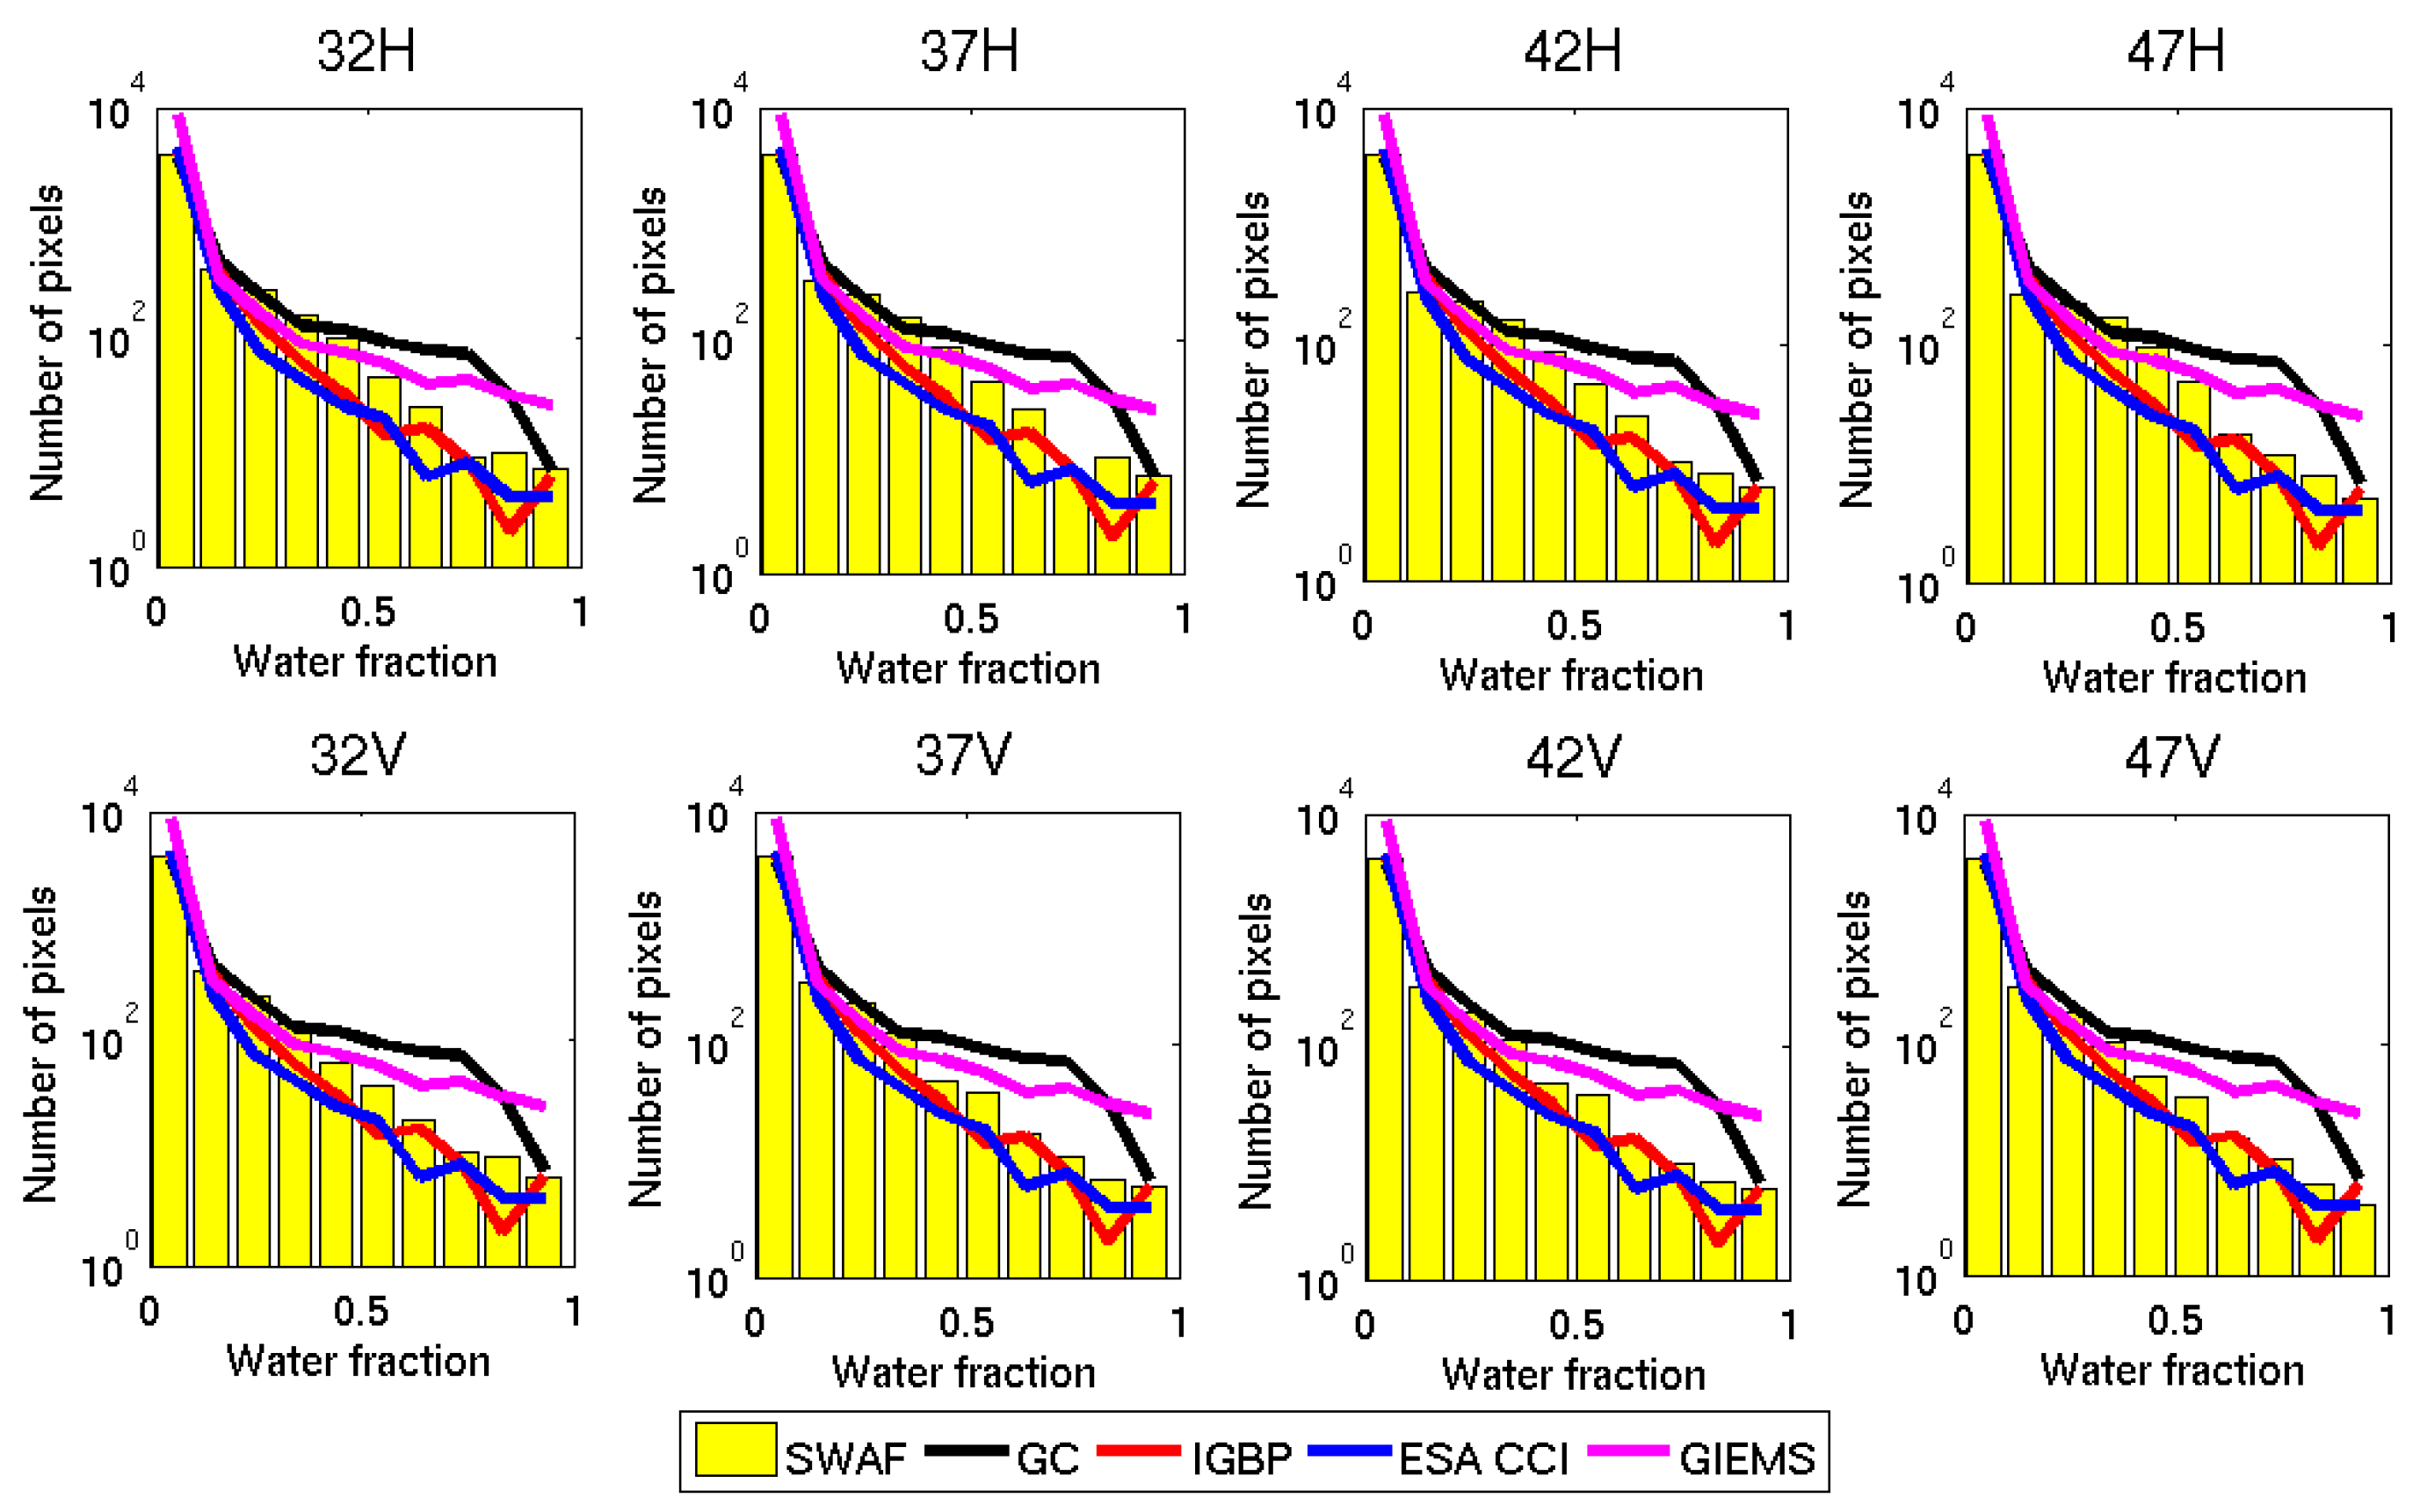
5.2.1. Comparison to Static and Climatological Water Extent Maps
5.2.2. Comparison with Water Height Measured by Altimetry
5.2.3. Comparison with SWAMPS Dynamic Surface Extent
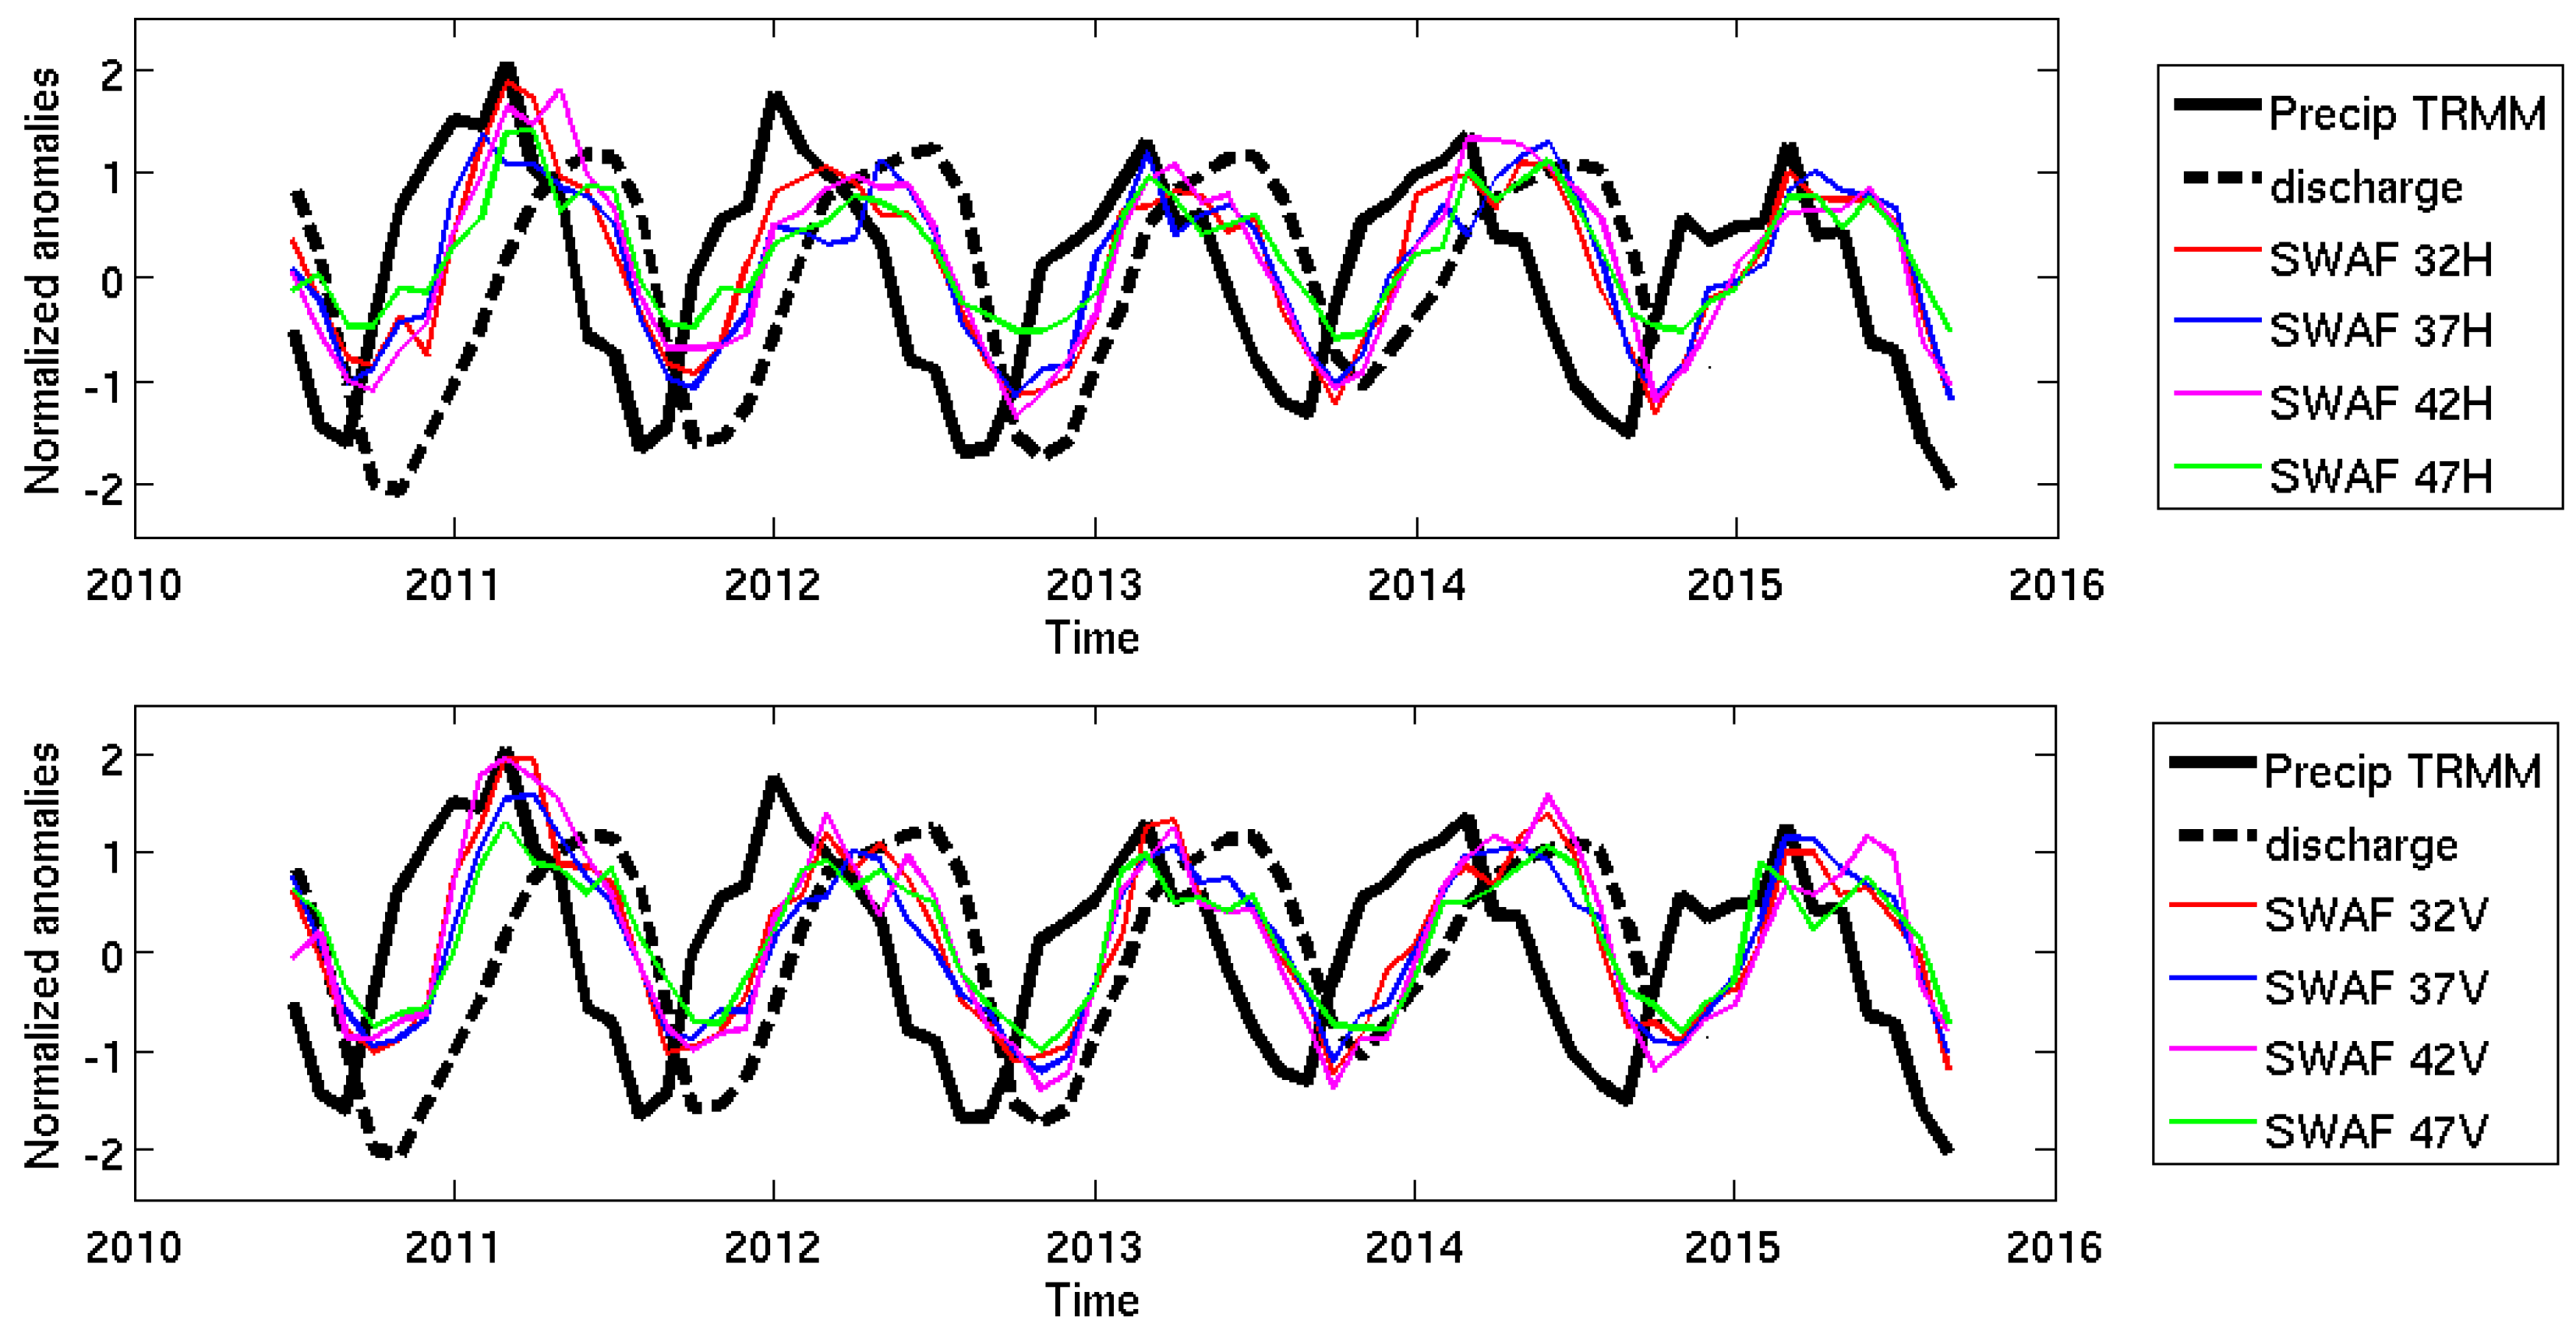
5.2.4. Link between SWAF and the Hydrological Components
6. Discussion
6.1. Water Surface Validation
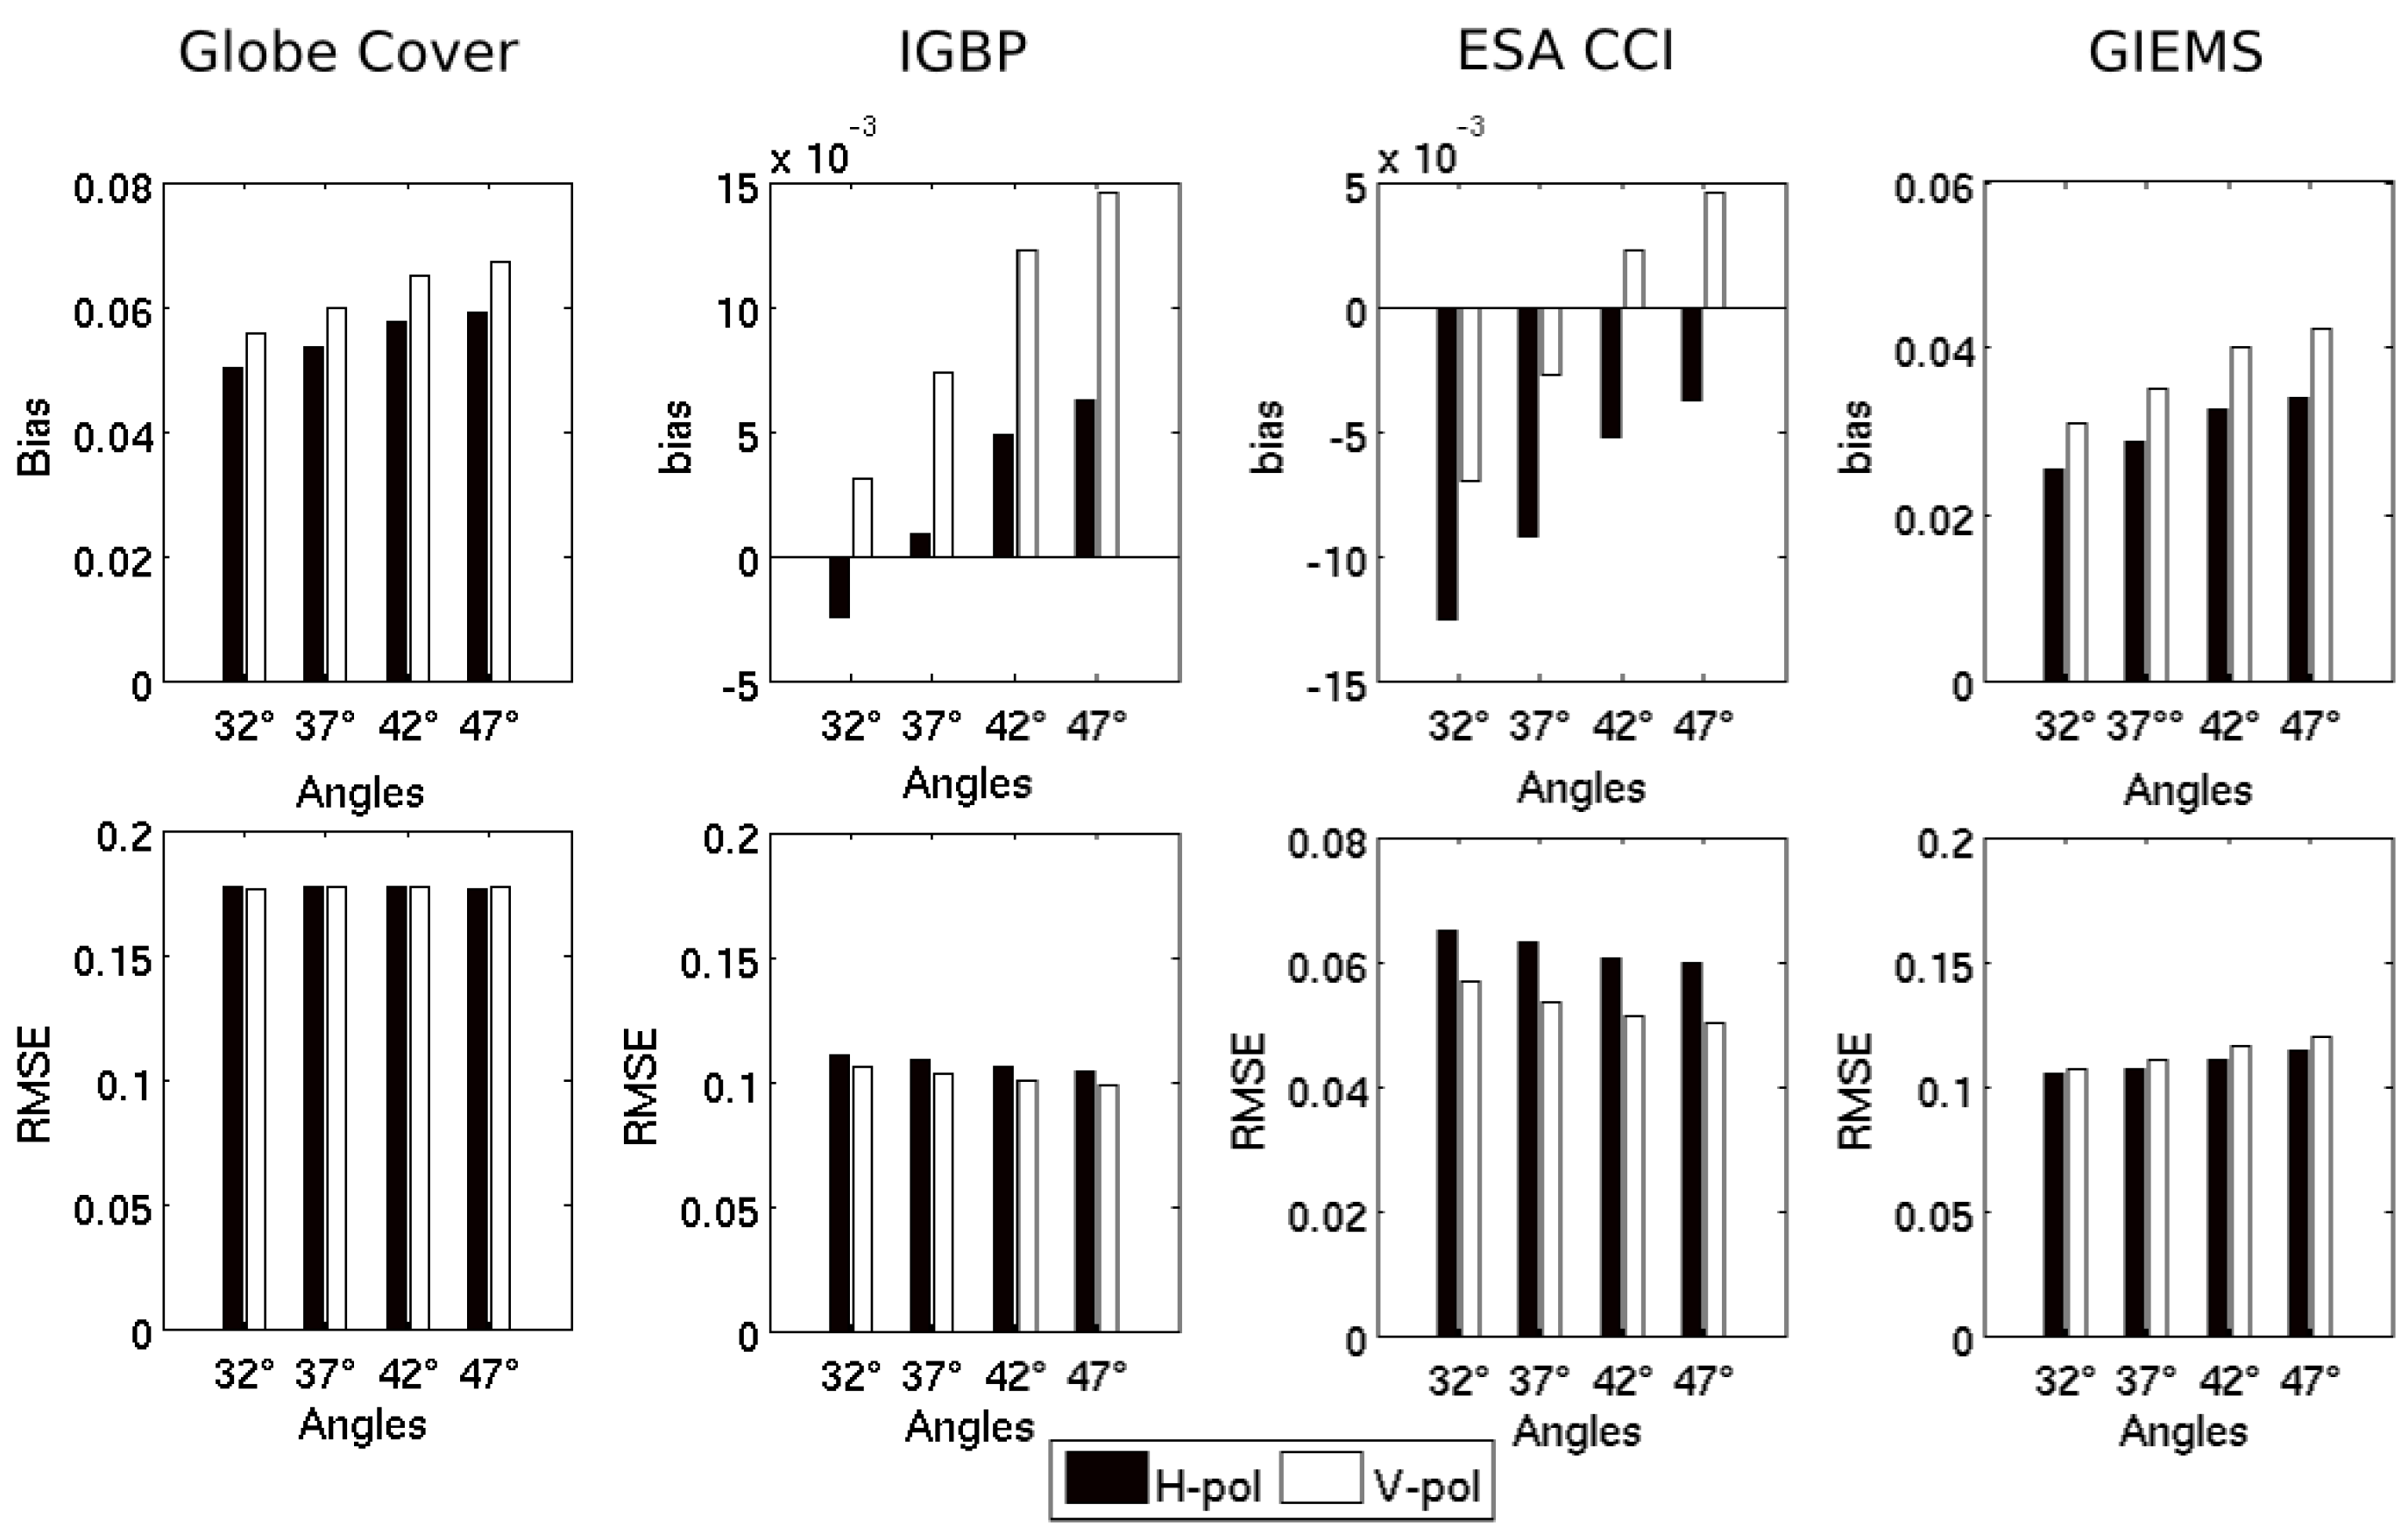
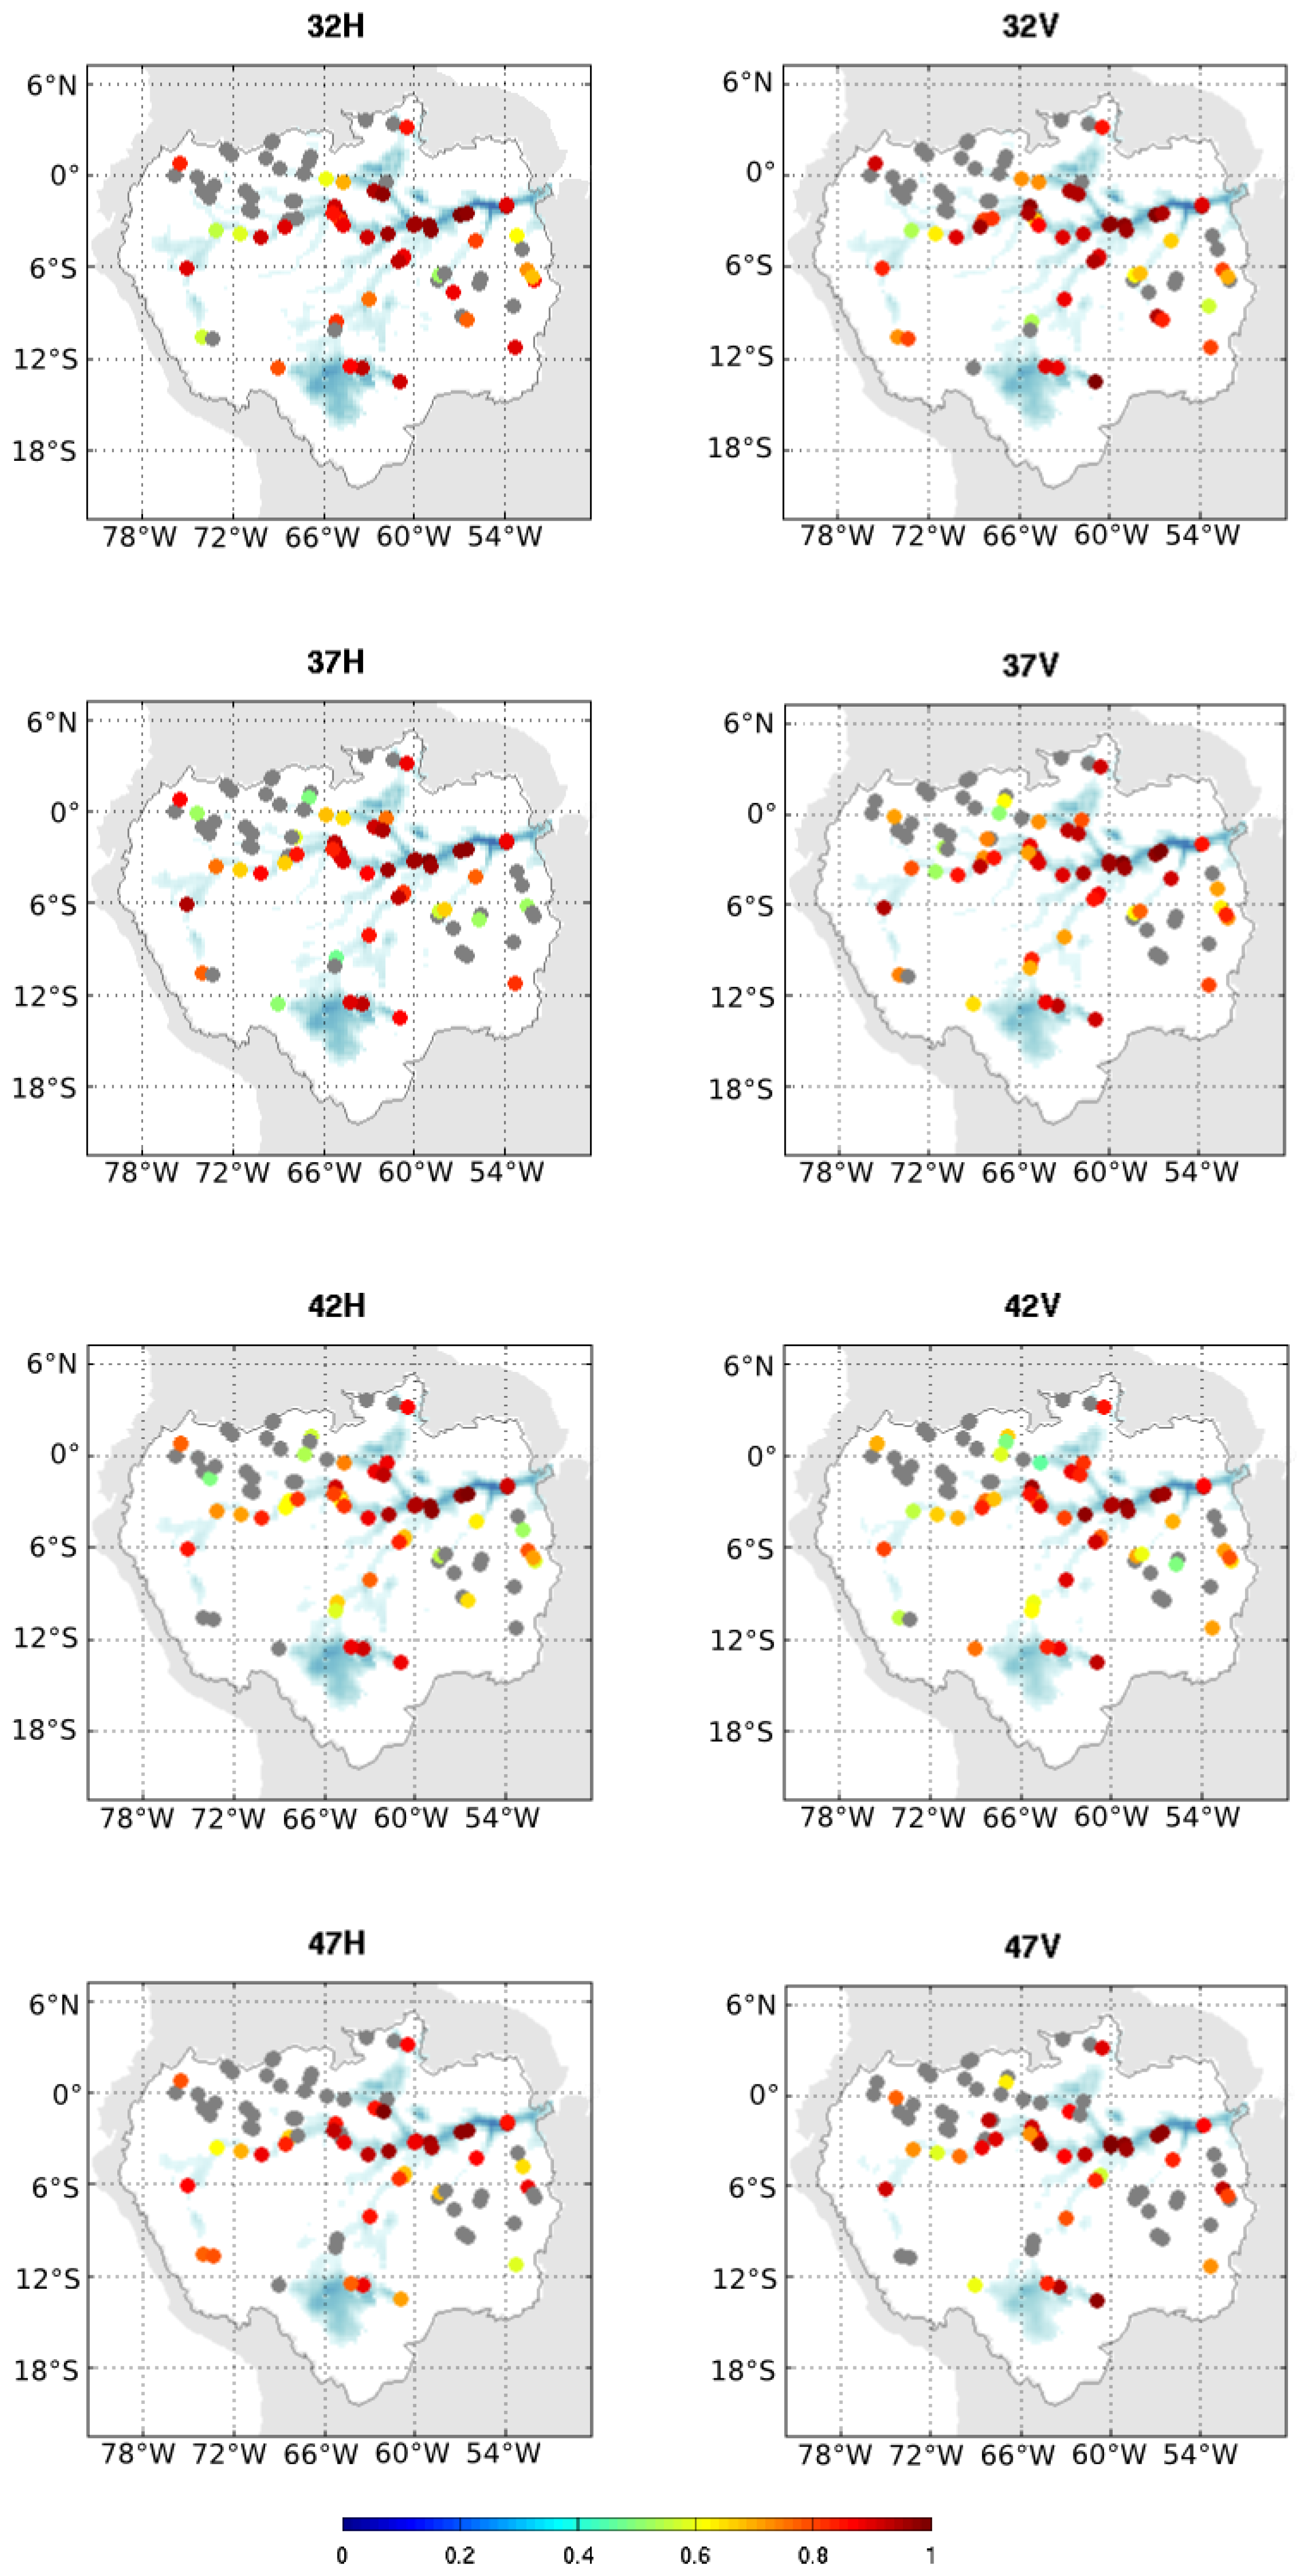
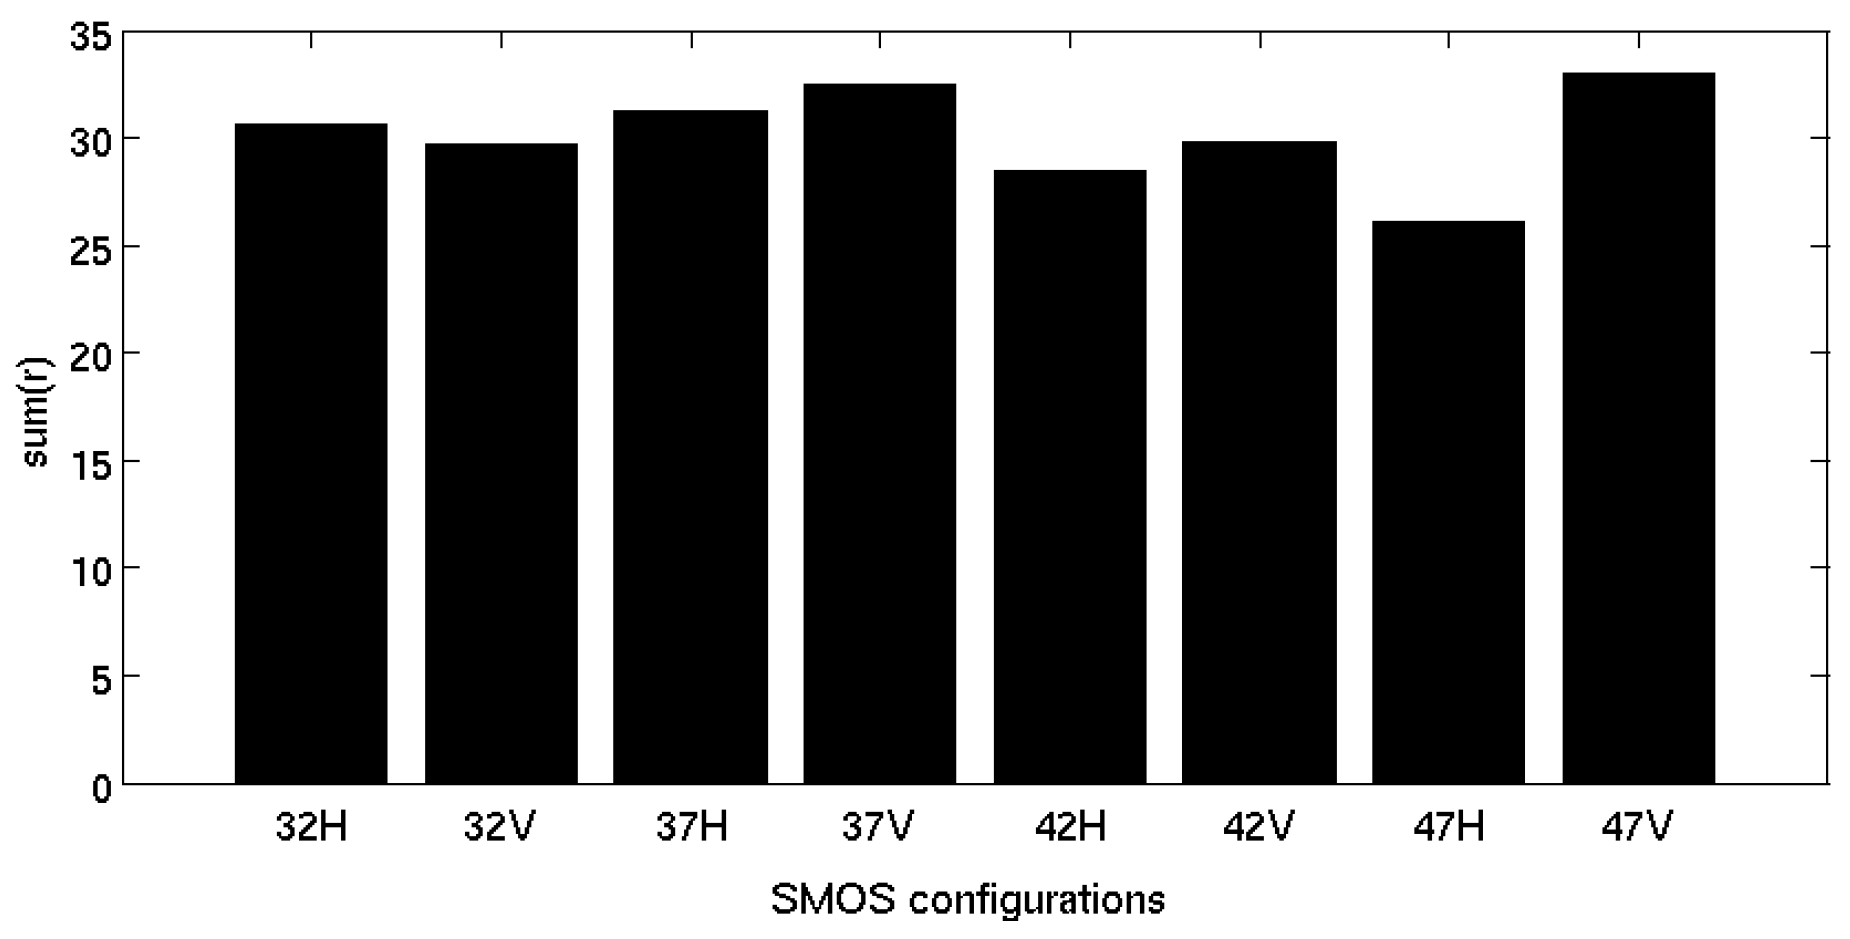
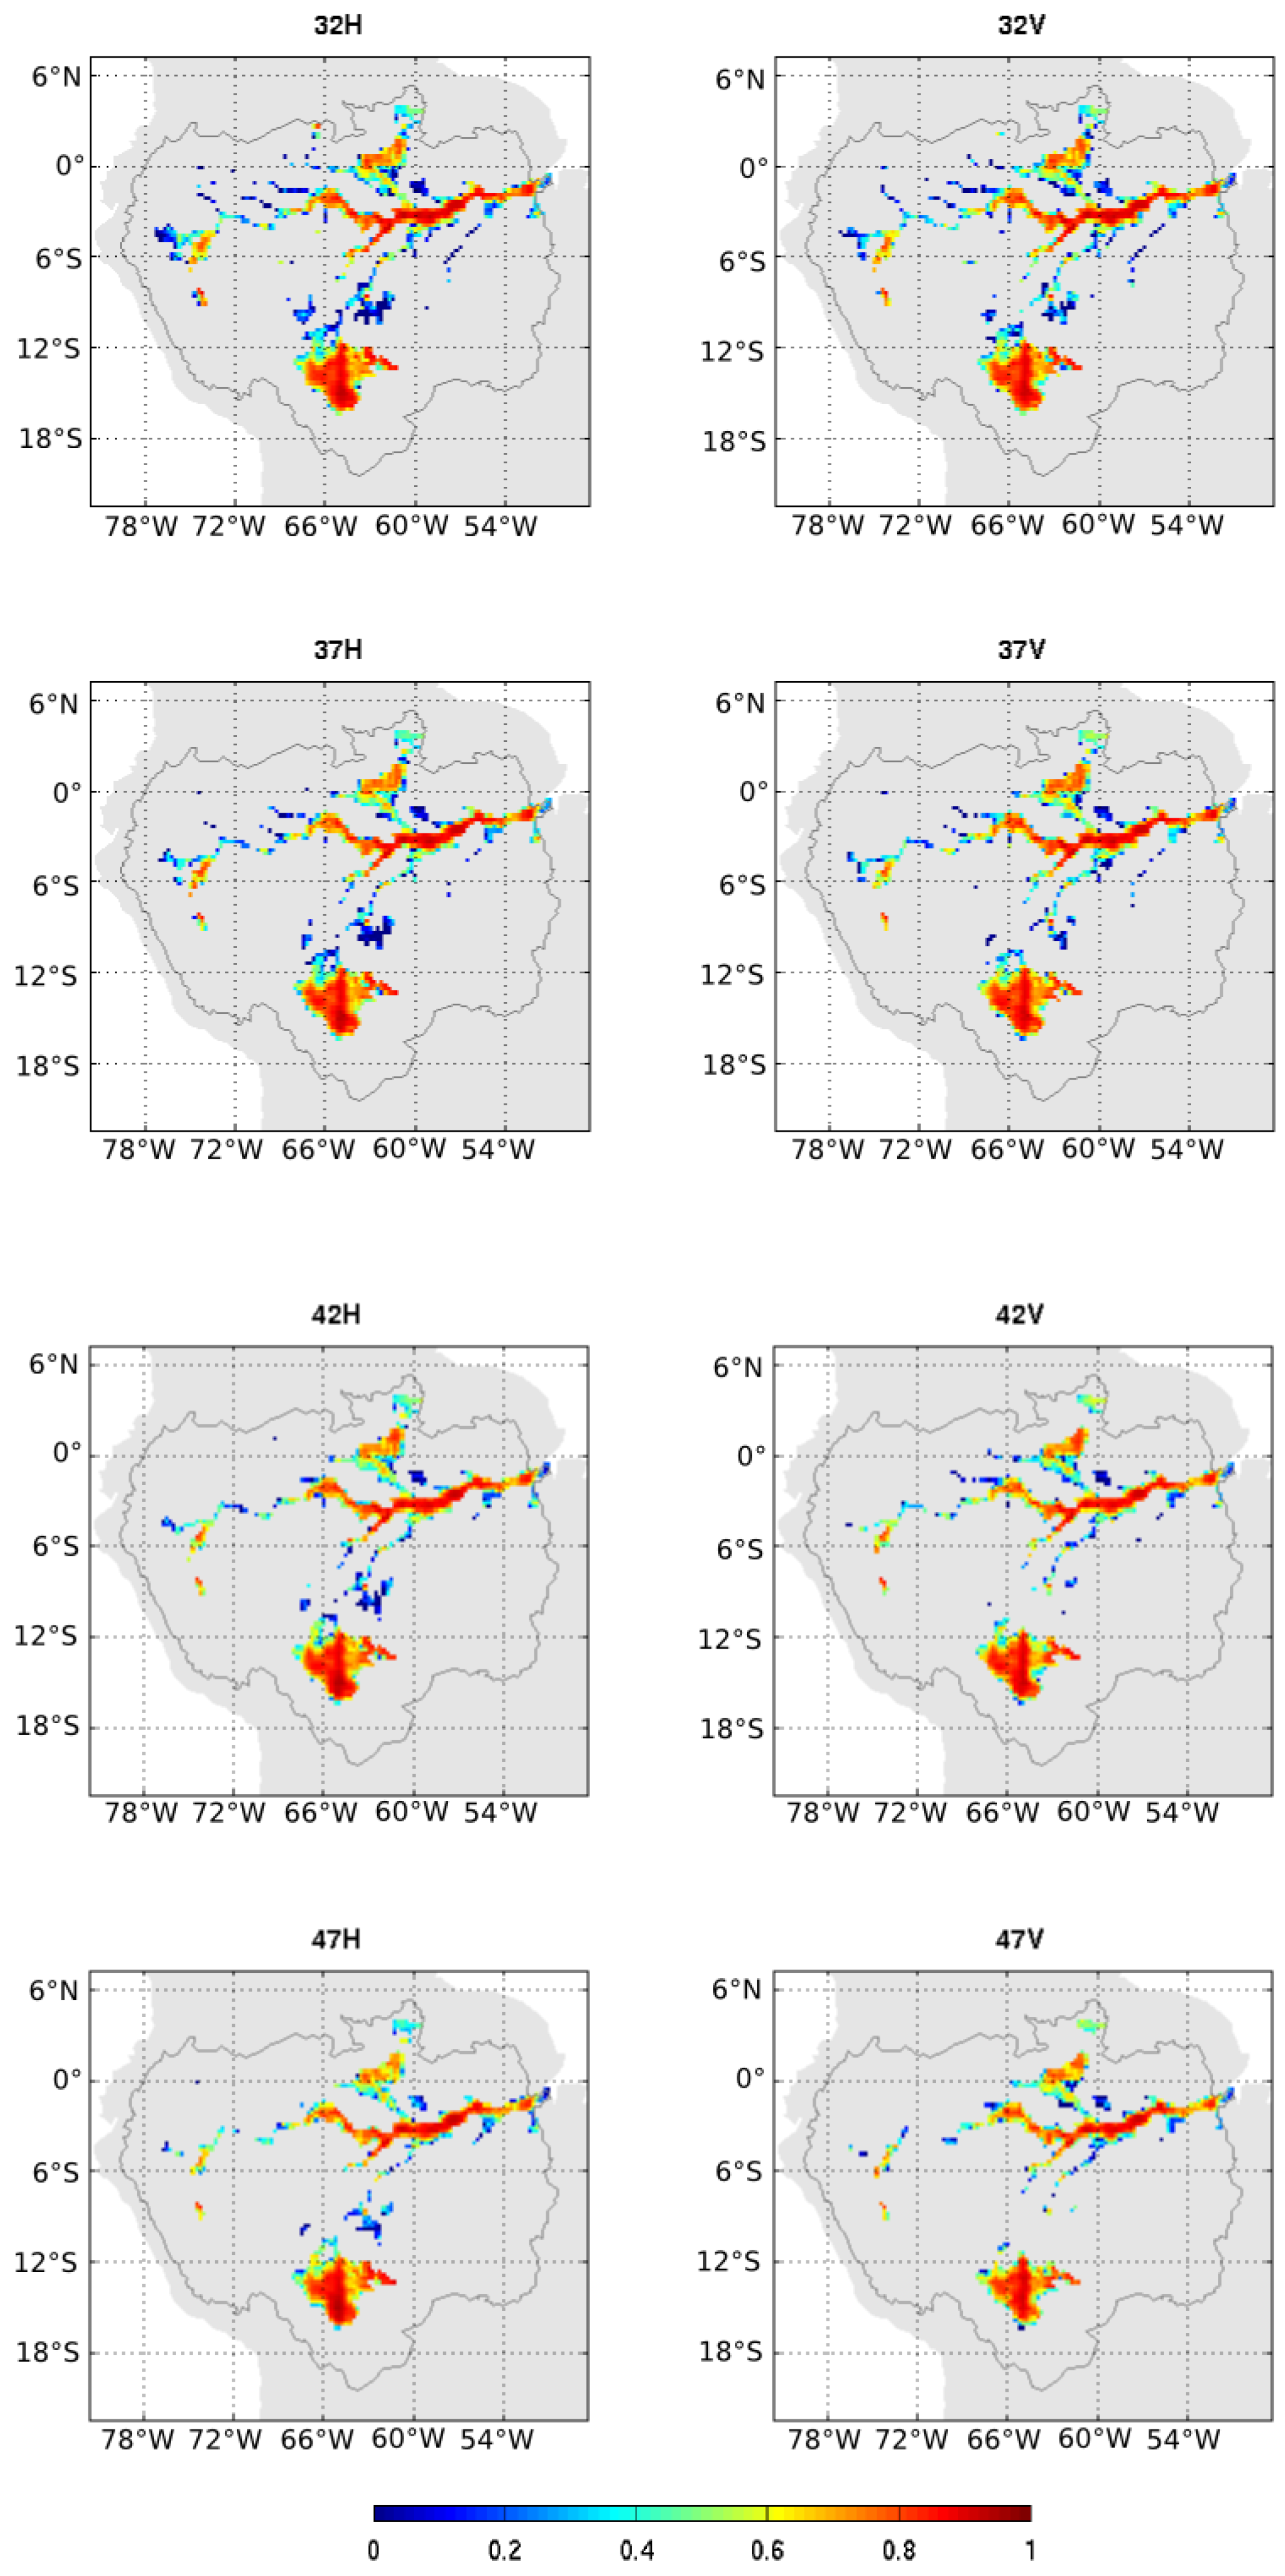
6.2. Impact of the Angles and Polarization on the Water Surface Retrievals
6.3. Impact of Vegetation Cover
6.4. Limitations and Prospects of the SWAF Dataset
7. Conclusions and Prospect
Acknowledgments
Author Contributions
Conflicts of Interest
Abbreviations
| SAR | Synthetic Aperture Radar |
| SWOT | Surface Water Ocean Topography |
| V | Vertical |
| H | Horizontal |
| SMMR | Scanning Multichannel Microwave Radiometer |
| GIEMS | Global Inundation Extent from Multi-Satellites |
| SSMI/I | Special Sensor Microwave/Imager |
| ERS | European Remote Sensing |
| QSAT | QuickSCAT |
| ASCAT | Advanced Scatterometer |
| SSM/S | Special Sensor Microwave/Sounder |
| SMOS | Soil Moisture and Ocean Salinity |
| SMAP | Soil Moisture Active and Passive |
| ESA | European Space Agency |
| CNES | Centre National d’Etude Spatiale |
| CDTI | Centro para el Desarrollo Teccnologico Industrial |
| L | Level |
| EASE | Equal-Area Scalable Earth |
| SRTM | Shuttle Radar Topography Mission |
| USGS | U.S. Geological Survey |
| IGBP | International Geosphere Biosphere Programme |
| AVHRR | Advanced Very High Resolution Radiometer |
| MODIS | Moderate Resolution Imaging Spectroradiometer |
| CCI | Climate Change Initiative |
| NASA | North America Space Agency |
| TRMM | Tropical Rainfall Measuring Mission |
| ECMWF | European Center for Medium range Weather Forecasting |
| SWAF | SMOS WAter Fraction |
| ENVISAT | ENVironment SATellite |
| TB | Brightness Temperature |
References
- Matthews, E.; Fung, I. Methane emission from natural wetlands: Global distribution, area, and environmental characteristics of sources. Glob. Biogeochem. Cycles 1987, 1, 61–86. [Google Scholar] [CrossRef]
- Mitsch, W.; Gosselink, J. Wetlands, 3rd ed.; John Wiley & Sons, Inc.: Hoboken, NJ, USA, 2000. [Google Scholar]
- Cole, J.J.; Prairie, Y.T.; Caraco, N.F.; McDowell, W.H.; Tranvik, L.J.; Striegl, R.G.; Duarte, C.M.; Kortelainen, P.; Downing, J.A.; Middelburg, J.J.; et al. Plumbing the global carbon cycle: Integrating inland waters into the terrestrial carbon budget. Ecosystems 2007, 10, 172–185. [Google Scholar]
- Sjögersten, S.; Black, C.R.; Evers, S.; Hoyos-Santillan, J.; Wright, E.L.; Turner, B.L. Tropical wetlands: A missing link in the global carbon cycle? Glob. Biogeochem. Cycles 2014, 28, 1371–1386. [Google Scholar] [CrossRef] [PubMed]
- Alsdorf, D.E.; Rodriguez, E.; Lettenmaier, D.P. Measuring surface water from space. Rev. Geophys. 2007, 45. [Google Scholar] [CrossRef]
- Bakker, K. Water security: Research challenges and opportunities. Science 2012, 337, 914–915. [Google Scholar] [CrossRef] [PubMed]
- Finlayson, C.; Davidson, N. Global Review of Wetland Resources and Priorities for Wetland Inventory; Preface iv Summary Report; CM Finlayson & AG Spiers: Canberra, CT, USA, 1999; p. 15. [Google Scholar]
- Vörösmarty, C.; Hoekstra, A.; Bunn, S.; Conway, D.; Gupta, J. Fresh water goes global. Science 2015, 349, 478–479. [Google Scholar] [CrossRef] [PubMed]
- Costanza, R.; de Groot, R.; Sutton, P.; van der Ploeg, S.; Anderson, S.J.; Kubiszewski, I.; Farber, S.; Turner, R.K. Changes in the global value of ecosystem services. Glob. Environ. Chang. 2014, 26, 152–158. [Google Scholar] [CrossRef]
- Pekel, J.F.; Cottam, A.; Gorelick, N.; Belward, A.S. High-resolution mapping of global surface water and its long-term changes. Nature 2016, 540, 418–422. [Google Scholar] [CrossRef] [PubMed]
- Smith, L.C. Satellite remote sensing of river inundation area, stage, and discharge: A review. Hydrol. Process. 1997, 11, 1427–1439. [Google Scholar] [CrossRef]
- Frazier, P.S.; Page, K.J. Water body detection and delineation with Landsat TM data. Photogramm. Eng. Remote Sens. 2000, 66, 1461–1468. [Google Scholar]
- Verpoorter, C.; Kutser, T.; Seekell, D.A.; Tranvik, L.J. A global inventory of lakes based on high-resolution satellite imagery. Geophys. Res. Lett. 2014, 41, 6396–6402. [Google Scholar] [CrossRef]
- Feng, M.; Sexton, J.O.; Channan, S.; Townshend, J.R. A global, high-resolution (30-m) inland water body dataset for 2000: First results of a topographic–spectral classification algorithm. Int. J. Digit. Earth 2016, 9, 113–133. [Google Scholar] [CrossRef]
- Crétaux, J.F.; Jelinski, W.; Calmant, S.; Kouraev, A.; Vuglinski, V.; Bergé-Nguyen, M.; Gennero, M.C.; Nino, F.; Del Rio, R.A.; Cazenave, A.; et al. SOLS: A lake database to monitor in the Near Real Time water level and storage variations from remote sensing data. Adv. Space Res. 2011, 47, 1497–1507. [Google Scholar] [CrossRef]
- Frappart, F.; Do Minh, K.; L’Hermitte, J.; Cazenave, A.; Ramillien, G.; Le Toan, T.; Mognard-Campbell, N. Water volume change in the lower Mekong from satellite altimetry and imagery data. Geophys. J. Int. 2006, 167, 570–584. [Google Scholar] [CrossRef]
- Hess, L.L.; Melack, J.M.; Novo, E.M.; Barbosa, C.C.; Gastil, M. Dual-season mapping of wetland inundation and vegetation for the central Amazon Basin. Remote Sens. Environ. 2003, 87, 404–428. [Google Scholar] [CrossRef]
- Morrissey, L.A.; Durden, S.L.; Livingston, G.P.; Steam, J.A.; Guild, L.S. Differentiating methane source areas in arctic environments with multitemporal ERS-1 SAR data. IEEE Trans. Geosci. Remote Sens. 1996, 34, 667–673. [Google Scholar] [CrossRef]
- Birkett, C.M. Contribution of the TOPEX NASA radar altimeter to the global monitoring of large rivers and wetlands. Water Resour. Res. 1998, 34, 1223–1239. [Google Scholar] [CrossRef]
- Fung, L.; Cazenave, A. Satellite Altimetry and Earth Science. A Handbook of Techniques and Applications, International Geophysical Series; Academic Press: San Diego, CA, USA, 2001; Volume 69. [Google Scholar]
- Ričko, M.; Birkett, C.M.; Carton, J.A.; Crétaux, J.F. Intercomparison and validation of continental water level products derived from satellite radar altimetry. J. Appl. Remote Sens. 2012, 6, 061710. [Google Scholar] [CrossRef]
- Papa, F.; Prigent, C.; Rossow, W.; Legresy, B.; Remy, F. Inundated wetland dynamics over boreal regions from remote sensing: The use of Topex-Poseidon dual-frequency radar altimeter observations. Int. J. Remote Sens. 2006, 27, 4847–4866. [Google Scholar] [CrossRef]
- Biancamaria, S.; Lettenmaier, D.P.; Pavelsky, T.M. The SWOT mission and its capabilities for land hydrology. Surv. Geophys. 2016, 37, 307–337. [Google Scholar] [CrossRef]
- Giddings, L.; Choudhury, B. Observation of hydrological features with Nimbus-7 37 GHz data, applied to South America. Int. J. Remote Sens. 1989, 10, 1673–1686. [Google Scholar] [CrossRef]
- Choudhury, B.J. Passive microwave remote sensing contribution to hydrological variables. In Land Surface—Atmosphere Interactions for Climate Modeling; Springer: Berlin, Germany, 1991; pp. 63–84. [Google Scholar]
- Sippel, S.; Hamilton, S.; Melack, J.; Choudhury, B. Passive microwave satellite observations of seasonal variations of inundation area in the Amazon River floodplain. Brazil. Remote Sens. Environ. 1994, 4, 70–76. [Google Scholar] [CrossRef]
- Sippel, S.; Hamilton, S.; Melack, J.; Novo, E. Passive microwave observations of inundation area and the area/stage relation in the Amazon River floodplain. Int. J. Remote Sens. 1998, 19, 3055–3074. [Google Scholar] [CrossRef]
- Fily, M.; Royer, A.; Goıta, K.; Prigent, C. A simple retrieval method for land surface temperature and fraction of water surface determination from satellite microwave brightness temperatures in sub-arctic areas. Remote Sens. Environ. 2003, 85, 328–338. [Google Scholar] [CrossRef]
- Mialon, A.; Royer, A.; Fily, M. Wetland seasonal dynamics and interannual variability over northern high latitudes, derived from microwave satellite data. J. Geophys. Res. Atmos. 2005, 110. [Google Scholar] [CrossRef]
- Temimi, M.; Leconte, R.; Brissette, F.; Chaouch, N. Flood monitoring over the Mackenzie River Basin using passive microwave data. Remote Sens. Environ. 2005, 98, 344–355. [Google Scholar] [CrossRef]
- Grippa, M.; Mognard, N.; Le Toan, T.; Biancamaria, S. Observations of changes in surface water over the western Siberia lowland. Geophys. Res. Lett. 2007, 34. [Google Scholar] [CrossRef]
- Prigent, C.; Papa, F.; Aires, F.; Rossow, W.; Matthews, E. Global inundation dynamics inferred from multiple satellite observations, 1993–2000. J. Geophys. Res. Atmos. 2007, 112. [Google Scholar] [CrossRef]
- Sakamoto, T.; Van Nguyen, N.; Kotera, A.; Ohno, H.; Ishitsuka, N.; Yokozawa, M. Detecting temporal changes in the extent of annual flooding within the Cambodia and the Vietnamese Mekong Delta from MODIS time-series imagery. Remote Sens. Environ. 2007, 109, 295–313. [Google Scholar] [CrossRef]
- Kerr, Y.; Waldteufel, P.; Wigneron, J.; Martinuzzi, J.; Font, J.; Berger, M. Soil moisture retrieval from space: The Soil Moisture and Ocean Salinity (SMOS) mission. IEEE Trans. Geosci. Remote Sens. 2001, 39, 1729–1735. [Google Scholar] [CrossRef]
- Parrens, M.; Wigneron, J.P.; Richaume, P.; Al Bitar, A.; Mialon, A.; Wang, S.; Fernandez-Moran, R.; Al-Yaari, A.; O’Neill, P.; Kerr, Y. Considering Combined or Separated Roughness and Vegetation Effects in Soil Moisture Retrievals. Int. J. Appl. Earth Obs. Geoinform. 2017, 55, 73–86. [Google Scholar]
- Parrens, M.; Wigneron, J.P.; Richaume, P.; Mialon, A.; Al Bitar, A.; Fernandez-Moran, R.; Al-Yaari, A.; Kerr, Y.H. Global-scale surface roughness effects at L-band as estimated from SMOS observations. Remote Sens. Environ. 2016, 181, 122–136. [Google Scholar] [CrossRef]
- Schroeder, R.; McDonald, K.C.; Chapman, B.D.; Jensen, K.; Podest, E.; Tessler, Z.D.; Bohn, T.J.; Zimmermann, R. Development and Evaluation of a Multi-Year Fractional Surface Water Data Set Derived from Active/Passive Microwave Remote Sensing Data. Remote Sens. 2015, 7, 16688–16732. [Google Scholar] [CrossRef]
- Henderson, F.M.; Lewis, A.J. Radar detection of wetland ecosystems: A review. Int. J. Remote Sens. 2008, 29, 5809–5835. [Google Scholar] [CrossRef]
- Bartsch, A.; Trofaier, A.; Hayman, G.; Sabel, D.; Schlaffer, S.; Clark, D.; Blyth, E. Detection of open water dynamics with ENVISAT ASAR in support of land surface modelling at high latitudes. Biogeosciences 2012, 9, 703–714. [Google Scholar] [CrossRef]
- Kuenzer, C.; Guo, H.; Huth, J.; Leinenkugel, P.; Li, X.; Dech, S. Flood mapping and flood dynamics of the Mekong Delta: ENVISAT-ASAR-WSM based time series analyses. Remote Sens. 2013, 5, 687–715. [Google Scholar] [CrossRef]
- Santoro, M.; Wegmüller, U. Multi-temporal synthetic aperture radar metrics applied to map open water bodies. IEEE J. Sel. Top. Appl. Earth Obs. Remote Sens. 2014, 7, 3225–3238. [Google Scholar] [CrossRef]
- Prigent, C.; Matthews, E.; Aires, F.; Rossow, W.B. Remote sensing of global wetland dynamics with multiple satellite data sets. Geophys. Res. Lett. 2001, 28, 4631–4634. [Google Scholar] [CrossRef]
- Papa, F.; Prigent, C.; Aires, F.; Jimenez, C.; Rossow, W.; Matthews, E. Interannual variability of surface water extent at the global scale, 1993–2004. J. Geophys. Res. Atmos. 2010, 115. [Google Scholar] [CrossRef]
- McCarthy, J.; Gumbricht, T.; McCarthy, T. Ecoregion classification in the Okavango Delta, Botswana from multitemporal remote sensing. Int. J. Remote Sens. 2005, 26, 4339–4357. [Google Scholar] [CrossRef]
- Jain, S.K.; Saraf, A.K.; Goswami, A.; Ahmad, T. Flood inundation mapping using NOAA AVHRR data. Water Resour. Manag. 2006, 20, 949–959. [Google Scholar] [CrossRef]
- Bergé-Nguyen, M.; Crétaux, J.F. Inundations in the inner Niger delta: monitoring and analysis using MODIS and global precipitation datasets. Remote Sens. 2015, 7, 2127–2151. [Google Scholar] [CrossRef]
- Xiao, X.; Boles, S.; Liu, J.; Zhuang, D.; Frolking, S.; Li, C.; Salas, W.; Moore, B. Mapping paddy rice agriculture in southern China using multi-temporal MODIS images. Remote Sens. Environ. 2005, 95, 480–492. [Google Scholar] [CrossRef]
- Molinier, M.; Guyot, J.L.; De Oliveira, E.; Guimarães, V. Les Regimes Hydroiogiques de L’Amazone et de Ses Affluents; IAHS Publication: Paris, France, 1996; pp. 209–222. [Google Scholar]
- Frappart, F.; Papa, F.; da Silva, J.S.; Ramillien, G.; Prigent, C.; Seyler, F.; Calmant, S. Surface freshwater storage and dynamics in the Amazon Basin during the 2005 exceptional drought. Environ. Res. Lett. 2012, 7, 044010. [Google Scholar] [CrossRef]
- Papa, F.; Frappart, F.; Güntner, A.; Prigent, C.; Aires, F.; Getirana, A.C.; Maurer, R. Surface freshwater storage and variability in the Amazon Basin from multi-satellite observations, 1993–2007. J. Geophys. Res. Atmos. 2013, 118. [Google Scholar] [CrossRef]
- Diegues, A.C.S. An Inventory of Brazilian Wetlands; Number 15; IUCN: Gland, Switzerland, 1994. [Google Scholar]
- Frappart, F.; Seyler, F.; Martinez, J.M.; Leon, J.G.; Cazenave, A. Floodplain water storage in the Negro River basin estimated from microwave remote sensing of inundation area and water levels. Remote Sens. Environ. 2005, 99, 387–399. [Google Scholar] [CrossRef]
- Junk, W.J. General aspects of floodplain ecology with special reference to Amazonian floodplains. In The Central Amazon Floodplain; Springer: Berlin, Germany, 1997; pp. 3–20. [Google Scholar]
- Salati, E.; Marques, J. Climatology of the Amazon region. In The Amazon; Springer: Berlin, Germany, 1984; pp. 85–126. [Google Scholar]
- Marengo, J.A. Interannual variability of surface climate in the Amazon Basin. Int. J. Climatol. 1992, 12, 853–863. [Google Scholar] [CrossRef]
- Espinoza Villar, J.C.; Ronchail, J.; Guyot, J.L.; Cochonneau, G.; Naziano, F.; Lavado, W.; De Oliveira, E.; Pombosa, R.; Vauchel, P. Spatio-temporal rainfall variability in the Amazon Basin countries (Brazil, Peru, Bolivia, Colombia, and Ecuador). Int. J. Climatol. 2009, 29, 1574–1594. [Google Scholar] [CrossRef]
- Ulaby, F.T. Microwave Remote Sensing: Active and Passive, Radar Remote Sensing and Surface Scattering and Emission Theory; Addison-Wesley: Reading, MA, USA, 1982; Volume 2. [Google Scholar]
- Bitar, A.; Mialon, A.; Kerr, Y.; Cabot, F.; Richaume, P.; Jacquette, E.; Quesney, A.; Mahmoodi, A.; Tarrot, S.; Parrens, M.; et al. The global SMOS Level 3 daily soil moisture and brightness temperature maps. ESSD 2017. [Google Scholar] [CrossRef]
- Brodzik, M.J.; Billingsley, B.; Haran, T.; Raup, B.; Savoie, M.H. EASE-grid 2.0: Incremental but significant improvements for Earth-gridded data sets. ISPRS Int. J. Geo-Inform. 2012, 1, 32–45. [Google Scholar] [CrossRef]
- Jarvis, A.; Reuter, H.I.; Nelson, A.; Guevara, E. The CGIAR-CSI SRTM 90 m Database. Hole-Filled SRTM for the Globe Version 4. 2008. Available online: http://srtm.csi.cgiar.org (accessed on 16 May 2017).
- Huffman, G.J.; Bolvin, D.T.; Nelkin, E.J.; Wolff, D.B.; Adler, R.F.; Gu, G.; Hong, Y.; Bowman, K.P.; Stocker, E.F. The TRMM multisatellite precipitation analysis (TMPA): Quasi-global, multiyear, combined-sensor precipitation estimates at fine scales. J. Hydrometeorol. 2007, 8, 38–55. [Google Scholar] [CrossRef]
- Friedl, M.A.; Sulla-Menashe, D.; Tan, B.; Schneider, A.; Ramankutty, N.; Sibley, A.; Huang, X. MODIS Collection 5 global land cover: Algorithm refinements and characterization of new datasets. Remote Sens. Environ. 2010, 114, 168–182. [Google Scholar] [CrossRef]
- Loveland, T.; Reed, B.; Brown, J.; Ohlen, D.; Zhu, Z.; Yang, L.; Merchant, J. Development of a global land cover characteristics database and IGBP DISCover from 1 km AVHRR data. Int. J. Remote Sens. 2000, 21, 1303–1330. [Google Scholar] [CrossRef]
- Bontemps, S.; Defourny, P.; Radoux, J.; Van Bogaert, E.; Lamarche, C.; Achard, F.; Mayaux, P.; Boettcher, M.; Brockmann, C.; Kirches, G.; et al. Consistent global land cover maps for climate modelling communities: current achievements of the ESA’s land cover CCI. In Proceedings of the ESA Living Planet Symposium, Edimburgh, UK, 9–13 September 2013; pp. 9–13. [Google Scholar]
- Papa, F.; Güntner, A.; Frappart, F.; Prigent, C.; Rossow, W.B. Variations of surface water extent and water storage in large river basins: A comparison of different global data sources. Geophys. Res. Lett. 2008, 35. [Google Scholar] [CrossRef]
- Frappart, F.; Papa, F.; Famiglietti, J.S.; Prigent, C.; Rossow, W.B.; Seyler, F. Interannual variations of river water storage from a multiple satellite approach: A case study for the Rio Negro River basin. J. Geophys. Res. Atmos. 2008, 113. [Google Scholar] [CrossRef]
- Birkett, C.M.; Beckley, B. Investigating the performance of the Jason-2/OSTM radar altimeter over lakes and reservoirs. Mar. Geod. 2010, 33, 204–238. [Google Scholar] [CrossRef]
- Da Silva, J.S.; Calmant, S.; Seyler, F.; Rotunno Filho, O.C.; Cochonneau, G.; Mansur, W.J. Water levels in the Amazon Basin derived from the ERS 2 and ENVISAT radar altimetry missions. Remote Sens. Environ. 2010, 114, 2160–2181. [Google Scholar] [CrossRef]
- Klein, L.; Swift, C. An improved model for the dielectric constant of sea water at microwave frequencies. IEEE Trans. Antennas Propag. 1977, 25, 104–111. [Google Scholar] [CrossRef]
- Mialon, A.; Coret, L.; Kerr, Y.H.; Sécherre, F.; Wigneron, J.P. Flagging the topographic impact on the SMOS signal. IEEE Trans. Geosci. Remote Sens. 2008, 46, 689–694. [Google Scholar] [CrossRef]
- Frappart, F.; Ramillien, G.; Ronchail, J. Changes in terrestrial water storage versus rainfall and discharges in the Amazon Basin. Int. J. Climatol. 2013, 33, 3029–3046. [Google Scholar] [CrossRef]
- Ulaby, F.; Moore, R.; Fung, A. Microwave Remote Sensing: Active and Passive; Advanced Systems and Applications Inc.: Dedham, MA, USA, 1986; pp. 1797–1848. [Google Scholar]


| Remote Sensing Approach | Reference | Area of Study | Sensors | Frequency |
|---|---|---|---|---|
| Passive microwave | [27] | Amazon Basin | SSMR | Q-band |
| [29] | Boreal regions | SSM/I-SSMR | K- and Ka-band | |
| [37] | North Eurasian | AMSR-E-QSCAT | C-band | |
| Active microwave | See [38] for a review of the SAR technique | |||
| [17] | Amazon Basin | ENVISAT SAR | L-band | |
| [39] | High latitude regions | ENVISAT ASAR | C-band | |
| [40] | Mekong basin | ENVISAT ASAR | C-band | |
| [41] | Global scale | ENVISAT ASAR | C-band | |
| [22] | Boreal regions | Topex-Poseidon | C-band | |
| Hybrid approaches | [42] | Global scale | SSM/I, ERS, AVHRR | Ka- and C-band |
| [32] | Global scale | SSM/I, ERS, AVHRR | Ka- and C-band | |
| [43] | Global scale | SSM/I, ERS, AVHRR | Ka- and C-band | |
| [37] | Global scale | SSM/I, SSMI/S, ERS, QSAT, ASCAT | Ku- and C-band | |
| Optical and infrared | [44] | Okavango Delta | AVHRR | - |
| [45] | Brahmaputra | AVHRR | - | |
| [46] | Inner Niger Delta | MODIS | - | |
| [47] | China | MODIS | - | |
| [33] | Mekong Delta | MODIS | - | |
| [10] | Global scale | Landsat | - | |
| “Water” Pixel | “Forest” Pixel | |||||||
|---|---|---|---|---|---|---|---|---|
| Incidence Angle | H-pol | V-pol | H-pol | V-pol | ||||
| Mean (K) | (K) | Mean (K) | (K) | Mean (K) | (K) | Mean (K) | (K) | |
| 32± 5 | 94.52 | 0.51 | 122.58 | 0.64 | 274.43 | 2.71 | 276.61 | 2.72 |
| 37± 5 | 89.96 | 0.49 | 128.25 | 0.67 | 272.44 | 2.94 | 276.12 | 2.61 |
| 42± 5 | 84.72 | 0.46 | 135.27 | 0.70 | 271.88 | 3.57 | 275.72 | 2.71 |
| 47± 5 | 78.78 | 0.43 | 143.93 | 0.74 | 269.71 | 3.22 | 274.26 | 2.51 |
| Incidence Angle () | H-pol | V-pol |
|---|---|---|
| 32± 5 | 290,000 | 270,000 |
| 37± 5 | 280,000 | 260,000 |
| 42± 5 | 280,000 | 250,000 |
| 47± 5 | 280,000 | 250,000 |
| Precipitation | Discharge | |||
|---|---|---|---|---|
| Incidence Angle () | H-pol | V-pol | H-pol | V-pol |
| 32± 5 | 0.91 | 0.90 | 0.83 | 0.84 |
| 37± 5 | 0.88 | 0.89 | 0.86 | 0.85 |
| 42± 5 | 0.92 | 0.88 | 0.88 | 0.82 |
| 47± 5 | 0.83 | 0.85 | 0.78 | 0.83 |
| Variables | H-pol | V-pol | Low angles | High angles |
|---|---|---|---|---|
| Land cover classification | NS | NS | ||
| Water level | NS | NS | ||
| Dynamic water fraction | NS | NS | ||
| Precipitation | NS | NS | NS | NS |
| Discharge | NS | NS | NS | NS |
© 2017 by the authors. Licensee MDPI, Basel, Switzerland. This article is an open access article distributed under the terms and conditions of the Creative Commons Attribution (CC BY) license (http://creativecommons.org/licenses/by/4.0/).
Share and Cite
Parrens, M.; Al Bitar, A.; Frappart, F.; Papa, F.; Calmant, S.; Crétaux, J.-F.; Wigneron, J.-P.; Kerr, Y. Mapping Dynamic Water Fraction under the Tropical Rain Forests of the Amazonian Basin from SMOS Brightness Temperatures. Water 2017, 9, 350. https://doi.org/10.3390/w9050350
Parrens M, Al Bitar A, Frappart F, Papa F, Calmant S, Crétaux J-F, Wigneron J-P, Kerr Y. Mapping Dynamic Water Fraction under the Tropical Rain Forests of the Amazonian Basin from SMOS Brightness Temperatures. Water. 2017; 9(5):350. https://doi.org/10.3390/w9050350
Chicago/Turabian StyleParrens, Marie, Ahmad Al Bitar, Frédéric Frappart, Fabrice Papa, Stephane Calmant, Jean-François Crétaux, Jean-Pierre Wigneron, and Yann Kerr. 2017. "Mapping Dynamic Water Fraction under the Tropical Rain Forests of the Amazonian Basin from SMOS Brightness Temperatures" Water 9, no. 5: 350. https://doi.org/10.3390/w9050350
APA StyleParrens, M., Al Bitar, A., Frappart, F., Papa, F., Calmant, S., Crétaux, J.-F., Wigneron, J.-P., & Kerr, Y. (2017). Mapping Dynamic Water Fraction under the Tropical Rain Forests of the Amazonian Basin from SMOS Brightness Temperatures. Water, 9(5), 350. https://doi.org/10.3390/w9050350