
Impacts of Hydrogen Peroxide and Copper Sulfate on the Control of Microcystis aeruginosa and MC-LR and the Inhibition of MC-LR Degrading Bacterium Bacillus sp.


Abstract
:1. Introduction
2. Materials and Methods
2.1. Microcystis Aeruginosa PCC7820 Culture and Cell Count
2.2. Bacillus sp. Culture, Cells Preparation and Heterotrophic Plate Count (HPC)
2.3. Exposure of MC-LR, M. aeruginosa, and Bacillus sp. to Copper Sulfate and H2O2
2.4. Extraction of Crude Microcystin-LR
2.5. Quantification of Microcystin-LR
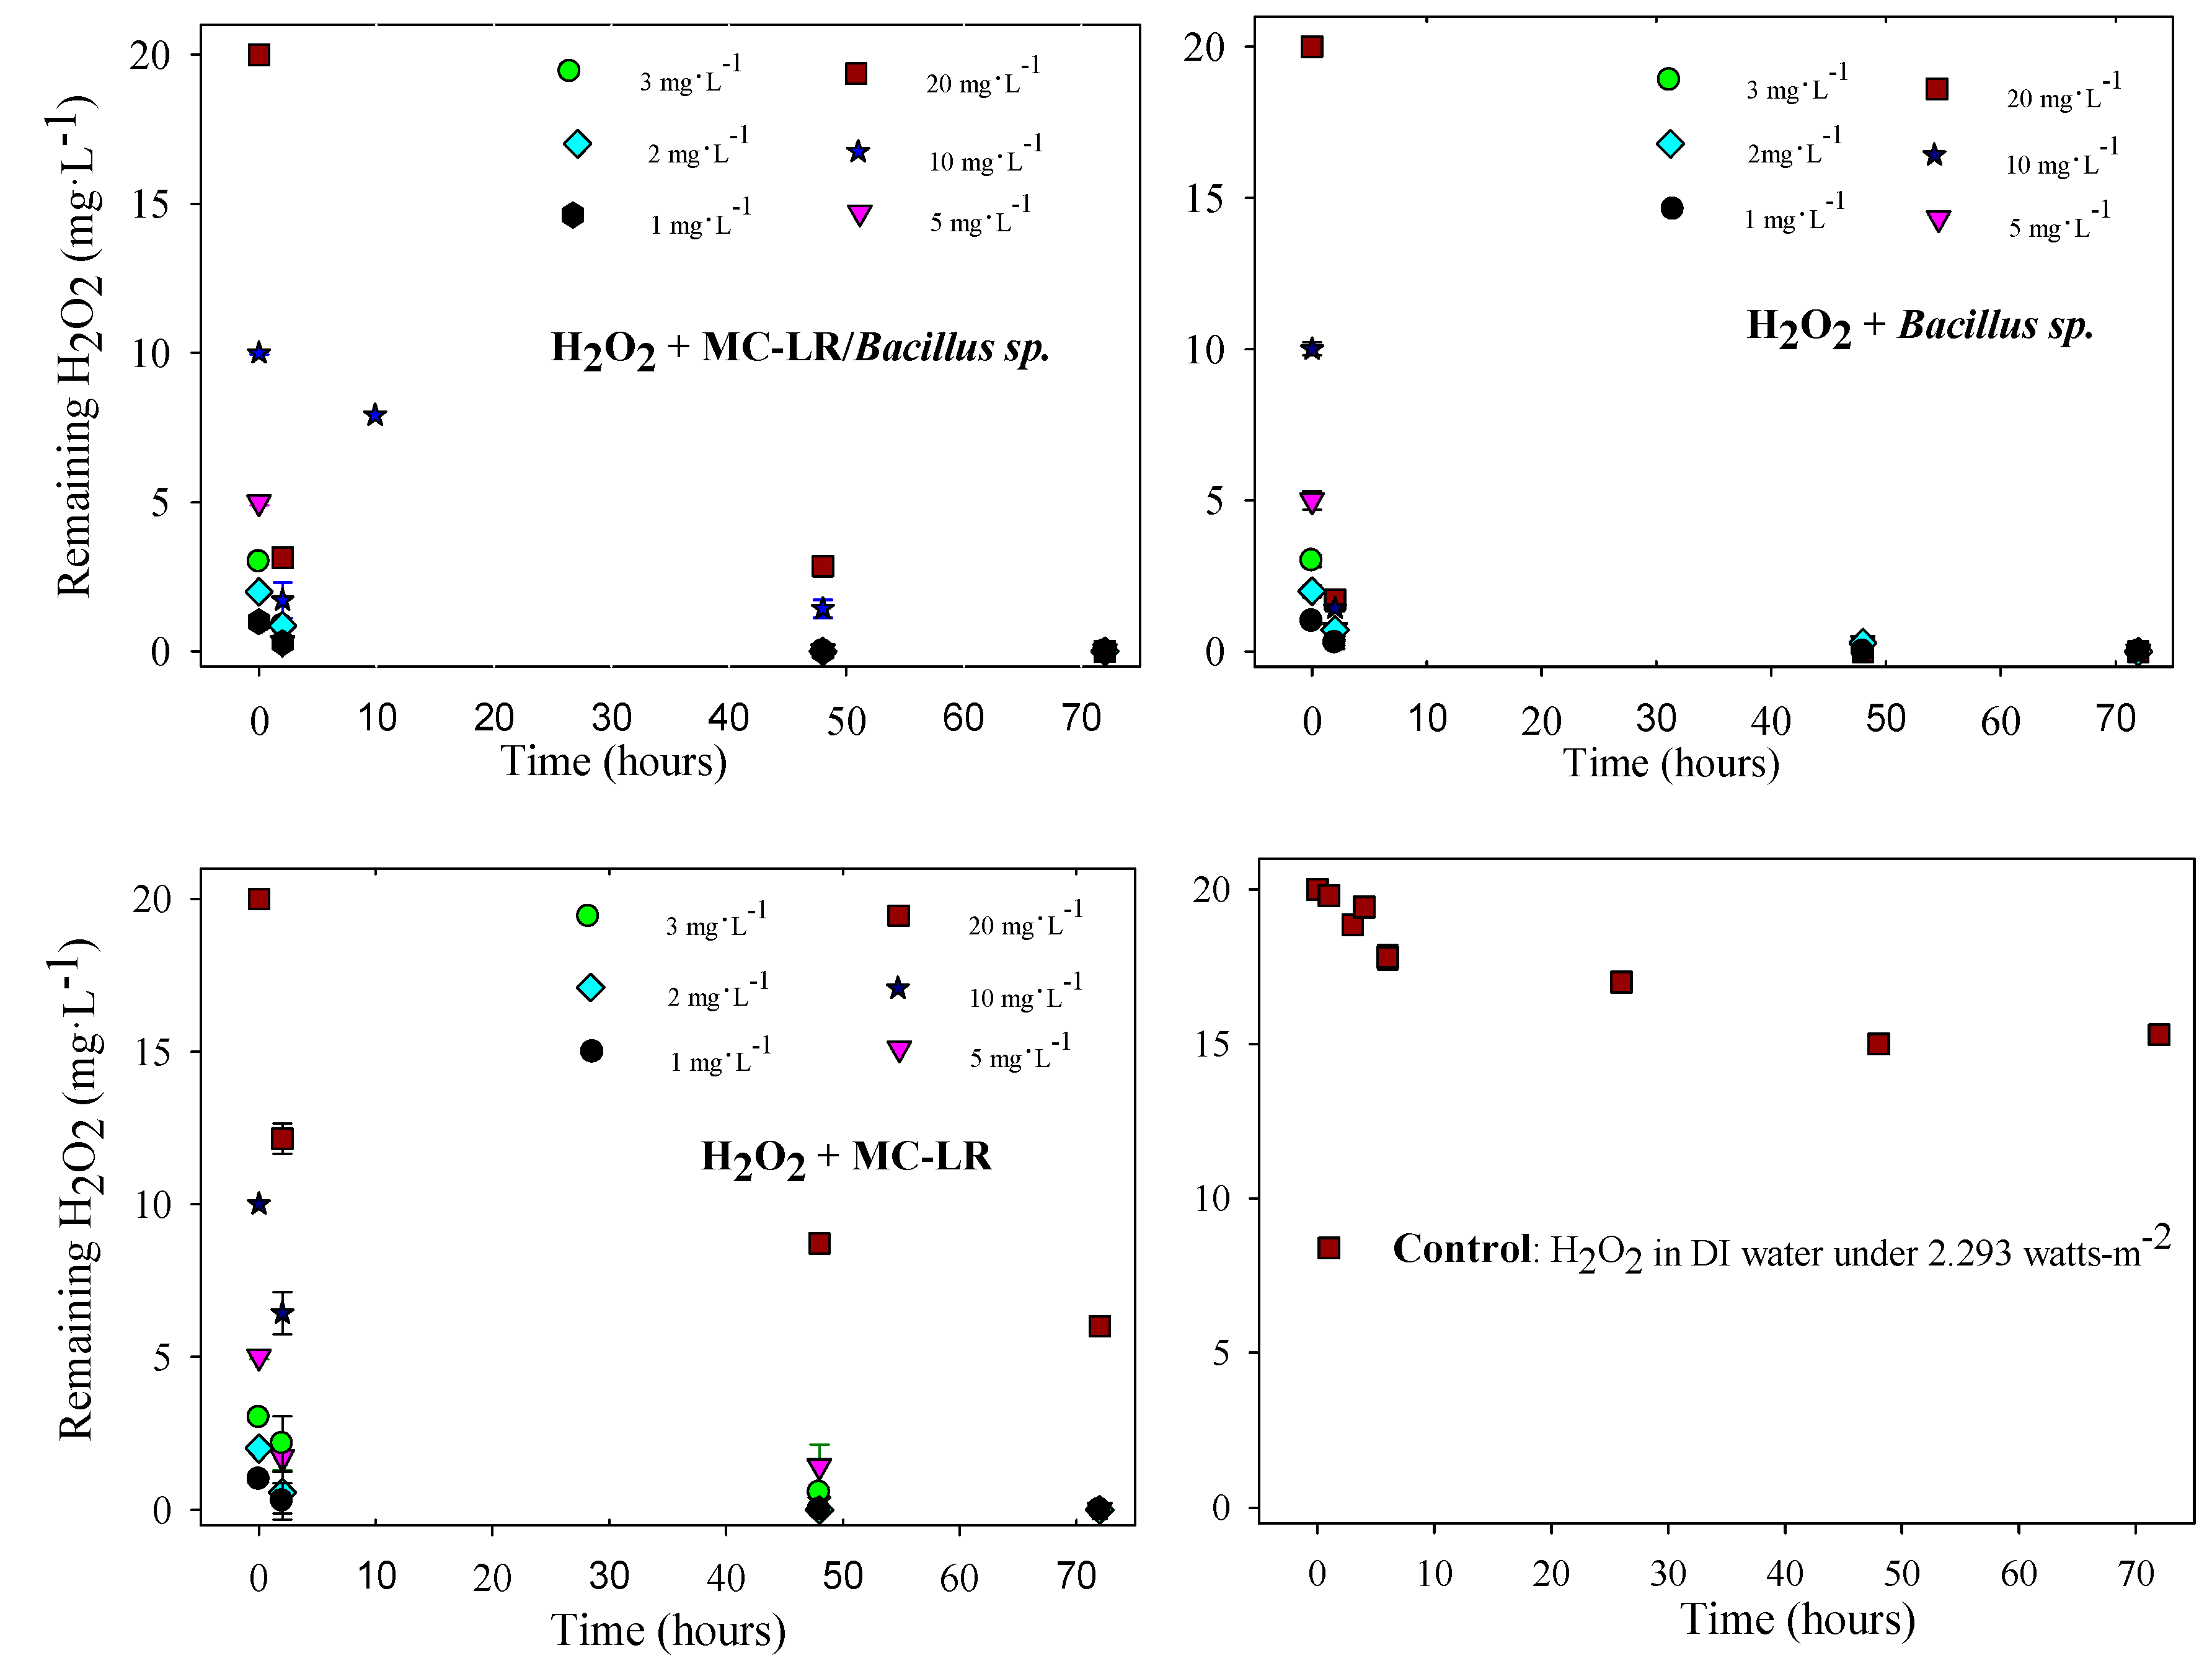
2.6. Quantification of Residual H2O2
2.7. Quantification of Residual Hydroxyl Radicals
2.8. Measurement of Total Alkalinity and pH
2.9. Statistical Analyses
3. Results and Discussion
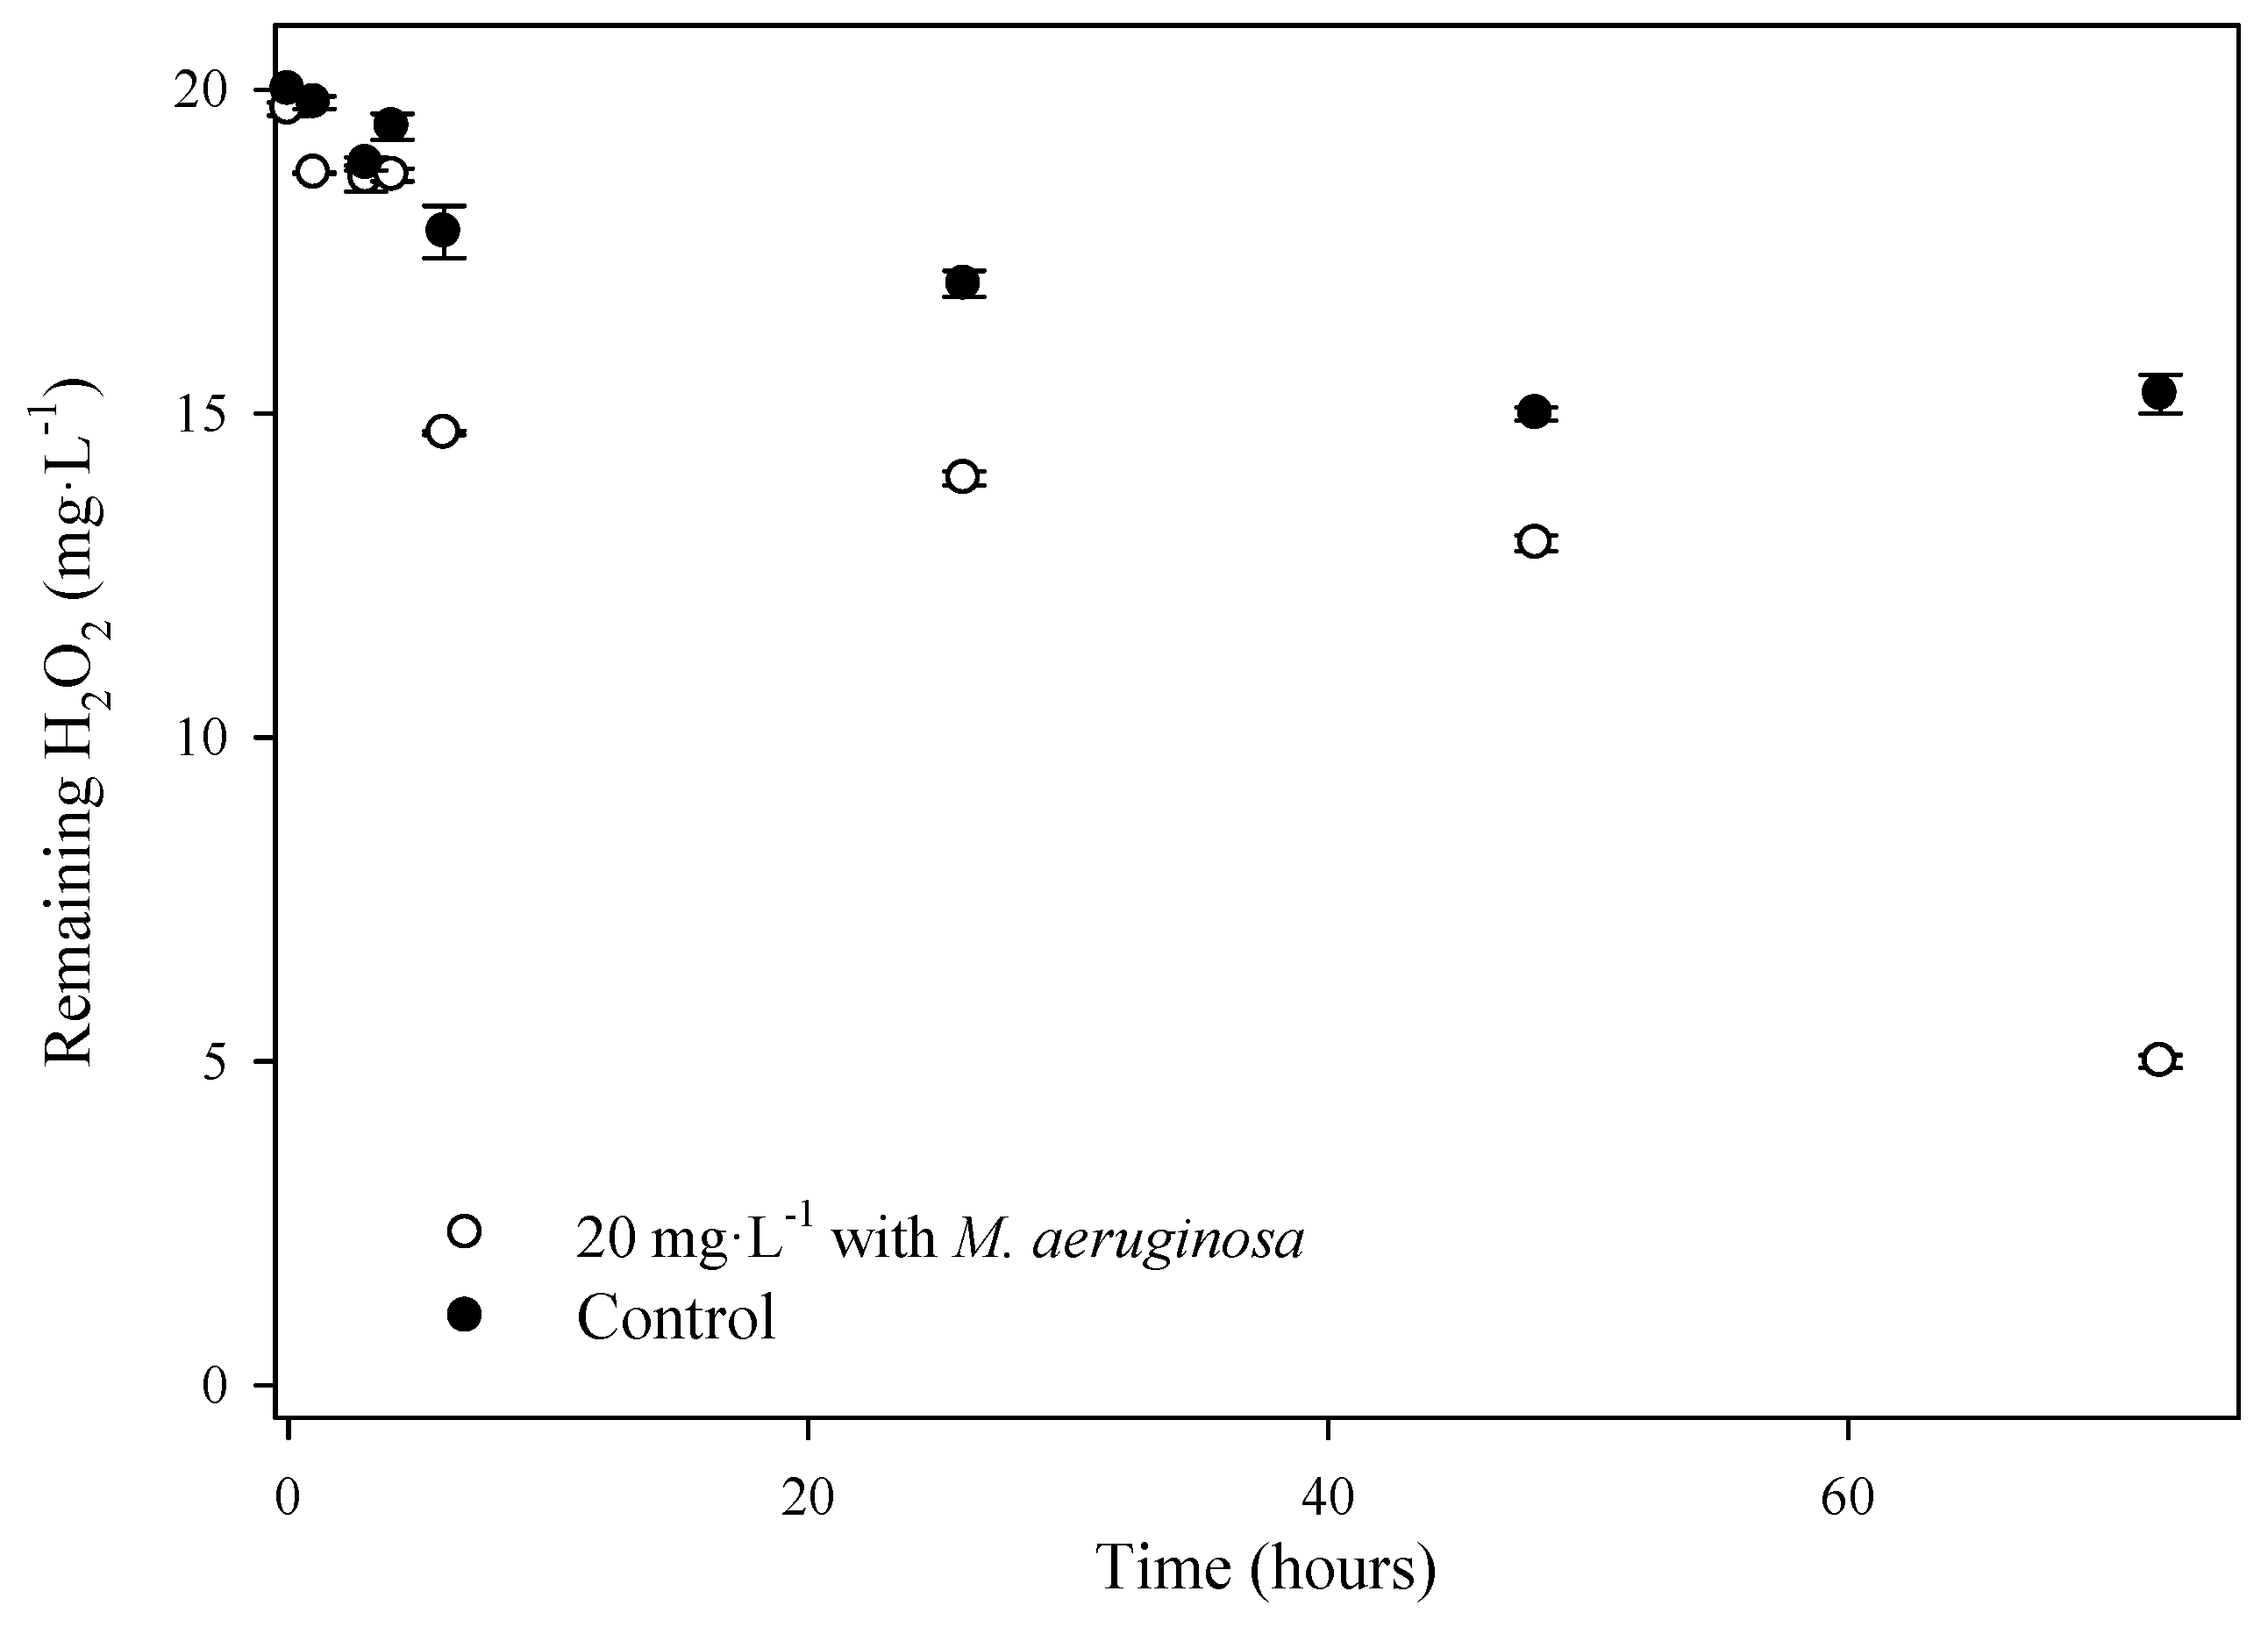
3.1. Toxicity of Copper Sulfate and H2O2
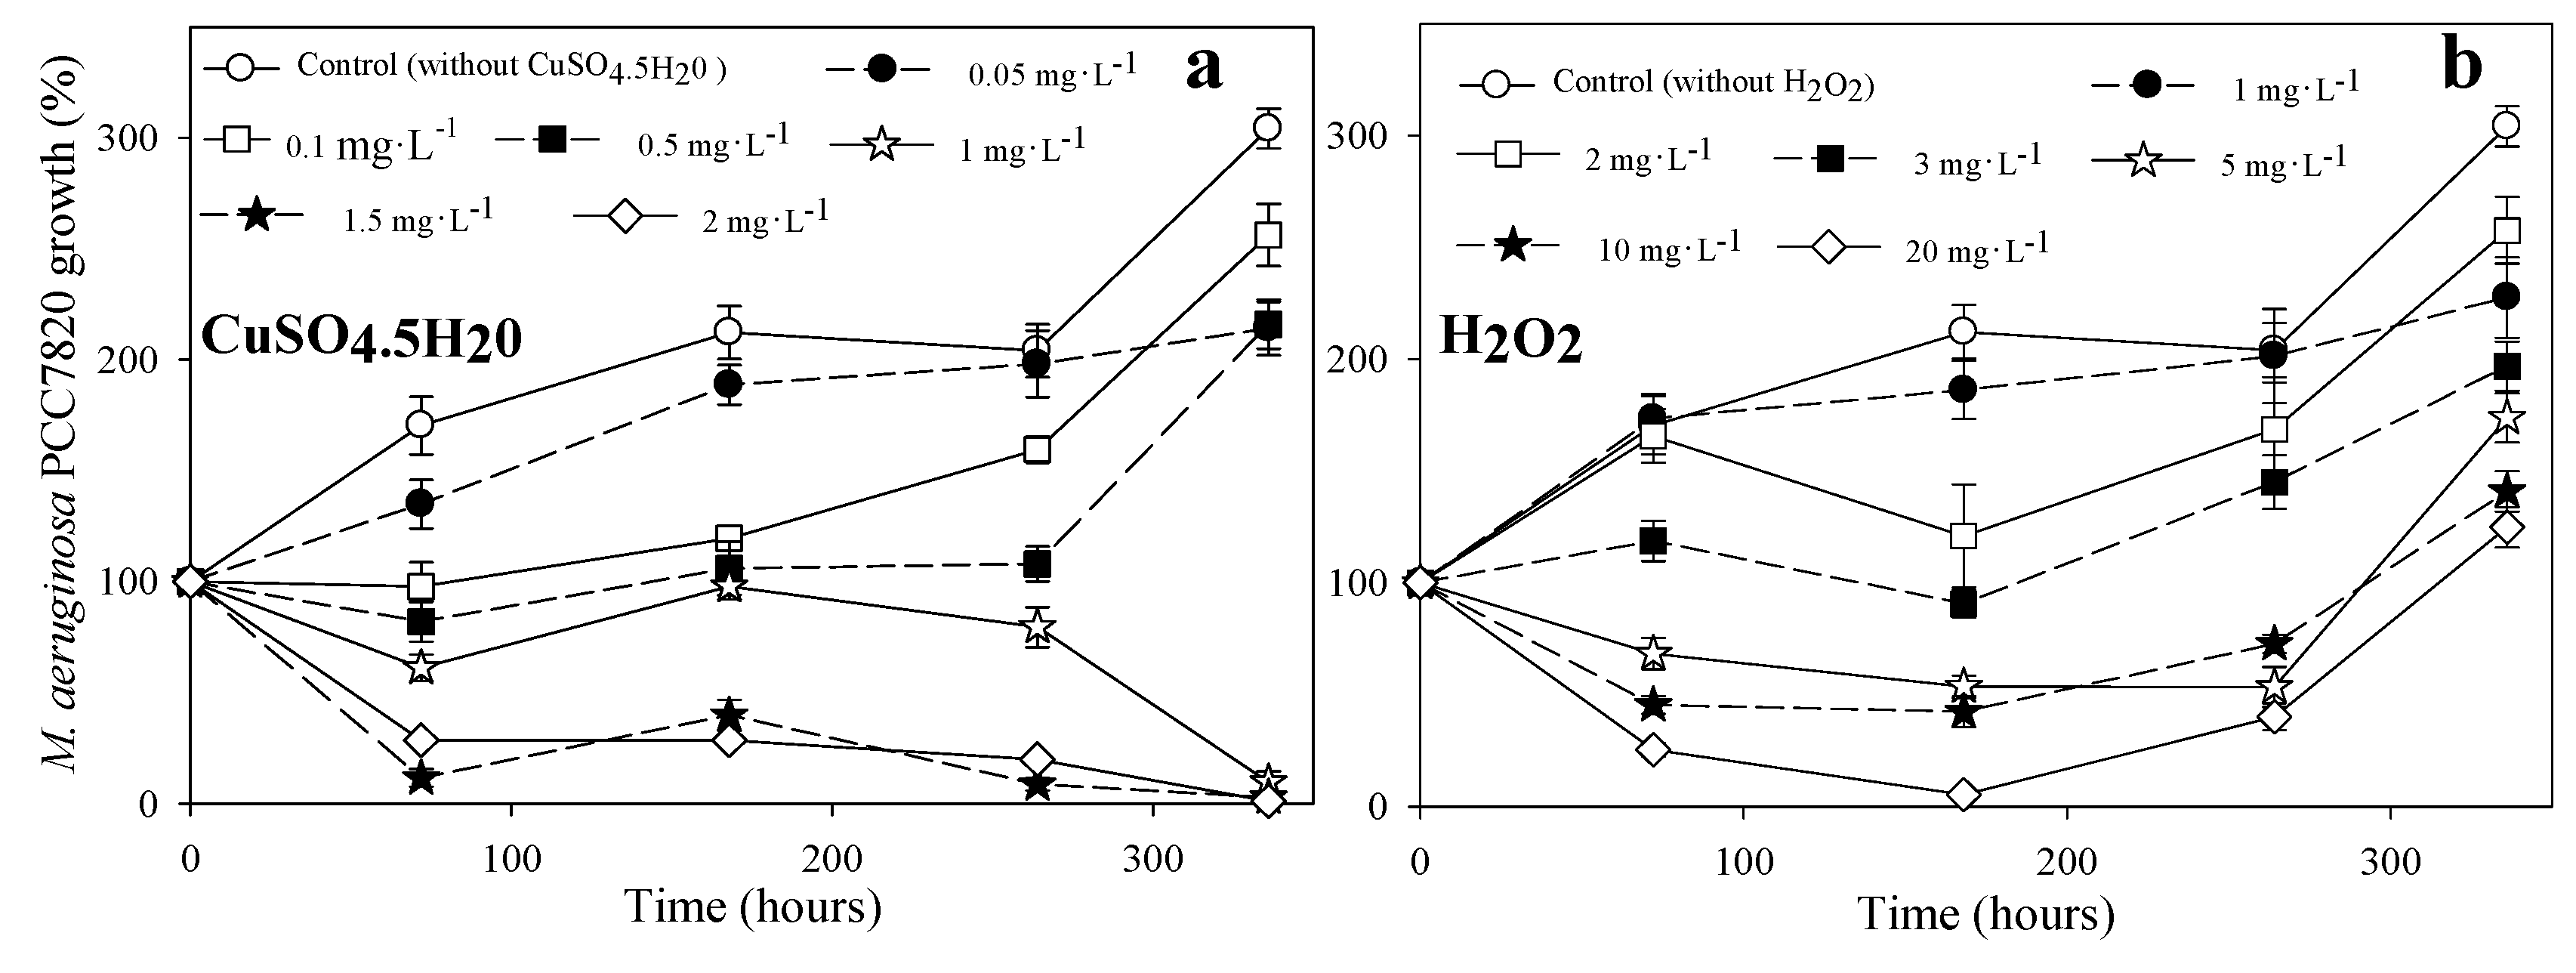
3.1.1. Toxicity to M. aeruginosa PCC7028
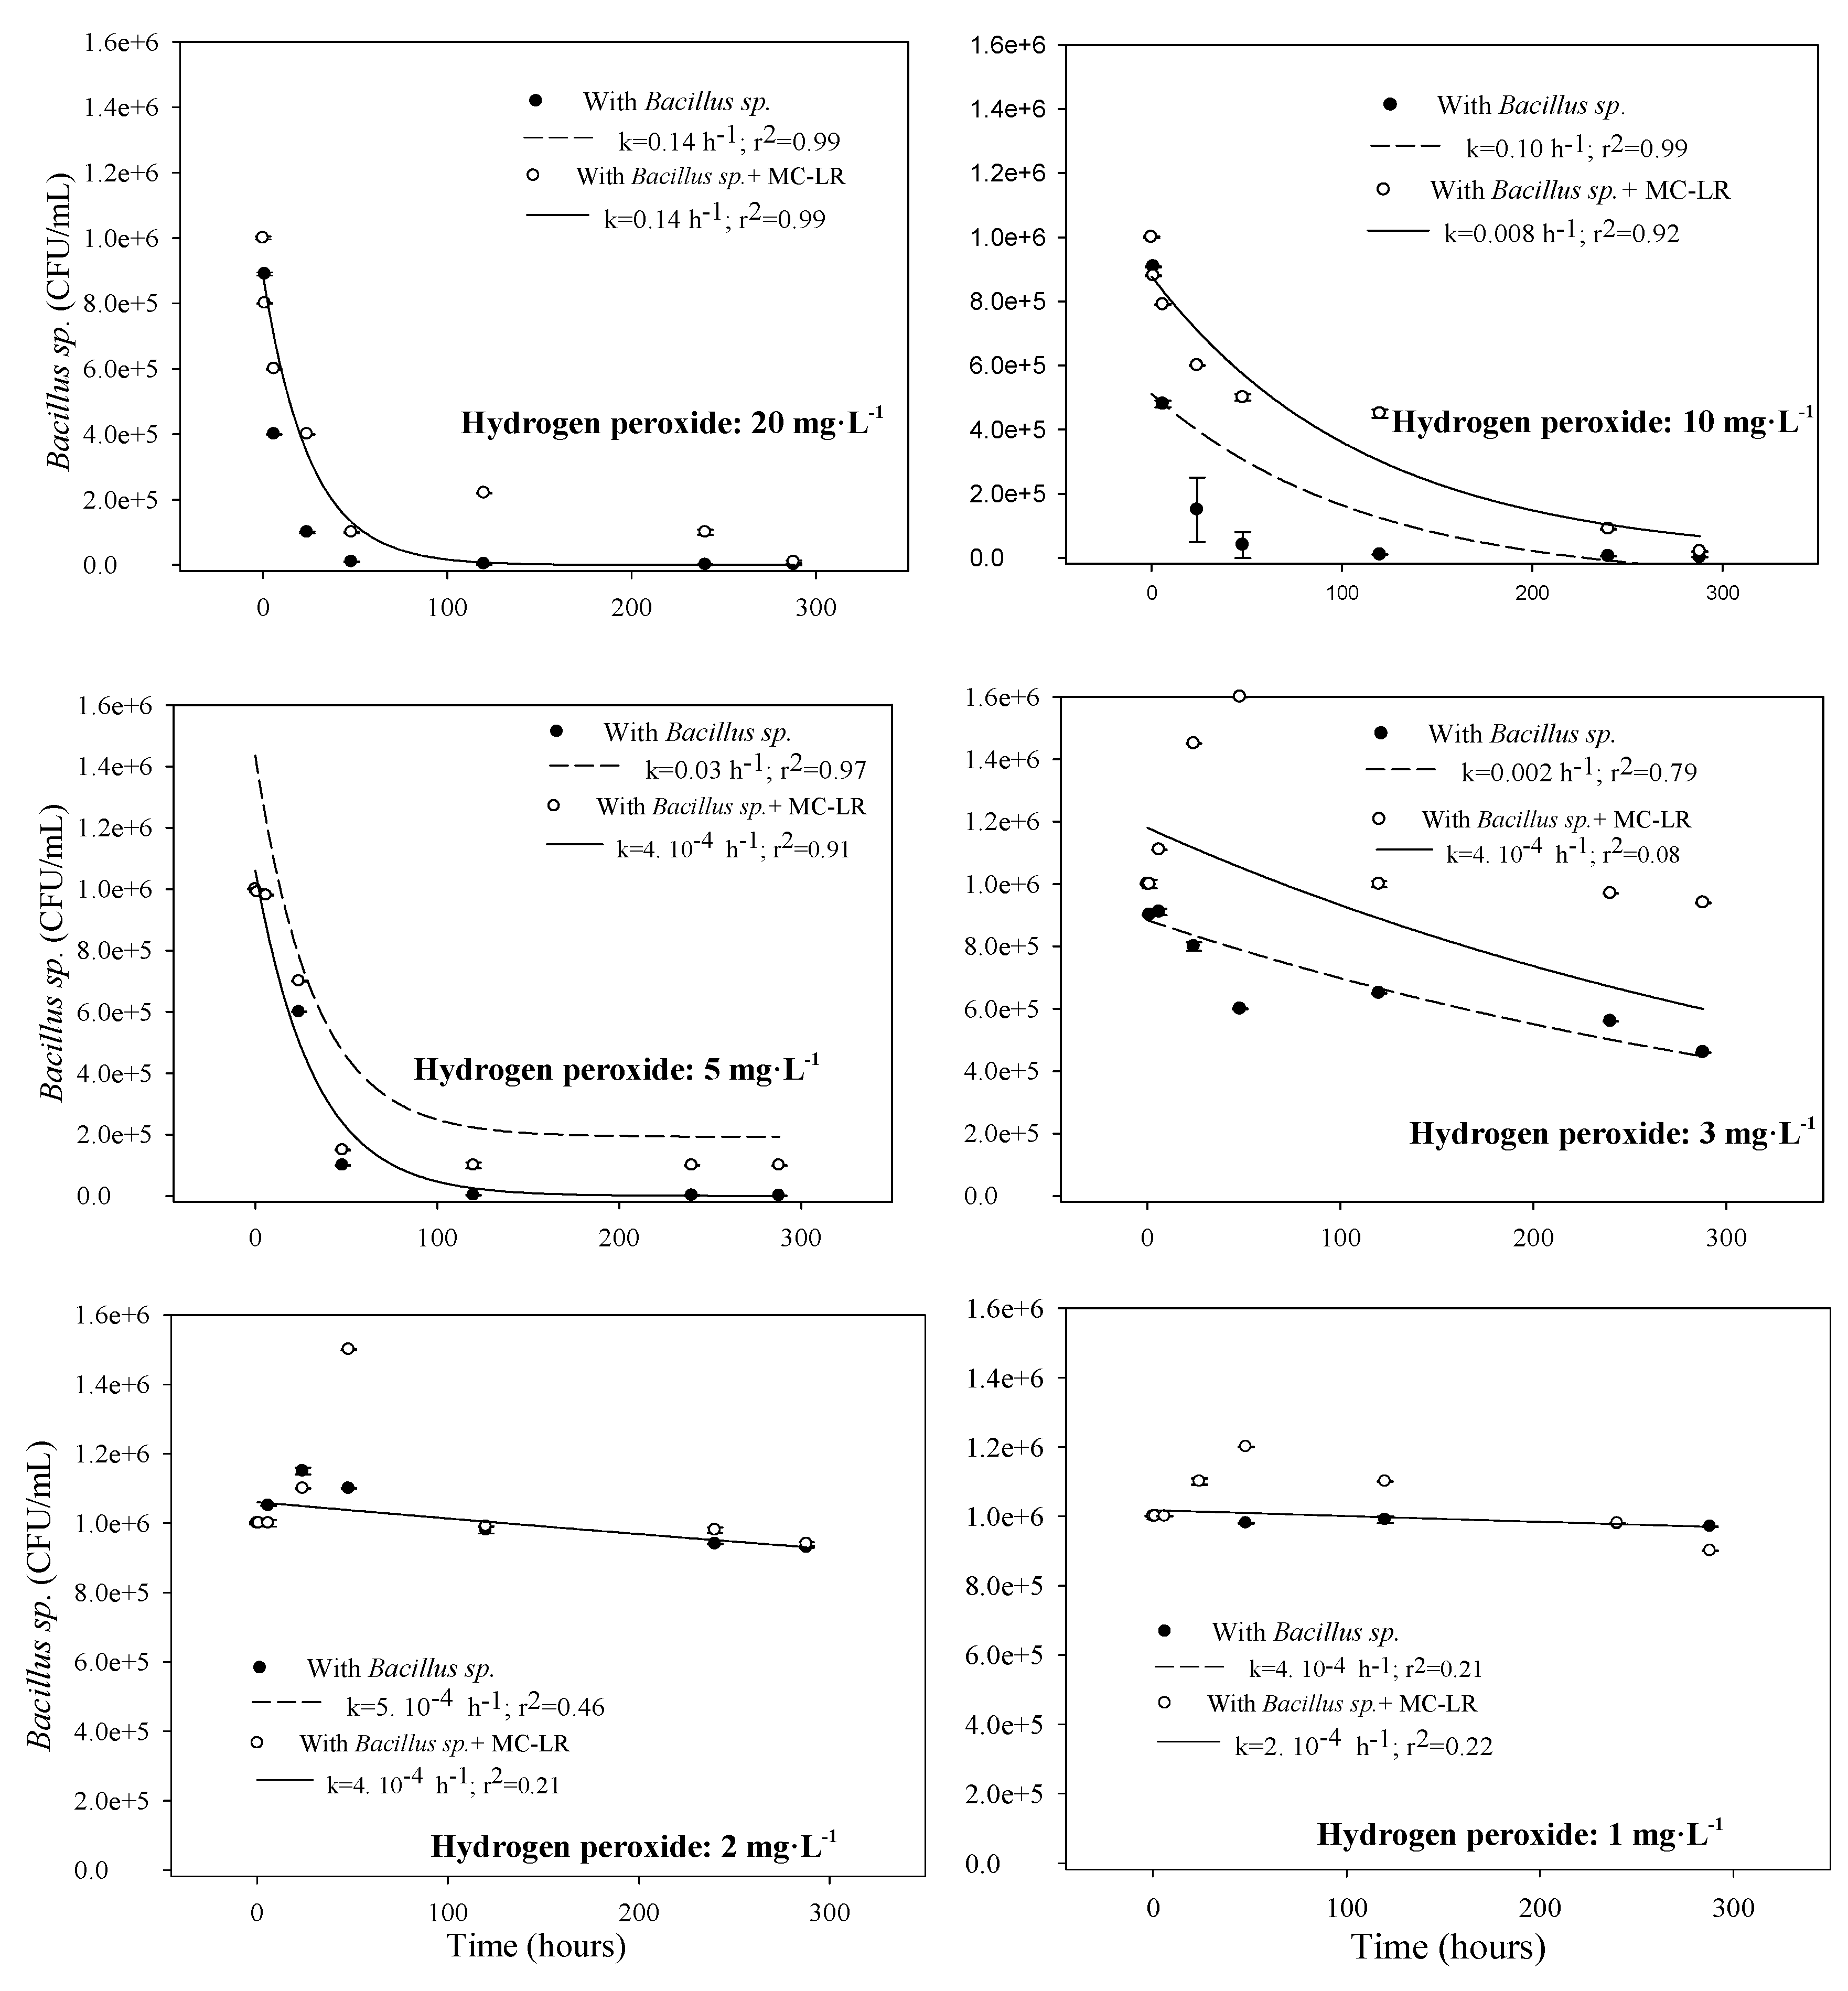
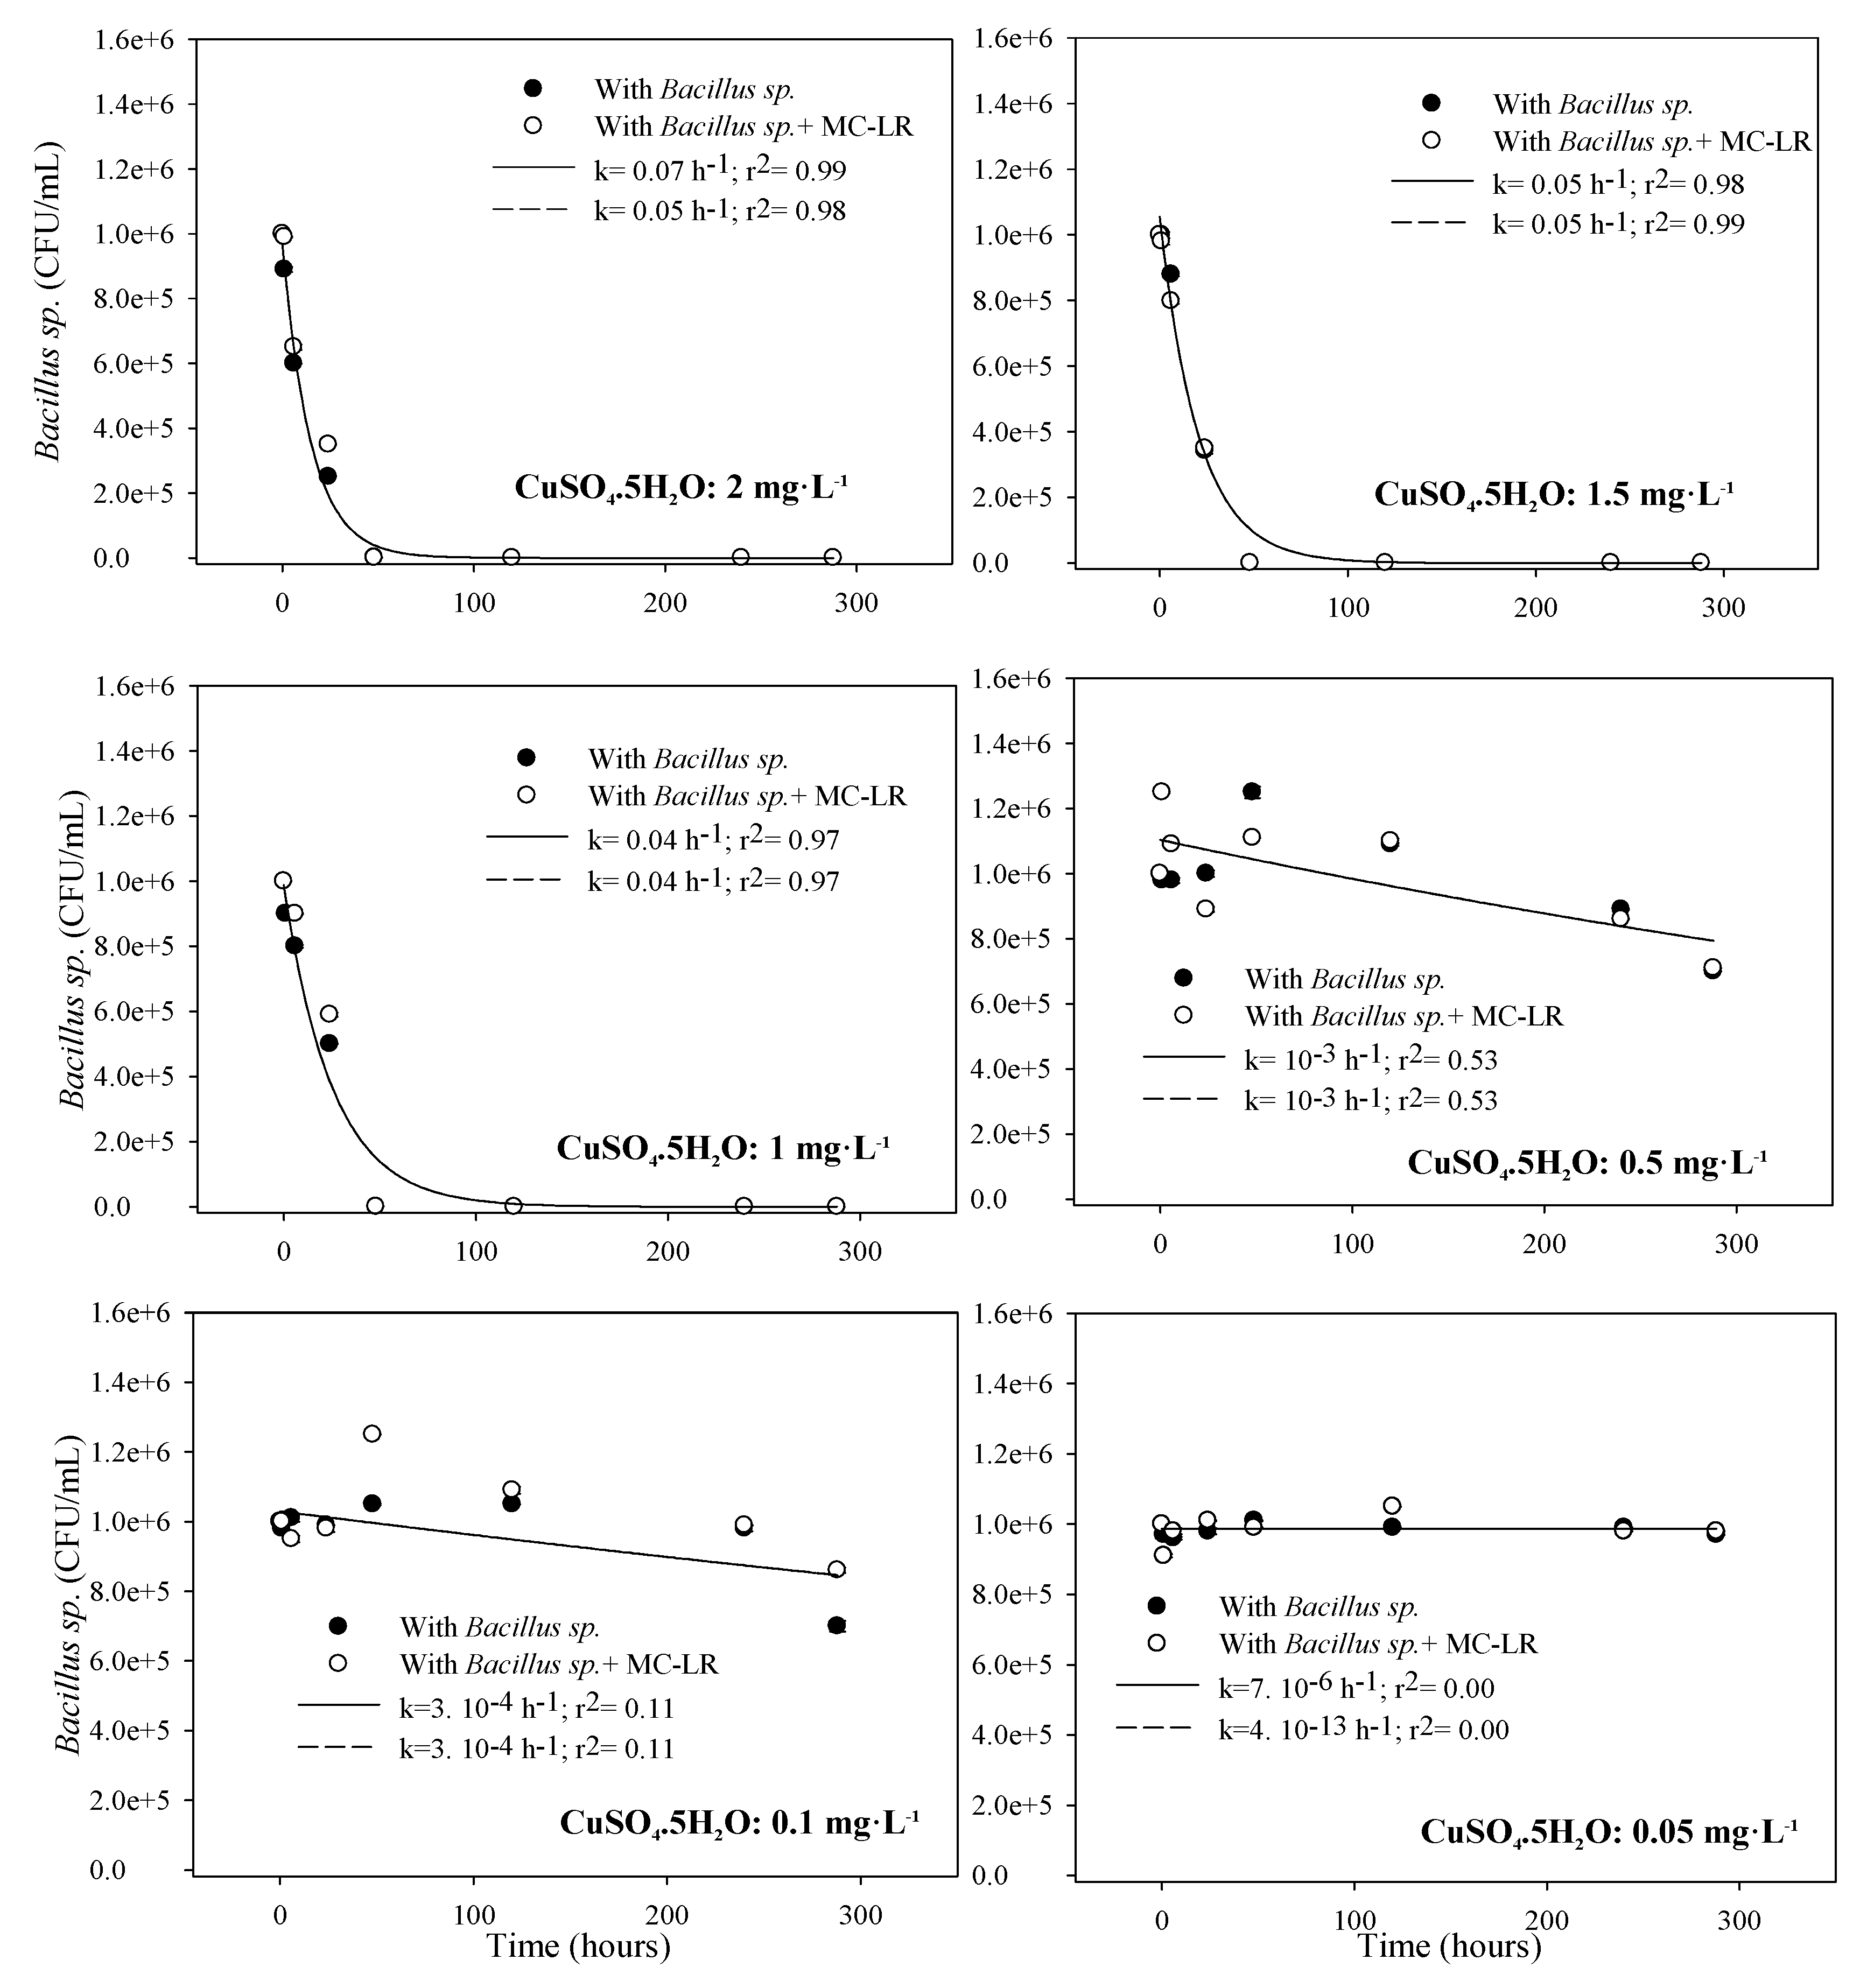
3.1.2. Toxicity to Bacillus sp.
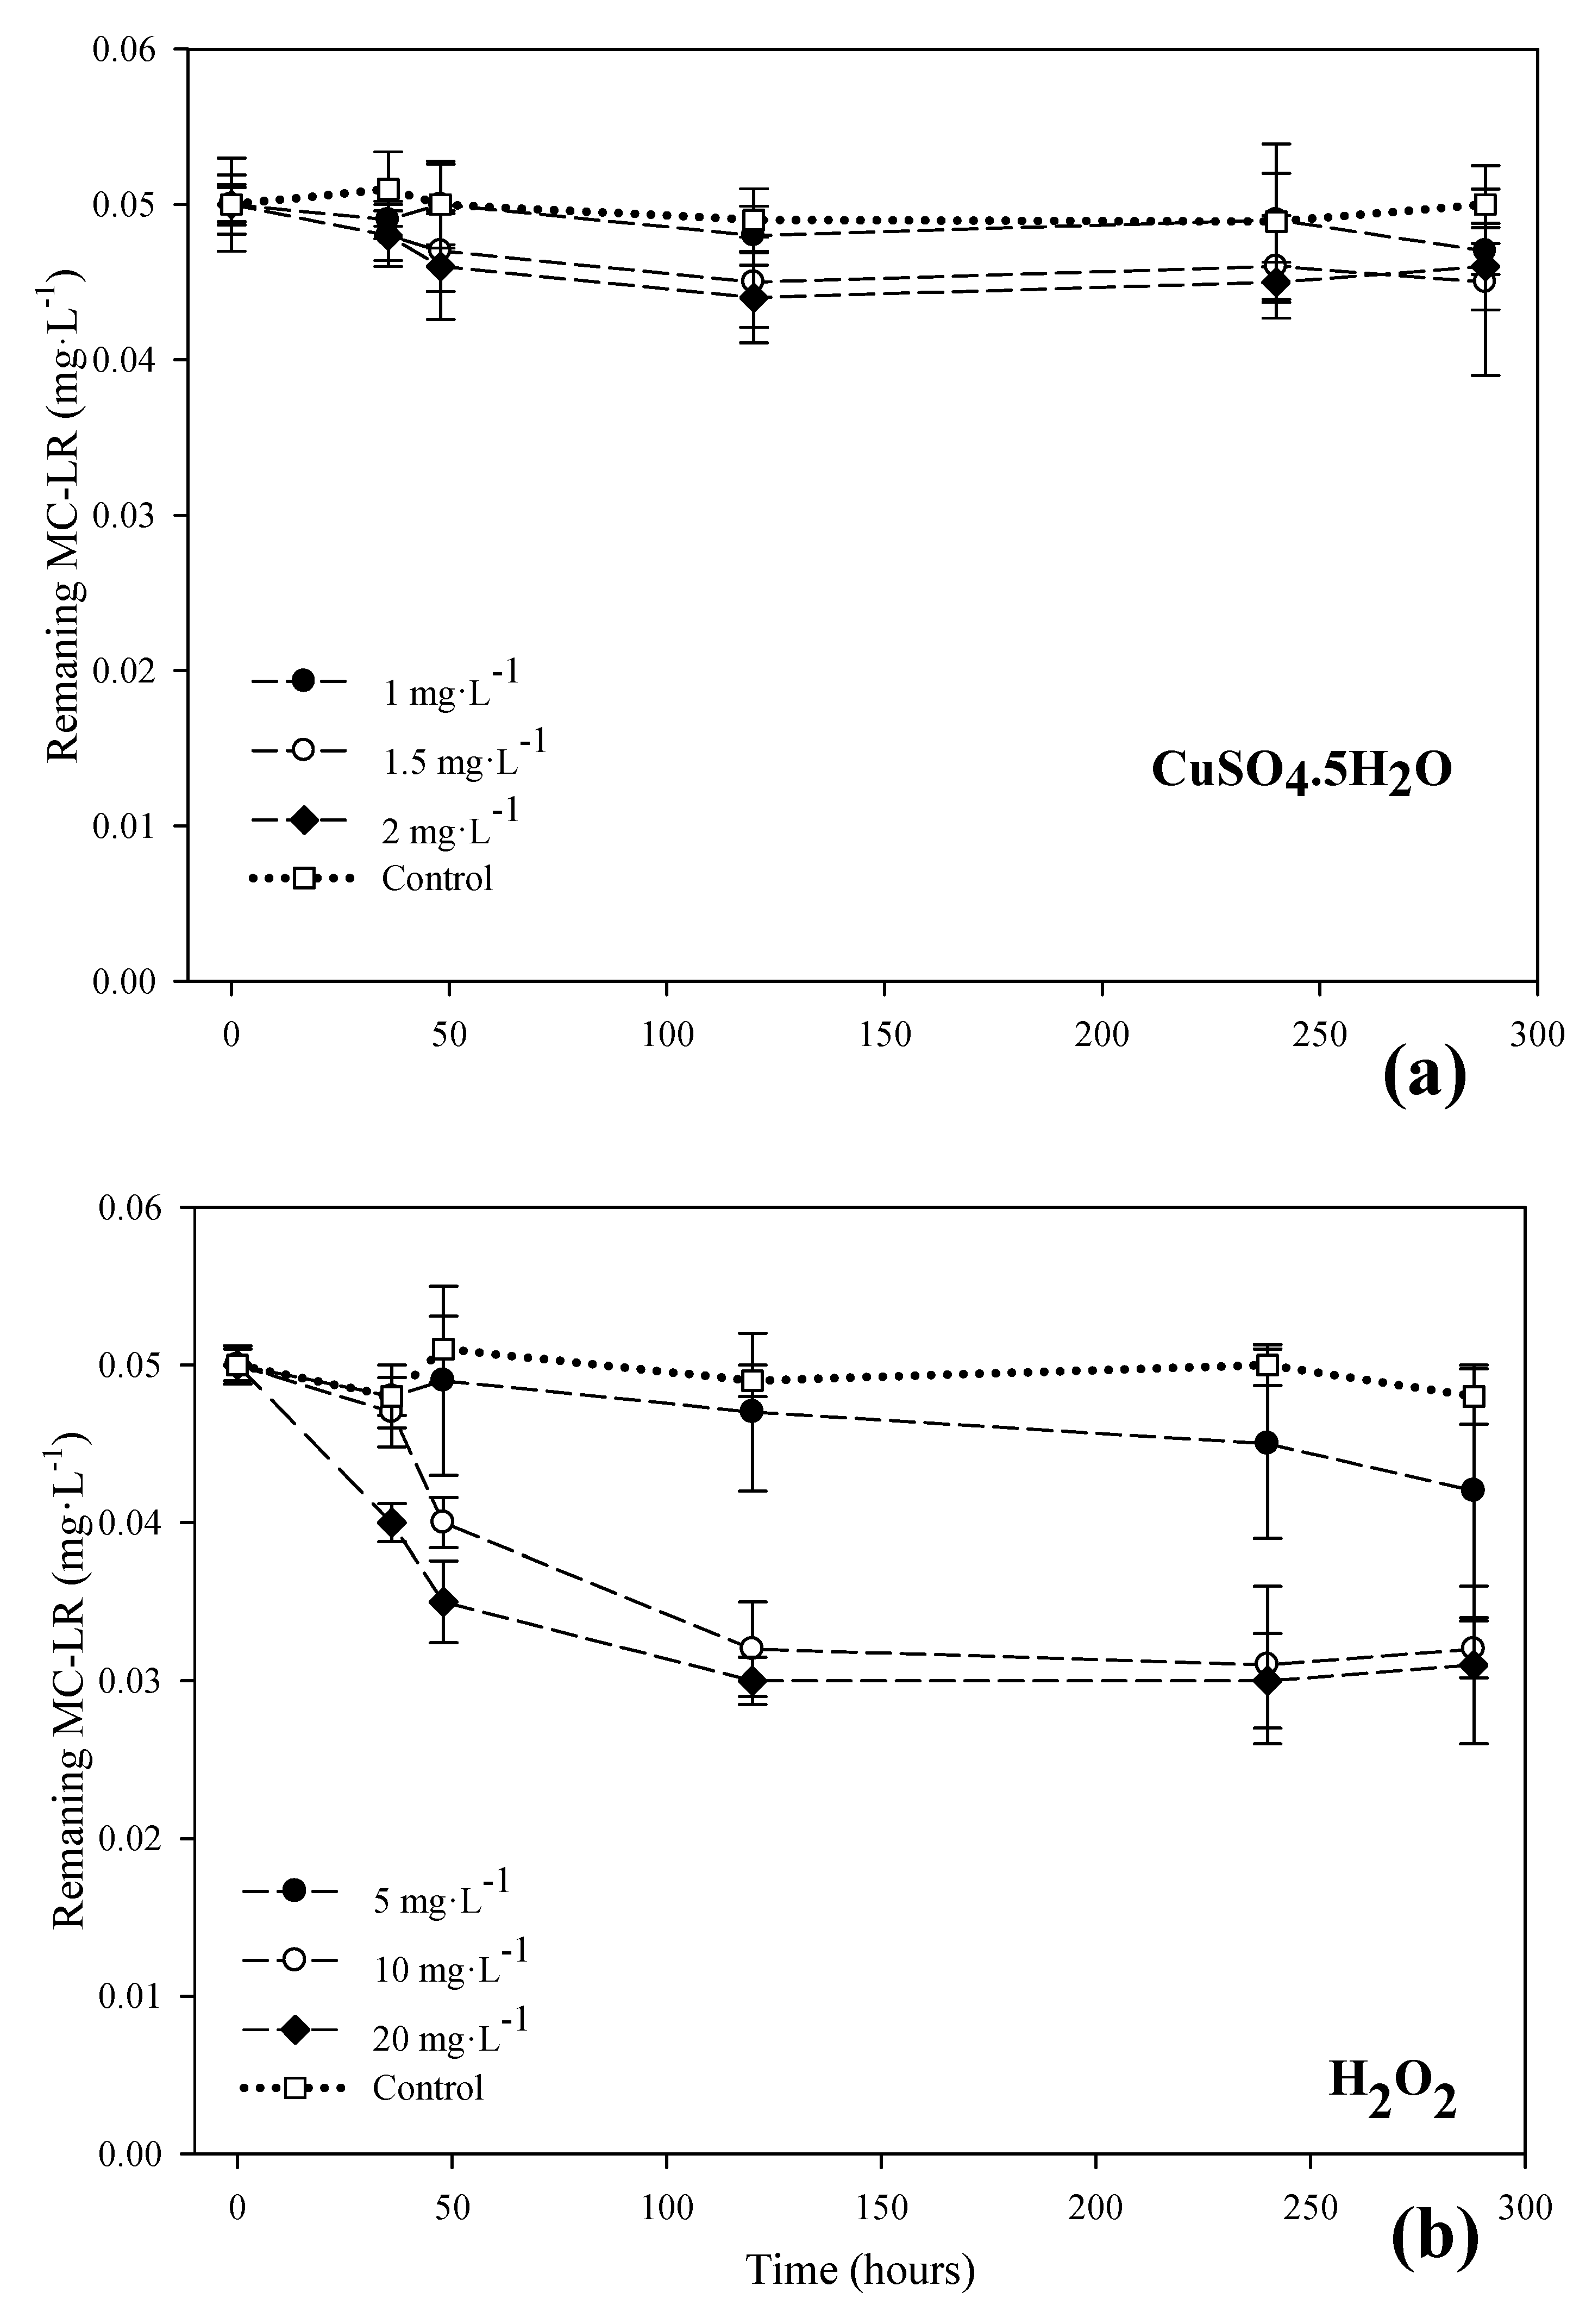
3.2. MC-LR Degradation in the Systems with Copper Sulfate and Hydrogen Peroxide
3.3. Evaluation of the Effects of H2O2 and Copper Sulfate on the Control of Cyanobacteria and Their Metabolites
4. Conclusions
Supplementary Materials
Acknowledgments
Author Contributions
Conflicts of Interest
References
- Wells, M.L.; Trainer, V.L. International scientific symposium on harmful algal blooms and climate change. PICES Press 2016, 24, 16. [Google Scholar]
- Falconer, I.R. Algal toxins and human health. In Quality and Treatment of Drinking Water II; Springer: Berlin, Germany, 1998; pp. 53–82. [Google Scholar]
- United States Environmental Protection Agency. Drinking Water Health Advisory for the Cyanobacterial Microcystin Toxins; United States Environmental Protection Agency: Washington, DC, USA, 2015.
- Carmichael, W.W. Health effects of toxin-producing cyanobacteria: “The cyanohabs”. Hum. Ecol. Risk Assess. Int. J. 2001, 7, 1393–1407. [Google Scholar] [CrossRef]
- Lone, Y.; Koiri, R.K.; Bhide, M. An overview of the toxic effect of potential human carcinogen microcystin-lr on testis. Toxicol. Rep. 2015, 2, 289–296. [Google Scholar] [CrossRef]
- World Health Organization (WHO). Guidelines for Drinking-Water Quality. In Health Criteria and Other Supporting Information: Addendum; WHO: Geneva, Switzerland, 1998; Volume 2. [Google Scholar]
- Teixeira, M.R.; Rosa, M.J. Microcystins removal by nanofiltration membranes. Sep. Purif. Technol. 2005, 46, 192–201. [Google Scholar] [CrossRef]
- Yuan, B.-L.; Qu, J.-H.; Fu, M.-L. Removal of cyanobacterial microcystin-lr by ferrate oxidation-coagulation. Toxicon 2002, 40, 1129–1134. [Google Scholar] [CrossRef]
- Ho, L.; Lambling, P.; Bustamante, H.; Duker, P.; Newcombe, G. Application of powdered activated carbon for the adsorption of cylindrospermopsin and microcystin toxins from drinking water supplies. Water Res. 2011, 45, 2954–2964. [Google Scholar] [CrossRef] [PubMed]
- Gągała, I.; Mankiewicz-Boczek, J. The natural degradation of microcystins (cyanobacterial hepatotoxins) in fresh water-the future of modern treatment systems and water quality improvement. Pol. J. Environ. Stud. 2012, 21, 1125–1139. [Google Scholar]
- Somdee, T.; Peekan, A.; Somdee, A. Bacterial degradation of microcystins within a biologically active sand filter. J. Life Sci. Technol. Vol. 2013, 40, 768–774. [Google Scholar] [CrossRef]
- Kansole, M.M.; Lin, T.-F. Microcystin-LR biodegradation by bacillus sp.: Reaction rates and possible genes involved in the degradation. Water 2016, 8, 508. [Google Scholar] [CrossRef]
- Cousins, I.; Bealing, D.; James, H.; Sutton, A. Biodegradation of microcystin-LR by indigenous mixed bacterial populations. Water Res. 1996, 30, 481–485. [Google Scholar] [CrossRef]
- Tsuji, K.; Asakawa, M.; Anzai, Y.; Sumino, T.; Harada, K.-I. Degradation of microcystins using immobilized microorganism isolated in an eutrophic lake. Chemosphere 2006, 65, 117–124. [Google Scholar] [CrossRef] [PubMed]
- Hudnell, H.K. Cyanobacterial Harmful Algal Blooms: State of the Science and Research Needs; Springer Science & Business Media: Berlin, Germany, 2008; Volume 619. [Google Scholar]
- U.S. Environmental Protection Agency. Control and Treatment. Available online: https://www.Epa.Gov/nutrient-policy-data/control-and-treatment#main-content date (accessed on 9 January 2017).
- Newcombe, G.; House, J.; Ho, L.; Baker, P.; Burch, M. Management Strategies for Cyanobacteria (Blue-Green Algae): A Guide for Water Utilities; Water Quality Research Australia (WQRA), Reserach Report; Water Quality Research Australia: Victoria, BC, Canada, 2010; Volume 74. [Google Scholar]
- Jones, G.J.; Orr, P.T. Release and degradation of microcystin following algicide treatment of a microcystis aeruginosa bloom in a recreational lake, as determined by hplc and protein phosphatase inhibition assay. Water Res. 1994, 28, 871–876. [Google Scholar] [CrossRef]
- Zhou, S.; Shao, Y.; Gao, N.; Deng, Y.; Qiao, J.; Ou, H.; Deng, J. Effects of different algaecides on the photosynthetic capacity, cell integrity and microcystin-LR release of microcystis aeruginosa. Sci. Total Environ. 2013, 463, 111–119. [Google Scholar] [CrossRef] [PubMed]
- Izaguirre, G. A copper-tolerant phormidium species from lake mathews, california, that produces 2-methylisoborneol and geosmin. Water Sci. Technol. 1992, 25, 217–223. [Google Scholar]
- Fan, J.; Ho, L.; Hobson, P.; Brookes, J. Evaluating the effectiveness of copper sulphate, chlorine, potassium permanganate, hydrogen peroxide and ozone on cyanobacterial cell integrity. Water Res. 2013, 47, 5153–5164. [Google Scholar] [CrossRef] [PubMed]
- Le Jeune, A.-H.; Charpin, M.; Deluchat, V.; Briand, J.-F.; Lenain, J.-F.; Baudu, M.; Amblard, C. Effect of copper sulphate treatment on natural phytoplanktonic communities. Aquat. Toxicol. 2006, 80, 267–280. [Google Scholar] [CrossRef] [PubMed]
- Kenefick, S.; Hrudey, S.; Peterson, H.; Prepas, E. Toxin release from microcystis aeruginosa after chemical treatment. Water Sci. Technol. 1993, 27, 433–440. [Google Scholar]
- Starr, T.J.; Jones, M.E. The effect of copper on the growth of bacteria isolated from marine environments. Limnol. Oceanogr. 1957, 2, 33–36. [Google Scholar] [CrossRef]
- Prepas, E.; Murphy, T. Sediment–water interactions in farm dugouts previously treated with copper sulfate. Lake Reserv. Manag. 1988, 4, 161–168. [Google Scholar] [CrossRef]
- Iwinski, K.J.; McQueen, A.D.; Kinley, C.M.; Calomeni, A.J.; Geer, T.D.; Rodgers, J.H., Jr. Sediment copper concentrations, in situ benthic invertebrate abundance, and sediment toxicity: Comparison of treated and untreated coves in a southern reservoir. Water Air Soil Pollut. 2016, 227, 1–10. [Google Scholar] [CrossRef]
- Canadian Sediment Quality Guidelines for the Protection of Aquatic Life: Summary Tables; Canadian Environmental Quality Guidelines, 1999; Canadian Council of Ministers of the Environment Winnipeg: Winnipeg, MB, Canada, 2001.
- Dollwet, H.; Sorenson, J. Historic uses of copper compounds in medicine. Trace Elem. Med. 1985, 2, 80–87. [Google Scholar]
- Brown, B.; Rattigan, B. Toxicity of soluble copper and other metal ions to elodea canadensis. Environ. Pollut. (1970) 1979, 20, 303–314. [Google Scholar] [CrossRef]
- World Health Organization (WHO). Guidelines for Drinking-Water Quality, 4th ed.; WHO: Geneva, Switzerland, 2011. [Google Scholar]
- Manzl, C.; Enrich, J.; Ebner, H.; Dallinger, R.; Krumschnabel, G. Copper-induced formation of reactive oxygen species causes cell death and disruption of calcium homeostasis in trout hepatocytes. Toxicology 2004, 196, 57–64. [Google Scholar] [CrossRef] [PubMed]
- Borkow, G.; Gabbay, J. Copper as a biocidal tool. Curr. Med. Chem. 2005, 12, 2163–2175. [Google Scholar] [CrossRef] [PubMed]
- Lin, Y.-S.E.; Vidic, R.D.; Stout, J.E.; Victor, L.Y. Individual and combined effects of copper and silver ions on inactivation of Legionella pneumophila. Water Res. 1996, 30, 1905–1913. [Google Scholar] [CrossRef]
- Drábková, M.; Admiraal, W.; Maršálek, B. Combined exposure to hydrogen peroxide and light selective effects on cyanobacteria, green algae, and diatoms. Environ. Sci. Technol. 2007, 41, 309–314. [Google Scholar] [CrossRef] [PubMed]
- Barrington, D.J.; Ghadouani, A.; Ivey, G.N. Environmental factors and the application of hydrogen peroxide for the removal of toxic cyanobacteria from waste stabilization ponds. J. Environ. Eng. 2011, 137, 952–960. [Google Scholar] [CrossRef]
- Barbusiński, K. Fenton reaction-controversy concerning the chemistry. Ecol. Chem. Eng. S 2009, 16, 347–358. [Google Scholar]
- Pardieck, D.L.; Bouwer, E.J.; Stone, A.T. Hydrogen peroxide use to increase oxidant capacity for in situ bioremediation of contaminated soils and aquifers: A review. J. Contam. Hydrol. 1992, 9, 221–242. [Google Scholar] [CrossRef]
- Acar, E. Oxidation of Acid Red 151 Solutions by Peroxone (O3/H2O2) Process. Ph.D. Thesis, Middle East Technical University, Ankara, Turkey, 2004. [Google Scholar]
- Maillard, J.Y. Bacterial target sites for biocide action. J. Appl. Microbiol. 2002, 92, 16S–27S. [Google Scholar] [CrossRef] [PubMed]
- Rippka, R. [1] isolation and purification of cyanobacteria. Methods Enzymol. 1988, 167, 3–27. [Google Scholar] [PubMed]
- Ncbi, R.C. Database resources of the national center for biotechnology information. Nucleic Acids Res. 2016, 44, D7. [Google Scholar]
- Sepahi, A.A.; Golpasha, I.D.; Emami, M.; Nakhoda, A. Isolation and characterization of crude oil degrading bacillus spp. J. Environ. Health Sci. Eng. 2008, 5, 149–154. [Google Scholar]
- Bartram, J.; Cotruvo, J.; Exner, M.; Fricker, C.; Glasmacher, A. Heterotrophic Plate Counts and Drinking-Water Safety: The Significance of Hpcs for Water Quality and Human Health; IWA Publishing: London, UK, 2003. [Google Scholar]
- Bury, N.; Flik, G.; Eddy, F.; Codd, G. The effects of cyanobacteria and the cyanobacterial toxin microcystin-LR on Ca2+ transport and Na+/K+-atpase in tilapia gills. J. Exp. Biol. 1996, 199, 1319–1326. [Google Scholar] [PubMed]
- Hu, L.B.; Yang, J.D.; Zhou, W.; Yin, Y.F.; Chen, J.; Shi, Z.Q. Isolation of a Methylobacillus sp. that degrades microcystin toxins associated with cyanobacteria. New Biotechnol. 2009, 26, 205–211. [Google Scholar] [CrossRef] [PubMed]
- National Health and Medical Research Council, Australian Government. Australian Drinking Water Guidelines; National Health and Medical Research Council (NHMRC): Canberra, ACT, Australia, 2004.
- Fischer, W.J.; Garthwaite, I.; Miles, C.O.; Ross, K.M.; Aggen, J.B.; Chamberlin, A.R.; Towers, N.R.; Dietrich, D.R. Congener-independent immunoassay for microcystins and nodularins. Environ. Sci. Technol. 2001, 35, 4849–4856. [Google Scholar] [CrossRef] [PubMed]
- Sellers, R.M. Spectrophotometric determination of hydrogen peroxide using potassium titanium (iv) oxalate. Analyst 1980, 105, 950–954. [Google Scholar] [CrossRef]
- Kwon, M.; Kim, S.; Yoon, Y.; Jung, Y.; Hwang, T.-M.; Kang, J.-W. Prediction of the removal efficiency of pharmaceuticals by a rapid spectrophotometric method using rhodamine b in the UV/H2O2 process. Chem. Eng. J. 2014, 236, 438–447. [Google Scholar] [CrossRef]
- Galster, H. pH Measurement: Fundamentals, Methods, Applications, Instrumentation; VCH: Sechelt, BC, Canada, 1991. [Google Scholar]
- Dickson, A. An exact definition of total alkalinity and a procedure for the estimation of alkalinity and total inorganic carbon from titration data. Deep Sea Res. Part A Oceanogr. Res. Pap. 1981, 28, 609–623. [Google Scholar] [CrossRef]
- Mikula, P.; Zezulka, S.; Jancula, D.; Marsalek, B. Metabolic activity and membrane integrity changes in microcystis aeruginosa–new findings on hydrogen peroxide toxicity in cyanobacteria. Eur. J. Phycol. 2012, 47, 195–206. [Google Scholar] [CrossRef]
- Zepp, R.G.; Skurlatov, Y.I.; Pierce, J. Algal-Induced Decay and Formation of Hydrogen Peroxide in Water: Its Possible Role in Oxidation of Anilines by Algae. In Photochemistry of Environmental Aquatic Systems; ACS Symposium Series: Washington, DC, USA, 1987. [Google Scholar]
- Huo, X.; Chang, D.-W.; Tseng, J.-H.; Burch, M.D.; Lin, T.-F. Exposure of microcystis aeruginosa to hydrogen peroxide under light: Kinetic modeling of cell rupture and simultaneous microcystin degradation. Environ. Sci. Technol. 2015, 49, 5502–5510. [Google Scholar] [CrossRef] [PubMed]
- Cataldo, F. Hydrogen peroxide photolysis with different UV light sources including a new UV-led light source. Ann. West Univ. Timisoara Ser. Chem. 2014, 23, 99. [Google Scholar]
- Tsai, K.-P. Effects of two copper compounds on microcystis aeruginosa cell density, membrane integrity, and microcystin release. Ecotoxicol. Environ. Saf. 2015, 120, 428–435. [Google Scholar] [CrossRef] [PubMed]
- McKnight, D.M.; Chisholm, S.W.; Harleman, D.R. Cuso4 treatment of nuisance algal blooms in drinking water reservoirs. Environ. Manag. 1983, 7, 311–320. [Google Scholar] [CrossRef]
- Gibson, C. The algicidal effect of copper on a green and a blue-green alga and some ecological implications. J. Appl. Ecol. 1972, 513–518. [Google Scholar] [CrossRef]
- Garcı́a-Villada, L.; Rico, M.; Altamirano, M.A.; Sánchez-Martı́n, L.; López-Rodas, V.; Costas, E. Occurrence of copper resistant mutants in the toxic cyanobacteria microcystis aeruginosa: Characterisation and future implications in the use of copper sulphate as algaecide. Water Res. 2004, 38, 2207–2213. [Google Scholar] [CrossRef] [PubMed]
- Erickson, R.J.; Bills, T.D.; Clark, J.R.; Hansen, D.J.; Knezovich, J.; Mayer, F.L., Jr.; McElroy, A.E. Synopsis of Discussion Session on Physicochemical Factors Affecting Toxicity; Bioavailability: Physical, Chemical, and Biological Interactions; Lewis: Boca Raton, FL, USA, 1994; pp. 31–38. [Google Scholar]
- Clayton, R. Managing Iowa Fisheries: Use of Copper Compounds in Aquatic Systems. In Agriculture and Environment Extension Publications; Iowa State University Extension and Outreach: Ames, IA, USA, 2009. [Google Scholar]
- Qian, H.; Yu, S.; Sun, Z.; Xie, X.; Liu, W.; Fu, Z. Effects of copper sulfate, hydrogen peroxide and n-phenyl-2-naphthylamine on oxidative stress and the expression of genes involved photosynthesis and microcystin disposition in microcystis aeruginosa. Aquat. Toxicol. 2010, 99, 405–412. [Google Scholar] [CrossRef] [PubMed]
- Sani, R.K.; Peyton, B.M.; Brown, L.T. Copper-induced inhibition of growth of desulfovibrio desulfuricans G20: Assessment of its toxicity and correlation with those of zinc and lead. Appl. Environ. Microbiol. 2001, 67, 4765–4772. [Google Scholar] [CrossRef] [PubMed]
- Zevenhuizen, L.; Dolfing, J.; Eshuis, E.; Scholten-Koerselman, I.J. Inhibitory effects of copper on bacteria related to the free ion concentration. Microb. Ecol. 1979, 5, 139–146. [Google Scholar] [CrossRef] [PubMed]
- Yu-sen, E.L.; Vidic, R.D.; Stout, J.E.; Victor, L.Y. Negative effect of high ph on biocidal efficacy of copper and silver ions in controlling Legionella pneumophila. Appl. Environ. Microbiol. 2002, 68, 2711–2715. [Google Scholar]
- Hyne, R.V.; Pablo, F.; Julli, M.; Markich, S.J. Influence of water chemistry on the acute toxicity of copper and zinc to the cladoceran ceriodaphnia cf dubia. Environ. Toxicol. Chem. 2005, 24, 1667–1675. [Google Scholar] [CrossRef] [PubMed]
- Filippis, L.; Pallaghy, C. Heavy metals: Sources and biological effects. Adv. Limnol. Arch. Hydrobiol. 1994, 42, 31–77. [Google Scholar]
- Sunda, W. The Relationship between Cupric Ion Activity and the Toxicity of Copper to Phytoplankton; Massachusetts Institute of Technology and Woods Hole Oceanographic Institution: Whoods Hole, MA, USA, 1975. [Google Scholar]
- Gustafsson, J.P. Visual MINTEQ version 3.1, department of sustainable development. Environ. Sci. Eng. KTH Stockh. 2013. Available online: https://vminteq.lwr.kth.se/ (accessed on 3 April 2017).
- Thomas, E.L.; Milligan, T.W.; Joyner, R.E.; Jefferson, M.M. Antibacterial activity of hydrogen peroxide and the lactoperoxidase-hydrogen peroxide-thiocyanate system against oral streptococci. Infect. Immun. 1994, 62, 529–535. [Google Scholar] [PubMed]
- Sundstrom, D.; Weir, B.; Klei, H. Destruction of aromatic pollutants by UV light catalyzed oxidation with hydrogen peroxide. Environ. Prog. 1989, 8, 6–11. [Google Scholar] [CrossRef]
- Jung, Y.S.; Lim, W.T.; Park, J.Y.; Kim, Y.H. Effect of pH on fenton and fenton-like oxidation. Environ. Technol. 2009, 30, 183–190. [Google Scholar] [CrossRef] [PubMed]
- Walling, C.; Goosen, A. Mechanism of the ferric ion catalyzed decomposition of hydrogen peroxide. Effect of organic substrates. J. Am. Chem. Soc. 1973, 95, 2987–2991. [Google Scholar] [CrossRef]
- Schmidt, L.J.; Gaikowski, M.P.; Gingerich, W. Environmental Assessment for the Use of Hydrogen Peroxide in Aquaculture for Treating External Fungal and Bacterial Diseases of Cultured Fish and Fish Eggs; USGS Report; United States Environmental Protection Agency: Washington, DC, USA, 2006.
- Cooper, W.J.; Shao, C.; Lean, D.R.; Gordon, A.S.; Scully, F.E., Jr. Factors affecting the distribution of H2O2 in surface waters. Adv. Chem. Ser. 1994, 237, 391. [Google Scholar]
- Qiao, R.-P.; Li, N.; Qi, X.-H.; Wang, Q.-S.; Zhuang, Y.-Y. Degradation of microcystin-RR by UV radiation in the presence of hydrogen peroxide. Toxicon 2005, 45, 745–752. [Google Scholar] [CrossRef] [PubMed]
- Walker, H.W. Harmful Algae Blooms in Drinking Water: Removal of Cyanobacterial Cells and Toxins; CRC Press: Boca Raton, FL, USA, 2014. [Google Scholar]
- Barroin, G.; Feuillade, M. Hydrogen peroxide as a potential algicide for oscillatoria rubescens D.C. Water Res. 1986, 20, 619–623. [Google Scholar] [CrossRef]
- Wang, Z.; Li, D.; Qin, H.; Li, Y. An integrated method for removal of harmful cyanobacterial blooms in eutrophic lakes. Environ. Pollut. 2012, 160, 34–41. [Google Scholar] [CrossRef] [PubMed]
- Mazzola, P.G.; Martins, A.M.; Penna, T.C. Chemical resistance of the gram-negative bacteria to different sanitizers in a water purification system. BMC Infect. Dis. 2006, 6, 1. [Google Scholar] [CrossRef] [PubMed]
- Miller, T. Killing and lysis of gram-negative bacteria through the synergistic effect of hydrogen peroxide, ascorbic acid, and lysozyme. J. Bacteriol. 1969, 98, 949–955. [Google Scholar] [PubMed]
- Matthijs, H.C.; Jančula, D.; Visser, P.M.; Maršálek, B. Existing and emerging cyanocidal compounds: New perspectives for cyanobacterial bloom mitigation. Aquat. Ecol. 2016, 50, 443–460. [Google Scholar] [CrossRef]
- Raman, R.K.; Cook, B.C. Guidelines for Applying Copper Sulfate as an Algicide: Lake Loami Field Study; Illinois Department of Energy and Natural Resources: Springfield, IL, USA, 1988.
- Küpper, H.; Šetlík, I.; Spiller, M.; Küpper, F.C.; Prášil, O. Heavy metal-induced inhibition of photosynthesis: Targets of in vivo heavy metal chlorophyll formation1. J. Phycol. 2002, 38, 429–441. [Google Scholar] [CrossRef]
- Singh, R.; Gautam, N.; Mishra, A.; Gupta, R. Heavy metals and living systems: An overview. Indian J. Pharmacol. 2011, 43, 246. [Google Scholar] [CrossRef] [PubMed]
- Infomine Inc. Historical Copper Prices and Price Chart. Available online: http://www.Infomine.Com/investment/metal-prices/copper/all/ (accessed on 17 January 2017).
- Alibaba Group. Hydrogen Peroxide, Copper Sulfate Pentahydrate Specifications and Price. Available online: https://www.alibaba.com/product-detail/Hot-sale-ISO-BV-35-50_60177706929.html (accessed on 17 January 2017).
- Wert, E.C.; Korak, J.A.; Trenholm, R.A.; Rosario-Ortiz, F.L. Effect of oxidant exposure on the release of intracellular microcystin, mib, and geosmin from three cyanobacteria species. Water Res. 2014, 52, 251–259. [Google Scholar] [CrossRef] [PubMed]
- World Health Organization (WHO). Toxic Cyanobacteria in Water: A Guide to Their Public Health Consequences, Monitoring and Management; E & FN Spon: London, UK, 1999. [Google Scholar]


| Species Name | pH 6.2 | pH 7 | pH 7.4 |
|---|---|---|---|
| SO42− | 99.4 | 99.6 | 99.9 |
| CuSO4 (aq) | 1.0 | 0.7 | 0.3 |
| Cu2+ | 94.5 | 68.4 | 50.9 |
| CuOH+ | 4.6 | 21.1 | 39.7 |
| Cu(OH)2 (aq) | 0.01 | 0.4 | 1.8 |
| Cu2(OH)22+ | 0.4 | 8.6 | 6.4 |
| Cu3(OH)42+ | - | 1.2 | 0.9 |
© 2017 by the authors. Licensee MDPI, Basel, Switzerland. This article is an open access article distributed under the terms and conditions of the Creative Commons Attribution (CC BY) license (http://creativecommons.org/licenses/by/4.0/).
Share and Cite
Kansole, M.M.R.; Lin, T.-F. Impacts of Hydrogen Peroxide and Copper Sulfate on the Control of Microcystis aeruginosa and MC-LR and the Inhibition of MC-LR Degrading Bacterium Bacillus sp. Water 2017, 9, 255. https://doi.org/10.3390/w9040255
Kansole MMR, Lin T-F. Impacts of Hydrogen Peroxide and Copper Sulfate on the Control of Microcystis aeruginosa and MC-LR and the Inhibition of MC-LR Degrading Bacterium Bacillus sp. Water. 2017; 9(4):255. https://doi.org/10.3390/w9040255
Chicago/Turabian StyleKansole, Michelline M. R., and Tsair-Fuh Lin. 2017. "Impacts of Hydrogen Peroxide and Copper Sulfate on the Control of Microcystis aeruginosa and MC-LR and the Inhibition of MC-LR Degrading Bacterium Bacillus sp." Water 9, no. 4: 255. https://doi.org/10.3390/w9040255
APA StyleKansole, M. M. R., & Lin, T.-F. (2017). Impacts of Hydrogen Peroxide and Copper Sulfate on the Control of Microcystis aeruginosa and MC-LR and the Inhibition of MC-LR Degrading Bacterium Bacillus sp. Water, 9(4), 255. https://doi.org/10.3390/w9040255