
Economic Insight from Utah’s Water Efficiency Supply Curve

Abstract
:1. Introduction
2. Methodology
3. Results
3.1. Residential Indoor
3.2. Residential Outdoor
3.3. Commercial
3.4. Wastewater
3.5. Agriculture
3.6. Development
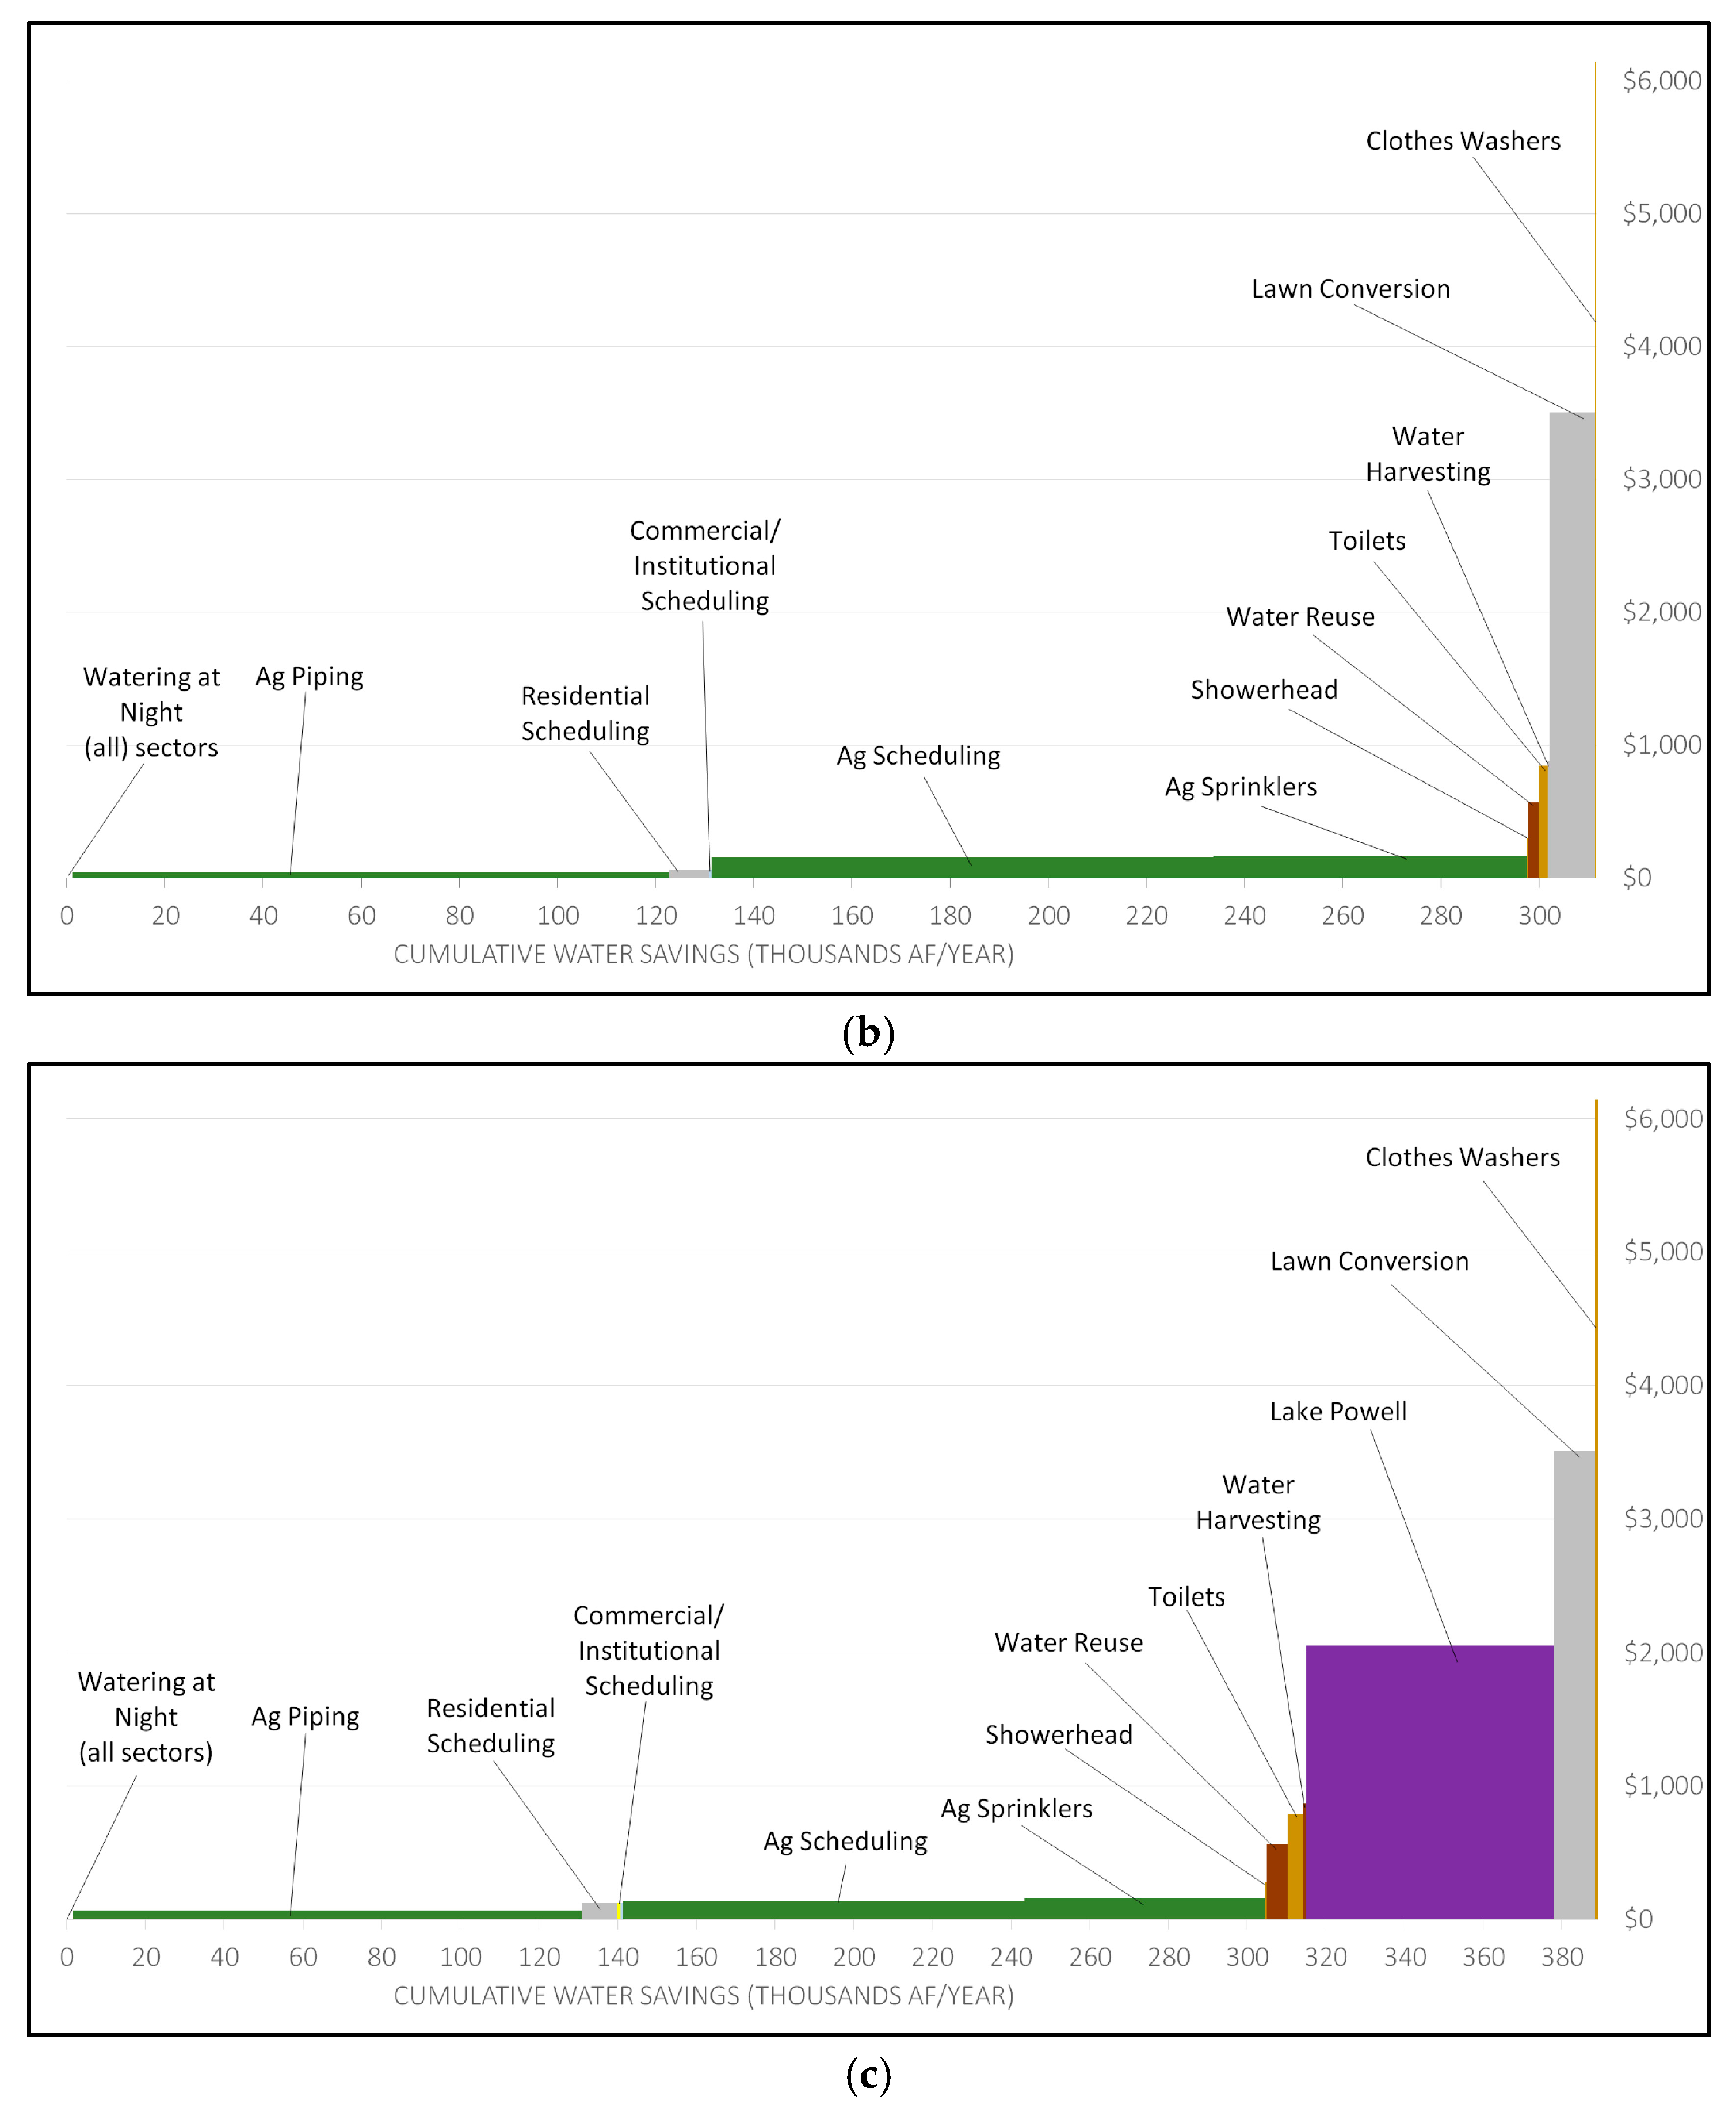
3.7. Water Efficiency Supply Curves
4. Discussion
5. Conclusions
Supplementary Materials
Acknowledgments
Author Contributions
Conflicts of Interest
References
- Chong, H.; Sunding, D. Water markets and trading. Annu. Rev. Environ. Resour. 2006, 31, 239–264. [Google Scholar] [CrossRef]
- Edwards, E.C.; Libecap, G.D. Water institutions and the law of one price. In Handbook on the Economics of Natural Resources; Halvorsen, R., Laytonm, D.F., Eds.; Edward Elgar Publishing: Northhampton, MA, USA, 2015; pp. 442–473. [Google Scholar]
- Brewer, J.; Glennon, R.; Ker, A.; Libecap, G. Presidential address water markets in the West: Prices, trading, and contractual forms. Econ. Inq. 2006, 46, 91–112. [Google Scholar] [CrossRef]
- Libecap, G.D. Institutional path dependence in climate adaptation: Coman’s “some unsettled problems of irrigation”. Am. Econ. Rev. 2011, 101, 64–80. [Google Scholar] [CrossRef]
- Grafton, R.Q.; Libecap, G.D.; Edwards, E.C.; O’Brien, R.B.; Landry, C. Comparative assessment of water markets: Insights from the Murray–Darling Basin of Australia and the Western USA. Water Policy 2012, 14, 175–193. [Google Scholar] [CrossRef]
- Office of Legislative Research and General Counsel (OLRGC). How Utah Water Works: An Overview of Sources, Uses, Funding, and Pricing. Utah Legislature Briefing Paper 2012. Available online: https://le.utah.gov/interim/2012/pdf/00002706.pdf (accessed on 26 February 2016).
- Granade, H.C.; Creyts, J.; Derkach, A.; Farese, P.; Nyguist, S.; Ostrowski, K. Unlocking Energy Efficiency in the U.S. Economy; McKinsey & Company: New York, NY, USA, 2009. [Google Scholar]
- Addams, L.; Boccaletti, G.; Kerlin, M.; Stuchtey, M. Charting Our Water Future: Economic Frameworks to Inform Decision-Making; 2030 Water Resources Group, McKinsey & Company: New York, NY, USA, 2009. [Google Scholar]
- Gleick, P.H.; Wolff, G.H.; Cushing, K.K. Waste Not, Want Not: The Potential for Urban Water Conservation in California; Pacific Institute for Studies in Development, Environment, and Security: Oakland, CA, USA, 2003. [Google Scholar]
- Ward, F.A.; Pulido-Velazquez, M. Water conservation in irrigation can increase water use. Proc. Natl. Acad. Sci. USA 2008, 105, 18215–18220. [Google Scholar] [CrossRef] [PubMed]
- Blum, A. Effective use of water (EUW) and not water-use efficiency (WUE) is the target of crop yield improvement under drought stress. Field Crops Res. 2009, 112, 119–123. [Google Scholar] [CrossRef]
- Seckler, D.; Molden, D.; Sakthivadivel, R. The concept of efficiency in water resources management and policy. In Water Productivity in Agriculture: Limits and Opportunities for Improvement; Seckler, D., Molden, D., Sakthivadivel, R., Eds.; Comprehensive Assessment of Water Management in Agriculture Series 2003; International Water Management Institute (IWMI): Colombo, Sri Lanka, 2003; pp. 37–51. [Google Scholar]
- Mohadjer, P. Residential Ultra-Low-Flush Toilet Replacement Program. Jordan Valley Water Conservancy District Report. West Jordan, UT, USA, 2003. Available online: http://www.cuwcc.org/Portals/0/Jordan%20Valley%20UFT%20Study%20030722.pdf (accessed on 3 April 2016).
- Mayer, P.W.; DeOreo, W.B.; Opitz, E.M.; Kiefer, J.C.; Davis, W.Y.; Dziegielewski, B.; Nelson, J.O. Residential End Uses of Water. American Water Works Association and AWWA Research Foundation Report. 1999. Available online: http://www.waterrf.org/PublicReportLibrary/RFR90781_1999_241A.pdf (accessed on 31 March 2016).
- DeOreo, W.B.; Mayer, P.; Dziegielewski, B.; Kiefer, J. Residential End Uses of Water, Version 2. Water Research Foundation, 2016. Available online: http://www.waterrf.org/4309 (accessed on 12 October 2016).
- Greene, B.; Mesner, N.; Brain, R. Rain Barrels in Utah; Utah State University Extension Sustainability Research Report; Utah State University: Logan, UT, USA, 2015; Available online: https://extension.usu.edu/waterquality/files-ou/Publications/Rainwater-Barrels-in-Utah-v-FINAL.pdf (accessed on 28 March 2016).
- American Community Survey (ACS). ACS 2010 (5-Year Estimates). U.S. Census Bureau Data. Available online: www.socialexplorer.com/tables/ACS2010_5yr/R11189913 (accessed on 27 May 2016).
- Utah Division of Water Resources (UDWR). State of Utah Municipal and Industrial Water Supply and Use Studies Summary 2010; Utah Department of Natural Resources Division of Water Resources Report; Utah Division of Water Resources (UDWR): Salt Lake City, USA, 2014.
- Endter-Wada, J.; Hall, A.; Jackson-Smith, D.; Flint, C. Utah’s Water Future: Perspectives on Water Issues in Utah’s Wasatch Range Metropolitan Area. Summary Report of Overall Findings from the iUTAH 2014 Household Survey, iUTAH Technical Report. 2015. Available online: http://data/iutahepscor.org/mdf/reports/SummaryReport-iUTAH2014HouseholdSurvey.pdf (accessed on 1 September 2016).
- Allen, N.; Utah State University Extension, Logan, UT, USA. Personal communication, 2016.
- Haley, M.B.; Dukes, M.D.; Miller, G.L. Residential irrigation water use in Central Florida. J. Irrig. Drain. Eng. 2007, 133, 427–434. [Google Scholar] [CrossRef]
- Sovocool, K.A. Xeriscape Conversion Study Final Report. Southern Nevada Water Authority Report. 2005. Available online: www.snwa.com/assets/pdf/about_reports_xeriscape.pdf (accessed on 27 March 2016).
- Environmental Protection Agency (EPA). Water Efficiency in the Commercial and Institutional Sector: Considerations for a WaterSense Program. Environmental Protection Agency Report; 2009. Available online: www3.epa.gov/watersense/docs/ci_whitepaper.pdf (accessed on 3 April 2016). [Google Scholar]
- Stonely, T.; Short, K.; Suflita, M.; Barrus, R.; Williams, J.; Smith, G. Water Reuse in Utah. State of Utah Natural Resources, Division of Water Resources Report. 2005. Available online: http://slco.org/WorkArea/DownloadAsset.aspx?id=2147520604 (accessed on 5 April 2016).
- Li, Y. Analysis of Urban Water Use and Urban Consumptive Water Use in Nebraska-Case Study in the City of Lincoln, Grand Island and Sidney. Master’s Thesis, University of Nebraska-Lincoln, Lincoln, NE, USA, 2013. [Google Scholar]
- Crook, J. Innovative Applications in Water Reuse and Desalination. Water Reuse Association Report. 2007. Available online: watereuse.org/wp-content/uploads/2015/10/WRA-103.pdf (accessed on 9 April 2016).
- United States Agricultural Census. State Summary Highlights. Volume 1, Chapter 2; 2012. Available online: www.agcensus.usda.gov/Publications/2012/Full_Report/Volume_1,_Chapter_2_US_State_Level/st99_2_001_001.pdf (accessed on 31 March 2016). [Google Scholar]
- United States Geological Survey (USGS). Water Use Data [Online Dataset]. 2012. Available online: waterdata.usgs.gov/ut/nwis/water_use (accessed on 1 August 2016). [Google Scholar]
- Burt, C.M.; Clemmens, A.J.; Bliesner, R.; Merriam, J.L.; Hardy, L. Selection of Irrigation Methods for Agriculture; American Society of Civil Engineers: Reston, VA, USA, 2000. [Google Scholar]
- Wamsley, N.; Store manager, Valley Implement, Logan, UT, USA. Personal communication, 2016.
- Scherer, T. Planning to Irrigate: A Checklist; North Dakota State University Extension Service Report: Fargo, ND, USA, 2013. Available online: www.ag.ndsu.edu/publications/crops/planning-to-irrigate-a-checklist (accessed on 15 March 2016).
- Tyson, T.W.; Curtis, L.M. 60 Acre Pivot Irrigation Cost Analysis; Biosystems Engineering Series Timely Information Report BSEN-IRR-08-01; Department of Biosystems Engineering, Auburn University: Auburn, AL, USA, 2008. Available online: www.aces.edu/timelyinfo/BioSysEng/2008/October/BSEN-IRR-08-01.pdf (accessed on 20 December 2016).
- Department of Water Resources (DWR). Fifteen Years of Growth and a Promising Future: The California Irrigation Management Information System. State of California, The Resources Agency, Department of Water Resources Report 1997. Available online: infohouse.p2ric.org/ref/32/31571.pdf (accessed on 20 December 2016).
- Cooley, H.; Christian-Smith, J.; Gleick, P.H. Sustaining California Agriculture in an Uncertain Future. Pacific Institute Report. Oakland, CA, USA, 2009. Available online: pacinst.org/app/uploads/2014/04/sustaining-california-agriculture-pacinst-full-report.pdf (accessed on 7 September 2016).
- Kranz, W.L.; Eisenhauer, D.E.; Retka, M.T. Water and energy conservation using irrigation scheduling with center-pivot irrigation systems. Agric. Water Manag. 1992, 22, 325–334. [Google Scholar] [CrossRef]
- Bureau of Reclamation (BOR). Selected Applications—WaterSMART Water and Energy Efficiency Grants [Online Database]. 2016. Available online: watersmartapp.usbr.gov/WaterSmart/ListProposals (accessed on 6 July 2016). [Google Scholar]
- Utah Division of Water Rights (UDWRi). Canal Companies and Contact Information [Online Data]. 2016. Available online: www.waterrights.utah.gov/canalinfo/canal_owners.asp (accessed on 6 July 2016). [Google Scholar]
- Bowen, Collins & Associates. Bear River Pipeline Concept Report Final. Report Prepared for the Utah Division of Water Resources, Consultant Job No. 233-09-01. 2014. Available online: www.cachecounty.org/water/br.html (accessed on 20 March 2016).
- Utah Board of Water Resources (UBWR). Lake Powell Pipeline: Final Study Report Number 20160502-5386; Final Socioeconomics and Water Resource Economics Study Report; Utah Board of Water Resources (UBWR): Salt Lake City, USA, 2016.
- Utah Governor’s Office of Management and Budget. 2012 Baseline City Population Projections [Online Data]. 2012. Available online: https://jobs.utah.gov/housing/owhlf/documents/GOPB2012BaselineProjections.pdf (accessed on 10 October 2016). [Google Scholar]
- City of Orem. New Tiered Water Rates. Available online: http://www.orem.org/new-tiered-water-rates/ (accessed on 6 October 2016).
- Salt Lake City. Water Rates: July 2016. Available online: http://www.slcdocs.com/utilities/PDF%20Files/UtilityRates/WaterrateswebCurrent.pdf (accessed on 6 October 2016).
- Ogden City. Rates and Discounts. Available online: http://www.ogdenwater.com/utilities-customer-service/rates-and-discounts/ (accessed on 6 October 2016).
- City of St. George. Utility Rates. Available online: https://www.sgcity.org/utilities/utilityrates (accessed on 6 October 2016).
- City of Logan. Resolution 12-36. Available online: http://www.loganutah.org/document_center/Public%20Works/1.12-36%20New%20Water%20Rates.pdf (accessed on 6 October 2016).
- Layton City. Welcome to Layton City. Available online: https://www.laytoncity.org/Downloads/finance/NewResidentInfoPacket.pdf (accessed on 6 October 2016).
- Maupin, M.A.; Kenny, J.F.; Hutson, S.S.; Lovelace, J.K.; Barber, N.L.; Linsey, K.S. Estimated Use of Water in the United States in 2010; US Geological Survey Report 2014, No. 1405; US Geological Survey: Reston, VA, USA, 2014.
- Johnson, R.N.; Gisser, M.; Werner, M. The definition of a surface water right and transferability. J. Law Econ. 1981, 24, 273–288. [Google Scholar] [CrossRef]
- Wurtsbaugh, W.; Miller, C.; Null, S.; Wilcock, P.; Hahnenberger, M.; Howe, F. Impacts of water development on Great Salt Lake and the Wasatch front. Watershed Sciences Faculty Publications 2016, Paper 875. Available online: digitalcommons.usu.edu/wats_facpub/875 (accessed on 1 October 2016).
- Ward, F.A.; King, J.P. Reducing institutional barriers to water conservation. Water Policy 1998, 1, 411–420. [Google Scholar] [CrossRef]
- Neuman, J.C. Beneficial use, waste, and forfeiture: The inefficient search for efficiency in western water use. Environ. Law 1998, 28, 919–1169. [Google Scholar]
- Edwards, E.C.; Cristi, O.; Edwards, G.; Libecap, G.D. An Illiquid Market in the Desert: The Role of Interest Groups in Shaping Environmental Regulation; National Bureau of Economic Research Working Papers, No. w21869; National Bureau of Economic Research: Cambridge, MA, USA, 2016. [Google Scholar]
- Reisner, M. Cadillac Desert: The American West and Its Disappearing Water; Penguin: New York, NY, USA, 1993. [Google Scholar]
- Shapiro, D.L. Can public investment have a positive rate of return? J. Polit. Econ. 1973, 81, 401–413. [Google Scholar] [CrossRef]
- Griffin, R.C. Water Resource Economics: The Analysis of Scarcity, Policies, and Projects, 2nd ed.; The MIT Press: Cambridge, MA, USA, 2016. [Google Scholar]
- Attari, S.Z. Perceptions of water use. Proc. Natl. Acad. Sci. USA 2014, 111, 5129–5134. [Google Scholar] [CrossRef] [PubMed]
- Chesnutt, T.W.; Pekelney, D.M. Urban Water Conservation Implementation Challenges and Opportunities. California Urban Water Agencies Report. Encinitas, California, USA, 2004. Available online: www.cuwa.org/pubs/092304WaterConsImplementationChallenges.pdf (accessed on 6 October 2016).
- The Metropolitan Water District of Southern California (MET). Ultra-Low Flush Toilet Program 1999 Residential Customer Satisfaction Survey. 1999. Available online: www.allianceforwaterefficiency.org/WorkArea/DownloadAsset.aspx?id=850 (accessed on 31 March 2016).
- California Utilities Statewide Codes and Standards Team (CUSCST). Multi-Head Showers and Lower-Flow Shower Heads: 2013 California Building Energy Efficiency Standards. California Statewide Utility Codes and Standards Program Report. Available online: www.map-testing.com/assets/reports/CA_Statewide%20CodesStandards_2013_CASE_R_Shower_Heads_Sept_2011.pdf (accessed on 31 March 2016).
- Kopp, K.; Utah State University Extension, Logan, UT, USA. Personal communication, 2016.

| Category | Conservation Measures |
|---|---|
| Residential Indoor | Low-flow toilets |
| Low-flow showers | |
| High-efficiency clothes washers | |
| Residential Outdoor | Rainwater harvesting |
| Watering at night | |
| Irrigation scheduling | |
| Partial turf conversion | |
| Commercial | Landscape watering at night |
| Landscape irrigation scheduling | |
| Wastewater | Secondary wastewater irrigation |
| Agriculture | Conversion to sprinkler irrigation |
| Improved irrigation efficiency | |
| Canal piping | |
| Development | Bear River Development |
| Lake Powell Pipeline |
| Type of Replacement | Number Replaced | Acre-Feet (AF) Conserved | Average Cost per Acre-Foot (AF) |
|---|---|---|---|
| Toilets | 1,361,984 | 41,667 | $673 |
| Showers | 371,424 | 5693 | $241 |
| Washing Machines | 375,424 | 4804 | $6145 |
| Conservation Measure | AF Conserved | Average Cost per AF |
|---|---|---|
| Rainwater Harvesting | 11,886 | $482 |
| Watering at Night | 12,666 | $0 |
| Seasonal Scheduling | 90,335 | $109 |
| Turf Conversion | 104,708 | $3508 |
| Project | Annual AF | Capital Cost | Maintenance | Net Power | Environ. Mitigation | Cost per AF |
|---|---|---|---|---|---|---|
| Lake Powell (Low) | 62,996 | $1163 M | $93 M | $37 M | $75 M | $1414 |
| Lake Powell (High) | 62,996 | $1798 M | $143 M | $108 M | $560 M | $2697 |
| Bear River B | 220,000 | $1682 M | $133 M | $97 M | $801 M | $803 |
| Bear River M | 220,000 | $1823 M | $144 M | $97 M | $117 M | $646 |
| Eastern | Northern | Southwestern | Utah | |||||
|---|---|---|---|---|---|---|---|---|
| Technology | Cost | Savings | Cost | Savings | Cost | Savings | Cost | Savings |
| Resident. night | $0 | 1123 | $0 | 10,278 | $0 | 1266 | $0 | 12,666 |
| Commer. night | $0 | 22 | $0 | 451 | $0 | 52 | $0 | 525 |
| Instit. night | $0 | 35 | $0 | 725 | $0 | 83 | $0 | 844 |
| Ag piping | $44 | 121,474 | $74 | 208,478 | $70 | 129,474 | $58 | 459,425 |
| Resident. schedule | $65 | 8007 | $112 | 73,301 | $126 | 9028 | $109 | 90,335 |
| Commer. schedule | $65 | 215 | $112 | 4392 | $126 | 505 | $111 | 5112 |
| Instit. schedule | $65 | 345 | $112 | 7054 | $126 | 811 | $111 | 8211 |
| Ag schedule | $156 | 102,283 | $158 | 145,011 | $142 | 102,056 | $153 | 349,351 |
| Ag sprinklers | $168 | 64,013 | $171 | 122,070 | $160 | 61,130 | $167 | 247,213 |
| Showers | $303 | 239 | $233 | 4891 | $283 | 562 | $241 | 5693 |
| Rain barrels | $879 | 345 | $442 | 10,777 | $870 | 764 | $482 | 11,886 |
| Water reuse | $568 | 2158 | $568 | 61,972 | $568 | 5042 | $568 | 69,173 |
| Toilets | $847 | 1751 | $651 | 35,798 | $789 | 4116 | $673 | 41,667 |
| Bear River | $724 | 220,000 | $724 | 220,000 | ||||
| Lake Powell | $2055 | 62,996 | $2055 | 62,996 | ||||
| Turf conversion | $3508 | 9281 | $3508 | 84,963 | $3508 | 10,464 | $3508 | 104,708 |
| Washers | $6145 | 254 | $6145 | 3993 | $6145 | 557 | $6145 | 4804 |
| Total | 311,545 | 994,153 | 388,908 | 1,694,608 | ||||
| County (Water Rate City) | Water Use (AF per Person) | Urban Rate per AF | Population 2010 | Population 2060 | Added Demand 2060 1 (AF) |
|---|---|---|---|---|---|
| Utah (Orem) | 0.24 | $296 | 516,564 | 1,398,074 | 215,343 |
| Salt Lake (Salt Lake City) | 0.24 | $434 | 1,029,655 | 1,812,891 | 187,964 |
| Weber (Ogden) | 0.29 | $638 | 231,236 | 449,053 | 62,331 |
| Cache (Logan) | 0.29 | $378 | 112,656 | 273,817 | 46,798 |
| Davis (Layton) | 0.26 | $98 | 306,479 | 503,985 | 51,778 |
| Washington (St. George) | 0.37 | $67 | 138,115 | 581,731 | 164,307 |
© 2017 by the authors. Licensee MDPI, Basel, Switzerland. This article is an open access article distributed under the terms and conditions of the Creative Commons Attribution (CC BY) license ( http://creativecommons.org/licenses/by/4.0/).
Share and Cite
Edwards, E.C.; Bosworth, R.C.; Adams, P.; Baji, V.; Burrows, A.; Gerdes, C.; Jones, M. Economic Insight from Utah’s Water Efficiency Supply Curve. Water 2017, 9, 214. https://doi.org/10.3390/w9030214
Edwards EC, Bosworth RC, Adams P, Baji V, Burrows A, Gerdes C, Jones M. Economic Insight from Utah’s Water Efficiency Supply Curve. Water. 2017; 9(3):214. https://doi.org/10.3390/w9030214
Chicago/Turabian StyleEdwards, Eric C., Ryan C. Bosworth, Patrick Adams, Viviane Baji, Amberlee Burrows, Coleman Gerdes, and Michelle Jones. 2017. "Economic Insight from Utah’s Water Efficiency Supply Curve" Water 9, no. 3: 214. https://doi.org/10.3390/w9030214
APA StyleEdwards, E. C., Bosworth, R. C., Adams, P., Baji, V., Burrows, A., Gerdes, C., & Jones, M. (2017). Economic Insight from Utah’s Water Efficiency Supply Curve. Water, 9(3), 214. https://doi.org/10.3390/w9030214