Abstract
Most European riverine ecosystems suffer from the negative influence of impoundments on flow regime. Downstream effects of dams lead to a number of environmental and socioeconomic risks and, therefore, should be thoroughly examined in specific contexts. Our study aims to quantify the downstream effects of the Siemianówka Reservoir (Upper Narew, Poland), using statistical analysis of key elements of the river’s flow regime, such as the flow duration and recurrence of floods and droughts. In a comparative study on control catchments not influenced by impoundments (the Supraśl and Narewka Rivers), we revealed the following downstream effects of the analyzed dam: significant shortening of spring floods, reduction of the duration and depth of summer droughts, decrease of the maximum discharge, and homogenization of the discharge hydrographs. Although we determined a significant decrease in the duration of summer floods in the “before” and “after” dam function periods, we showed that this issue is regional, climate-related, and replicated in control catchments, rather than an evident downstream effect of the dam. We conclude that significant hydrological downstream effects of the Siemianówka dam–reservoir system could have been the main driver inducing the deterioration of the anastomosing stretch of the Narew River downstream of the dam.
1. Introduction
The vast majority of rivers in the northern hemisphere have been segmented by dams, which poses the risk of significant deterioration of downstream riverine and riparian ecosystems [1]. The influence of dams on river systems is reportedly several times greater than, for example, the influence of climate change [2]; therefore, the analysis of downstream effects of dams (reservoirs) remains an important issue in international scientific literature [3,4,5]. Based on the modification of river discharge on an hourly and daily basis, seasonal changes of flow regimes [6,7], and water temperature modification [8] in impounded rivers, dams can be considered a key element affecting the hydrology of downstream reaches of rivers.
Dams negatively influence all elements of riverine ecosystems. First and foremost, downstream effects of dams induce sediment transport and river channel sedimentation/erosion balance [9]. Changes of the river channel caused by sediment trapping by dams and reservoirs affect the distribution of flow velocities and induce incisions in river channels [10]. Changed water exchange and in-stream biogeochemical cycles affect the water quality of impounded rivers [11]. The changes in the longitudinal connectivity of river reaches and unstable flow regime and water temperature affect fish communities [12,13]. The alteration of the river baseflow due to the operation of the dam negatively affects macroinvertebrate communities by changing their trophic structure [14]. The changed flow regime, including modified inundation periods and seasons, also affects the riparian vegetation [15]. Complex interactions of riverine ecohydrological processes affected by dams need to be addressed in river management strategies [16] because observed and documented downstream effects of dams influence the broad spectrum of the anthroposphere, challenging livelihoods and economies [17].
Large dams have significant downstream effects [3,4,13,16,18,19,20] and are thus more frequently studied than small ones [8,21]. However, small- and medium-sized dams and associated reservoirs influence the vast majority of the world’s rivers [1]. The role of these dams in shaping the global environment remains widespread and locally critical.
In Europe, north-east Poland is known for its high environmental awareness; the area is home to four national parks, five landscape parks, and multiple environmental reserves. Nearly 56% of the area of the Podlaskie Voivodeship province—the highest rate among all regions of the country—is covered under the EU environmental conservation program Natura 2000. The cultural landscape, consisting of a mixture of agricultural land, forests, wetlands, and settlements, is called the “Green Lungs” of Poland. The core of this unique region is the Narew River, which remains the backbone of local agricultural and environmental issues. Part of the middle reach of the Narew River formed the continent’s unique anastomosing system of river branches [22,23], which was the main reason for establishing a national park in this region. The uppermost reach of the Narew River was dammed in 1990 when the Siemianówka Reservoir (SR) was constructed. Since then, specific studies have revealed changes in discharge and water-level dynamics [24,25,26,27,28] and biodiversity [29,30,31,32] of the riverine ecosystem. These changes have been attributed to the SR. Some observed biogeochemical changes in the downstream anastomosing river system have also been attributed to the dam [33]. The most recent negative hydrological and geomorphological changes of the anastomosing stretch of the Narew River are thought to be accelerated by the downstream effects of the SR [23]. However, no comprehensive long term data-supported hydrological research on the downstream effects of the SR has been conducted so far.
A dataset of more than 20 years of hydrological discharge data for the Narew River after the SR was established is available. Therefore, we aim to conduct a data-based and statistically supported assessment of the river’s flow regime based on comparative before–after control–impact comparisons. We investigated the impact of the reservoir construction on the flow regime of downstream reaches of the Narew River. Statistical analyses of the precipitation pattern, daily discharge records (minimum, maximum, 1st, 2nd, and 3rd quartile), and occurrence and recurrence of floods and droughts were conducted for two different time periods: 1951–1989 (pre-dam) and 1990–2012 (post-dam). Our study provides hydrological evidence of the influence of the SR downstream of the Narew River; thus, we open new avenues for the interpretation of biological, ecological, hydrological, and geomorphological research.
2. Materials and Methods
2.1. Study Area
The study area, the Upper Narew Catchment (NE Poland), is the sub-catchment of the largest Polish river basin, namely, the Vistula (Figure 1). The analyzed catchment covers an area of 6656 km2 (of which 17% belongs to Belarus). The region was formed by glacial erosion and accumulation in the Pleistocene. It is characterized by a flat relief with an average elevation of 152 m above sea level.
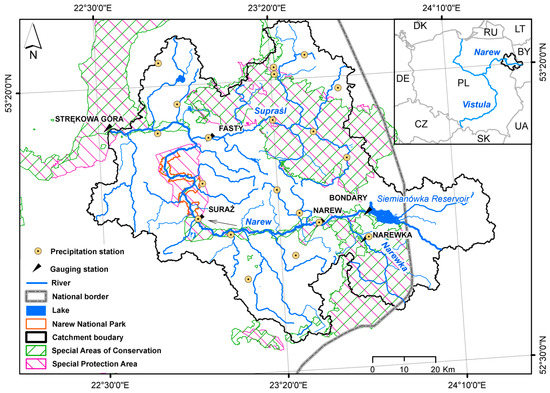
Figure 1.
Case study location: Siemianówka Reservoir (SR) and Upper Narew River Catchment, and location of water gauges used to record the data used for the analysis.
The climate of the Upper Narew Catchment is continental; it is influenced by cold polar air masses originating in Russia and Scandinavia. This is reflected in the mean annual air temperature, which equals 7.1 °C, and annual magnitude of air temperature changes that can reach up to 55 °C according to the data of the Institute of Meteorology and Water Management-National Research Institute (IMGW-PIB). Mean annual sums of precipitation oscillate at about 600 mm. Land cover in the Upper Narew Catchment is dominated by agriculture (53%) with arable lands (39%) and pastures (14%) [34]. Urban and settled areas cover less than 3% of the catchment. Dominant types of soil are pure and loamy sands; very heavy impermeable soils (clay, clay loam, and silt loam) are rare [34]. The topographical setting of the catchment determines the typical lowland character of the river valley, which in primeval conditions was supposed to be exposed to regular and long-lasting inundation, most frequently during the early spring snowmelt season. The rivers of this region of Europe are subject to thaw floods, which are considered to be the most important regular extreme phenomenon shaping riparian wetlands, including the anastomosing channel of the Narew downstream of the SR [22]. Substantially lower rain-event driven floods occur occasionally in the summer season.
The Upper Narew Catchment, being a part of the Narew Basin, is surrounded by multiple environmental protection sites, including national parks and Natura 2000 sites (Birds and Habitat Directive; Figure 1). Among the protected areas in the catchment, the Narew National Park (NNP), Upper Narew Valley Refuge Special Area of Conservation (SAC), and Upper Narew Valley Special Protection Area (SPA) are the most important due to their location in an area downstream of the SR. All three protected areas embrace unique wetland habitats shaped by and dependent on regular inundations.
2.2. Siemianówka Reservoir
The SR has a total capacity of 79.5 million m3 and was created through dam construction in the course of the River Narew, (432 km, measured from the outlet). The first construction started in 1977, whereas the complete filling dates back to 1992 when the SR became entirely operational [35]. The dimensions of the reservoir are as follows: 11 km length, 0.8 to 4.5 km width, 2.5 m mean depth, 7 m maximum depth, and 1050 km2 catchment area. The reservoir and dam were created for multiple purposes including the enhancement of local tourism and recreation, energy production, flood protection, fishing, and irrigation of agricultural lands [36]. According to reservoir management instructions [35], one of the main objectives is to increase the low flow during the summer season in the Narew to maintain biological life, and to mitigate high peak flow to reduce flood risk in the valley during the spring season. Reference catchments used as control sites in our research, that is, from the Narew River down to the Narewka gauge station, and from the Supraśl River down to the Fasty gauge station (Figure 1; Table 1), are located in the same region. Their physiographic features are similar to the analyzed catchment of the Narew River.

Table 1.
Gauge stations in the Upper Narew Catchment. The asterisk ‘*’denotes catchments of major tributaries of the Narew River, which are used as references in this study.
2.3. Hydrometeorological Analysis
This study used daily precipitation records from 20 meteorological stations for the period 1951–2012 for the analysis. Daily flow records for six gauge stations covering different time periods (Table 1) were subjected to a statistical analysis. Both meteorological and hydrological data were acquired from the IMGW-PIB. Whilst four flow gauge stations (Bondary, Narew, Suraża, and Strękowa Góra) are located on the Narew River and are used for direct dam impact assessment, the remainig two (Narewka and Fasty, located on the Narew tributaries and not influenced by the dam) constitute control stations to eliminate potentially wrong inferences due to the climate impact on the flow regime. To assess the significance level of the precipitation trend, the non-parametric Pettitt's test [37] was applied, with a significance level of p ≤ 0.05. This test provides the assessment of the null hypothesis H0, implying that the data are homogeneous throughout the period of observation. Pettitt’s test was reported in the literature to be sufficient for detecting break points in a set of long-term observations [38,39]. In addition, flow-duration analysis was conducted, yielding the annual minimum; maximum; and 25, 50, and 75 percentile discharge for all gauge stations. Statistical analysis of flow data homogeneity based on Pettitt’s test was conducted to indicate significant breakpoints and timescale trends to assess the impact of dam construction on the flow regime.
Additionally, flow-duration curves (FDCs) have been created for every gauge station to express the overall regime change in the analyzed time frame. The FDC is a plot that shows the percentage of time during that discharge in a stream is likely to equal or exceed some specified value of interest. In this study, the flow datasets for each gauge station were divided into two subsets (pre-dam, until 1988; and post-dam, since 1989) for which FDCs were created separately. Finally, temporal patterns of floods and droughts were analyzed. We applied standard thresholds of river discharge assessment, such as the median of the highest annual discharges (MHQ, proxy for a bankfull discharge) and average lowest discharge (ALQ), both from multi-year records, for flood and drought analysis, respectively. The study calculated the number of days with discharge higher than MHQ and lower than ALQ for selected gauge stations to reveal whether the occurrence and recurrence of floods and droughts, that is, extreme hydrological phenomena critical for the functioning and preservation of anastomosing river branches and related biocenoses, have maintained trends similar to pre-establishment of the dam or have changed. For a comprehensive view on the aspect of floods and drought distribution and frequency, we analyzed these phenomena in for all years considered (1951–2013) and separately for summer (May–October) and winter (November–April). In addition, we analyzed floods and droughts of the Narew River for the period from 1975 to 2013 because reference data for the SR were available. This approach allowed us to draw conclusions on the importance of the length of the river discharge dataset with respect to its usefulness for before–after control–impact studies of downstream effects of dams, which has already proven to be a critical issue in downstream effect analysis [40].
3. Results
3.1. Precipitation
The rainfall statistics (Figure 2) based on Pettitt’s test clearly indicate a moderate increasing trend over the last 60 years with some wetter and drier periods. Over the period analysed, no statistically significant differences in monthly sums of precipitation were detected between the results from 20 stations analysed (statistics available in the Supplementary material, Section 1). Average annual precipitation sum within the Upper Narew catchment in the years 1951–2012 equalled 598 mm. The total annual precipitation was slightly higher in 1970–1980 than in 1951–1969 or 1981–2012. This pattern was significantly broken in 2010 due to an extremely wet year with flooding across Poland; however, the pattern appears to be continuing in recent years. This characteristic precipitation pattern is a crucial result, and in addition to dam construction, it needs to be taken into account as a potential key controlling factor with respect to further interpretation of flow regime changes.
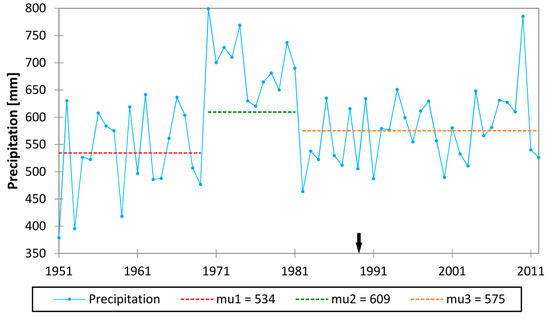
Figure 2.
Total annual precipitation for the time period 1951–2012 in the Upper Narew Catchment. “mu” stands for the average value at each time period. The black arrow indicates the year the SR started operation.
3.2. Discharge
3.2.1. Minimum Discharge
The analysis of the annual minimum discharge pattern based on Pettitt’s test indicated diverse results for each gauge station. No significant trend was detected in the analyzed period for the Fasty (Figure 3A) and Narewka (Figure 3B) gauge stations located on the tributaries of the Narew River, where the influence of the SR on the flow regime was not an issue. In contrast, characteristic trends and breakpoints were noted for gauge stations located along the Narew River. However, due to different occurrence times, the detected trends were most likely driven by varied factors. For the Bondary gauge station (Figure 3C), located immediately downstream of the SR, one significant break point occurred in 1994, indicating an average increase of 60% between the separated time periods. Moving on further downstream of the Narew gauge station (Figure 3D), two significant breakpoints were detected (1971 and 1994). During the first time period (1951–1971), the annual minimum flow was 1.6 m3·s−1, increasing from 1972 to 1993 by 87%, and increasing yet again in 1994–2013 by 17%. The Suraż gauge station (Figure 3E) recorded trends identical to those at Narew but of lower magnitude in the corresponding time periods (an increase of 71% from 1972 to 1993 and of 14% from 1994 to 2013). Whilst the first increase of the annual minimum flow is most likely related to the precipitation increase, as the occurrence of both coincide in time, the latter is most likely due to reservoir operation. The Strękowa Góra gauge station (Figure 3F), which is located in the most downstream part of the catchment seems to reflect only precipitation-driven changes of the minimum flow pattern, which increased from 1972 to 1987 by 55% and decreased by 11% from 1988 to 2012. This indicates that the dam impact subsides at some point of the Narew River between the Suraż and Strękowa Góra gauge stations.
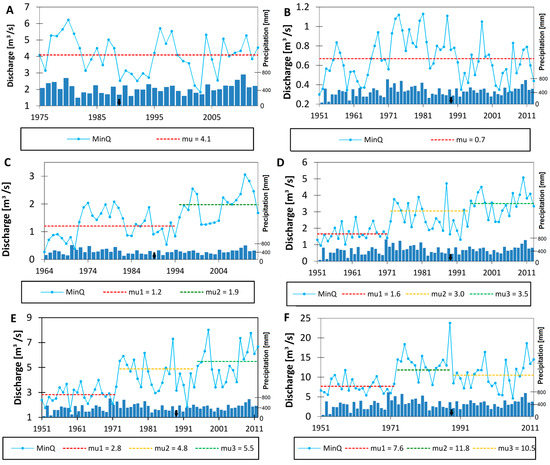
Figure 3.
Annual minimum discharge for selected gauge stations of the Upper Narew Catchment: (A) Fasty, (B) Narewka, (C) Bondary, (D) Narew, (E) Suraż, and (F) Strękowa Góra. “mu” stands for the average value of each time period. The black arrow indicates the year the SR started operation.
3.2.2. First Quartile Discharge
The analysis of the first quartile flow, which represents the median of the lower half of the dataset indicates moderate changes. At the three gauge stations (Fasty, Narewka, and Bondary; Figure 4A–C, respectively), no significant trend was recognized during the analyzed period. In the case of minimum flow, a similar response was observed at the Narew (Figure 4D) and Suraż gauge stations (Figure 4E). An increase occurred in 1970, with rates reaching 71% and 60% at the Narew and Suraż gauge stations, respectively. Taking into account the time of appearance, this correlates with the break point of the precipitation pattern shift observed in 1970. It is similar to the response of the minimum flow pattern, with one major exception: it did not subside after 1980 when the precipitation decreased. Considering changes detected at the Strękowa Góra gauge station (Figure 4F), the flow trends precisely follow the precipitation pattern, increasing at first by 50% in 1972–1987, and finally decreasing by 11%.
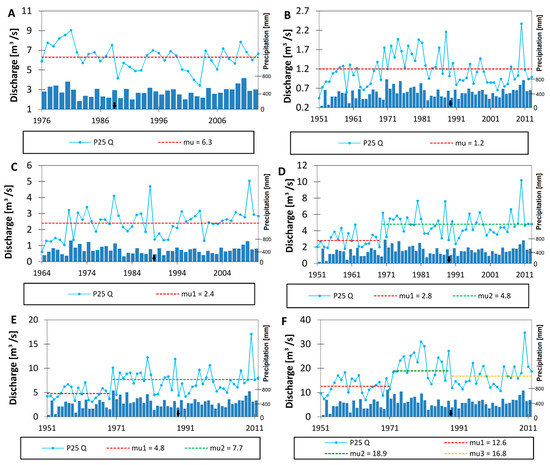
Figure 4.
Annual first quartile discharge for selected gauge stations in the Upper Narew Catchment: (A) Fasty, (B) Narewka, (C) Bondary, (D) Narew, (E) Suraż, and (F) Strękowa Góra. “mu” stands for the average value of each time period. The black arrow indicates the year the SR started operation.
3.2.3. Second Quartile Discharge
The analysis of the second quartile flow, which simply represents the median of the observed dataset, indicated no significant trends for the two gauge stations (Fasty and Bondary; Figure 5A,C). Two characteristic patterns were observed at the remaining gauge stations. First, at the Narewka (Figure 5B) and Strękowa Góra (Figure 5F) gauge stations, we observed two significant breakpoints of the trend reflecting variation in precipitation from 1970 to 1980. Second, at the Narew (Figure 5D) and Suraż (Figure 5E) gauge stations, we observed one significant trend shift in 1970. Regarding the rates of increase, the highest rate was noted at the Narew and Suraż gauge stations (64% and 60%, respectively) and a significantly lower one was detected at the Fasty and Strękowa Góra gauge stations (42% and 34%, respectively). The decreasing trends observed at the latter two gauge stations reached 10%.
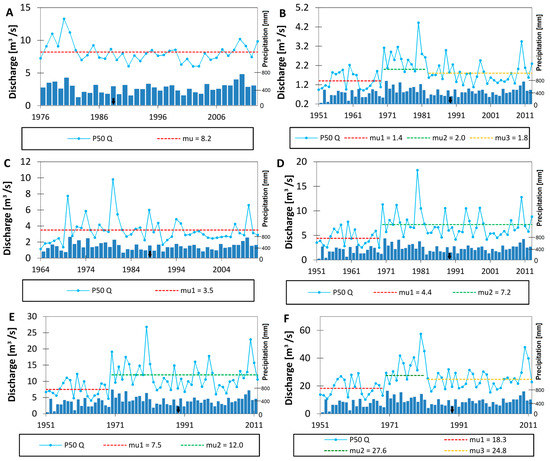
Figure 5.
Annual second quartile discharge for selected gauge stations of the Upper Narew Catchment: (A) Fasty, (B) Narewka, (C) Bondary, (D) Narew, (E) Suraż, and (F) Strękowa Góra. “mu” stands for the average value of each time period. The black arrow indicates the year the SR started operation.
3.2.4. Third Quartile Discharge
The analysis of the third quartile flow, which represents the median of the higher half of the dataset, indicates diverse changes. No significant alteration of the trend during the analyzed period was detected at the three gauge stations (Fasty, Bondary, and Strękowa Góra; Figure 6A,C and F). Identical changes were observed at the Narewka (Figure 6B) and Narew (Figure 6D) gauge stations, accurately reflecting the precipitation pattern, which increases in 1970 (by 42%) and decreases in 1983 (by 15%). The flow pattern at the Suraż gauge station (Figure 6E) seems to have partial fluctuations in precipitation, because the increase date coincides with the time in both cases. However, there is a disagreement in the subsidence seen in total precipitation, which is not visible in the flow alteration noticed around 1980.
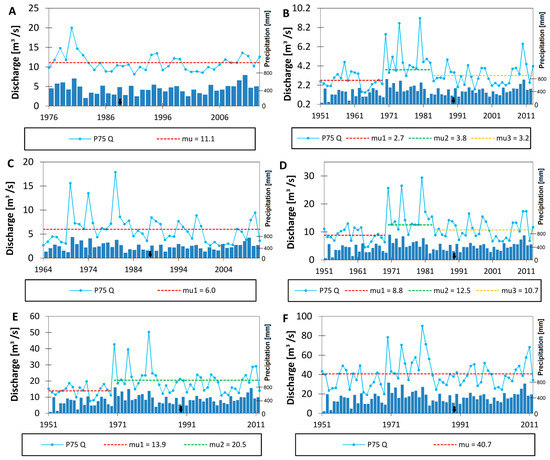
Figure 6.
Annual third quartile discharge for selected gauge stations of the Upper Narew Catchment: (A) Fasty, (B) Narewka, (C) Bondary, (D) Narew, (E) Suraż, and (F) Strękowa Góra. “mu” stands for the average value of each time period. The black arrow indicates the year the SR started operation.
3.2.5. Maximum Discharge
The changes in the annual maximum flow trends in the analyzed period seem to be the most conspicuous. Among the investigated gauge stations, two indicated no significant trend changes (Fasty and Narewka; Figure 7A,B). However, an explicit decrease was noted at the remaining four stations. Although the direction of change is consistent, the time of occurrence differs. This proves that the driving force of such change is not homogenous at all stations. In particular, it is most probable that the shifts occurring in 1988 at the Bondary (Figure 7C), Narew (Figure 7D), and Suraż (Figure 7E) gauge stations are caused by the dam construction. A substantial decrease was detected in all cases, reaching 67%, 52% and 33% at the aforementioned gauge stations, respectively. Although the decrease (by 43%) was also noted at the Strękowa Góra gauge station (Figure 7F), the time of the breakpoint occurrence (1983) suggests that it is most likely driven by precipitation decrease.
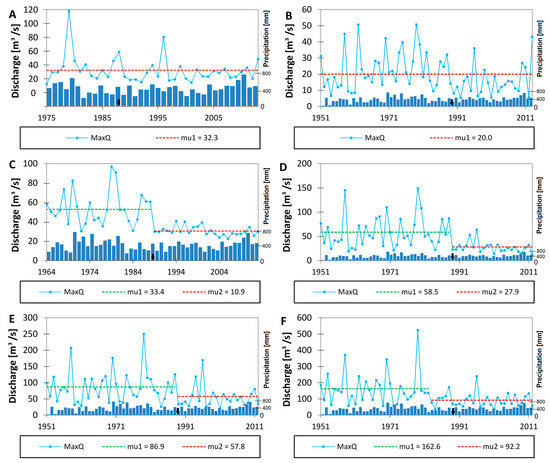
Figure 7.
Annual maximum discharge for selected gauge stations of the Upper Narew Catchment: (A) Fasty, (B) Narewka, (C) Bondary, (D) Narew, (E) Suraż, and (F) Strękowa Góra. “mu” stands for the average value of each time period. The black arrow indicates the year the SR started operation.
3.3. Flow-Duration Curve
The results indicating the change in the FDC prove the undeniable impact of reservoir construction on the flow regime of the Narew River. The alterations at the Fasty (Figure 8A) and Narewka (Figure 8B) gauge stations exclusively reflect climate-driven changes because both are located at the Narew tributaries, which are not impacted by the dam construction. Figure 8A,B show that the shape of the curve remains similar during pre- and post-dam periods; only a regular shift (overall decrease) in magnitude is detected in all exceedance probability intervals. In contrast, such a shift does not occur for gauge stations located directly on the Narew River (Figure 8C–F). Instead, a flattening of the curve is observed at all gauge stations during the post-dam period, leading to varying intersections of the curves at different exceedence probability points. The response is homogenous at all gauges, indicating that the daily streamflow decreases in the lower percentiles (i.e., higher flow) and increases in the higher percentiles (i.e., lower flow). Moving from upstream (Bondary) to downstream (Strękowa Góra), the magnitude of change seems to decline gradually, whereas the curve intersections shift to lower percentiles.
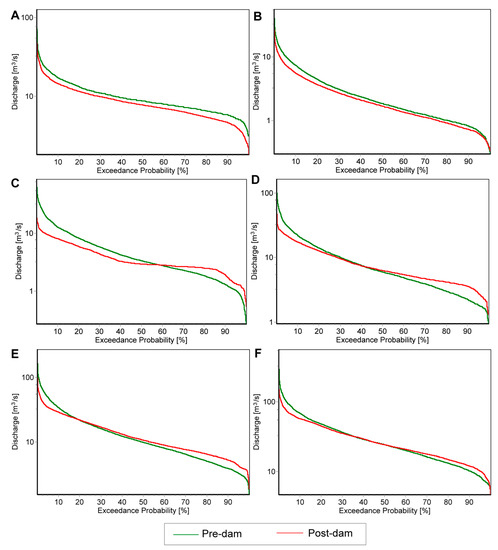
Figure 8.
The changes in FDCs at selected gauge stations of the Upper Narew Catchment: (A) Fasty, (B) Narewka, (C) Bondary, (D) Narew, (E) Suraż, and (F) Strękowa Góra. The discharge is presented on a logarithmic scale.
3.4. Ocurrence and Recurrence of Floods and Droughts in Different Seasons
The analysis of temporal trends of floods and droughts revealed significant changes in the ocurrence and recurrence of these extreme phenomena (Figure 9 and Figure 10). In the period “before” the SR was established, the frequency of years without flooding (daily average discharge higher than MHQ) reached only 0.1 (floods did not occur in 4 out of 39 analyzed years). In the period “after” the SR was established, the frequency of years without flooding and higher than the applied threshold reached 0.3 (floods did not occur in 7 out of the 23 analyzed years). The longer inundation periods observed in the Narew River Valley in the past, mainly in March and April, which were assessed using records from the Suraż gauge station, are most likely related to the unmanaged flow regime, which is affected by snowmelts and thaws. Although the annual recurrence of floods tends to decrease on the regional scale (a statistically significant decrease was recorded both for Narew in Suraż and the reference catchment Narewka in Narewka; Figure 10G,T), the decrease of the spring thaw flood recurrence and duration is statistically significant only for Narew (Figure 10I,L vs. Figure 10V,Z). This observation leads to the conclusion that the SR has a significant and considerably high influence on the recurrence and duration of floods for the Narew River: (1) the contemporary recurrence of Narew floods on the annual basis is 34% lower than before the SR was established; and (2) the contemporary duration of spring thaw floods declines by 56%, from an average of 26 days to 15 days before and after the SR started to operate, respectively.
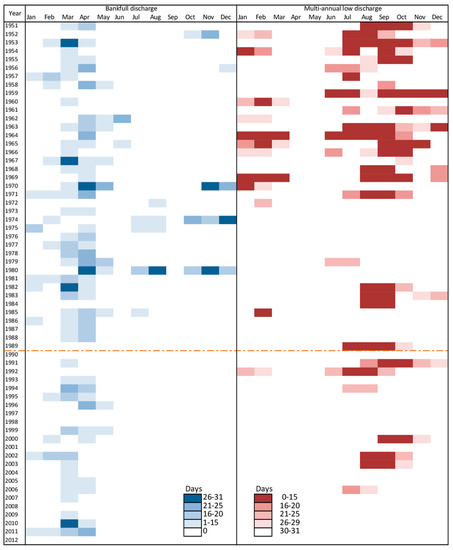
Figure 9.
Matrix presenting the occurrence and duration of floods (blue) and droughts (red) of the Narew River at the Suraż gauge station.
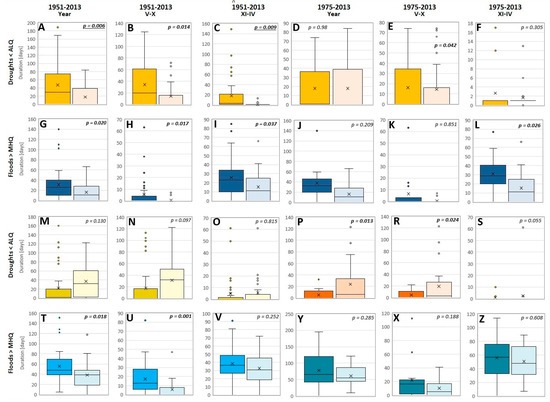
Figure 10.
Comparison of the “before” (1951–1988/1975–1988) and “after” (1989–2013) durations of droughts (Q < ALQ; orange/yellow) and floods (Q > MHQ; blue/dark blue) for Narew–Suraż (A–L), Narewka–Narewka (MNO–TUV), and Supraśl–Fasty (PRS–YXZ). (A–C,G–I,M–O,T–V) represent data from 1951 to 2013. (D–F,J–L,P–S,Y–Z) reflect data from 1975 to 2013.
The detection of a significant difference of the flood duration (decline) in Narewka (reference catchment) between the whole year (Figure 10T) and summer (V-X; Figure 10U) leads to the conclusion that the operation of the SR does not significantly reduce summer flooding. In terms of flooding, the flow regime of the other reference catchment (Supraśl River, Fasty gauge station) does not show significant changes throughout the analyzed years (Figure 10Y–Z). Despite the fact that the recurrence and duration of flooding generally decreases with respect to the whole year from 1951–2013, for both summer–autumn and winter–spring phenomena, the before–after comparison is not statistically significant (p values range from 0.188 to 0.608).
The SR has a completely different influence on the low flow of the Narew River. On the regional scale, the duration and recurrence of droughts lower than the applied threshold tends to significantly increase (e.g., in the reference catchments of Narewka and Supraśl; Figure 10M–O and P–S, respectively). In contrast, both the short- (1975–2013) and long-term (1951–2013) horizon recurrence and duration of droughts decrease in the case of the Narew downstream SR, similar to short-term observations presented by Romanowicz and Osuch [28]. A statistically significant decline of the drought frequency was recorded in summer (May–October; Figure 10B,E), winter, and in the long term (whole year; Figure 10A,C), which is an important downstream effect of the SR. Although no statistical significance was revealed in the case of Narewka when comparing the durations of droughts before and after the establishment of the SR (Figure 10M–O), we observed a significant increase in the recurrence and duration of droughts in the case of the Supraśl River (Figure 10P,R). Discrepancies in the statistical significance of the before–after regime of floods and droughts between short-term (Figure 10D,J) and long-term analyses (Figure 10A,G) prove that using short sets of data to reveal flow regime changes due to dams may lead to wrong interpretations, as also shown by Huh et al. [40]. Different conclusions drawn by Mioduszewski et al. [27] and Cygan et al. [24] confirmed the hypothesis of Huh et al. [40] who stated that the use of too short a series of discharge records may lead to wrong conclusions about the influence of dams on the flow regime of a particular river. Considering the presented data, one can conclude that the reduction of the recurrence and duration of droughts remains the most notable and unilateral downstream effect of the SR on the flow regime of the Narew River. In combination with the interpretation of floods, we conclude that the SR supports the significant homogenization of the Narew River’s discharge, which likely has important consequences for downstream riverine and riparian ecosystems.
4. Discussion
4.1. Hydrological Aspects
The results show that the SR altered the flow regime of the Narew River. Although the influence of the SR operation on the average and median flows is not significant compared with studies of Mioduszewski et al. [27] and Cygan et al. [24], and as presented by Kiczko et al. [26]—strongly depends on the river stretch, we revealed the influence of the SR on the extreme flow of the Narew River. Marcinkowski et al. [23] investigated seasonal changes in water flow and indicated that average flows are lower in April but higher in February and March, which is determined by dam operations, in which water is released from the reservoir in advance of the spring thaw to prevent flooding in municipalities close to the reservoir (see Supplementary material, Section 2).
A temporal precipitation increase recorded in the past (1970–1980) was taken into account in addition to the construction of the SR, as one of the most crucial factors altering the river flow regime, which was also observed by Mioduszewski et al. [27]. The impact of precipitation fluctuations is clearly visible in Figure 5B,F and Figure 6B,D, which show that the temporal increase of the median flow precisely follows the precipitation pattern.
Marcinkowski et al. [41], by means of a hydrological model and nine General Circulation Model–Regional Climate Model (GCM–RCM) runs, evaluated pure effect of climate on water resources for the Upper Narew catchment for the 2020–2050 time horizon. They postulated that the median of projected changes in water yield, i.e., the portion of precipitation that reaches the stream, indicate an average annual increase of 9%. Notably, they observed the most pronounced increase in winter, and a substantially lower increase in other seasons. Given the fact, that the SR controls the release of water, storing most of it during the spring season, the increased flow caused by climate change might be significantly suppressed.
The differences observed for the recurrence and duration of droughts between the Narew River and reference catchments of Narewka and Supraśl may result from land-use changes [28]. However, the aspects of land use in Narew and the analyzed reference catchments are controlled by similar drivers originating from environmental policies (e.g., the Common Agricultural Policy of the EU, responsible for subsidising grassland farming in valuable riparian wetlands). Hence, completely antagonistic trends of the recurrence and duration of droughts of the Narew River compared with control catchments, also reported by Romanowicz and Osuch [28], tend to be a clear flow-regime change attributed to the SR’s operation. This downstream effect of the SR can be considered positive, both from environmental and socioeconomic perspectives. Higher water levels during droughts are likely to prevent desiccation, which may reduce CO2 emissions from drained wetlands in some areas of the valley. However, so far, no links have been found between increasing river water levels during droughts and rising groundwater levels in the valley [27,42], indicating that it may be difficult to mitigate general groundwater decline in the area with an appropriate water spill control from the SR. Hence, the role of the SR in improving downstream habitat quality by decreasing the frequency of deep droughts and increasing the water levels in the river appears to be negligible. On the other hand, the lack of long droughts in recent years could also be considered as less stressful for the riverine ecosystem. One might suspect that if this stress factor occurs repeatedly over time, biota would have to adapt to this phenomenon, and species with higher resistance to this stress factor would become more abundant in the ecosystem. However, so far, not much is known about the role of droughts as an ecosystem stress factor influencing the specific and unique biodiversity of river systems.
The proven and evident reduction of the spring thaw flood duration and frequency that can be attributed to the operation of the SR in the analyzed years along with recent milder winters and less snow accumulation than before [42] can contradict the environmental effects of wetland restoration. Bush encroachment in open areas of Narew Valley wetlands, which was reported to be successfully mitigated by birch removal [43], can continue because lowered and shortened inundation allows the re-establishment of young birch stands and feedbacks with evapotranspiration [44]. Hence, shrub removal, although so far successful and important, appears in this case to be a measure tackling the result of the process rather than affecting the process of bush encroachment itself.
4.2. Hydromorphological Aspects
Results of the reconnection of abandoned side arms and anabranches of the Narew River in the NNP area appear to be contradicted by the operation of the SR as well. Although sidearm reconnection projects implemented in the Narew Valley were reported to have positive environmental effects [45], one could suspect that facing a continuing trend of high flow reduction attributed to the function of the SR, managing appropriate levels of sidearm connectivity to the main river channel in the future will remain a challenging task. In addition to negative responses of biota to river maintenance work performed in the Narew River System [46], flow-regime changes remain an important issue to be addressed in future river management strategies and also within the NNP.
The NNP, located downstream of the SR, has been facing the loss of anabranches in recent decades [23]. It has been recognized that the highly variable flood-prone flow regime characterized by the occurrence of seasonal high discharges is one of the most crucial factors for global anastomosing rivers to persist [47,48]. Frequent or high-magnitude flooding is assumed as a precondition for avulsion and the eventual formation of new channels. The SR-induced decrease of the magnitude and duration of floods can, therefore, be deemed as one of the factors, among others recognized by Marcinkowski et al. [23], speeding up the gradual extinction of the valuable anastomosing character of the Narew River. It is critical to address this issue in any amendments to contemporary water management instructions governing the flow regime of the Narew River.
4.3. Ecological Aspects
Another crucial factor responsible for anabranch loss was reported by Marcinkowski et al. [23] and relates to the uncontrolled expansion of Common Reed (Phragmites australis) in the NNP in recent decades. As reported by Próchnicki [49], the analysis of aerial imagery revealed a two-fold increase of the reed share in the valley vegetation between 1987 and 1997. It was justified by the overall shift in management strategies and cessation of floodplain mowing, which was very popular until 1980 in this region. However, as recognized in other studies, it could also be determined based on water-level changes. These water-level changes could reflect intensification of drainage and land reclamation directly within the river valley, but—noteworthy—could also result from the SR operation. Stromberg et al. [50] stated that aquatic plant species have been observed to increase in association with riverine alterations such as river channelization, stabilized water levels, reduced frequency of inundation, and altered timing of water and sediment flow. Moreover, Galatowitsch et al. [51] showed that the intensive invasion of Phragmites australis in the Platte River (Nebraska, USA) was caused by changes of the natural flow regime after the catchment has been highly altered by water development for irrigation and hydropower production. They stated that rapid expansion of reed followed the significant decrease of the flood flow. Therefore, it is highly probable that the invasion of Common Reed in the NNP, which coincides with the construction of the SR, might be caused by SR-induced flow regime changes, in addition to positive correlations of reed expansion and the cessation of mowing. Reporting downstream effects of the SR on the flow regime of the Narew River, and considering a number of environmental issues examined in the Narew Valley in recent years, similarly to Romanowicz and Osuch [28] we stress that further research is critically needed to reveal the influence of the SR-induced flow regime change on biota and biocoenosis of this area in a site-specific context. Based on the knowledge of the response of riparian environments to reservoir-influenced flow regime changes [1,3,4,6,7,50,51], we stress that keeping the status quo with respect to the regulation of river discharge by the SR can eventually result in irreversible changes of the downstream environment of the Narew River and its valley, such as the deterioration of the main objects of environmental conservation of the NNP related to a functioning anastomosing river channel. Considering the results of Piniewski et al. [52], and given the findings presented in this paper, we also stress that the SR-induced flow regime changes of Narew are likely to be more unilateral and stronger than the ones resulting from prospective climatic changes.
Now that 25 years have passed since the first spill of water was released from the fully filled SR, and given that data-based quantification of the influence of the SR on the Narew River flow regime allows drawing comprehensive and statistically relevant conclusions, the environmental management of the area should anticipate SR-induced flow regime changes of the Narew River. Although not many studies present acceptable solutions allowing functioning dam-reservoir systems and sustaining resilient anastomosing rivers downstream, we hope that our findings will allow other researchers to view environmental factors of the Narew River and its valley with a different perspective. This perspective should emphasize flow-regime alteration as potentially a critical aspect, followed by the response of ecosystems.
4.4. Implications for Management
In view of our results, all considerations concerning instructions for water release and water management in lowland reservoirs, in particular those relating to the SR, gain new meaning and should be revisited. The observations of Kiczko and Napiórkowski [53] and Kiczko et al. [54], addressing the need for anticipation of environmental issues in water management measures implemented at the reservoir, should be used to provide answers to new management questions, such as ‘How should water release from the reservoir be managed in order to keep the level of habitat degradation risk as low as possible?’ and ‘Is optimization of water release possible when limitations originate from both environmental and agricultural requirements?’.
Finally, a possible negative influence of the SR on downstream environments should be revisited in terms of gains and losses. Although the reservoir itself provides new habitats for birds, remains an important local attraction for recreational fishing, and provides some hydropower energy, it is necessary to calculate environmental and socioeconomic benefits and trade-offs of the SR. This calculation should anticipate actions related to environmental restoration in the Narew Valley and declining areas of valuable habitats downstream, because they might result from the negative influence of the downstream effects of the SR. Revealing the full set of benefits and losses associated with the function of the dam is expected to support (economically) decisions on the maintenance of the dam or on its removal in the future. Observing quick and positive responses of river systems to dam removals [5] fosters hope that there is still a chance to preserve Europe’s unique anastomosing system before its complete degradation, which appears to result partly from the operation of the SR, by managing the landscape of the Narew Valley.
5. Conclusions
(1) The SR impact on the flow regime differs among gauge stations and indicators. The most significant and direct change was observed for extreme flow (minimum and maximum) of three subsequent gauges (Bondary, Narew, and Suraż). In each of them, a substantial decrease of high flow and an increase of low flow were detected. The quartile discharge alteration was more blurred and seems to be rather climate change-affected, reflecting precipitation pattern fluctuations.
(2) The SR has a significant and considerable influence on the recurrence and duration of floods of the Narew River: (1) the contemporary recurrence of Narew floods on an annual basis is 34% lower than before the SR was established; and (2) the contemporary duration of spring thaw floods has declined by 56%, from an average of 26 days before to 15 days after the SR has started to operate.
(3) An overall and significant increase in low flow was noted along the course of the Narew River downstream of the SR (in particular, at the Suraż gauge station), while a significant increase in the frequency and duration of droughts was detected in reference catchments of Narewka and Supraśl. However, the role of the SR in improving the quality of downstream riparian habitats tends to be insignificant, because the continuously reported trend of groundwater-level decline in the valley seems not to be reversed once the SR has been established.
(4) The significant change in floods and the flood–drought balance revealed in this study and attributed to the function of the SR poses a great threat with respect to the extinction of anabranches depending on the regular occurrence of high flow. This conclusion needs to be accounted for in the future management of the most valuable anastomosing stretch of the river in the NNP.
(5) The flow regime of rivers in control catchments (Narewka and Supraśl) reflects exclusively temporal changes of precipitation. The flow regime of the Narew River downstream of the SR from 1951 to 2013 presents different dynamics. Flow regime alterations of the Narew River observed for neighboring gauges—that is, the decrease of the duration and extent of spring flooding, increase of low flow, and altered flow durations—can be attributed to the operation of the SR. This observation is contradictory to several previous hydrological studies [24,27], which might have drawn wrong conclusions on the small (or even lack of) influence of the SR on the flow regime of the Narew based on the analysis of too short a data series. However, our observations on the influence of the SR on the flow regime of the Narew River confirm some of the previous suspicions and hypotheses of hydrologists working with limited sets of data [28] and environmentalists tackling biocoenosis of the area [42,55,56].
(6) With respect to the presented conclusions, some changes of riparian and riverine ecosystems of the Narew River and its valley attributed to climate change, land-use modification, or a switch in the role of riparian vegetation in water consumption, and reported in numerous scientific studies, require revision in terms of considering the SR as the dominant factor inducing the flow regime of the Upper Narew River.
Supplementary Materials
The following are available online at www.mdpi.com/2073-4441/9/10/783/s1, Figure S1: Monthly precipitation sum for 20 gauging stations in the Upper Narew catchment, Figure S2: Flow regime in Suraż gauging station 1951–2012. A—1st quartile monthly discharge, B—median monthly discharge, C—3rd quartile monthly discharge, Table S1: T test results of statistical significance of monthly precipitation sum between meteorological stations in the Upper Narew catchment.
Acknowledgments
We would like to thank three anonymous reviewers for their comments and suggestions, which helped to improve the manuscript. The study presented in this paper was financed by the National Science Centre, Poland, under grant number 2015/19/N/ST10/01629.
Author Contributions
Both authors equally contributed to all steps of the data analysis and manuscript preparation.
Conflicts of Interest
The authors declare no conflict of interest.
References
- Dynesius, M.; Nilsson, C. Fragmentation and flow regulation of river systems in the northern third of the world. Science 1994, 266, 753–762. [Google Scholar] [CrossRef] [PubMed]
- Graf, W.L. Dam nation: A geographic census of American dams and their large-scale hydrologic impacts. Water Resour. Res. 1999, 35, 1305–1311. [Google Scholar] [CrossRef]
- Graf, W.L. Downstream hydrologic and geomorphic effects of large dams on American rivers. Geomorphology 2006, 79, 336–360. [Google Scholar] [CrossRef]
- Magilligan, F.J.; Nislow, K.H. Changes in hydrologic regime by dams. Geomorphology 2005, 71, 61–78. [Google Scholar] [CrossRef]
- O’Connor, J.E.; Duda, J.J.; Grant, G.E. 1000 dams down and counting. Science 2015, 348, 496–497. [Google Scholar] [CrossRef] [PubMed]
- Bejarano, M.D.; Sordo-Ward, A.; Alonso, C.; Nilsson, C. Characterizing effects of hydropower plants on sub-daily flow regimes. J. Hydrol. 2017, 550, 186–200. [Google Scholar] [CrossRef]
- Kibler, K.M.; Alipour, M. Flow alteration signatures of diversion hydropower: An analysis of 32 rivers in Southwestern China. Ecohydrology 2017, 10, e1842. [Google Scholar] [CrossRef]
- Maheu, A.; St-Hilaire, A.; Caissie, D.; El-Jabi, N. Understanding the thermal regime of rivers influenced by small and medium size dams in Eastern Canada. River Res. Appl. 2016, 32, 2032–2044. [Google Scholar] [CrossRef]
- Sanyal, J. Predicting possible effects of dams on downstream river bed changes of a Himalayan river with morphodynamic modelling. Quat. Int. 2017, 453, 48–62. [Google Scholar] [CrossRef]
- Williams, G.P.; Wolman, M.G. Downstream Effects of Dams on Alluvial Rivers; Geological Survey Professional Paper 1286; USGS: Washington, DC, USA, 1984. [Google Scholar]
- Ahn, J.M.; Jung, K.Y.; Shin, D. Effects of coordinated operation of weirs and reservoirs on the water quality of the Geum River. Water 2017, 9, 423. [Google Scholar]
- Cooper, A.R.; Infante, D.M.; Wehrly, K.E.; Wang, L.; Brenden, T.O. Identifying indicators and quantifying large-scale effects of dams on fishes. Ecol. Indic. 2016, 61, 646–657. [Google Scholar] [CrossRef]
- Song, Y.; Cheng, F.; Murphy, B.R.; Xie, S. Downstream effects of the Three Gorges Dam on larval dispersal, spatial distribution and growth of the four major Chinese carps call for reprioritizing conservation measures. Can. J. Fish. Aquat. Sci. 2017. [Google Scholar] [CrossRef]
- Valentin, S.; Wasson, J.G.; Philippe, M. Effects of hydropower peaking on epilithon and invertebrate community trophic structure. River Res. Appl. 1995, 10, 105–119. [Google Scholar] [CrossRef]
- Chen, Q.; Zhang, X.; Chen, Y.; Qiongfang, L.; Qiu, L.; Liu, M. Downstream effects of a hydropeaking dam on ecohydrological conditions at subdaily to monthly time scales. Ecol. Eng. 2015, 77, 40–50. [Google Scholar] [CrossRef]
- Han, J.; Zhang, W.; Fan, Y.; Yu, M. Interacting effects of multiple factors on the morphological evolution of the meandering reaches downstream the Three Gorges Dam. J. Geogr. Sci. 2017, 27, 1268–1278. [Google Scholar] [CrossRef]
- Owusu, K.; Obour, P.B.; Nkansah, M.A. Downstream effects of dams on livelihoods of river-dependent communities: The case of Ghana’s Kpong Dam. Geogr. Tidsskr. Dan. J. Geogr. 2016, 117, 1–10. [Google Scholar] [CrossRef]
- Jiang, L.; Ban, X.; Wang, X.; Cai, X. Assessment of hydrologic alteration caused by the Three Gorges Dam in the middle and lower reaches of Yangtze River, China. Water 2014, 6, 1419–1434. [Google Scholar] [CrossRef]
- Lee, J.E.; Heo, J.-H.; Lee, J.; Kim, N.W. Assessment of flood frequency alteration by dam construction via SWAT Simulation. Water 2017, 9, 264. [Google Scholar] [CrossRef]
- Zhang, X.; Dong, Z.; Gupta, H.; Wu, G.; Li, D. Impact of the Three Gorges Dam on the hydrology and ecology of the Yangtze River. Water 2016, 8, 590. [Google Scholar] [CrossRef]
- Mbaka, J.G.; Mwaniki, M.W. A global review of the downstream effect of small impoundments on stream habitat conditions and macroinvertebrates. Environ. Rev. 2015, 23, 257–263. [Google Scholar] [CrossRef]
- Gradziński, R.; Baryła, J.; Doktor, M.; Gmur, D.; Gradziński, M.; Kędzior, A.; Paszkowski, M.; Soja, R.; Zieliński, T.; Żurek, S. Vegetation-controlled modern anastamosing system of the upper Narew River (NE Poland) and its sediments. Sediment. Geol. 2003, 157, 253–276. [Google Scholar] [CrossRef]
- Marcinkowski, P.; Grabowski, R.C.; Okruszko, T. Controls on anastomosis in lowland river systems: Towards process-based solutions to habitat conservation. Sci. Total Environ. 2017, 609, 1544–1555. [Google Scholar] [CrossRef] [PubMed]
- Cygan, B.; Niedbała, J.; Piekarski, M.K. Wpływ Zbiornika Siemianówka na kształtowanie się charakterystyk hydrologicznych rzeki Narwi. In Proceedings of the Conference Materials Zagospodarowanie Zlewni Bugu i Narwi w Ramach Zrównoważonego Rozwoju 2003, Popowo, Poland, 23–24 May 2003. (In Polish). [Google Scholar]
- Jekatierynczuk-Rudczyk, E.; Górniak, A. Influence of Siemianówka Reservoir on Narew River below dam. In Ecosystem of Siemianówka Reservoir in 1990–2004 and its Restoration; Górniak, A., Ed.; Department of Hydrobiology, University of Białystok: Białystok, Poland, 2006; pp. 193–199. (In Polish) [Google Scholar]
- Kiczko, A.; Romanowicz, R.J.; Osuch, M. Impact of water management policy on flow conditions in wetland areas. Phys. Chem. Earth 2011, 36, 638–645. [Google Scholar] [CrossRef]
- Mioduszewski, W.; Gajewski, G.; Biesiada, M. Zróżnicowanie stosunków wodnych w dolinie Narwi w granicach Narwiańskiego Parku Narodowego. Water Environ. Rural Areas 2004, 11, 39–50. (In Polish) [Google Scholar]
- Romanowicz, R.J.; Osuch, M. Assessment of land use and water management induced changes in flow regime of the Upper Narew. Phys. Chem. Earth 2011, 36, 662–672. [Google Scholar] [CrossRef]
- Grabowska, M.; Ejsmont-Karabin, J.; Karpowicz, M. Reservoir-river relationships in lowland, shallow, eutrophic systems: An impact of zooplankton from hypertrophic reservoir on river zooplankton. Pol. J. Ecol. 2013, 61, 759–768. [Google Scholar]
- Grabowska, M.; Mazur-Marzec, H. The effect of cyanobacterial blooms in the Siemianówka Dam Reservoir on the phytoplankton structure in the Narew River. Oceanol. Hydrobiol. Stud. 2011, 40, 19–26. [Google Scholar] [CrossRef]
- Karpowicz, M. Influence of eutrophic lowland reservoir on Crustacean zooplankton assemblages in river valley oxbow lakes. Pol. J. Environ. Stud. 2014, 23, 2055–2061. [Google Scholar]
- Karpowicz, M. Microcrustacean (Cladocera, Copepoda) source-sink dynamics in a lowland river ecosystem with a dam reservoir. Oceanol. Hydrobiol. Stud. 2016, 45, 297–303. [Google Scholar] [CrossRef]
- Banaszuk, P.; Wysocka-Czubaszek, A. Phosphorus dynamics and fluxes in a lowland river: The Narew anastomosing river system, NE Poland. Ecol. Eng. 2005, 25, 429–441. [Google Scholar] [CrossRef]
- Banaszuk, H.; Banaszuk, P.; Gradziński, R.; Kamocki, A.K.; Mioduszewski, W.; Okruszko, T.; Próchnicki, P.; Szewczyk, M. Przyroda Podlasia: Narwiański Park Narodowy; Ekonomia Podlasia: Podlasie, Poland, 2004; ISBN 83-87231-07-X. (In Polish) [Google Scholar]
- BIPROMEL. Siemianówka Reservoir–Water Management Rules; Technical Report; Bipromel: Warszawa, Poland, 1999. (In Polish) [Google Scholar]
- Sokołowski, J. Monografia Zbiornika Wodnego Siemianówka; WZMIUW: Warszawa, Poland, 1999. (In Polish) [Google Scholar]
- Pettitt, A.N. A non-parametric approach to the change-point problem. Appl. Stat. 1979, 28, 126–135. [Google Scholar] [CrossRef]
- Rybski, D.; Neumann, J. A Review on the Pettitt Test. In In Extremis; Kropp, J., Schellnhuber, H.J., Eds.; Springer: Berlin/Heidelberg, Germany, 2011; pp. 202–213. ISBN 978-3-642-14863-7. [Google Scholar]
- Tan, X.; Gan, T.Y.; Shao, D. Effects of persistence and large-scale climate anomalies on trends and change points in extreme precipitation of Canada. J. Hydrol. 2017, 550, 453–465. [Google Scholar] [CrossRef]
- Huh, S.; Dickey, D.A.; Meador, M.R.; Ruhl, K.E. Temporal analysis of frequency and duration of low and high streamflow: Years of record needed to characterise streamflow variability. J. Hydrol. 2005, 310, 78–94. [Google Scholar] [CrossRef]
- Marcinkowski, P.; Piniewski, M.; Kardel, I.; Szcześniak, M.; Benestad, M.; Srinivasan, R.; Ignar, S.; Okruszko, T. Effect of Climate Change on Hydrology, Sediment and Nutrient Losses in Two Lowland Catchments in Poland. Water 2017, 9, 156. [Google Scholar] [CrossRef]
- Banaszuk, P.; Kamocki, A. Effects of climatic fluctuations and land-use changes on the hydrology of temperate fluviogenous mire. Ecol. Eng. 2008, 32, 133–146. [Google Scholar] [CrossRef]
- Kamocki, A.; Kołos, A.; Banaszuk, P. Can we effectively stop the expansion of trees on wetlands? Results of a birch removal experiment. Wetl. Ecol. Manag. 2016, 25, 359–367. [Google Scholar] [CrossRef]
- Grygoruk, M.; Batelaan, O.; Mirosław-Świątek, D.; Szatyłowicz, J.; Okruszko, T. Evapotranspiration of bush encroachments on a temperate mire meadow—A nonlinear function of landscape composition and groundwater flow. Ecol. Eng. 2014, 73, 598–609. [Google Scholar] [CrossRef]
- Deoniziak, K.; Hermaniuk, A.; Wereszczuk, A. Effects of wetland restoration on the amphibian community in the Narew River Valley (Northeast Poland). Salamandra 2017, 53, 50–58. [Google Scholar]
- Grygoruk, M.; Frąk, M.; Chmielewski, A. Agricultural rivers at risk: Dredging results in a loss of macroinvertebrates. Preliminary observation from the Narew Catchment, Poland. Water 2015, 7, 4511–4522. [Google Scholar] [CrossRef]
- Nanson, G.C.; Knighton, A.D. Anabranching rivers: Their cause. character and classification. Earth Surf. Process. Landf. 1996, 21, 217–239. [Google Scholar] [CrossRef]
- Schumann, R.R. Morphology of Red Creek, Wyoming, an arid-region anastomosing channel system. Earth Surf. Process. Landf. 1989, 14, 277–288. [Google Scholar] [CrossRef]
- Próchnicki, P. The expansion of common reed (phragmites australis (cav.) trin. ex steud.) in the anastomosing river valley after cessation of agriculture use (Narew River valley, NE Poland). Pol. J. Ecol. 2005, 53, 353–364. [Google Scholar]
- Stromberg, J.C.; Lite, S.J.; Marler, R.; Paradzick, C.; Shafroth, P.B.; Shorrock, D.; White, J.M.; White, M.S. Altered stream-flow regimes and invasive plant species: The Tamarix case. Glob. Ecol. Biogeogr. 2007, 16, 381–393. [Google Scholar] [CrossRef]
- Galatowitsch, S.M.; Larson, D.L.; Larson, J.L. Factors affecting post-control reinvasion by seed of an invasive species, Phragmites australis, in the central Platte River, Nebraska. Biol. Invasions 2016, 18, 2505–2516. [Google Scholar] [CrossRef]
- Piniewski, M.; Laize, C.L.R.; Acreman, M.; Okruszko, T.; Schneider, C. Effects of climate change on environmental flow indicators in the Narew Basin, Poland. J. Environ. Qual. 2011, 43, 155–167. [Google Scholar] [CrossRef] [PubMed]
- Kiczko, A.; Napiórkowski, J. Aspiration-Reservation Decision Support System fo Siemianówka Reservoir. In Modelling of Hydrological Processes in the Narew Catchment; Springer: Berlin, Germany, 2011; pp. 111–121. [Google Scholar]
- Kiczko, A.; Romanowicz, R.; Napiórkowski, J.; Piotrowski, A. Integration of reservoir management and flow routing model—Upper Narew Case Study. Publ. Inst. Geophys. Pol. Acad. Sci. 2008, E-9, 41–56. [Google Scholar]
- Pugacewicz, E. Zmiany w awifaunie lęgowej doliny Górnej Narwi w latach 1986–2007. Dubelt 2012, 4, 1–41. (In Polish) [Google Scholar]
- Szewczyk, M.; Dembek, W.; Kamocki, A. Response of Riparian vegetation to the decrease of flooding: Narew National Park, Poland. In Proceedings of the International Conference ‘Towards Natural Flood Reduction Strategies’, Warsaw, Poland, 6–13 September 2003; Available online: http://www.academia.edu/download/36018017/3_9l.pdf (accessed on 2 August 2017).
© 2017 by the authors. Licensee MDPI, Basel, Switzerland. This article is an open access article distributed under the terms and conditions of the Creative Commons Attribution (CC BY) license (http://creativecommons.org/licenses/by/4.0/).