
Evaluating Water Supply Risk in the Middle and Lower Reaches of Hanjiang River Basin Based on an Integrated Optimal Water Resources Allocation Model


 ,
, 
Abstract
:
1. Introduction
2. Study Region and Data
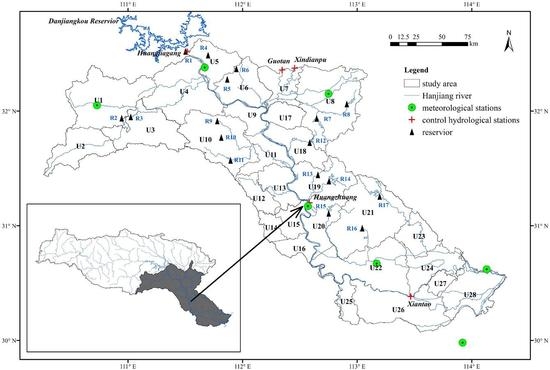
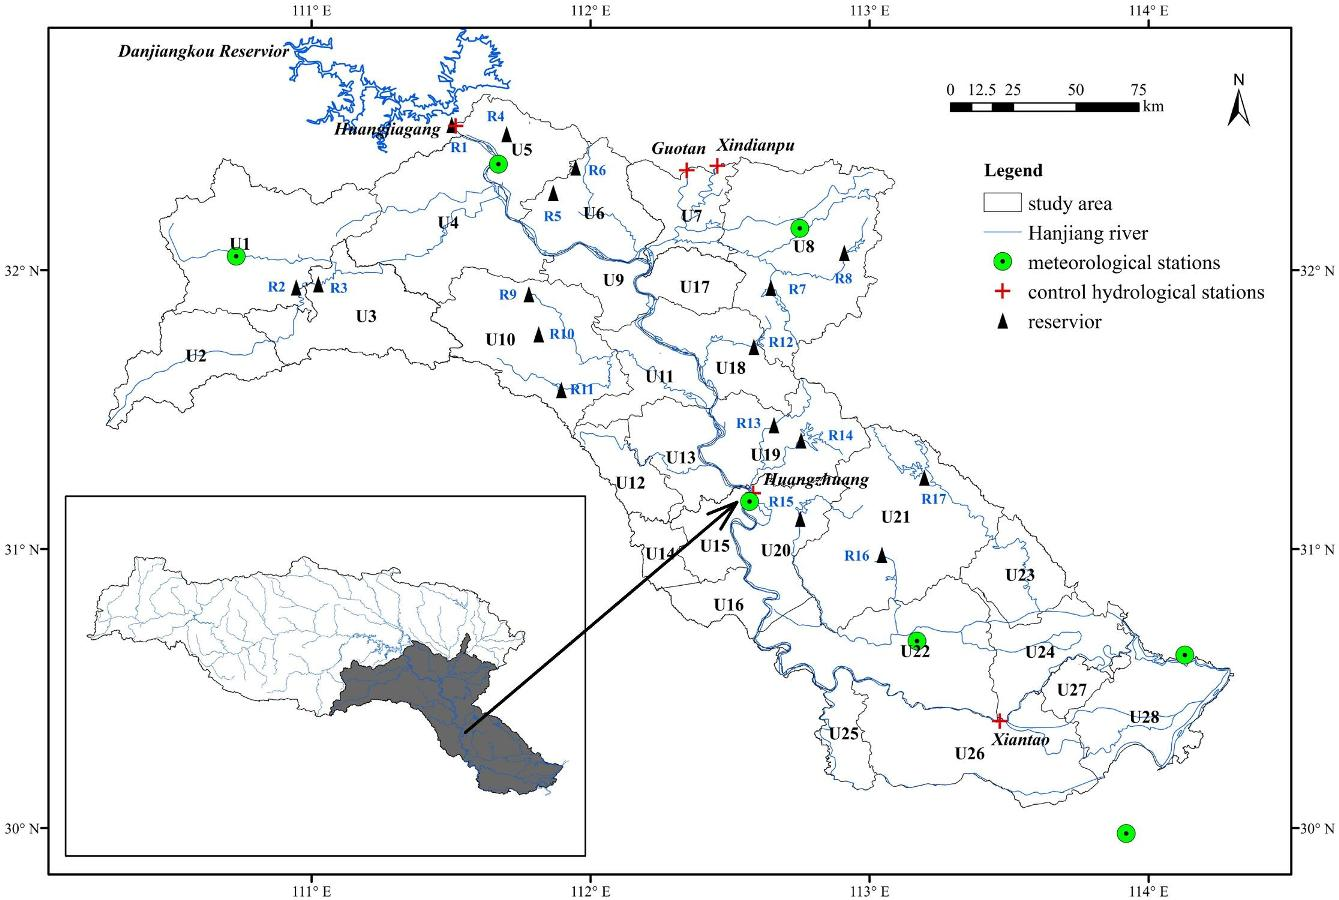
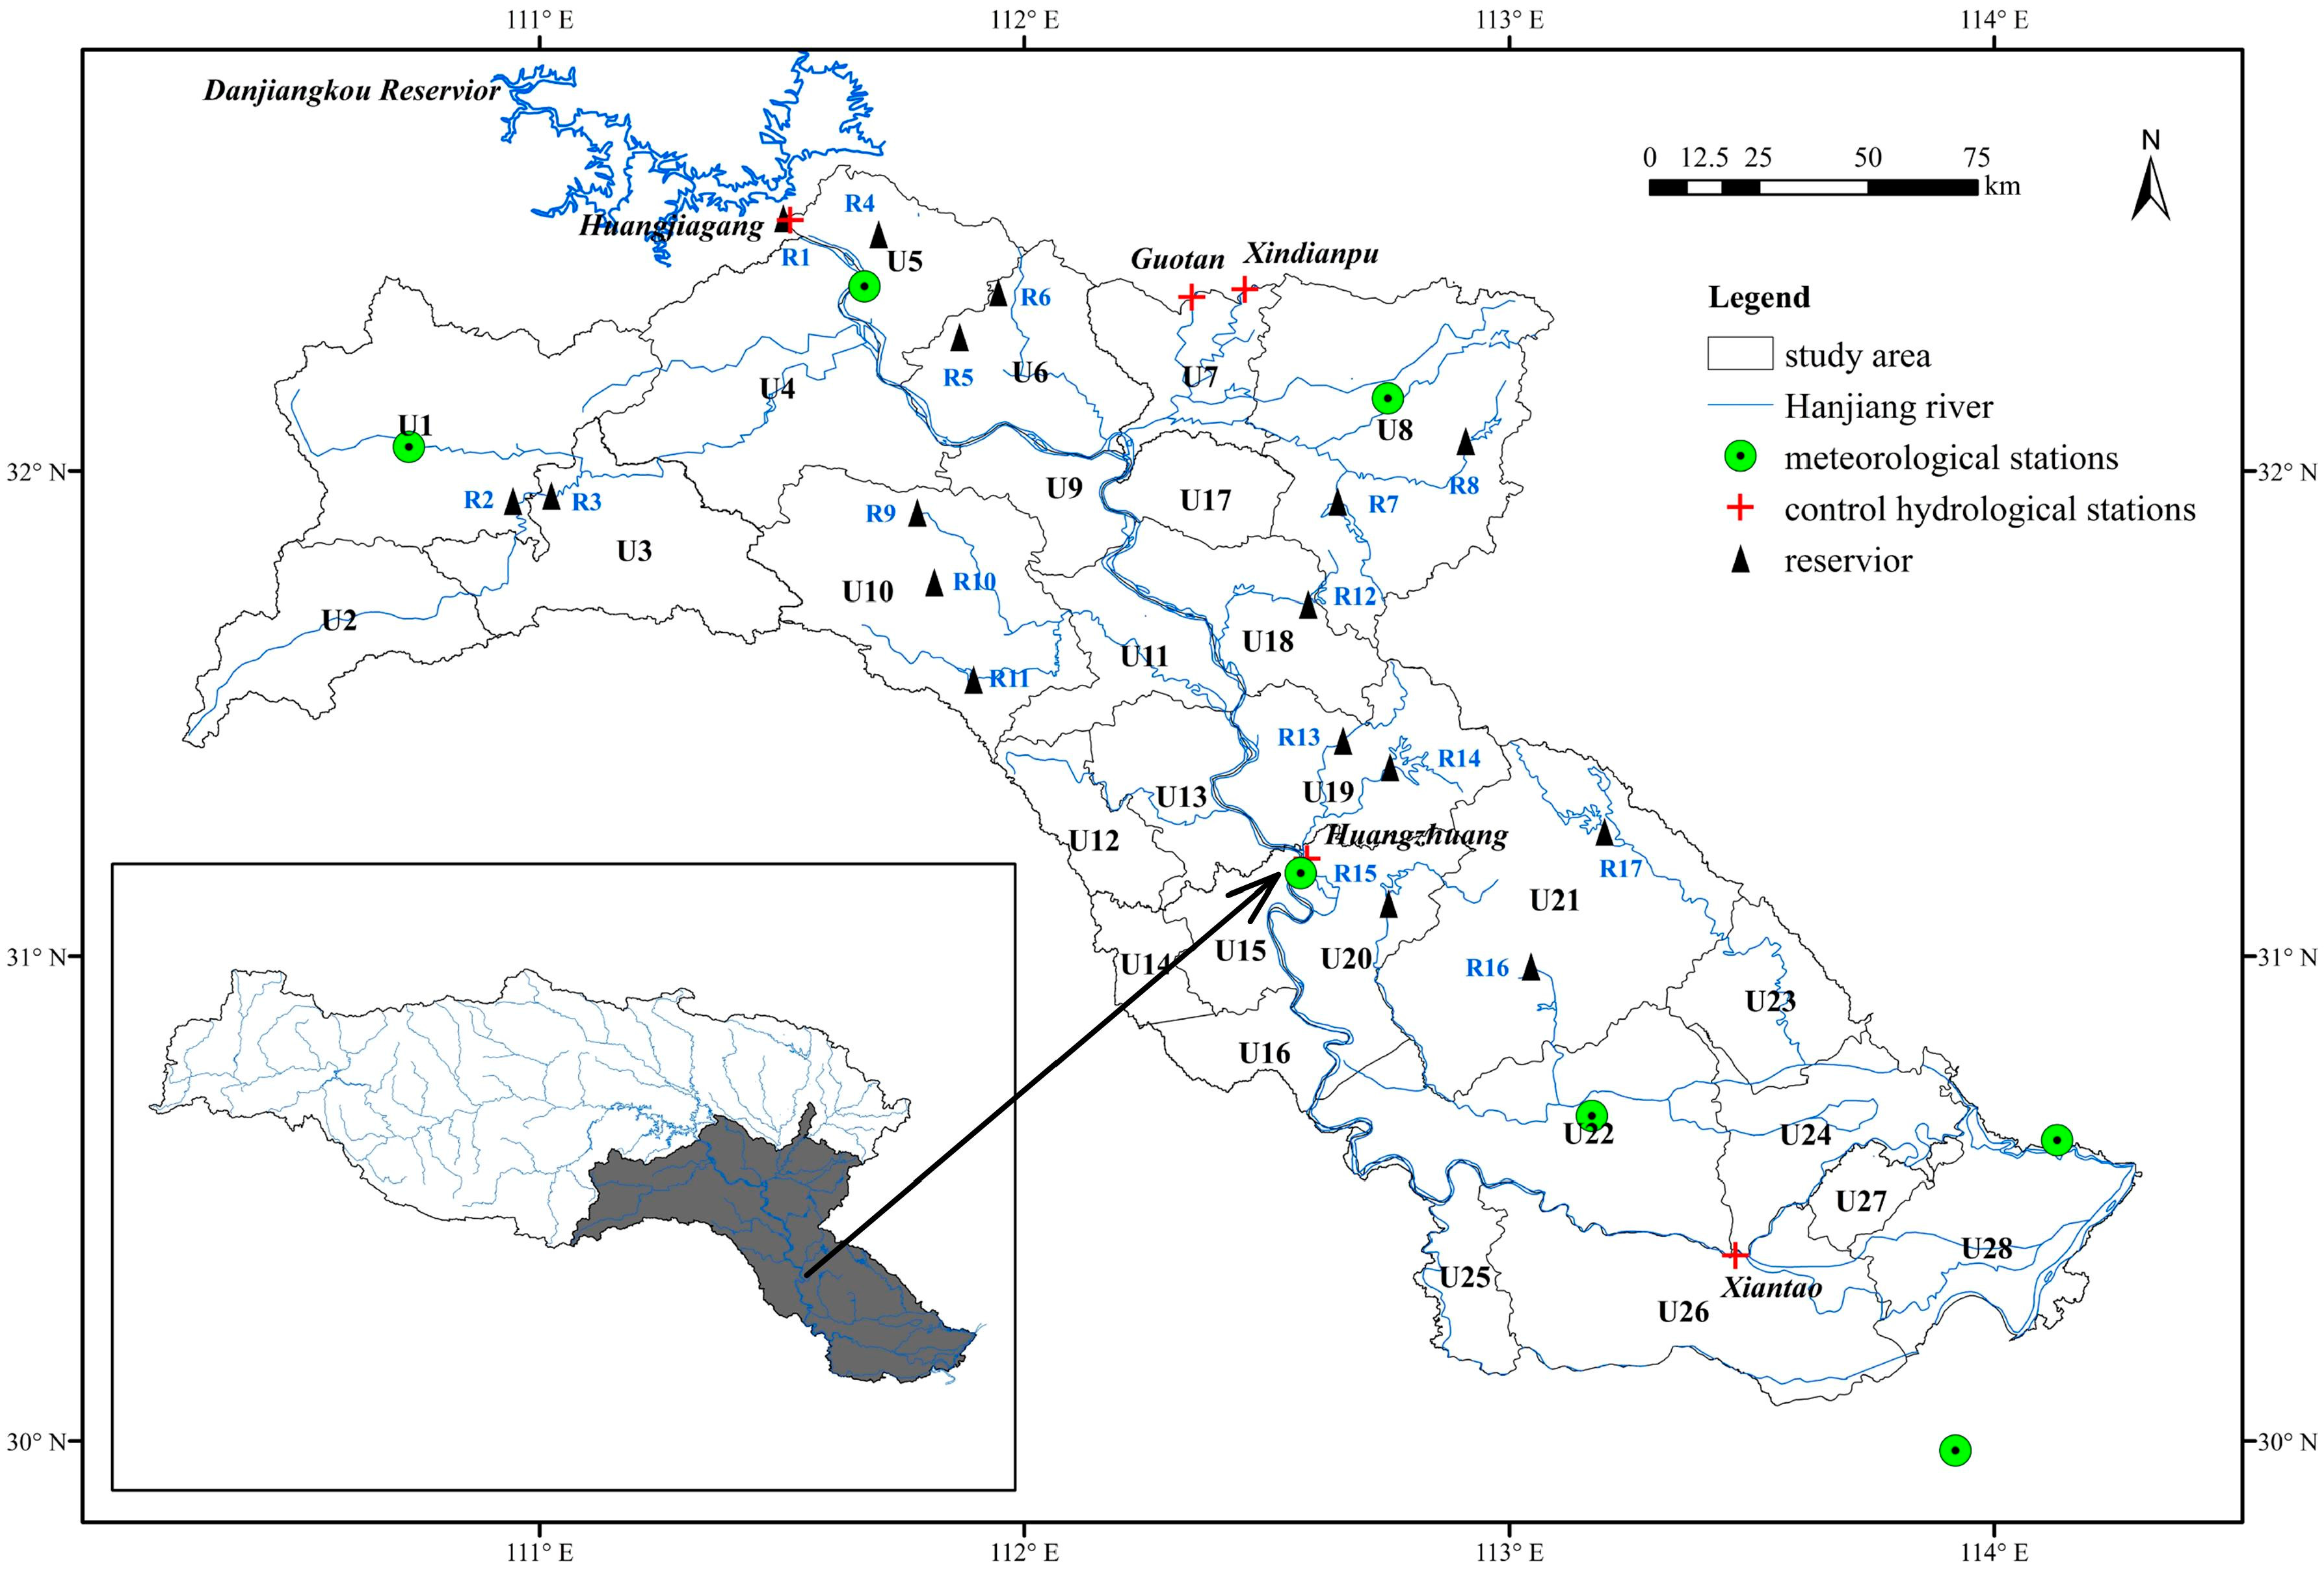
2.1. Hanjiang River Basin
2.2. Water Diversion Projects
2.3. Study Area
2.4. Data
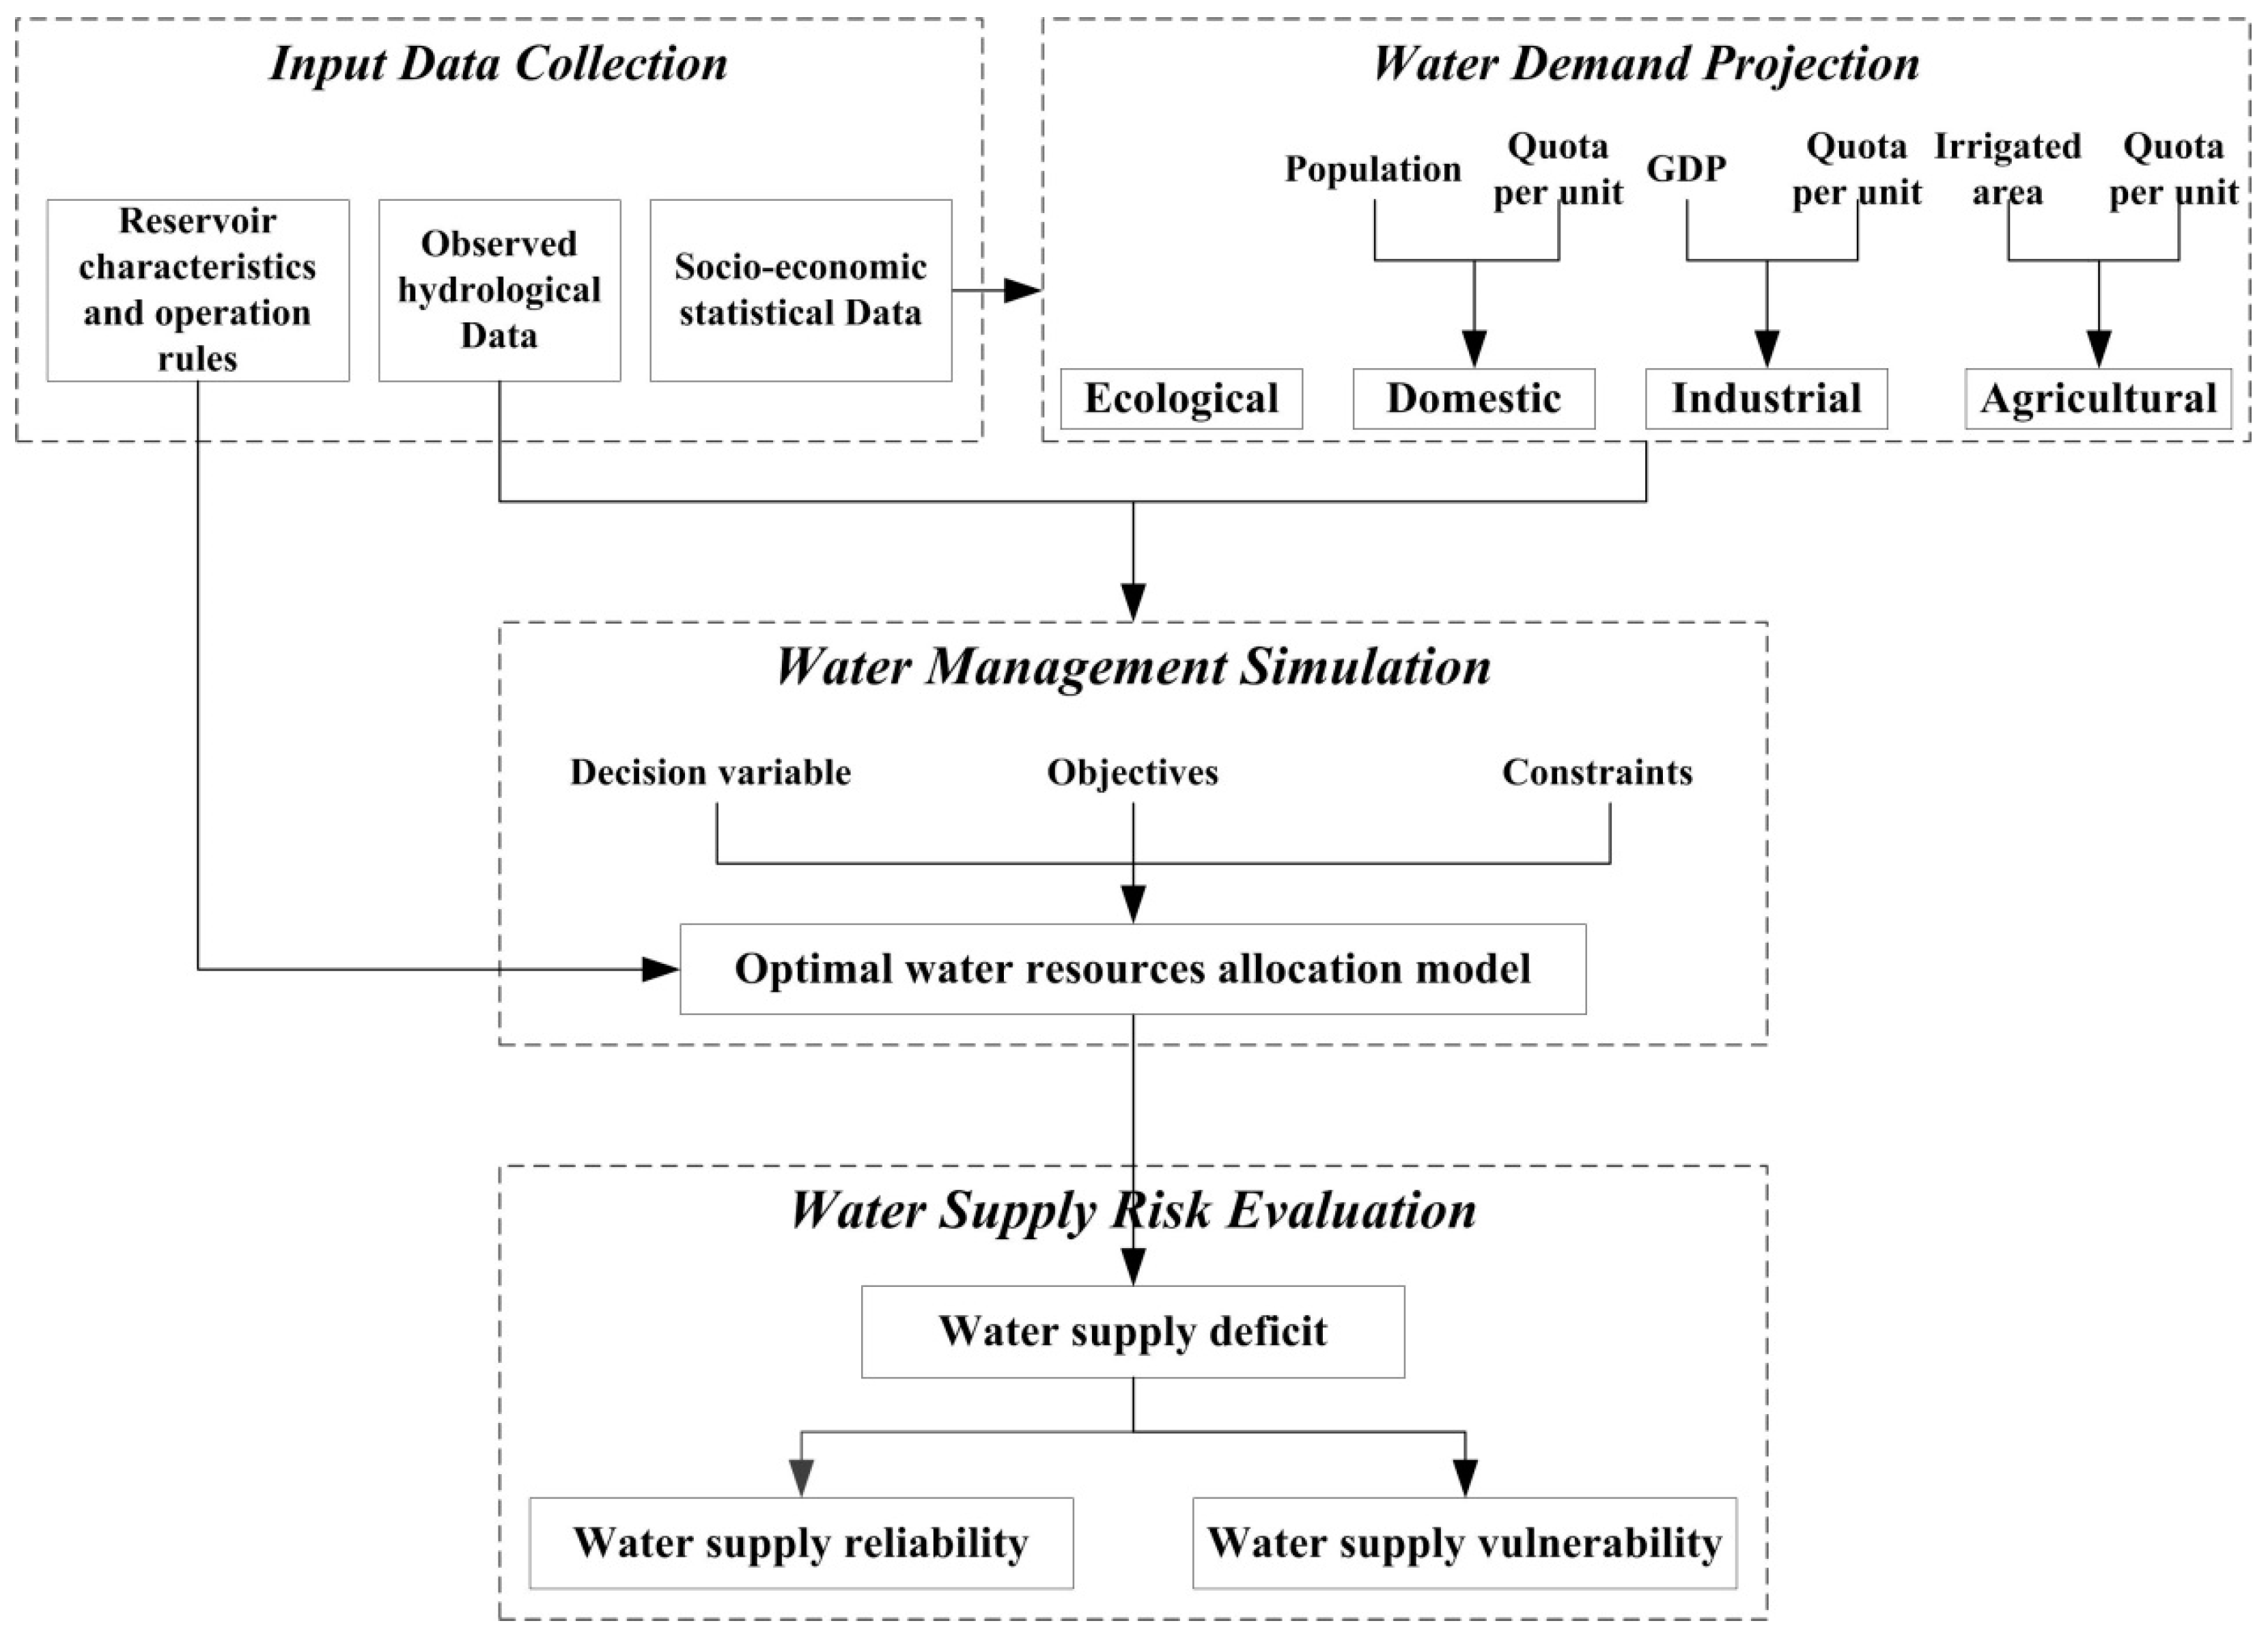
3. Methodology
3.1. Water Demand Projection Module
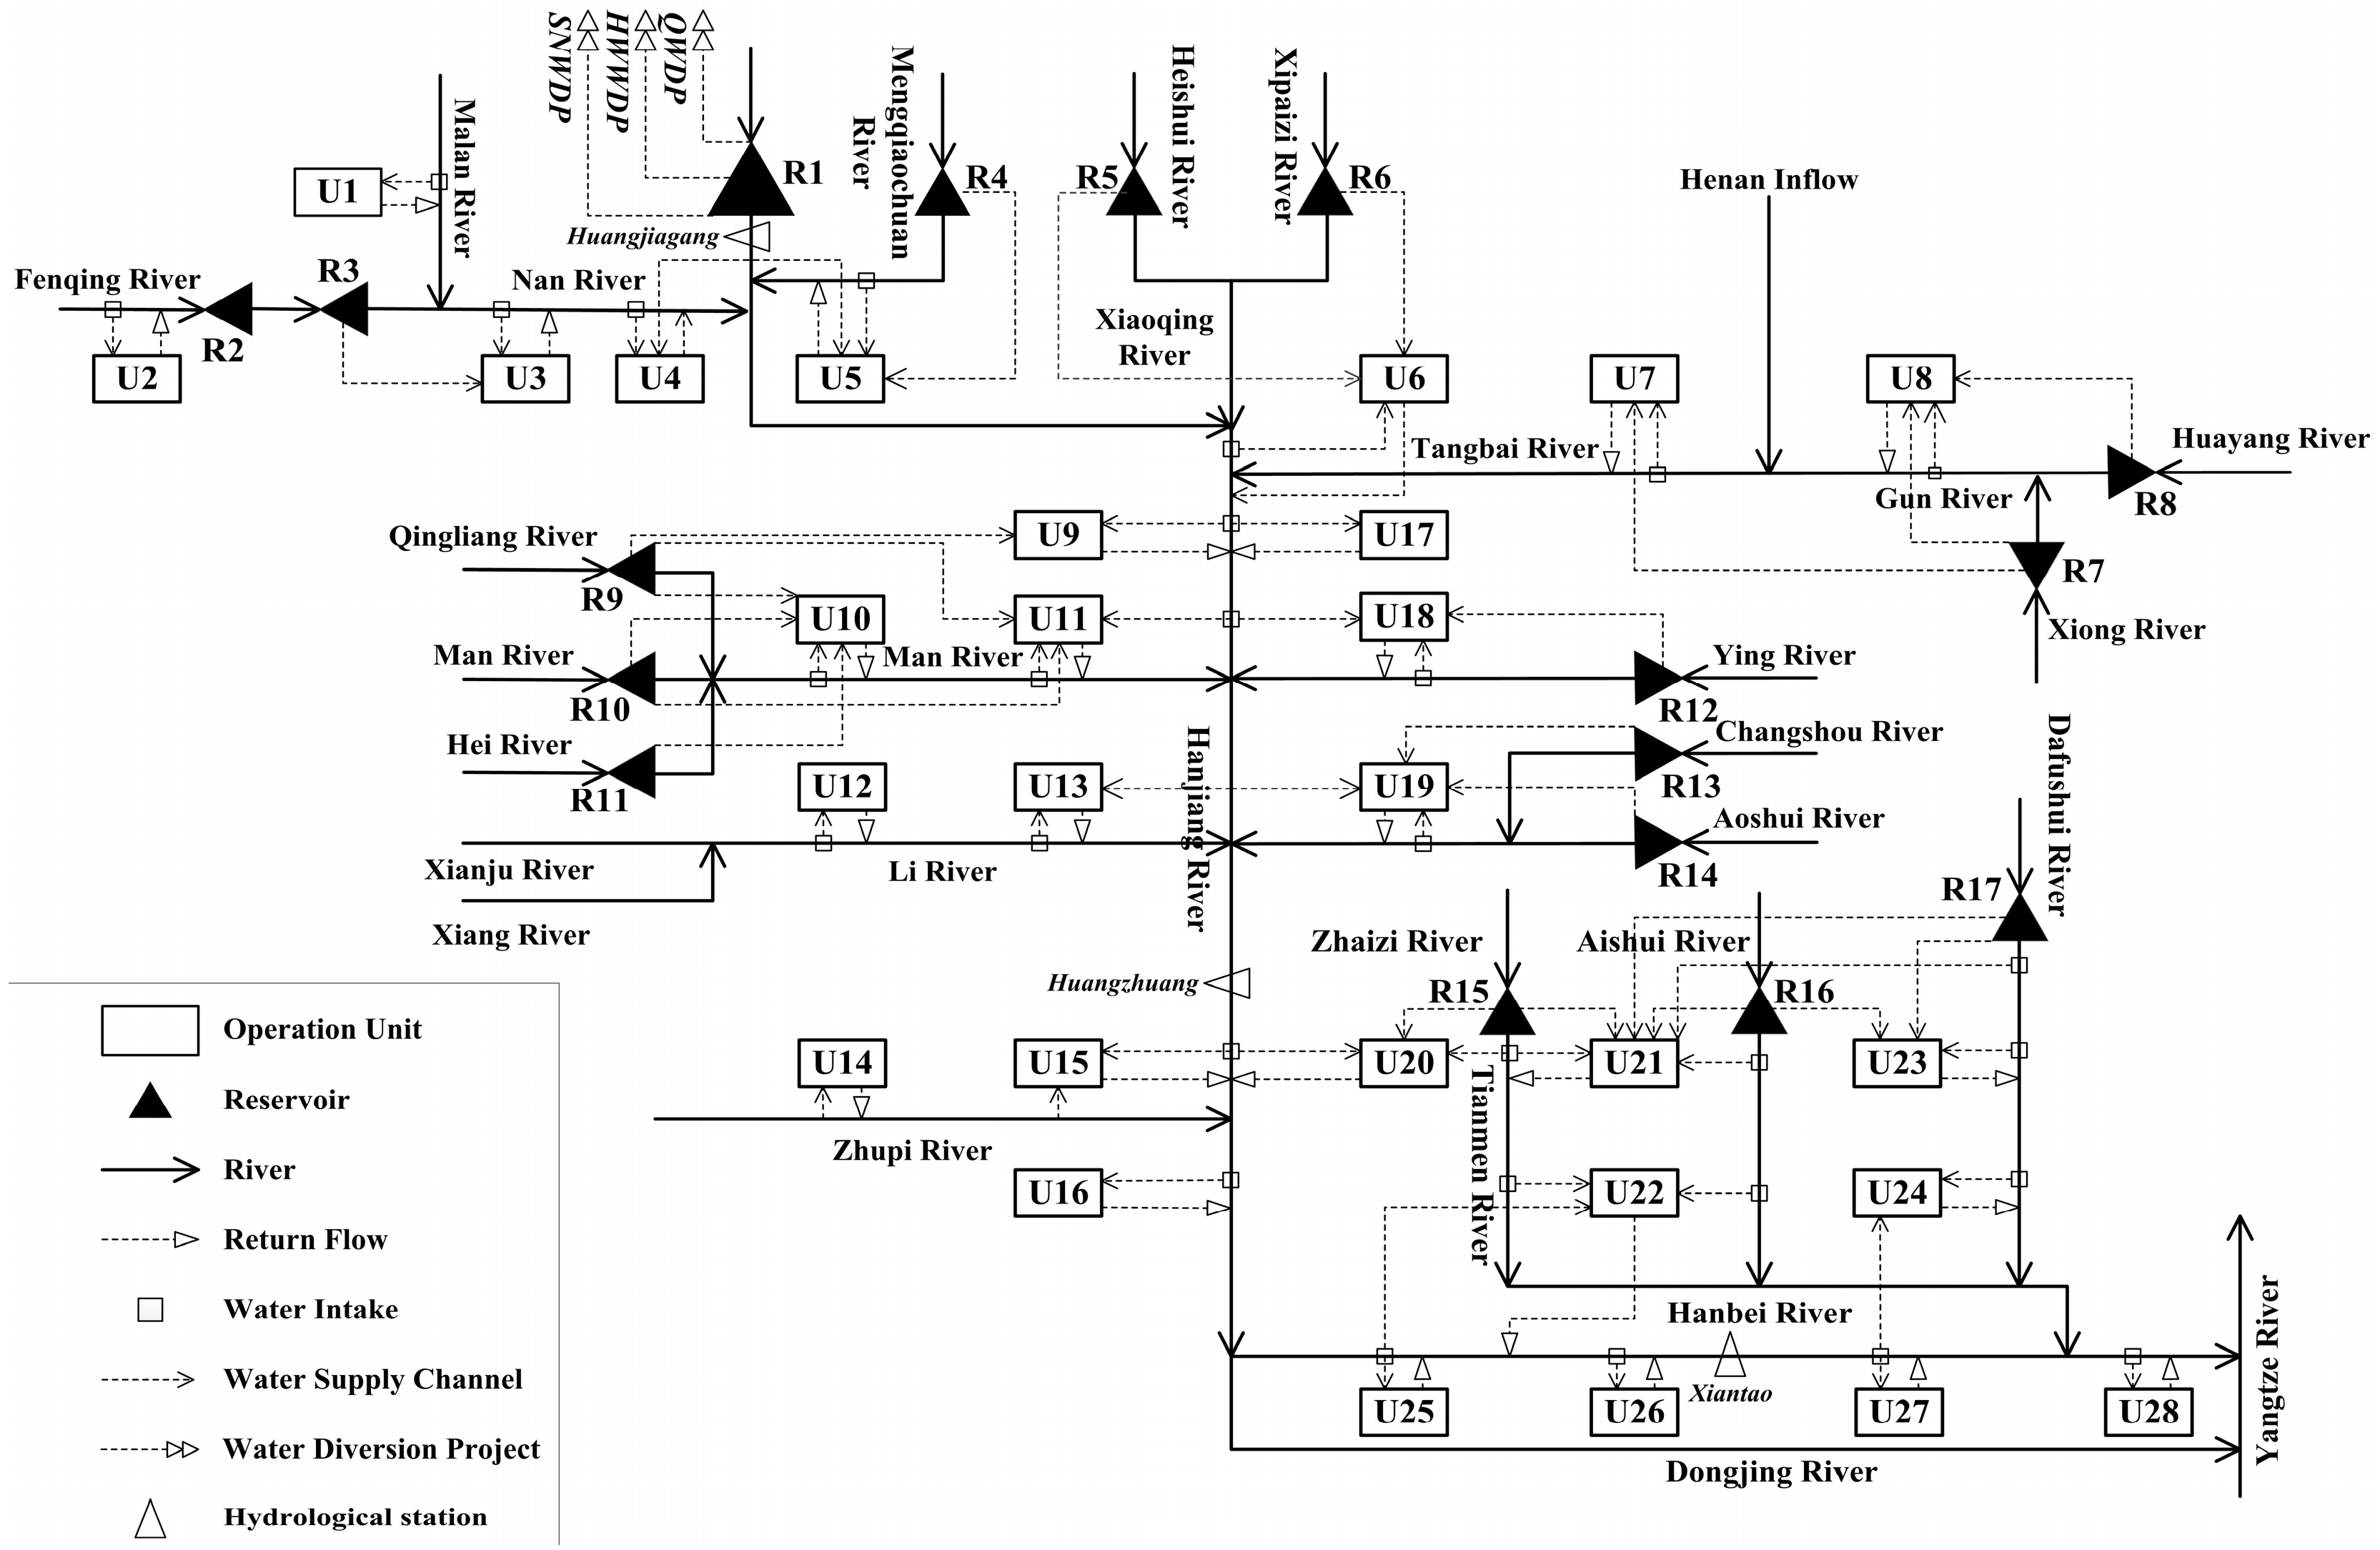
3.2. Water Management Simulation Module
3.2.1. Objective Function
3.2.2. Constraints
- (1)
- Water availability constraint:
- (2)
- Water demand constraint:
- (3)
- Water balance equation of reservoir:
- (4)
- Reservoir volume constraint:
- (5)
- Water balance constraint of operation zone:
- (6)
- Minimum in-stream ecological flow constraint in control sections.
- (7)
- Non-negativity constraint.
3.2.3. Optimization Algorithm
3.3. Water Supply Risk Evaluation Module
4. Results
4.1. Trends of Future Water Demand
4.2. Optimum Allocation of Water Resources
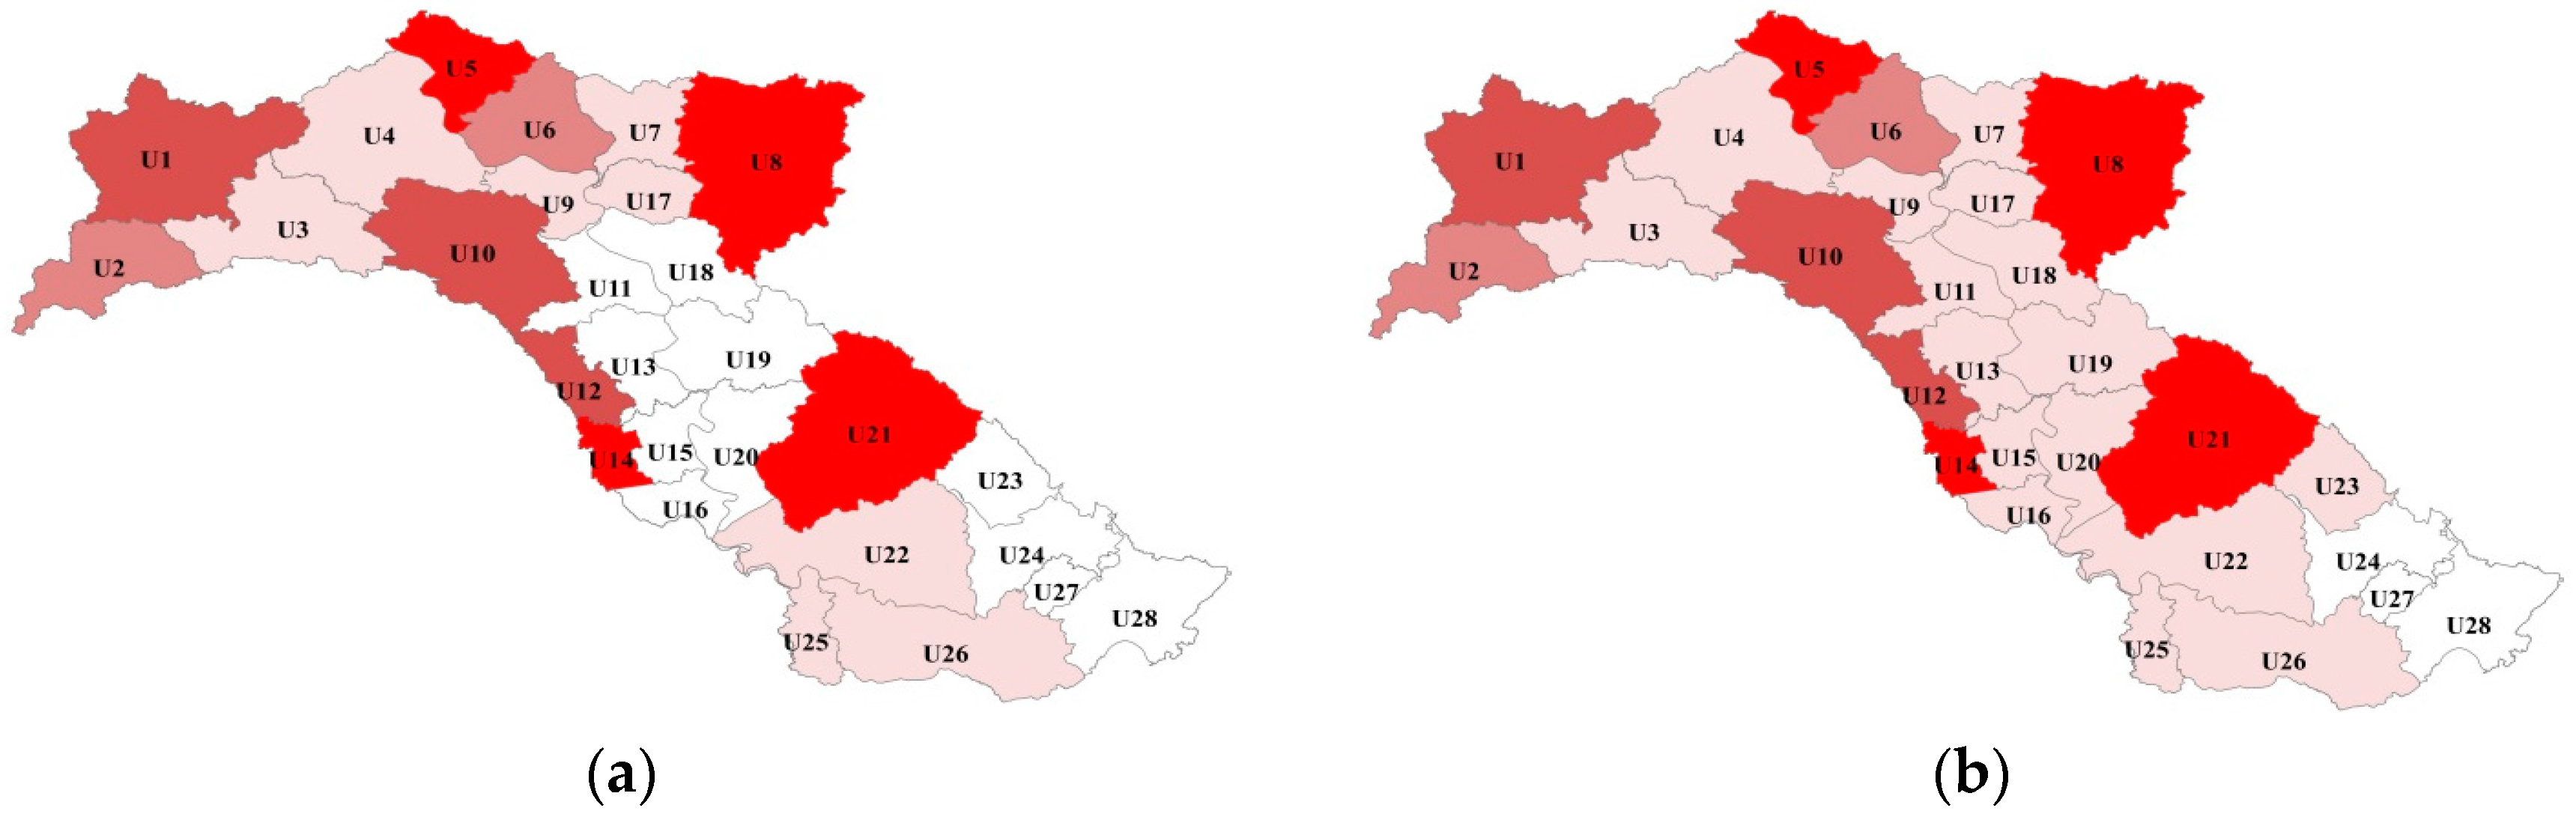
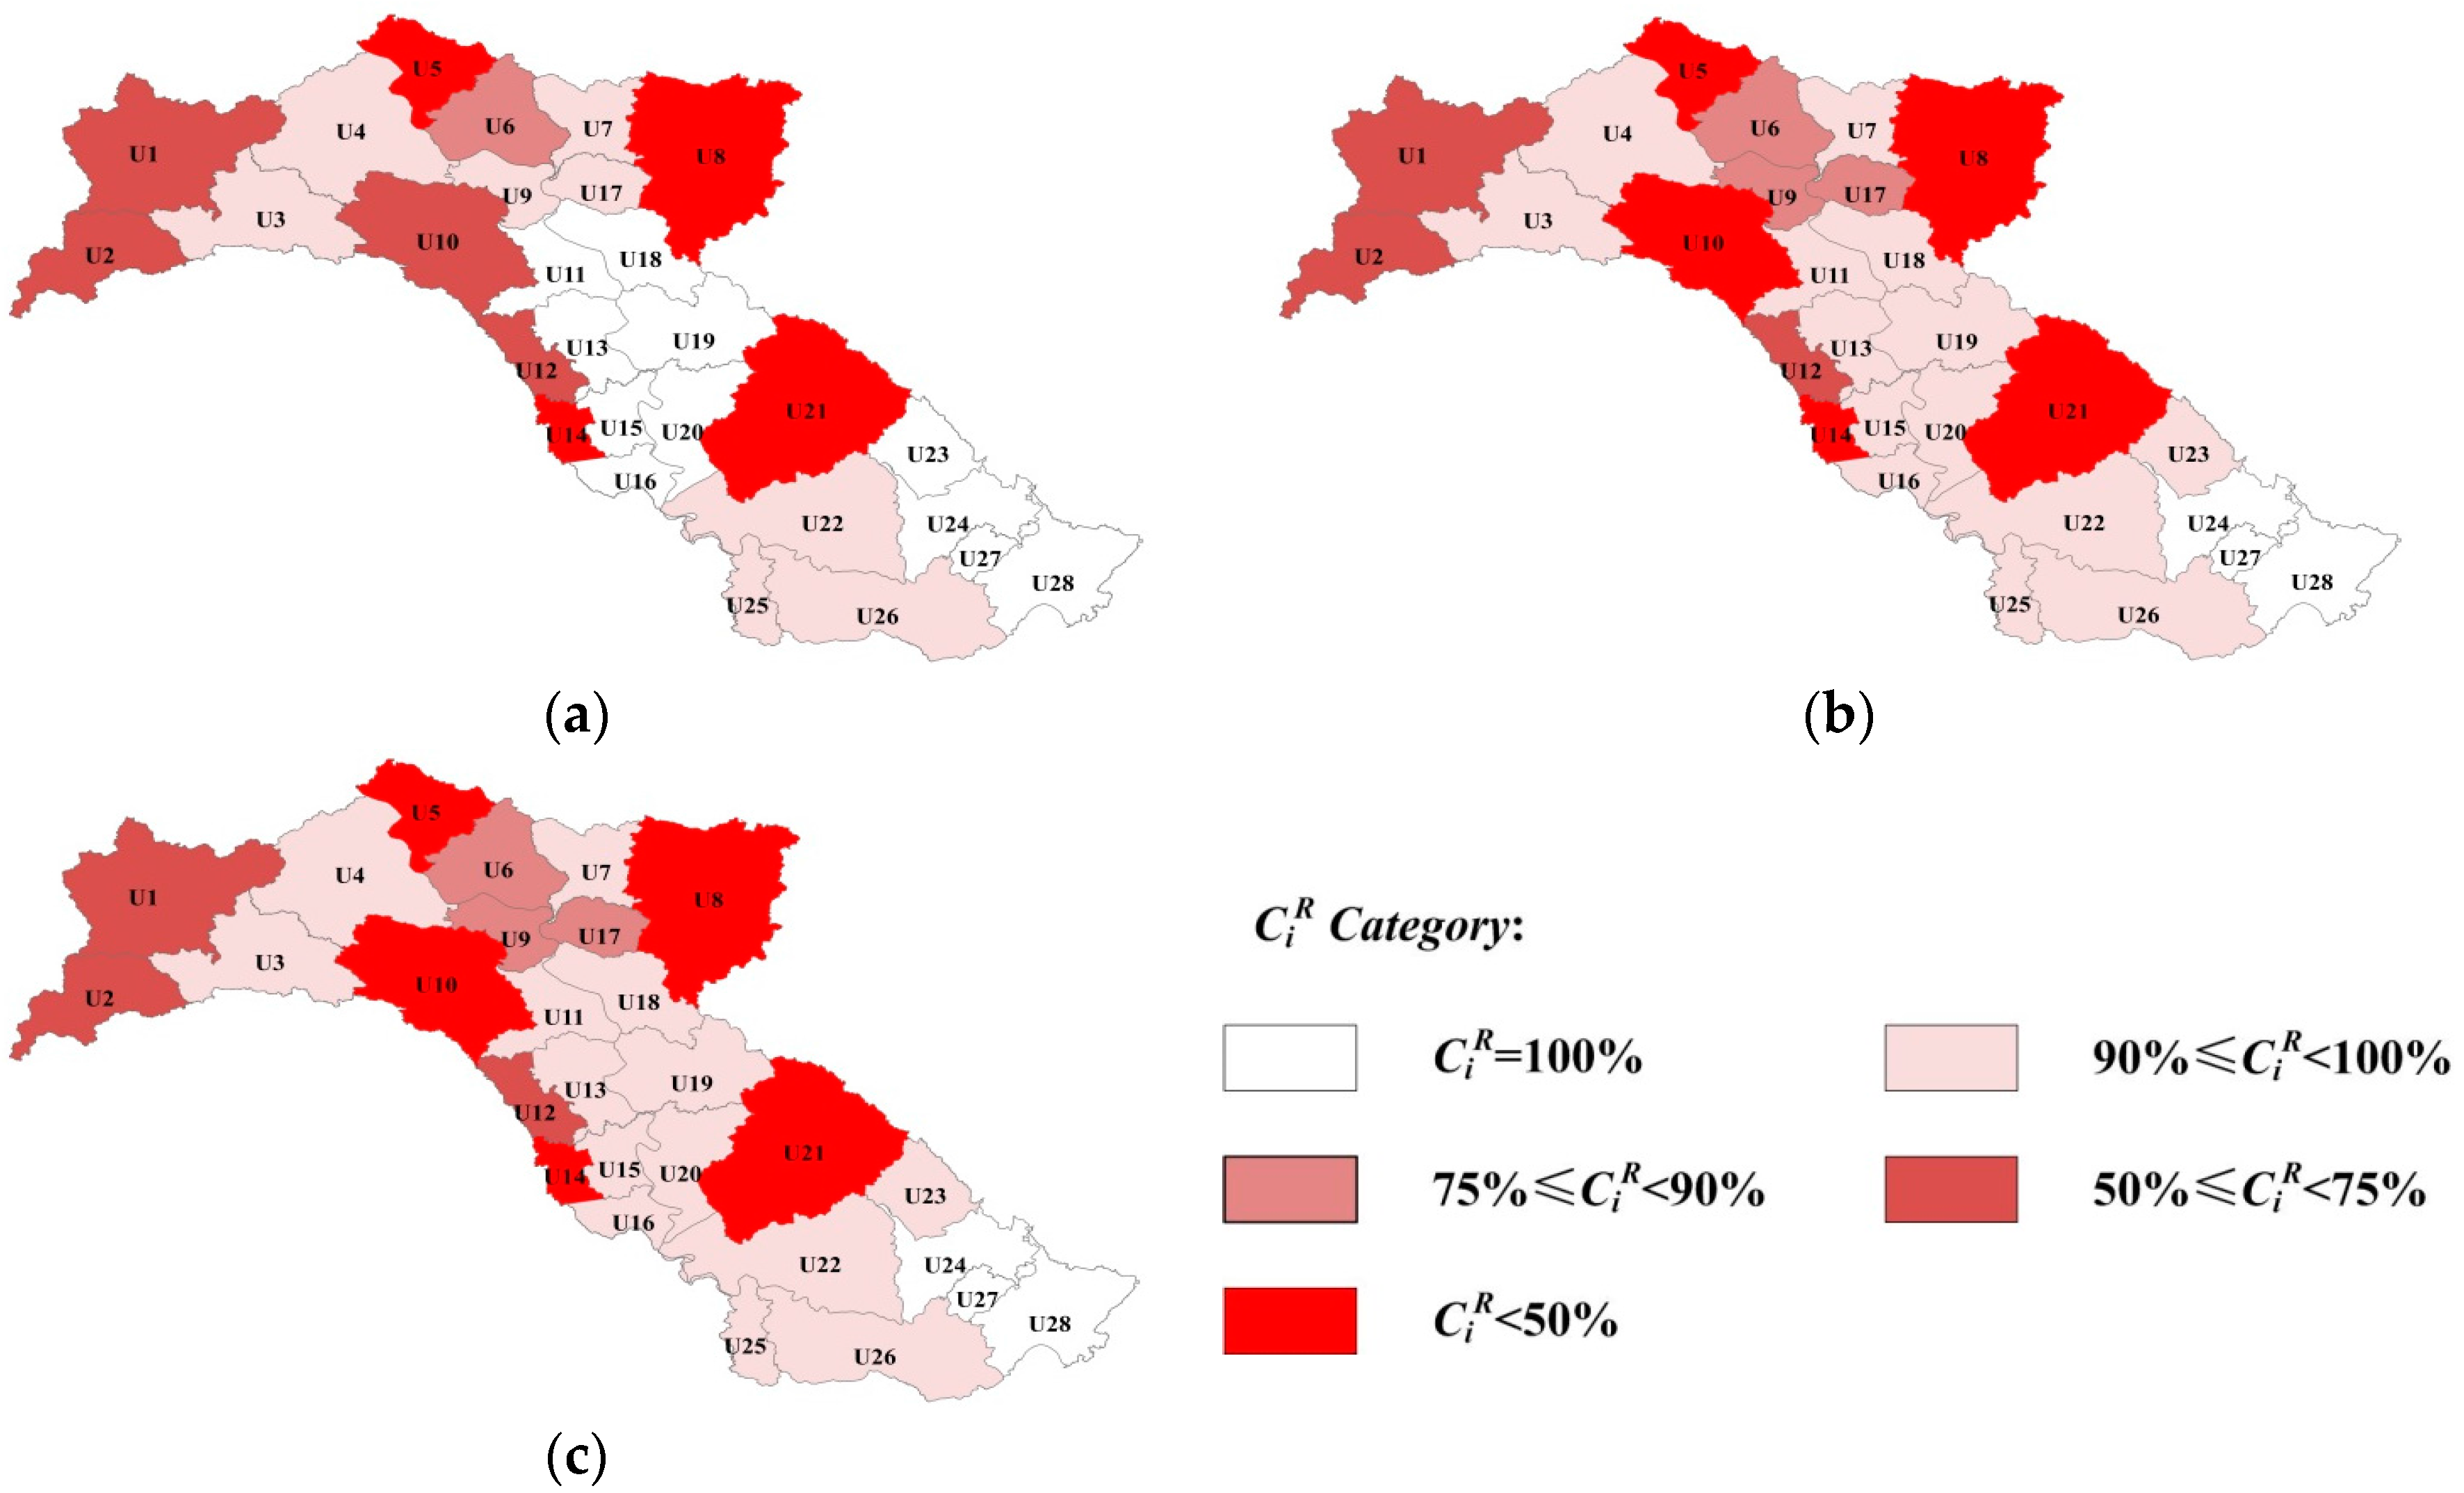
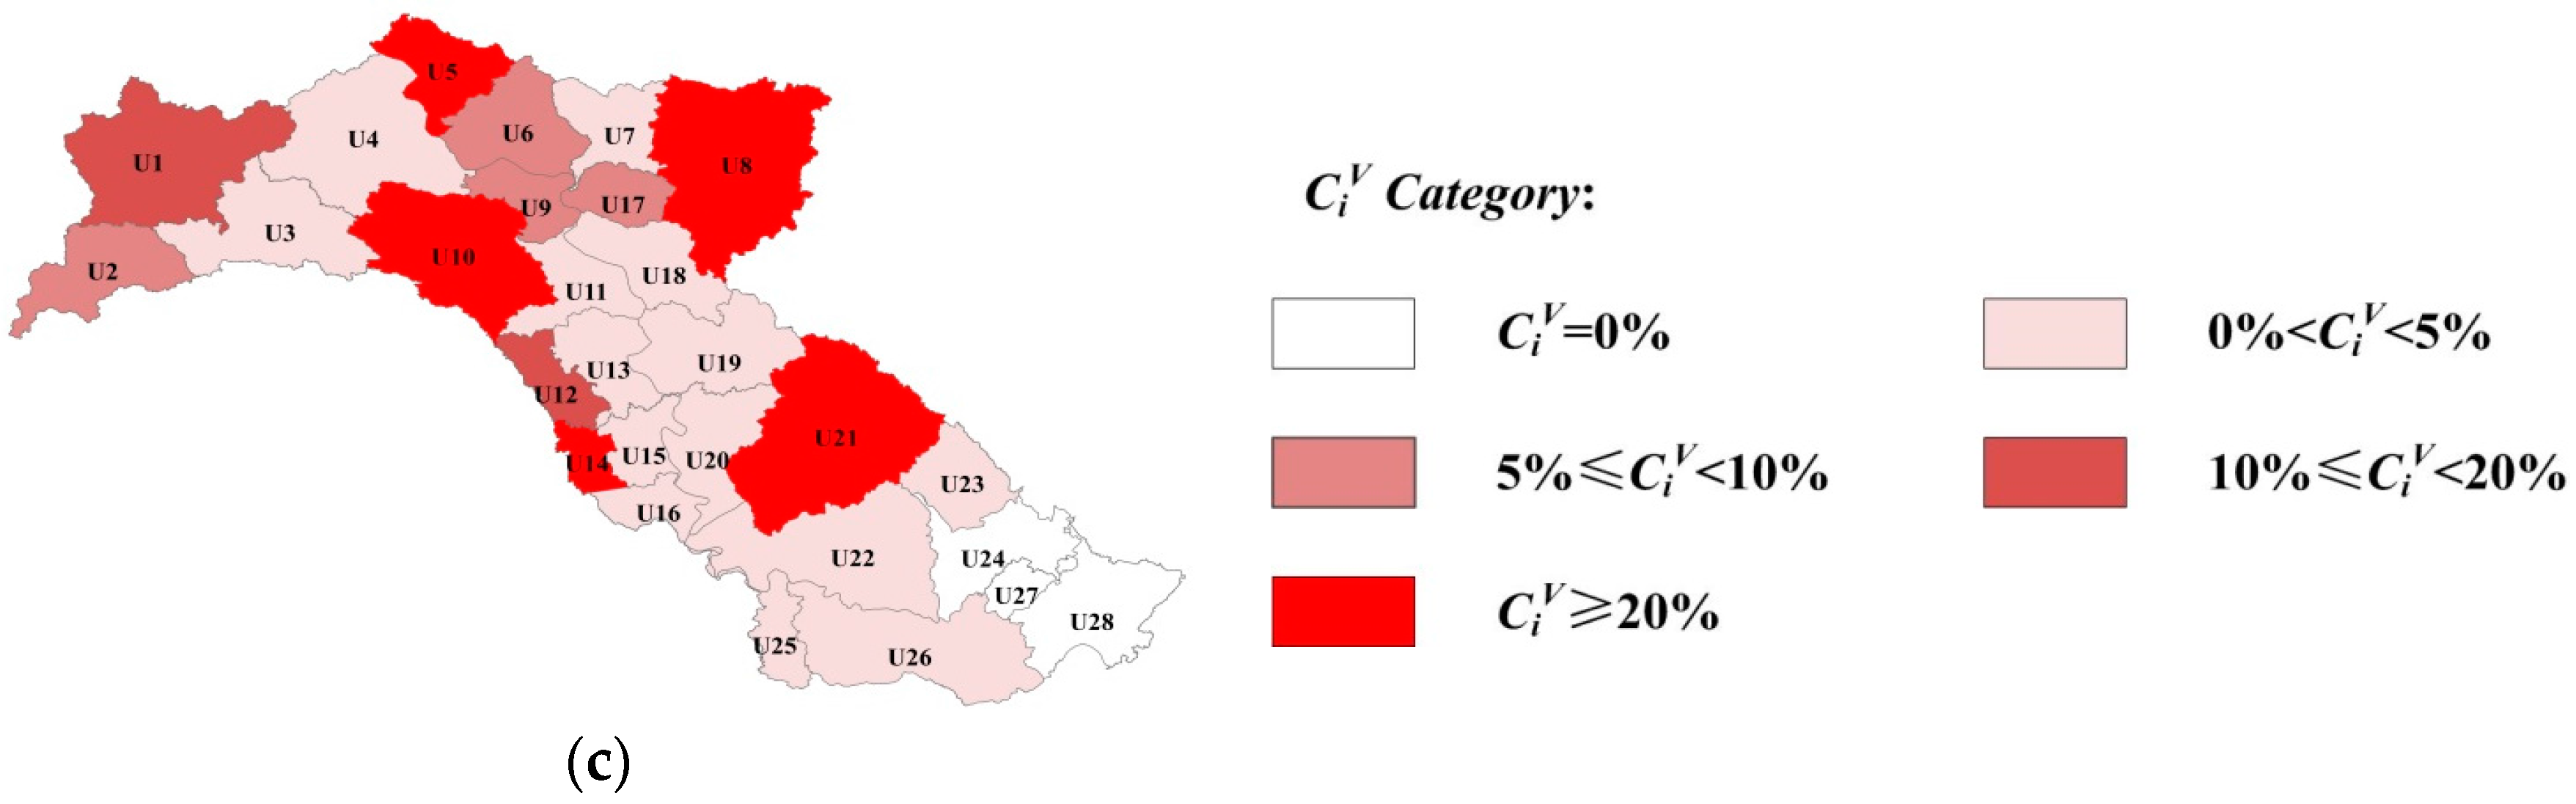
4.3. Evaluation of Water Supply Risk
5. Discussion and Conclusions
Acknowledgments
Author Contributions
Conflicts of Interest
References
- Wagener, T.; Sivapalan, M.; Troch, P.A.; McGlynn, B.L.; Harman, C.J.; Gupta, H.V.; Kumar, P.; Rao, P.S.C.; Basu, N.B.; Wilson, J.S. The future of hydrology: An evolving science for a changing world. Water Resour. Res. 2010, 46, W05301. [Google Scholar] [CrossRef]
- Cosgrove, W.J.; Loucks, D.P. Water management: Current and future challenges and research directions. Water Resour. Res. 2015, 51, 4823–4839. [Google Scholar] [CrossRef]
- Kerachian, R.; Karamouz, M. A stochastic conflict resolution model for water quality management in reservoir-river systems. Adv. Water Resour. 2007, 30, 866–882. [Google Scholar] [CrossRef]
- Eliasson, J. The rising pressure of global water shortages. Nature 2015, 517, 6. [Google Scholar] [CrossRef] [PubMed]
- Stocker, T.F. Climate Change 2013: The Physical Science Basis. Contribution of Working Group I to the Fifth Assessment Report of the Intergovernmental Panel on Climate Change; Cambridge University Press: Cambridge, UK, 2014. [Google Scholar]
- Hirabayashi, Y.; Kanae, S.; Emori, S.; Oki, T.; Kimoto, M. Global projections of changing risks of floods and droughts in a changing climate. Hydrol. Sci. J. 2008, 53, 754–772. [Google Scholar] [CrossRef]
- Feyen, L.; Dankers, R. Impact of global warming on streamflow drought in Europe. J. Geophys. Res. Atmos. 2009, 114, D17116. [Google Scholar] [CrossRef]
- Mishra, A.K.; Singh, V.P. Drought modeling-A review. J. Hydrol. 2011, 403, 157–175. [Google Scholar] [CrossRef]
- Milly, P.C.D.; Wetherald, R.T.; Dunne, K.A.; Delworth, T.L. Increasing risk of great floods in a changing climate. Nature 2002, 415, 514–517. [Google Scholar] [CrossRef] [PubMed]
- Sheffield, J.; Wood, E.F. Projected changes in drought occurrence under future global warming from multi-model, multi-scenario, IPCC AR4 simulations. Clim. Dyn. 2008, 31, 79–105. [Google Scholar] [CrossRef]
- Olmstead, S.M.; Stavins, R.N. Comparing price and nonprice approaches to urban water conservation. Water Resour. Res. 2009, 45, W04301. [Google Scholar] [CrossRef]
- Survis, F.D.; Root, T.L. Evaluating the effectiveness of water restrictions: A case study from Southeast Florida. J. Environ. Manag. 2012, 112, 377–383. [Google Scholar] [CrossRef] [PubMed]
- Araujo, L.S.; Ramos, H.; Coelho, S.T. Pressure control for leakage minimisation in water distribution systems management. Water Resour. Manag. 2006, 20, 133–149. [Google Scholar] [CrossRef]
- U.S. Environmental Protection Agency. Control and Mitigation of Drinking Water Losses in Distribution Systems; U.S. Environmental Protection Agency: Washington, DC, USA, 2010.
- Guo, S.; Zhang, H.; Chen, H.; Peng, D.; Liu, P.; Pang, B. A reservoir flood forecasting and control system for China. Hydrol. Sci. J. 2004, 49, 959–972. [Google Scholar] [CrossRef]
- Andreu, J.; Capilla, J.; Sanchís, E. Aquatool, a generalized decision support system for water-resources planning and management. J. Hydrol. 1996, 177, 269–291. [Google Scholar] [CrossRef]
- Perera, B.J.C.; James, B.; Kularathna, M.D.U. Computer software tool REALM for sustainable water allocation and management. J. Environ. Manag. 2005, 77, 291–300. [Google Scholar] [CrossRef] [PubMed]
- Yates, D.; Sieber, J.; Purkey, D.; Huber-Lee, A. WEAP21-A demand-, priority-, and preference-driven water planning model: Part 1: Model characteristics. Water Int. 2005, 30, 487–500. [Google Scholar] [CrossRef]
- Jha, M.K.; Gupta, A.D. Application of Mike Basin for water management strategies in a watershed. Water Int. 2003, 28, 27–35. [Google Scholar] [CrossRef]
- Reca, J.; Roldán, J.; Alcaide, M.; López, R.; Camacho, E. Optimisation model for water allocation in deficit irrigation systems: I. Description of the model. Agric. Water Manag. 2001, 48, 103–116. [Google Scholar] [CrossRef]
- Shangguan, Z.; Shao, M.; Horton, R.; Lei, T.; Qin, L.; Ma, J. A model for regional optimal allocation of irrigation water resources under deficit irrigation and its applications. Agric. Water Manag. 2002, 52, 139–154. [Google Scholar] [CrossRef]
- Liu, D.; Chen, X.; Lou, Z. A model for the optimal allocation of water resources in a saltwater intrusion area: a case study in Pearl River Delta in China. Water Resour. Manag. 2010, 24, 63–81. [Google Scholar] [CrossRef]
- Hu, Z.; Wei, C.; Yao, L.; Li, C.; Zeng, Z. Integrating equality and stability to resolve water allocation issues with a multiobjective bilevel programming model. J. Water Resour. Plan. Manag. 2016, 142, 04016013. [Google Scholar] [CrossRef]
- Chen, L.; McPhee, J.; Yeh, W.W.G. A diversified multiobjective GA for optimizing reservoir rule curves. Adv. Water Resour. 2007, 30, 1082–1093. [Google Scholar] [CrossRef]
- Chang, L.C.; Chang, F.J. Multi-objective evolutionary algorithm for operating parallel reservoir system. J. Hydrol. 2009, 377, 12–20. [Google Scholar] [CrossRef]
- Liu, D.; Guo, S.; Chen, X.; Shao, Q.; Ran, Q.; Song, X.; Wang, Z. A macro-evolutionary multi-objective immune algorithm with application to optimal allocation of water resources in Dongjiang River basins, South China. Stoch. Environ. Res. Risk Assess. 2012, 26, 491–507. [Google Scholar] [CrossRef]
- Zhou, Y.; Guo, S. Incorporating ecological requirement into multipurpose reservoir operating rule curves for adaptation to climate change. J. Hydrol. 2013, 498, 153–164. [Google Scholar] [CrossRef]
- Yang, G.; Guo, S.; Li, L.; Hong, X.; Wang, L. Multi-Objective operating rules for Danjiangkou reservoir under climate change. Water Resour. Manag. 2016, 30, 1183–1202. [Google Scholar] [CrossRef]
- Zhou, Y.; Guo, S.; Xu, C-Y.; Liu, D.; Chen, L.; Ye, Y. Integrated optimal allocation model for complex adaptive system of water resources management (I): Methodologies. J. Hydrol. 2015, 531, 964–976. [Google Scholar] [CrossRef]
- Zhou, Y.; Guo, S.; Xu, C.-Y.; Liu, D.; Chen, L.; Wang, D. Integrated optimal allocation model for complex adaptive system of water resources management (II): Case study. J. Hydrol. 2015, 531, 977–991. [Google Scholar] [CrossRef]
- Hashimoto, T.; Stedinger, J.R.; Loucks, D.P. Reliability, resiliency, and vulnerability criteria for water resource system performance evaluation. Water Resour. Res. 1982, 18, 14–20. [Google Scholar] [CrossRef]
- Mehran, A.; Mazdiyasni, O.; AghaKouchak, A. A hybrid framework for assessing socioeconomic drought: Linking climate variability, local resilience, and demand. J. Geophys. Res. Atmos. 2015, 120, 7520–7533. [Google Scholar] [CrossRef]
- Cañón, J.; González, J.; Valdés, J. Reservoir operation and water allocation to mitigate drought effects in crops: A multilevel optimization using the drought frequency index. J. Water Resour. Plan. Manag. 2009, 135, 458–465. [Google Scholar] [CrossRef]
- Liu, S.; Yan, D.; Wang, J.; Weng, B.; Wang, G.; Yang, M. Drought mitigation ability index and application based on balance between water supply and demand. Water 2015, 7, 1792–1807. [Google Scholar] [CrossRef]
- Rajagopalan, B.; Nowak, K.; Prairie, J.; Hoerling, M.; Harding, B.; Barsugli, J.; Ray, A.; Udall, B. Water supply risk on the Colorado River: Can management mitigate? Water Resour. Res. 2009, 45, W08201. [Google Scholar] [CrossRef]
- Milano, M.; Ruelland, D.; Dezetter, A.; Fabre, J.; Ardoin-Bardin, S.; Servat, E. Modeling the current and future capacity of water resources to meet water demands in the Ebro basin. J. Hydrol. 2013, 500, 114–126. [Google Scholar] [CrossRef]
- Grimm, N.B.; Faeth, S.H.; Golubiewski, N.E.; Redman, C.L.; Wu, J.; Bai, X.; Briggs, J.M. Global change and the ecology of cities. Science 2008, 319, 756–760. [Google Scholar] [CrossRef] [PubMed]
- Chen, H.; Guo, S.; Xu, C.Y.; Singh, V.P. Historical temporal trends of hydro-climatic variables and runoff response to climate variability and their relevance in water resource management in the Hanjiang basin. J. Hydrol. 2007, 344, 171–184. [Google Scholar] [CrossRef]
- Chen, H.; Guo, J.; Guo, S.; Xu, C.Y.; Xiong, W. Downscaling GCMs using the Smooth Support Vector Machine method to predict daily precipitation in the Hanjiang Basin. Adv. Atmos. Sci. 2010, 27, 274–284. [Google Scholar] [CrossRef]
- Gu, W.; Shao, D.; Jiang, Y. Risk evaluation of water shortage in source area of middle route project for South-to-North Water Transfer in China. Water Resour. Manag. 2012, 26, 3479–3493. [Google Scholar] [CrossRef]
- Guo, S.; Guo, J.; Zhang, J.; Chen, H. VIC distributed hydrological model to predict climate change impact in the Hanjiang Basin. Sci. China Ser. E Technol. Sci. 2009, 52, 3234–3239. [Google Scholar] [CrossRef]
- Hubei Provincial Department of Water Resources. Dispatching Schedules of Hubei Provincial Large Reservoirs; Hubei Provincial Department of Water Resources: Wuhan, China, 2014. (In Chinese)
- Brekke, L.; Larsen, M.D.; Ausburn, M.; Takaichi, L. Suburban water demand modeling using stepwise regression. J. Am. Water Works Assoc. 2002, 94, 65–95. [Google Scholar]
- Tennant, D.L. Instream flow regimens for fish, wildlife, recreation and related environmental resources. Fisheries 1976, 1, 6–10. [Google Scholar] [CrossRef]
- Randall, D.; Cleland, L.; Kuehne, C.S.; Link, G.W.B.; Sheer, D.P. Water supply planning simulation model using mixed-integer linear programming “engine”. J. Water Resour. Plan. Manag. 1997, 123, 116–124. [Google Scholar] [CrossRef]
- Wada, Y.; Van Beek, L.P.; Wanders, N.; Bierkens, M.F. Human water consumption intensifies hydrological drought worldwide. Environ. Res. Lett. 2013, 8, 034036. [Google Scholar] [CrossRef]
- Zhang, Q.; Han, L.; Jia, J.; Song, L.; Wang, J. Management of drought risk under global warming. Theor. Appl. Climatol. 2016, 125, 187–196. [Google Scholar] [CrossRef]


| No. | Name | Water Source | Water Receiving Area | Designed Annual Mean Transfer Water (Total/Inter-Basin) | ||
|---|---|---|---|---|---|---|
| Present | Short-Term | Long-Term | ||||
| (million m3·year−1) | (million m3·year−1) | (million m3·year−1) | ||||
| 1 | SNWDP | Danjiangkou Reservoir | Tangbai River Basin 1 and Huang-Huai-Hai Plain | 600/0 | 9500/8500 | 13,100/12,050 |
| 2 | QWDP | Danjiangkou Reservoir | Northern Hubei Province | 628/0 | 628/0 | 1398/291 |
| 3 | HWWDP | Huangjinxia and Sanhekou Reservoir 2 | Weihe River Basin | 0/0 | 1000/1000 | 1500/1500 |
| No. | Reservoir | Total Storage | Normal Pool Water Level | Useful Storage | Flood Limited Water Level | Dead Water Level | ||
|---|---|---|---|---|---|---|---|---|
| Pre-Flood Season | Main Flood Season | Post-Flood Season | ||||||
| (million m3) | (m) | (million m3) | (m) | (m) | (m) | (m) | ||
| R1 | Danjiangkou | 33,910 | 170.00 | 29,050 | - | 160.00 | 163.50 | 150.00 |
| R2 | Sanliping | 499.00 | 416.00 | 211.00 | - | 403.00 | 412.00 | 392.00 |
| R3 | Siping | 269.00 | 315.00 | 145.00 | 313.86 | 313.86 | 313.86 | 294.00 |
| R4 | Mengqiaochuan | 110.33 | 143.00 | 88.15 | 142.20 | 142.20 | 142.20 | 126.00 |
| R5 | Hongshuihe | 103.60 | 117.00 | 58.90 | 117.00 | 117.00 | 117.00 | 109.00 |
| R6 | Xipaizihe | 220.40 | 111.80 | 22.00 | 111.80 | 111.80 | 111.80 | 100.00 |
| R7 | Xionghe | 195.90 | 125.00 | 115.90 | 125.00 | 125.00 | 125.00 | 113.00 |
| R8 | Huayanghe | 107.00 | 144.19 | 70.80 | 144.19 | 144.19 | 144.19 | 128.69 |
| R9 | Shimenji | 154.03 | 195.00 | 114.69 | 195.00 | 195.00 | 195.00 | 158.00 |
| R10 | Sandaohe | 154.60 | 154.00 | 127.42 | 154.00 | 152.40 | 153.00 | 112.70 |
| R11 | Yuntaishan | 123.00 | 164.50 | 89.00 | 163.00 | 163.00 | 163.00 | 126.89 |
| R12 | Yinghe | 121.66 | 132.70 | 76.31 | 132.70 | 132.70 | 132.70 | 116.20 |
| R13 | Huangpo | 125.61 | 77.50 | 70.25 | 76.00 | 76.00 | 76.00 | 65.50 |
| R14 | Wenxiakou | 520.00 | 107.00 | 269.00 | 105.00 | 105.00 | 105.00 | 95.00 |
| R15 | Shimen | 159.10 | 91.00 | 68.60 | 91.00 | 91.00 | 91.00 | 80.00 |
| R16 | Huiting | 313.40 | 84.75 | 173.50 | 84.75 | 84.75 | 84.75 | 73.00 |
| R17 | Gaoguan | 201.08 | 121.50 | 154.32 | 119.00 | 118.00 | 119.00 | 100.50 |
| Planning Period | WD1 (million m3) | WD2 (million m3) | WD3 (million m3) | WD4 (million m3) | Off-Stream (million m3) | ||||||
|---|---|---|---|---|---|---|---|---|---|---|---|
| 50% | 75% | 90% | 95% | 50% | 75% | 90% | 95% | ||||
| Present | 341 | 216 | 4514 | 5673 | 6467 | 7207 | 7770 | 10,744 | 11,538 | 12,278 | 12,841 |
| Short-Term | 424 | 230 | 5087 | 5582 | 6209 | 6957 | 7456 | 11,323 | 11,950 | 12,698 | 13,197 |
| Long-Term | 641 | 236 | 6566 | 5089 | 5636 | 6255 | 6743 | 12,532 | 13,078 | 13,698 | 14,185 |
| Base Period | Short-Term Planning Period | Long-Term Planning Period | ||||||||||||||||||||||||
|---|---|---|---|---|---|---|---|---|---|---|---|---|---|---|---|---|---|---|---|---|---|---|---|---|---|---|
| P% | Item 1 | WU1 | WU2 | WU3 | WU4 | WU5 | Sum. 2 | Off. 3 | P% | Item | WU1 | WU2 | WU3 | WU4 | WU5 | Sum. | Off. | P% | Item | WU1 | WU2 | WU3 | WU4 | WU5 | Sum. | Off. |
| 50% | ① | 341 | 216 | 4514 | 5673 | 3889 | 14,633 | 10,744 | 50% | ① | 424 | 230 | 5087 | 5582 | 3889 | 15,211 | 11,323 | 50% | ① | 641 | 236 | 6566 | 5089 | 3889 | 16,420 | 12,532 |
| ② | 341 | 216 | 4241 | 5436 | 3504 | 13,738 | 10,234 | ② | 424 | 230 | 4733 | 5331 | 3473 | 14,191 | 10,718 | ② | 641 | 236 | 5996 | 4730 | 3424 | 15,027 | 11,603 | |||
| ③ | 0 | 0 | 273 | 237 | 385 | 895 | 510 | ③ | 0 | 0 | 354 | 251 | 416 | 1020 | 605 | ③ | 0 | 0 | 570 | 359 | 465 | 1393 | 929 | |||
| ④ | 0.00 | 0.00 | 6.04 | 4.18 | 9.90 | 6.11 | 4.74 | ④ | 0.00 | 0.00 | 6.95 | 4.49 | 10.69 | 6.71 | 5.34 | ④ | 0.00 | 0.00 | 8.68 | 7.06 | 11.94 | 8.49 | 7.41 | |||
| 75% | ① | 341 | 216 | 4514 | 6467 | 3889 | 15,427 | 11,538 | 75% | ① | 424 | 230 | 5087 | 6209 | 3889 | 15,839 | 11,950 | 75% | ① | 641 | 236 | 6566 | 5636 | 3889 | 16,967 | 13,078 |
| ② | 341 | 216 | 4125 | 6056 | 3316 | 14,054 | 10,738 | ② | 424 | 230 | 4587 | 5784 | 3282 | 14,307 | 11,025 | ② | 641 | 236 | 5687 | 5047 | 3196 | 14,808 | 11,611 | |||
| ③ | 0 | 0 | 389 | 411 | 573 | 1373 | 800 | ③ | 0 | 0 | 500 | 425 | 607 | 1532 | 925 | ③ | 0 | 0 | 879 | 589 | 693 | 2159 | 1467 | |||
| ④ | 0.00 | 0.00 | 8.62 | 6.35 | 14.74 | 8.90 | 6.93 | ④ | 0.00 | 0.03 | 9.83 | 6.85 | 15.60 | 9.67 | 7.74 | ④ | 0.00 | 0.02 | 13.38 | 10.45 | 17.81 | 12.73 | 11.22 | |||
| 90% | ① | 341 | 216 | 4514 | 7207 | 3889 | 16,167 | 12,278 | 90% | ① | 424 | 230 | 5087 | 6957 | 3889 | 16,587 | 12,698 | 90% | ① | 641 | 236 | 6566 | 6255 | 3889 | 17,586 | 13,698 |
| ② | 341 | 215 | 3983 | 6577 | 3136 | 14,253 | 11,117 | ② | 424 | 228 | 4350 | 6276 | 3085 | 14,364 | 11,278 | ② | 639 | 234 | 5225 | 5320 | 2869 | 14,287 | 11,418 | |||
| ③ | 0 | 1 | 531 | 630 | 753 | 1914 | 1161 | ③ | 0 | 2 | 737 | 681 | 804 | 2223 | 1420 | ③ | 2 | 2 | 1341 | 935 | 1020 | 3299 | 2280 | |||
| ④ | 0.00 | 0.23 | 11.77 | 8.74 | 19.35 | 11.84 | 9.46 | ④ | 0.06 | 0.91 | 14.48 | 9.78 | 20.66 | 13.40 | 11.18 | ④ | 0.32 | 1.01 | 20.42 | 14.94 | 26.22 | 18.76 | 16.64 | |||
| 95% | ① | 341 | 216 | 4514 | 7770 | 3889 | 16,730 | 12,841 | 95% | ① | 424 | 230 | 5087 | 7456 | 3889 | 17,086 | 13,197 | 95% | ① | 641 | 236 | 6566 | 6743 | 3889 | 18,074 | 14,185 |
| ② | 340 | 213 | 3828 | 6884 | 2964 | 14,229 | 11,265 | ② | 422 | 225 | 3916 | 6301 | 2734 | 13,598 | 10,864 | ② | 632 | 229 | 4647 | 5271 | 2559 | 13,338 | 10,779 | |||
| ③ | 1 | 3 | 686 | 886 | 925 | 2501 | 1576 | ③ | 2 | 5 | 1171 | 1155 | 1155 | 3488 | 2333 | ③ | 9 | 7 | 1919 | 1472 | 1330 | 4736 | 3406 | |||
| ④ | 0.16 | 1.17 | 15.21 | 11.41 | 23.79 | 14.95 | 12.27 | ④ | 0.43 | 2.14 | 23.02 | 15.49 | 29.69 | 20.41 | 17.68 | ④ | 1.37 | 3.14 | 29.22 | 21.82 | 34.19 | 26.20 | 24.01 | |||
| Ave. | ① | 341 | 216 | 4514 | 6284 | 3889 | 15,244 | 11,356 | Ave. | ① | 424 | 230 | 5087 | 6110 | 3889 | 15,740 | 11,851 | Ave. | ① | 641 | 236 | 6566 | 5546 | 3889 | 16,877 | 12,989 |
| ② | 341 | 216 | 4202 | 5991 | 3465 | 14,215 | 10,751 | ② | 424 | 230 | 4666 | 5791 | 3422 | 14,533 | 11,110 | ② | 640 | 235 | 5871 | 5094 | 3348 | 15,188 | 11,841 | |||
| ③ | 0 | 0 | 312 | 293 | 424 | 1029 | 605 | ③ | 0 | 0 | 421 | 319 | 467 | 1207 | 741 | ③ | 1 | 1 | 695 | 452 | 541 | 1689 | 1148 | |||
| ④ | 0.01 | 0.08 | 6.91 | 4.66 | 10.90 | 6.75 | 5.33 | ④ | 0.03 | 0.20 | 8.27 | 5.22 | 12.00 | 7.67 | 6.25 | ④ | 0.11 | 0.25 | 10.58 | 8.15 | 13.91 | 10.01 | 8.84 | |||
© 2016 by the authors; licensee MDPI, Basel, Switzerland. This article is an open access article distributed under the terms and conditions of the Creative Commons Attribution (CC-BY) license (http://creativecommons.org/licenses/by/4.0/).
Share and Cite
Hong, X.; Guo, S.; Wang, L.; Yang, G.; Liu, D.; Guo, H.; Wang, J. Evaluating Water Supply Risk in the Middle and Lower Reaches of Hanjiang River Basin Based on an Integrated Optimal Water Resources Allocation Model. Water 2016, 8, 364. https://doi.org/10.3390/w8090364
Hong X, Guo S, Wang L, Yang G, Liu D, Guo H, Wang J. Evaluating Water Supply Risk in the Middle and Lower Reaches of Hanjiang River Basin Based on an Integrated Optimal Water Resources Allocation Model. Water. 2016; 8(9):364. https://doi.org/10.3390/w8090364
Chicago/Turabian StyleHong, Xingjun, Shenglian Guo, Le Wang, Guang Yang, Dedi Liu, Haijin Guo, and Jun Wang. 2016. "Evaluating Water Supply Risk in the Middle and Lower Reaches of Hanjiang River Basin Based on an Integrated Optimal Water Resources Allocation Model" Water 8, no. 9: 364. https://doi.org/10.3390/w8090364
APA StyleHong, X., Guo, S., Wang, L., Yang, G., Liu, D., Guo, H., & Wang, J. (2016). Evaluating Water Supply Risk in the Middle and Lower Reaches of Hanjiang River Basin Based on an Integrated Optimal Water Resources Allocation Model. Water, 8(9), 364. https://doi.org/10.3390/w8090364