Article

Retention of Silica Nanoparticles in a Lab-Scale Membrane Bioreactor: Implications for Process Performance and Membrane Fouling

1
Department of Environment and Energy, Sejong University, 98 Gunja-dong, Gwangjin-gu, Seoul 143-747, Korea
2
JIU Corporation, Yangcheon-ro, Gangseo-gu, Seoul 157-801, Korea
*
Author to whom correspondence should be addressed.
Water 2016, 8(7), 277; https://doi.org/10.3390/w8070277
Submission received: 9 May 2016 / Revised: 20 June 2016 / Accepted: 27 June 2016 / Published: 4 July 2016
(This article belongs to the Special Issue Advanced Membranes for Water Treatment)

Abstract

:
In conventional activated sludge (CAS) involving aerobic biological processes, the retention of silica nanoparticles (SiO2 NPs) has no detrimental effect on chemical oxygen demand (COD) and ammonia nitrogen (NH3–N) removal. However, for the membrane bioreactor (MBR) system, which is also based on the activated sludge process in addition to the membrane separation process, it has implications not only on the process performance but also on membrane fouling. To investigate these two implications in lab-scale experiments, we continuously operated a control MBR and two experimental MBRs, in which the 28 nm SiO2 NPs and 144 nm SiO2 NPs were added separately to the influent at a final concentration of 100 mg/L. Although the retention of SiO2 NPs in the MBR, as confirmed by dynamic light scattering (DLS) analysis, did not compromise the COD and NH3–N removal, it resulted in substantial increases in the transmembrane pressure (TMP) suggesting the onset of membrane fouling. Analyses by batch-dead end filtration revealed the same fouling trend as observed during the continuous MBR experiments; membrane fouling is aggravated in the presence of SiO2 NPs. This was evident from permeate flux decline of between 30% and 74% at very low TMP (5 kPa) and the further increases in the total resistance.

Graphical Abstract

1. Introduction

The presence of SiO2 NPs in wastewater discharged from domestic and industrial sources raises two concerns for the biological wastewater treatment systems. One is their substantial stability in wastewater [1] that leads to the release of some of them into the effluent stream [2]. Another one is the potential impact of their consequent retention in activated sludge [3,4], which is the core of biological wastewater treatment processes.
Although the presence of SiO2 NPs in wastewater recently has been considered in operational strategies [5,6,7] and performance evaluation [8] for biological wastewater treatment systems, many of the studies have focused on CAS systems. In a CAS, the presence of SiO2 NPs has no detrimental effect on the aerobic removal of COD [2] and NH3–N [8]. Hence, the greater concern for developing strategies is to improve their aggregation with, incorporation into and settling along with activated sludge [1,5] instead.
Additional efforts are also needed to extend this research to membrane bioreactor (MBR) systems, which are also based on the activated sludge process in addition to a membrane separation process that allows MBR operation at higher mixed liquor suspended solids (MLSS) and longer sludge retention time (SRT) [9]. Thus, one may expect that the biological response to SiO2 in an MBR is similar to that observed in a CAS considering that the biological processes occurring in both systems are governed by activated sludge process. To demonstrate this, we performed continuous lab-scale MBR experiments under a constant flux and evaluated the response of activated sludge to SiO2 NPs based on the activated sludge respiration inhibition test and measurement of the removal efficiency of COD and NH3–N. As the particle size may influence SiO2 NPs’ colloidal stability in wastewater [1,2,3,4,5,6,7,8,9,10] and thus their retention in a MBR, we considered two types of SiO2 NPs based on size range, assessed their retention by comparison of activated sludge biomass between a control and an experimental group and confirmed their retention in a series of batch filtration tests.
Unlike a CAS, an MBR is challenged by membrane fouling [9], which can be more seriously challenged with colloidal particles such as SiO2 NPs present in the wastewater [11]. In a microfiltration process alone, colloidal particles can foul the membrane by their accumulation on the membrane surface resulting in the formation of a so-called cake layer and/or by plugging the membrane pores [12]. The extent of these two membrane fouling events is also influenced by the size of the particles relative to the membrane pores [13]. Similarly, in an MBR that integrates microfiltration, colloidal particles in the range of 10 nm to 100 nm are responsible for a major part of membrane fouling [14]. Thus, if SiO2 NPs are present in wastewater entering an MBR, membrane fouling will be aggravated possibly due to interaction effect of SiO2 NPs themselves and the assumed colloidal fraction of activated sludge. To investigate this, we monitored online the changes in the TMP of the MBRs from the same continuous lab-scale MBR experiments. We also performed a series of batch dead-end filtration tests to further investigate its effect on permeate flux and total resistance. This paper reports on our experimental investigation of the effects of SiO2 NPs on an MBR. It describes the retention of SiO2 NPs in an MBR and its implications for process performance and membrane fouling.

2. Materials and Methods

2.1. Materials

SiO2 NPs were purchased from Nissan Chemical Industries (Tokyo, Japan). Two types of SiO2 NPs according to size were used, 10–15 nm (Snowtex® ST-30) and 70–100 nm (Snowtex® ST-ZL). Their hydrodynamic size in synthetic wastewater were 28 nm for Snowtex® ST-30 and 144 nm for Snowtex® ST-ZL based on our evaluation by using DLS (PSS Nicomp, Santa Barbara, CA, USA) following the manufacturer’s instructions.
Three lab-scale MBRs, which were made of acryl plastic (polymethylmethacrylate), were used. Installed in each MBR setup was a 0.1 m2, flat sheet chlorinated-polyvinyl chloride (C-PVC) membrane module (240 mm × 340 mm × 7.5 mm) with a nominal pore size of 0.25 μm (GS Yuasa, Kyoto, Japan). Each MBR setup was connected to an air pump with continuous fine bubble diffused aeration that was controlled at 5 L/min by using an airflow meter (Dwyer, Michigan, IN, USA). The air diffuser was directly installed 5 mm beneath the membrane module. The activated sludge inoculum was obtained from an aerobic basin of a domestic wastewater treatment plant (Janghanpyeong, Seoul, South Korea).
The influent was a synthetic wastewater [15], whose composition includes 300 mg/L glucose (C6H12O6), 260 mg/L ammonium sulfate [(NH4)2SO4], 8.5 mg/L potassium dihydrogen phosphate (KH2PO4), 2.2 mg/L dipotassium hydrogen phosphate (K2HPO4), 4.5 mg/L disodium hydrogen phosphate dodecahydrate (Na2HPO4∙12H2O), 9.4 mg/L manganese sulfate monohydrate (MnSO4∙H2O), 0.25 mg/L ferric chloride hexahydrate (FeCl3∙6H2O), 23.3 mg/L calcium chloride (CaCl2), 22.5 mg/L magnesium sulfate heptahydrate (MgSO4∙7H2O) and 670 mg/L sodium bicarbonate (NaHCO3) (Daejung Chemical & Metal Co., Ltd., Shiheung, South Korea).

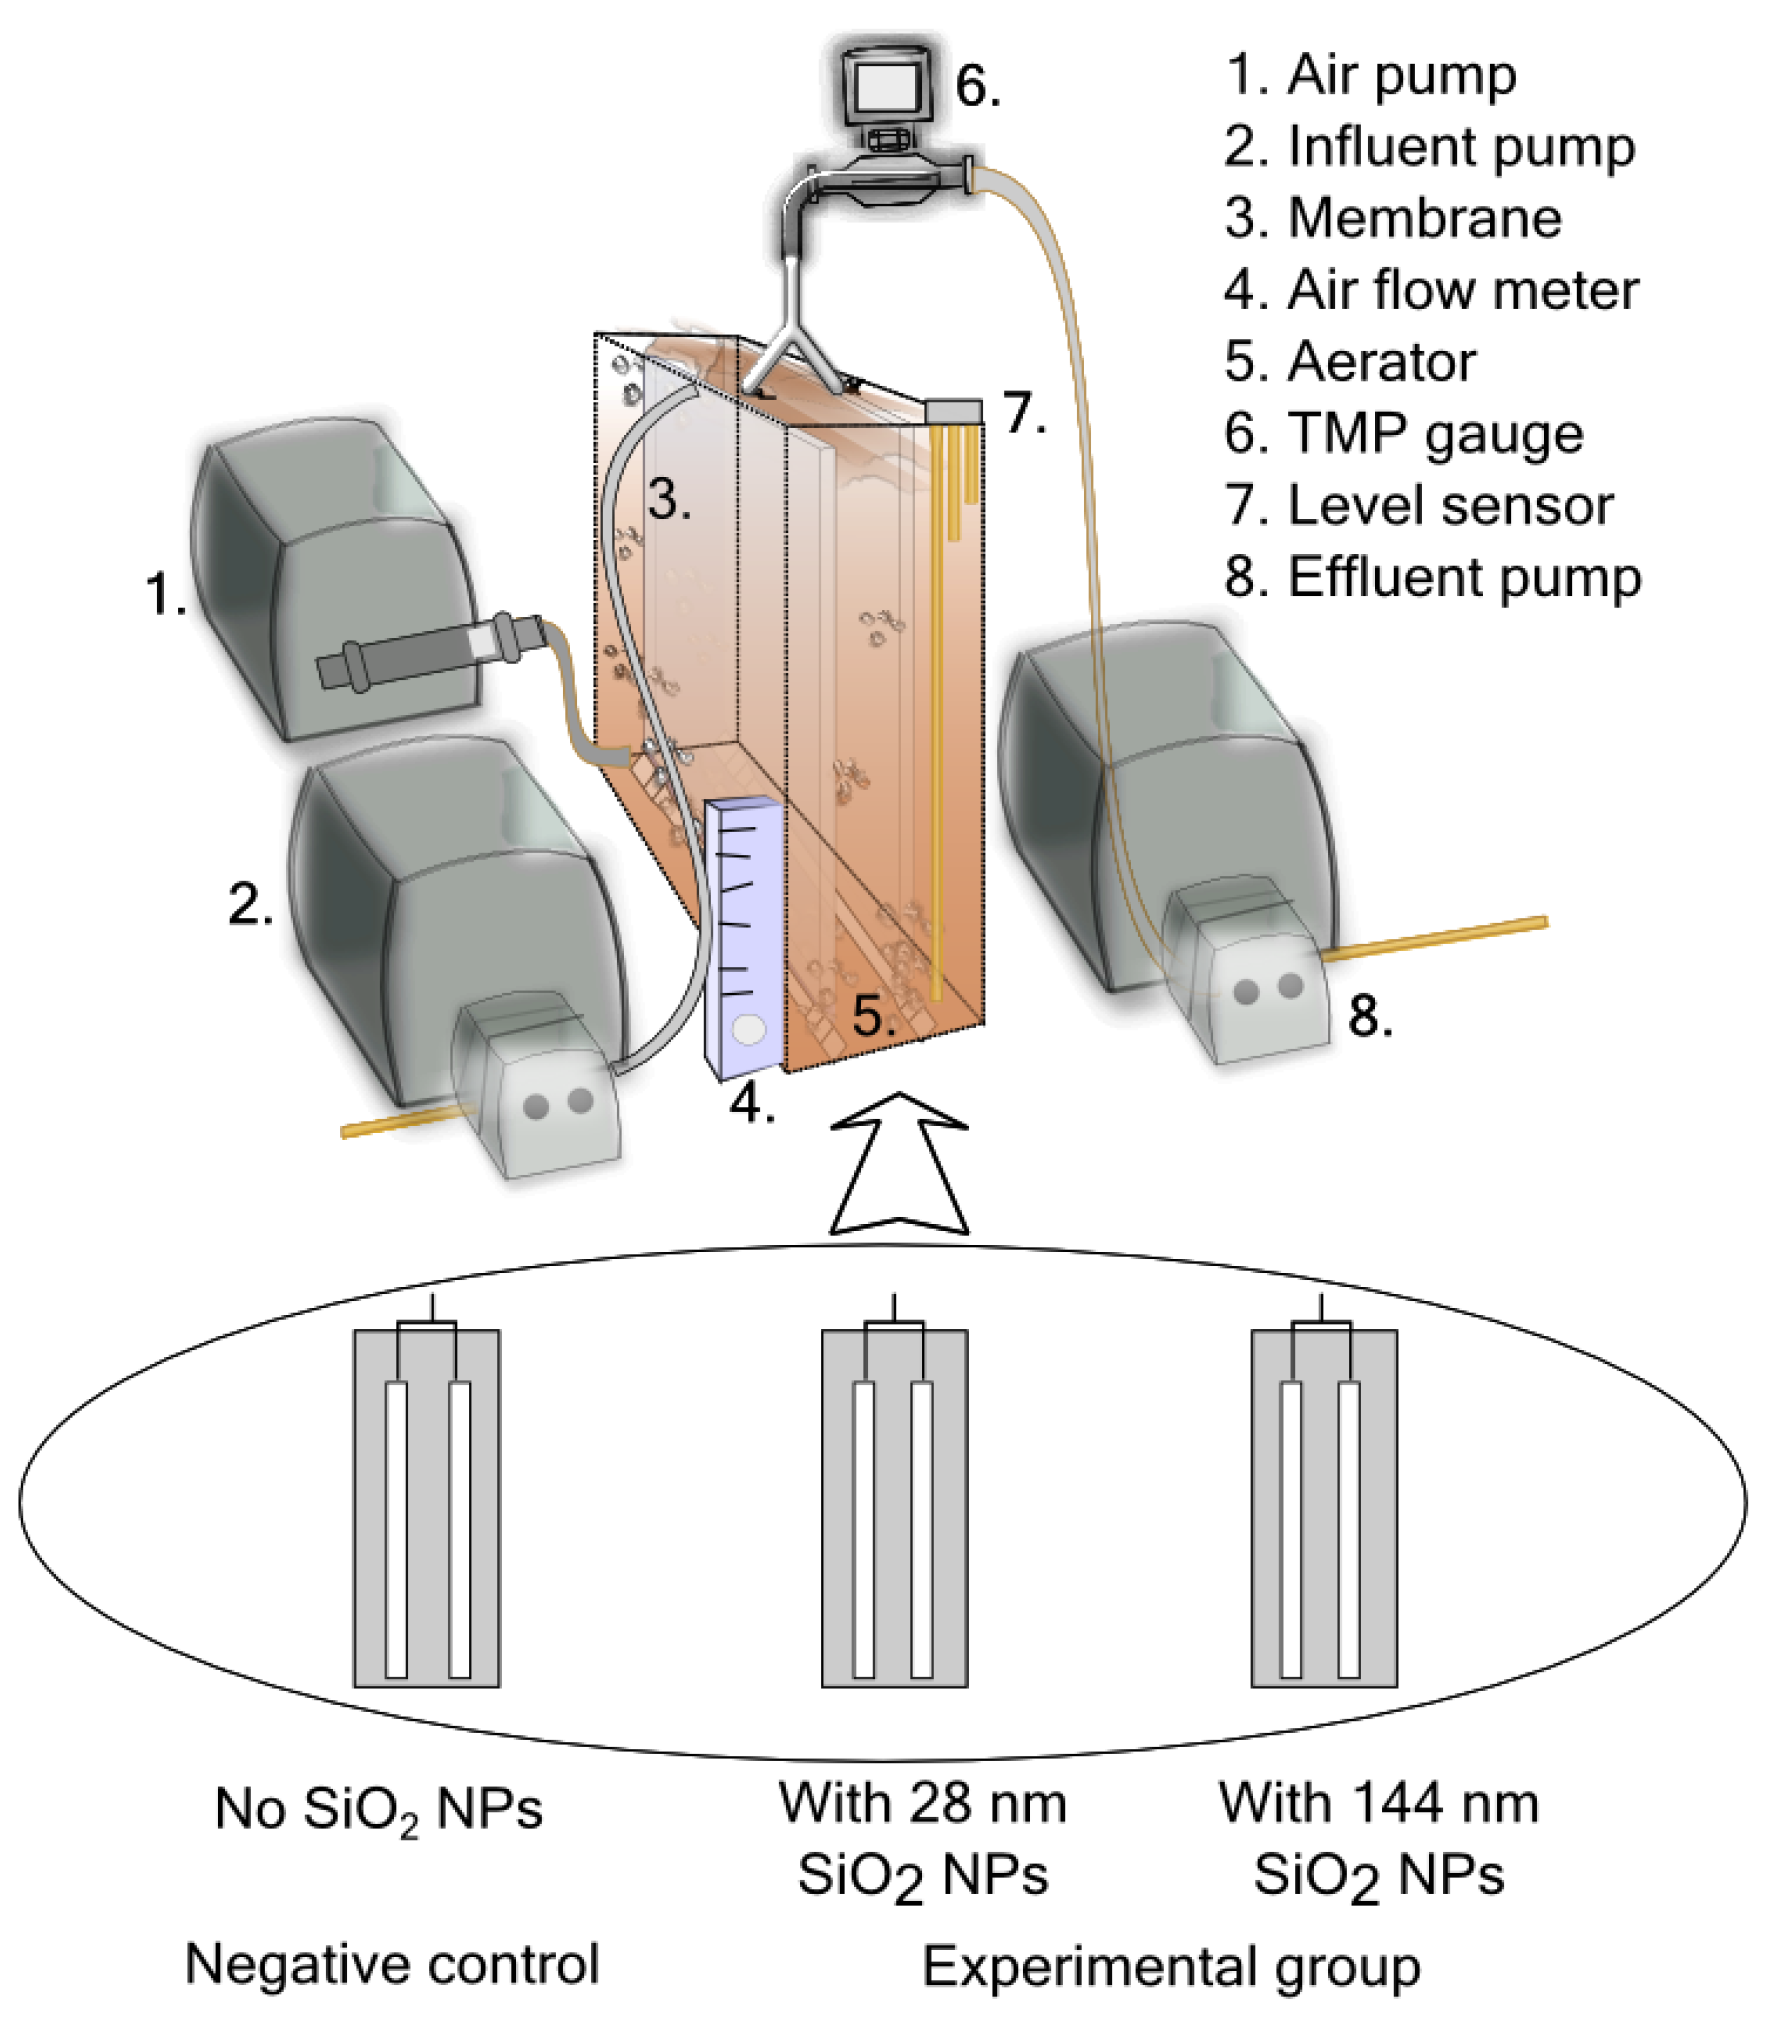
2.2. Continuous Lab-Scale MBR Experiments

2.2.1. Operating Conditions

Three lab-scale submerged MBRs (Figure 1) were set up, each having an effective reactor volume (V) of 6 L. One MBR setup served as the control setup, i.e., SiO2 NPs were not added to the influent. The two other MBR setups served as the experimental setups, i.e., SiO2 NPs were added to the influent. All the MBR setups were operated under the same conditions as follows: 6 h hydraulic retention time (HRT), 20 d solids retention time (SRT) and 10 L/(m2·h−1) influent/effluent flux. The average initial value of MLSS concentration of the three MBR setups was 4.2 g MLSS/L ± 0.46. The desired SRT was maintained by daily withdrawing 300 mL of activated sludge.
When the removal of COD and NH3–N in all MBR setups had become stable (the values did not change over time), 28 nm and 144 nm SiO2 NPs were separately added to the influent (on day 15) of each experimental MBR setup at a final concentration of 100 mg/L (SiO2, 0.01 wt. %).

2.2.2. Characterization of Activated Sludge

The pH (7 ± 1), dissolved oxygen (DO) (7 ± 1 mg O2/L) and temperature (22 ± 1 °C) of activated sludge were measured by using Thermo® probes (Thermo Fisher Scientific Inc., Waltham, MA, USA). Their values did not differ significantly between the control and the two experimental MBR setups [F(2,21) = 0.53, p > 0.05]. The MLSS and mixed liquor volatile suspended solids (MLVSS) were measured based on the Standard Methods [16]. Statistical significance of the difference between group means of data sets was determined by using one-way analysis of variance (ANOVA) and independent t-test (Origin Pro 8, OriginLab Corporation, Northampton, MA, USA). The same statistical analysis was done, where necessary, throughout the study.

2.2.3. Activated Sludge Respiration Inhibition Test

The oxygen uptake rate (OUR) was measured by using DO probes connected to a portable stand-alone data collection and analysis device (LabNavigator™, Forston Labs, Fort Collins, CO, USA). The samples were prepared as follows: 250 mL of the 300 mL waste sludge from each MBR setup was centrifuged at 4000 rpm and 4 °C for 15 min. The supernatant was discarded, the pellet was reconstituted with tap water and finally diluted to a final concentration of 3 g MLSS/L. From each dilution, 250 mL was obtained, mixed with 16 mL of Organization for Economic Cooperation and Development (OECD) 209 medium [17] and filled with tap water up to 500 mL.
The mixture containing activated sludge taken from the control MBR setup was designated as the control ( R T B ) mixture. The remaining two mixtures with activated sludge taken from the two experimental MBR setups were the test mixtures ( R T ) . In addition, 500 mL of the following abiotic control ( R T A ) mixtures were also tested: OECD 209 medium, 100 mg/L of 28 nm SiO2 NPs and 144 nm SiO2 NPs. The procedures were based on the OECD 209 test guidelines [17] and the inhibition of total respiration ( I T ) was calculated using the equation:
I T = [ 1 R T R T A R T B ] × 100 % .

2.2.4. Performance Evaluation

The concentrations of COD, NH3–N, total nitrogen (TN) and total phosphorus (TP) of both influent and effluent were measured three times a week by using water quality test kits (C-MAC Co., Ltd., Daejeon, Korea). The removal efficiency ( R ) was calculated using the equation:
R = C i   C e C i × 100 %
where C i and C e are concentrations of each parameter in the influent and effluent, respectively. All water quality measurements were performed using an Optizen UV-VIS spectrophotometer with pre-programmed water analysis methods (Mecasys Co., Ltd., Daejeon, Korea).

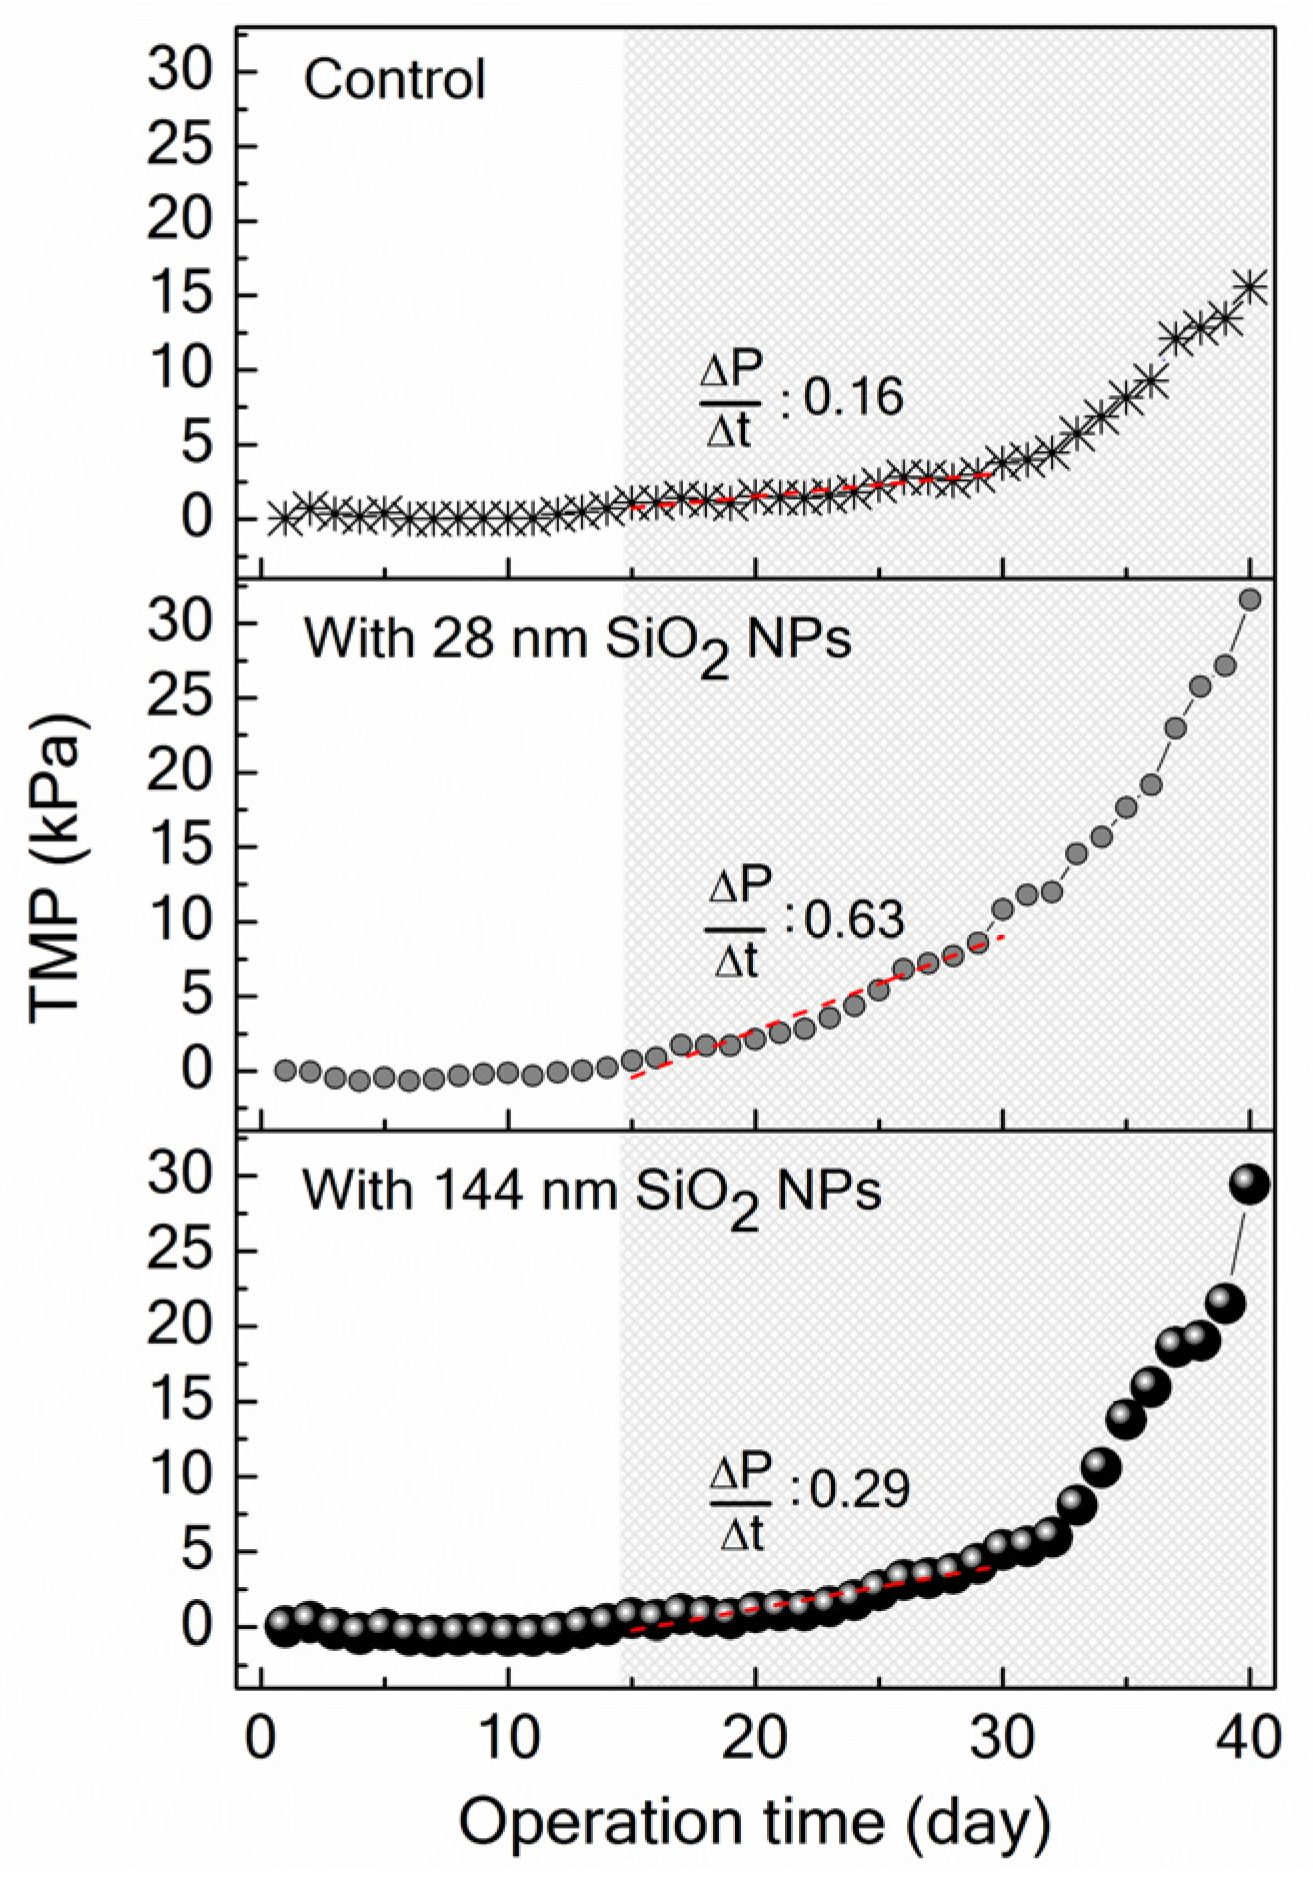
2.2.5. Transmembrane Pressure Monitoring

A pressure transmitter was installed in each MBR setup for on-line monitoring of the changes in the TMP. It converts the pressure, which is detected from the elastic deformation of the silicon diaphragm of the integrated sensor chip, into an electrical signal in the presence of an auxiliary electrical supply (Keller-Druck, Winterthur, Switzerland). The pressure transmitter was connected to a computer for continuous data collection through a LabVIEW program (National Instruments, Austin, TX, USA). The TMP profile of each MBR setup was compared based on the absolute value of the slope of the linear portion of TMP versus time plot, at select points in time, i.e., when the TMP of the two experimental MBRs increased relative to the control MBR.

2.3. Batch Experiments

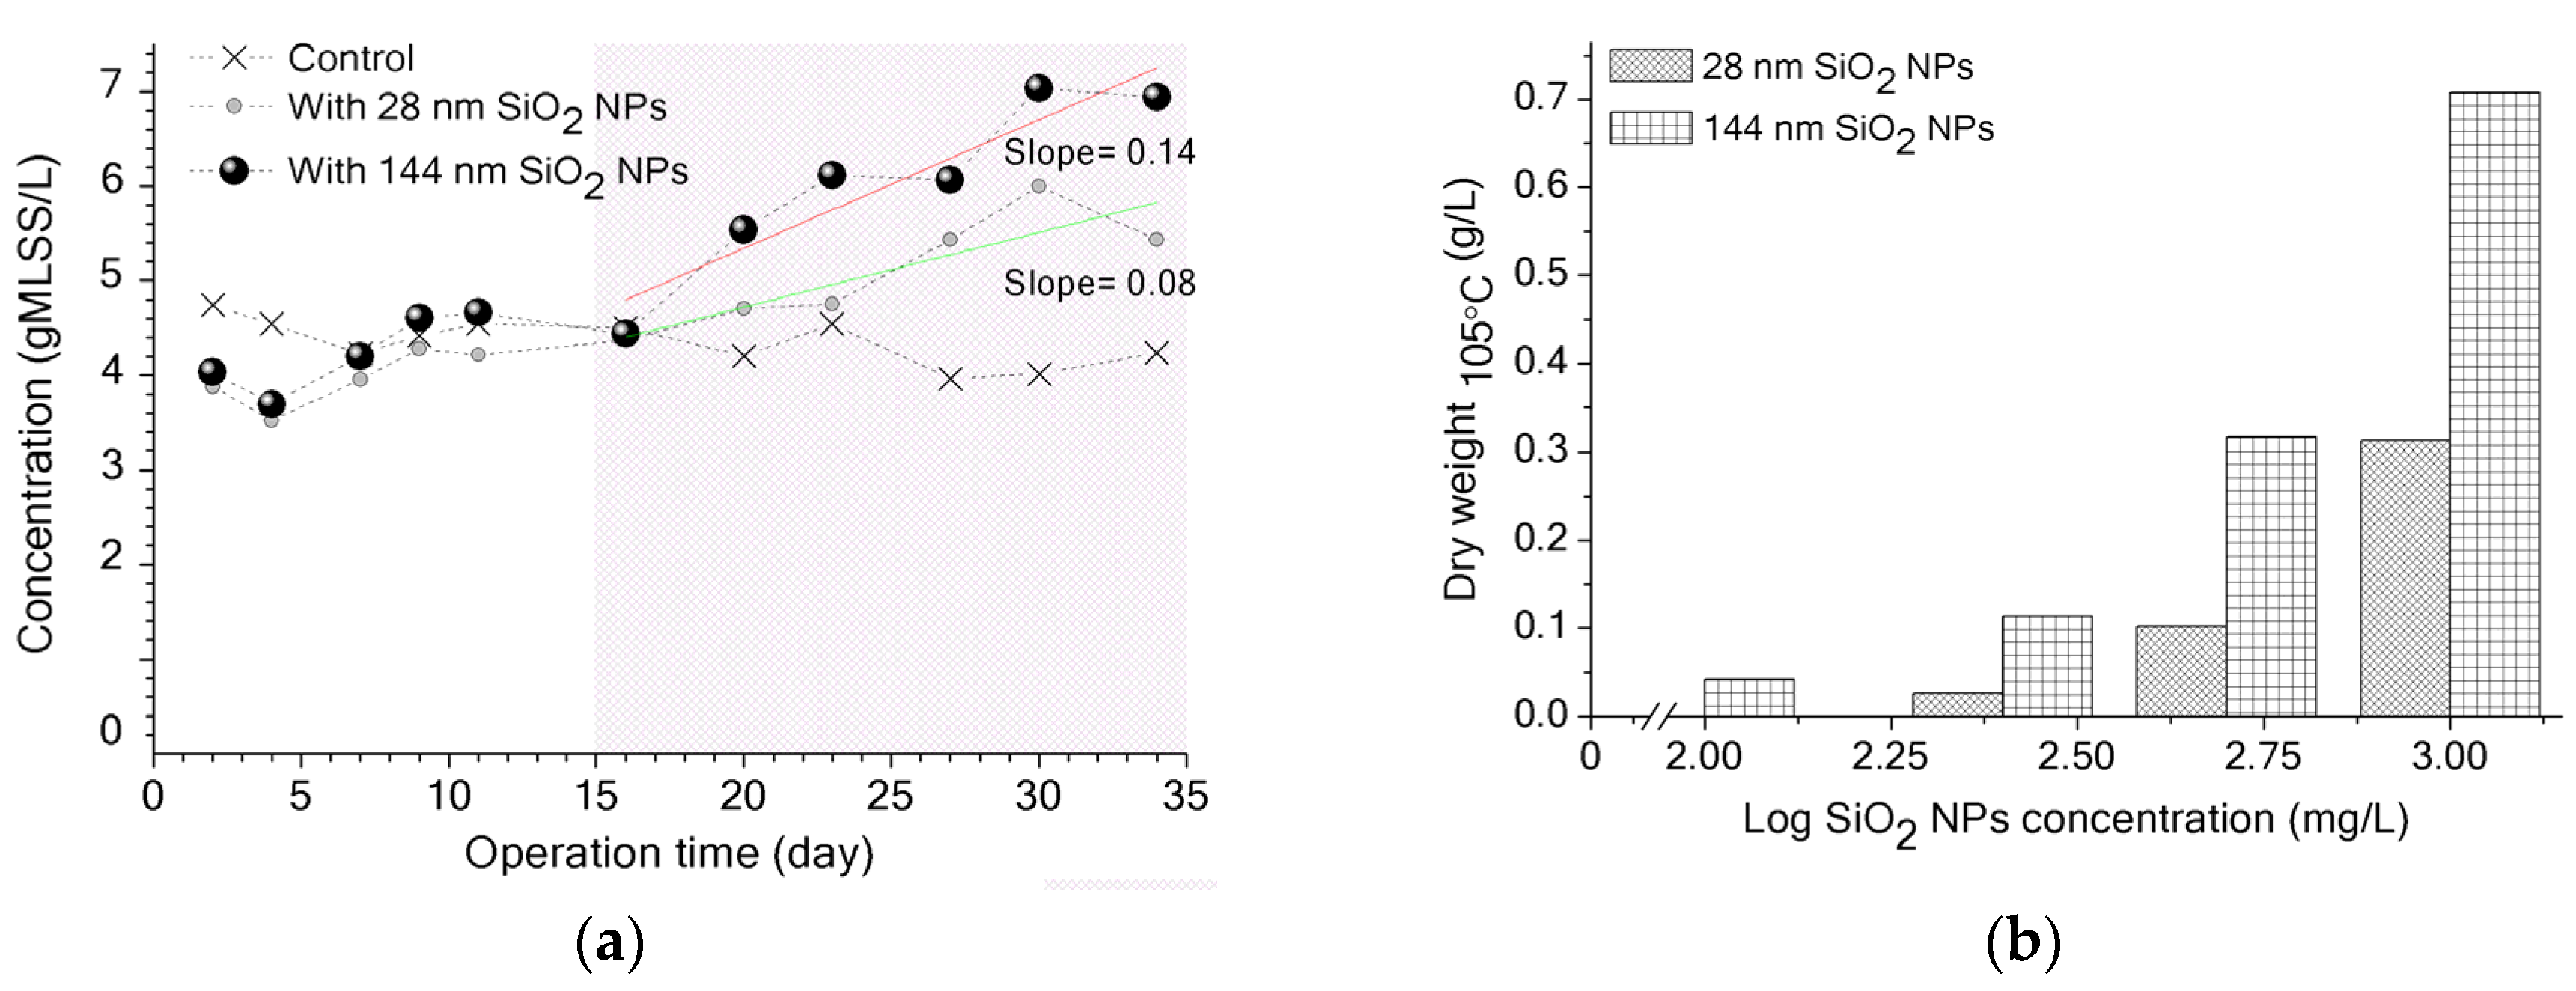
2.3.1. Influence of SiO2 NPs on MLSS Measurement

To evaluate the potential contribution of SiO2 NPs to the increase in MLSS values of activated sludge (assuming that or if some of them remained in activated sludge), 50 mg/L, 100 mg/L, 250 mg/L, 500 mg/L and 1000 mg/L each of 28 nm and 144 nm SiO2 NPs were subject to the same MLSS measurement as described on Section 2.2.2.

2.3.2. SiO2 NPs Settling Experiments and Dead-End Filtration Tests

A total of 200 mL each of 28 nm SiO2 NPs (1000 mg/L), 144 nm SiO2 NPs (1000 mg/L) and activated sludge (3 g MLSS/L) was prepared in the same but fresh synthetic wastewater. This group of samples served as controls. The experimental group was two mixtures consisting of each SiO2 NP plus activated sludge. The final concentrations of SiO2 NPs and activated sludge in the two mixtures were the same as those in the control group.
A series of settling experiments were conducted to investigate the colloidal stability of SiO2 NPs. The experimental and control groups were mixed by continuous magnetic stirring at 125 rpm (Daihan Scientific, Seoul, South Korea) for 30 min followed by gravitational settling for 3 h. DLS analysis of the decantate from each sample was done to determine the hydrodynamic size of the dispersed particles present as described in Section 2.1. A batch dead-end filtration test of each samples from the control group (except activated sludge) and experimental group was conducted at 5 kPa, and DLS analysis was done to confirm the presence of SiO2 NPs in the permeate.
A series of batch dead-end filtration tests were also conducted as described elsewhere [18,19,20], but the applied pressure was increased in a step-wise fashion during each run of batch dead-end filtration test. A detailed and determinative investigation of membrane fouling was unnecessary since we only aimed at briefly comparing the fouling trend observed during the continuous MBR experiments to that during the batch dead-end filtration; thus only for relative comparison. The total resistance ( R T ) was determined from each constant pressure data using the expression:
J = Δ P μ R T
The effect of SiO2 NPs on activated sludge microfiltration was investigated over a range of TMP ( Δ P ), from 5 kPa to 35 kPa at a 5-kPa interval. We used a 180-mL unstirred cell unit (Amicon 8200, Amicon™, Danvers, MA, USA) and a 28.7 cm2 ( A ) C-PVC membrane that we cut from one whole sheet of the membrane. A new membrane was used in every batch dead-end filtration test and the permeate flux of deionized water ( J C W ) through the membrane at a given pressure was measured [21]. The values of permeate flux ( J ) obtained from all of samples were normalized by their respective J C W values. The filtrate viscosity ( μ ) was measured by using a DV-II+Pro viscometer (Brookfield AMETEK, Inc., Middleboro, MA, USA) following the manufacturer’s instructions.

3. Results and Discussion

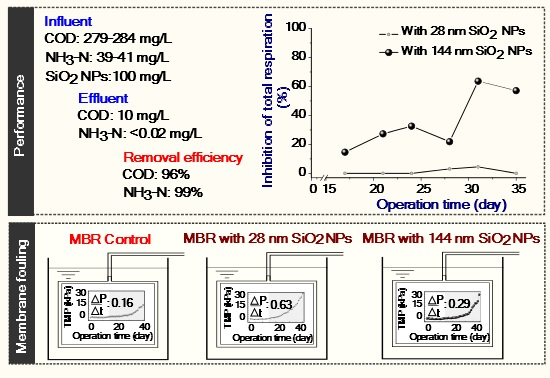
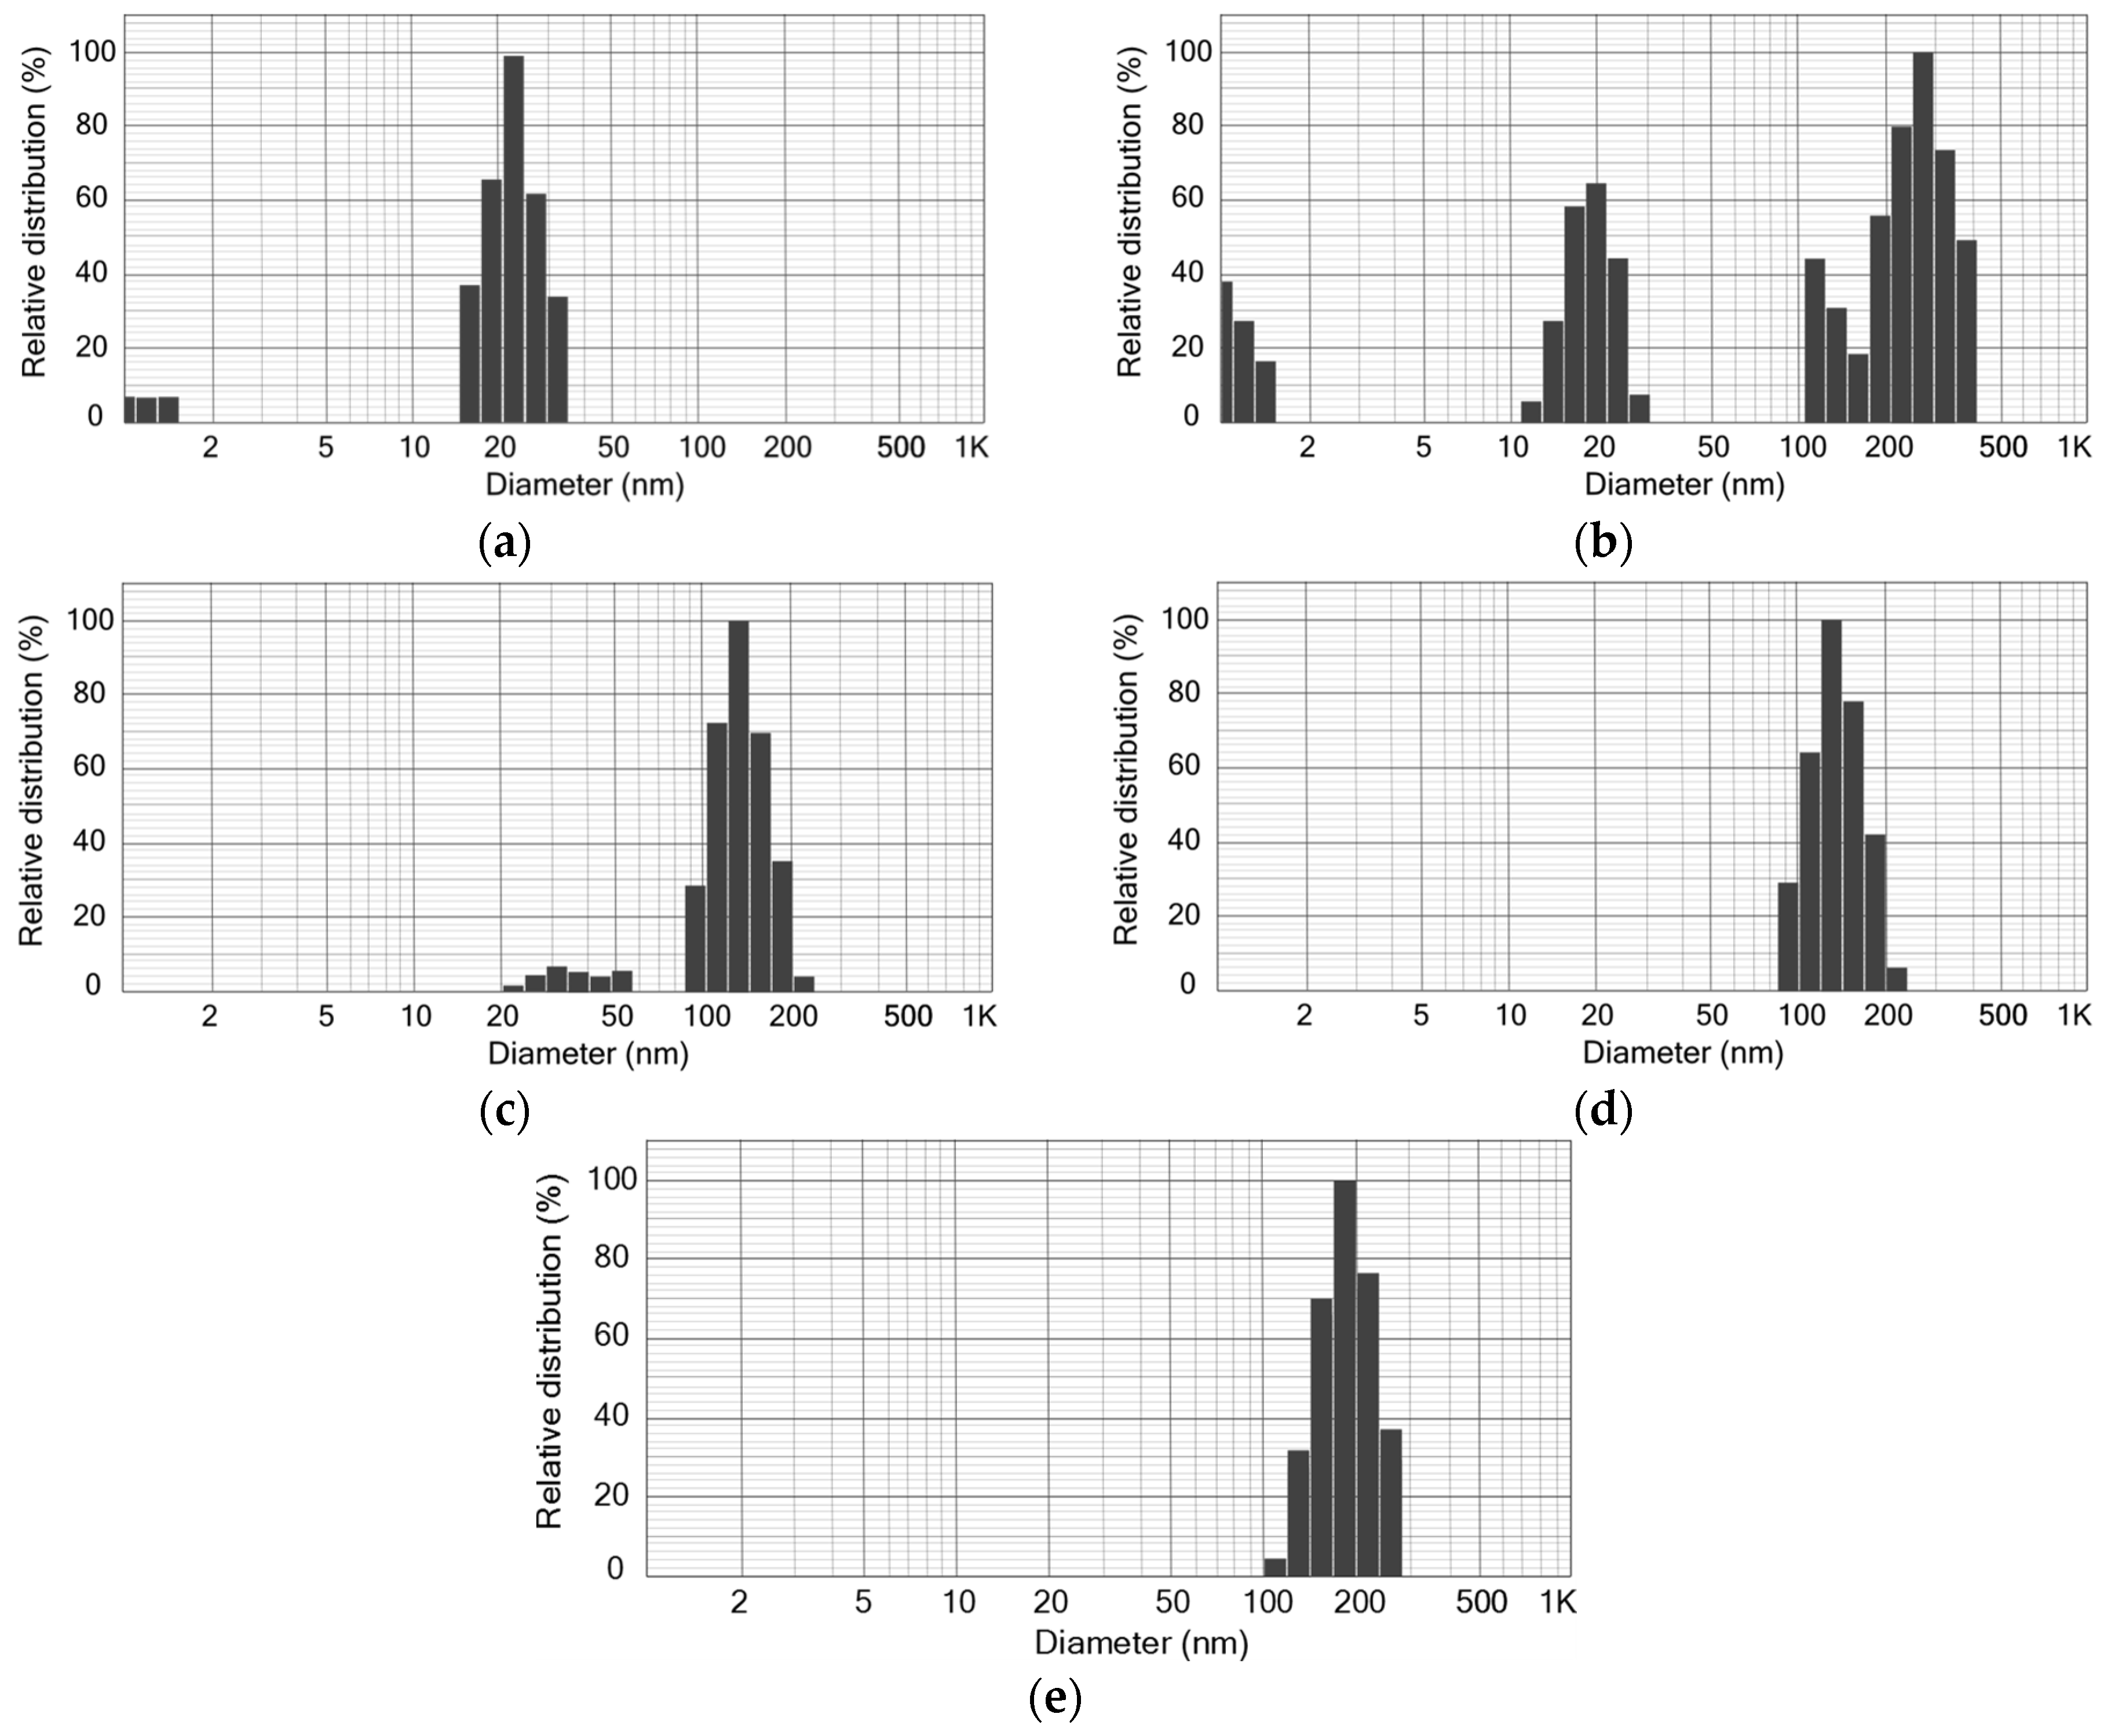
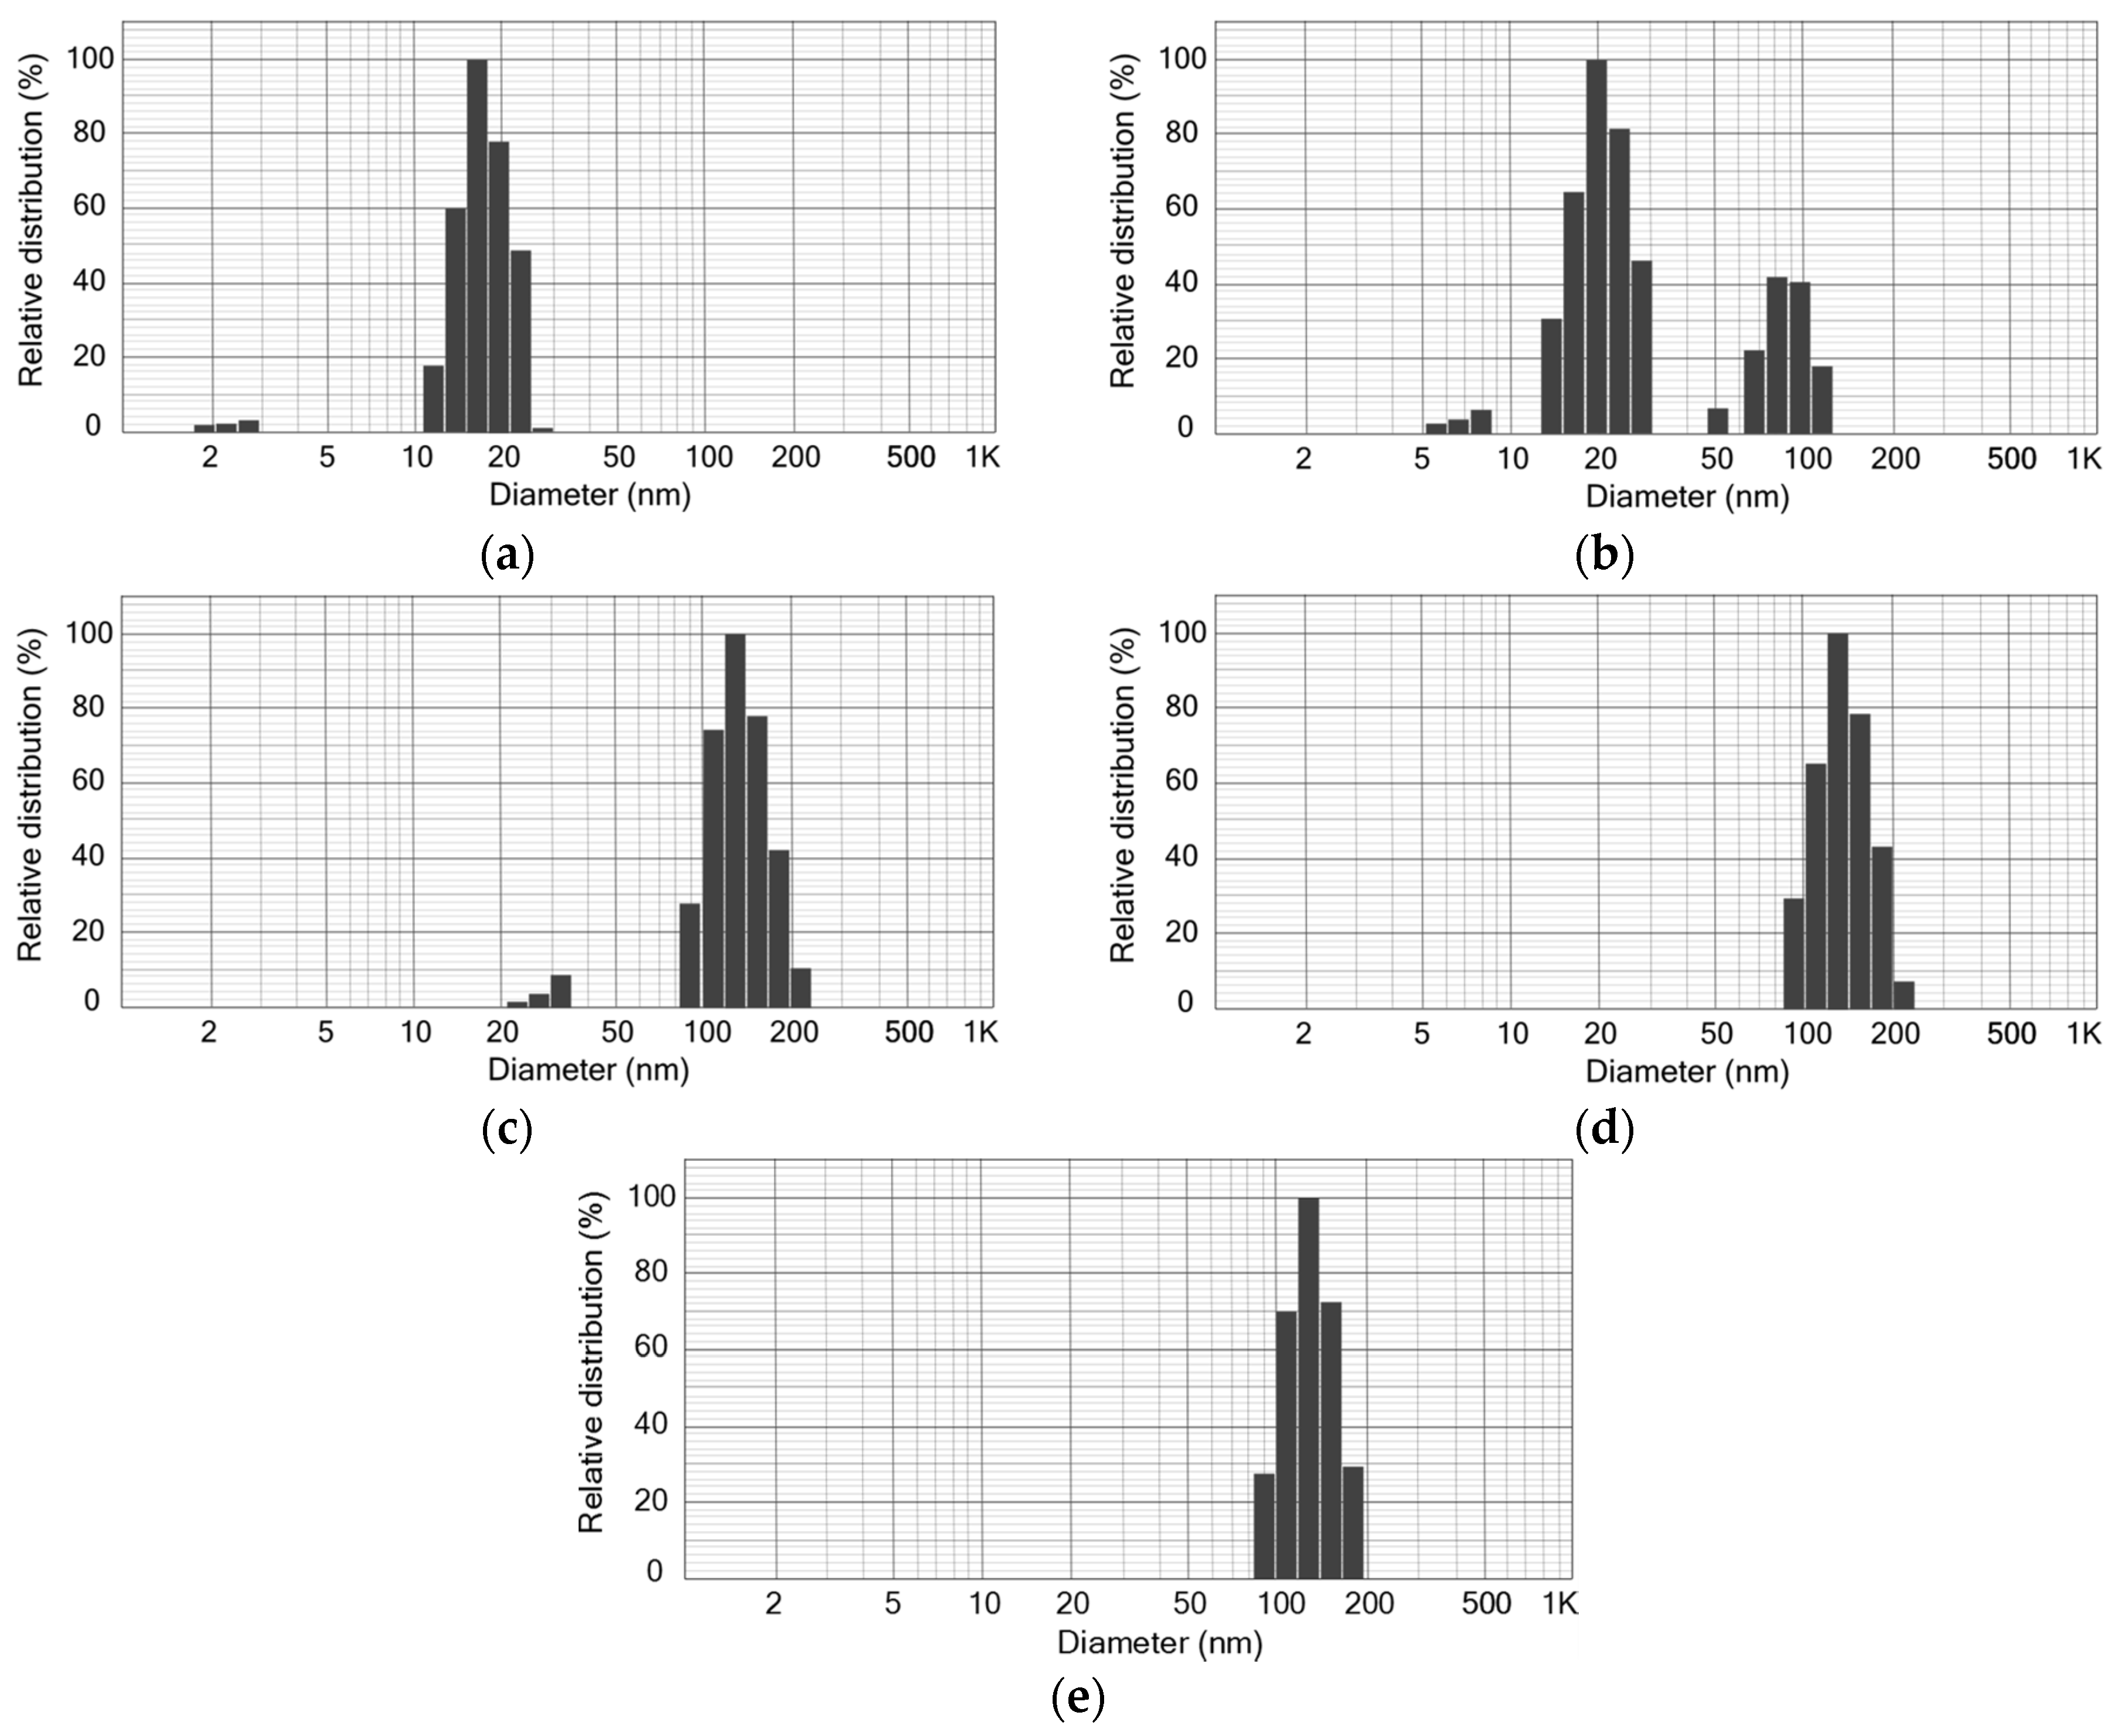
3.1. Retention of SiO2 NPs in MBR

The evolution of MLSS following the addition of SiO2 NPs in the two experimental MBR setups (Figure 2a) indicates retention of SiO2 NPs in the mixed liquor. Unlike that in the control MBR setup, the MLSS concentration in the experimental MBR setups was increased by 0.08 g MLSS/L/d (with 28 nm SiO2 NPs) and 0.14 g MLSS/L/d (with 144 nm SiO2 NPs). MLVSS measurements in both the control MBR and experimental MBR setups, which did not differ significantly from each other (F(2,21) = 3, p > 0.05), confirm that the increasing MLSS concentration is non-biomass-related and is due to the accumulation of SiO2 NPs. Subsequent batch experiments with pure SiO2 NPs further confirm the contribution of SiO2 NPs to MLSS measurement due to their accumulation; 1000 mg/L SiO2 NPs contributed as much as 0.3 g/L and 0.7 g/L for 28 nm and 144 nm SiO2 NPs, respectively (Figure 2b).
At the end of the experiment, the final MLSS concentration in the experimental MBR setups relative to the control MBR setup (4.2 g MLSS/L) increased by 28% (with 28 nm SiO2 NPs) and 64% (with 144 nm SiO2 NPs). Converting these percentage increases in MLSS concentration to wt. % SiO2 NPs, approximately 0.12 wt. % of 28 nm SiO2 NPs and 0.27 wt. % of 144 nm SiO2 NPs were present in the experimental MBR setups. Considering 29.38 g as the total input of SiO2 NPs over the period of 15 days of operation (19.584 L/d × 15 d × 100 mg/L SiO2 NPs), the estimated retention of 28 nm SiO2 NPs and 144 nm SiO2 NPs in the MLSS of MBR was 4% and 9%, respectively.
The results demonstrate that some of the SiO2 NPs accumulate in the mixed liquor despite their size being smaller than the membrane pore size, thus confirming actual exposure of activated sludge to SiO2 NPs. This is particularly important to subsequently evaluating the potential outcomes of the exposure of activated sludge to SiO2 NPs in an MBR.
With the substantial stability of SiO2 NPs due to their low point of zero charge in wastewater (pH < 3.5) [1], some are most likely retained in the mixed liquor. For instance, in the secondary treatment of a CAS that involves deliberate settling of activated sludge, poor aggregation/sedimentation of SiO2 NPs was observed [2] and for that same reason may hold true in activated sludge of an MBR. We demonstrated this in a batch settling experiment followed by DLS analysis of the decantate, where particles with nearly 28 nm and 144 nm size distribution were detected, suggesting the retention of SiO2 NPs in the dispersion medium (synthetic wastewater and/or activated sludge) (Figure 3a–d). Meanwhile, particles of approximately between 100 nm to 400 nm were also present in the sample containing a mixture of 28 nm SiO2 NPs and activated sludge (Figure 3b), suggesting that some colloidal particles from activated sludge remain dispersed along with SiO2 NPs. These colloidal particles from activated sludge, however, are apparently not detectable in the sample containing a mixture of 144 nm SiO2 NPs and activated sludge (Figure 3d) for some unknown reasons. We suspect that they may be present but overshadowed by the dominant presence of 144 nm SiO2 NPs in the sample.
In an MBR, the estimated values for the retention of SiO2 NPs may be expected to be lower than those reported in a CAS (35%) [2]. This is reasonable because of (1) the continuous aeration in an MBR that further keeps SiO2 NPs dispersed in the mixed liquor, (2) the suction pressure that facilitates their discharge into the effluent stream and (3) the size of SiO2 NPs being smaller relative to the membrane pore size that allows them to easily pass through the membrane. DLS analysis confirms the presence of 28 nm SiO2 NPs and 144 nm SiO2 NPs in the permeate (Figure 4). In addition, it is clear from DLS analysis that other than the SiO2 NPs, some colloidal particles from activated sludge of approximately less than 100 nm can also pass through the membrane (Figure 4b). The mean floc size of activated sludge used in the dead-end filtration tests was 7.5 um (25% of distribution < 3.8 um, 50% of the distribution < 5.9 um). In an MBR system, the average size of activated sludge flocs can be as small as 5 um and as large as 240 um [9]. In the decantate (after allowing the activated sludge to settle), there remained particles with an average size of 191 nm (Figure 3e) while in the permeate (after filtration of activated sludge), 123 nm particles were detected (Figure 4e). Together, the results prove that some of the SiO2 NPs remain in the mixed liquor of an MBR, thus allowing potential interaction with activated sludge.

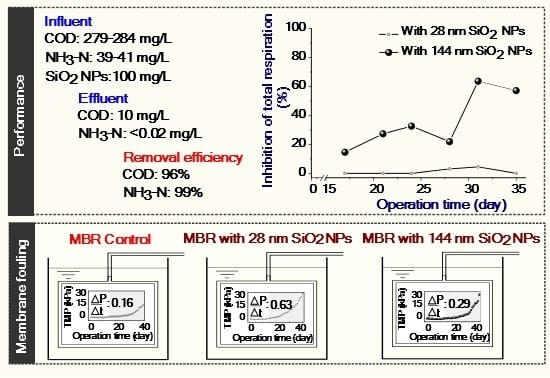
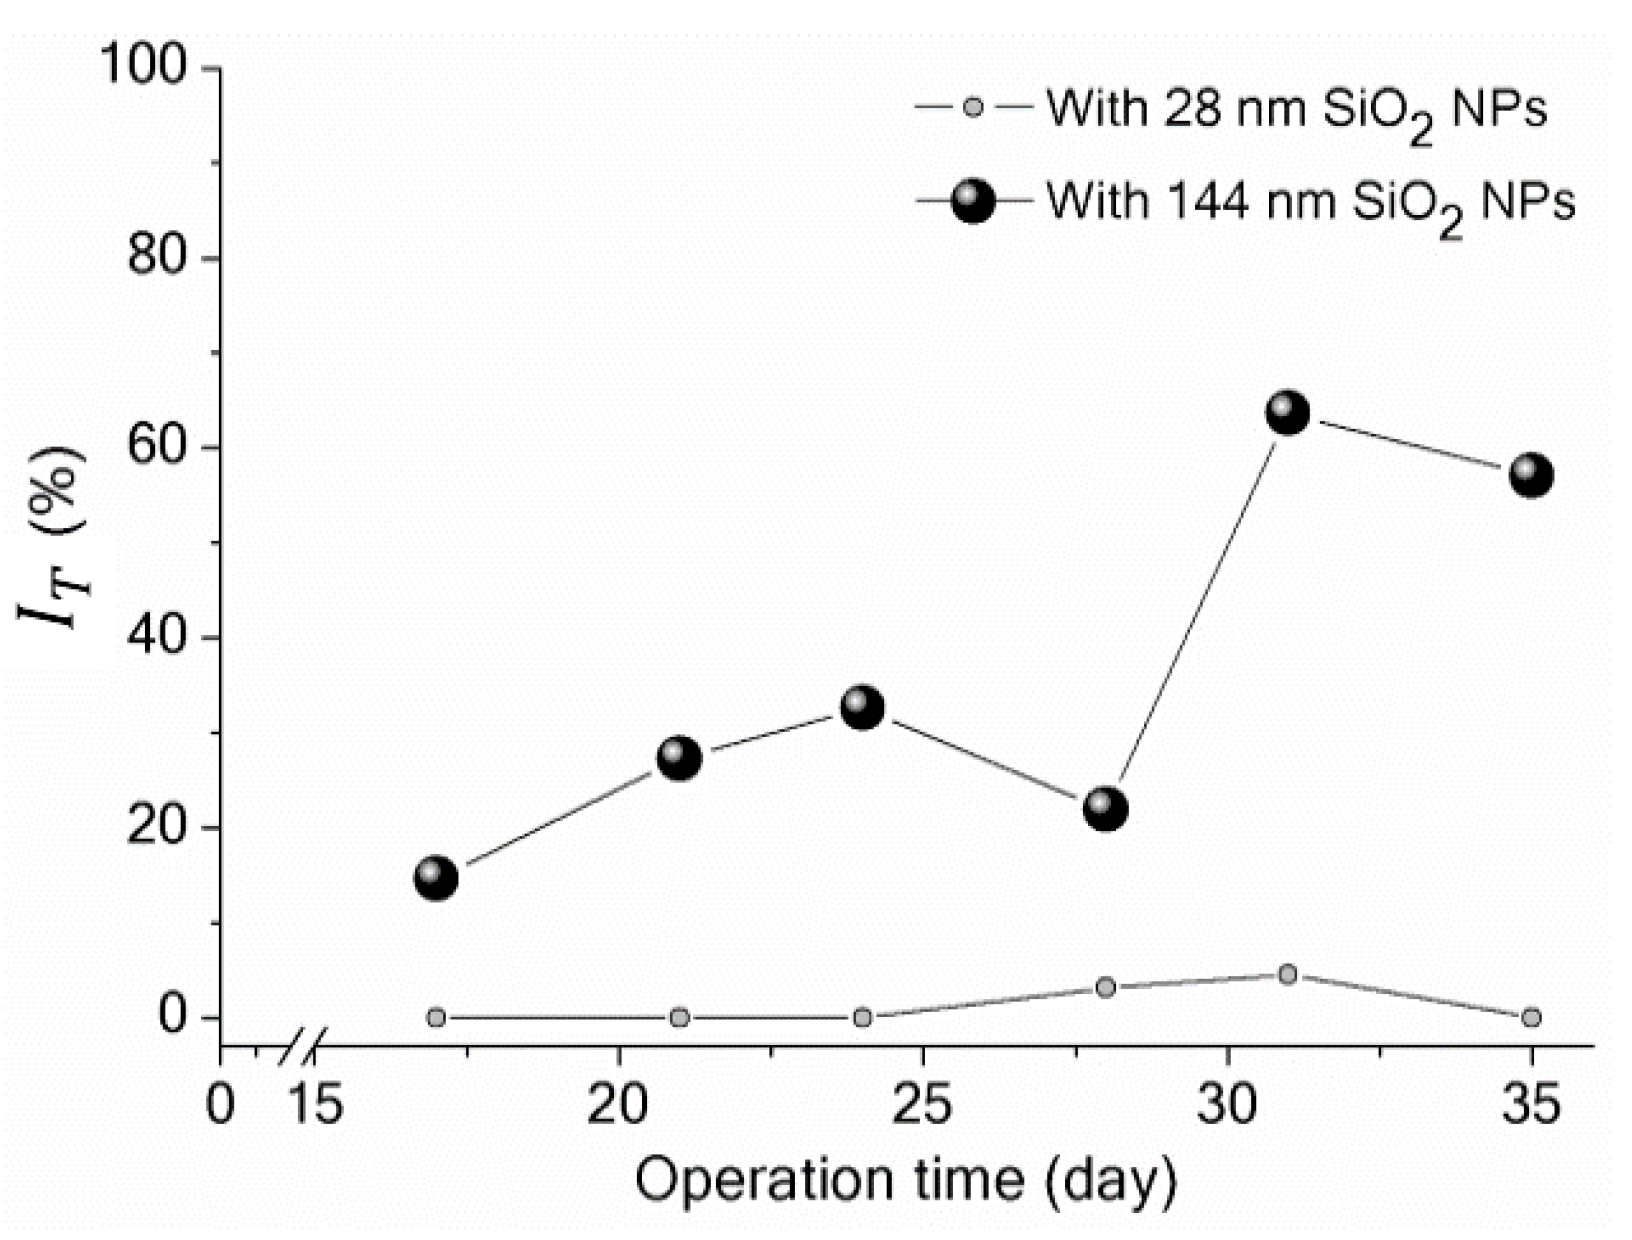
3.2. Potential Biological Effect of SiO2 NPs on Activated Sludge and MBR Performance

That the total respiration decreased in the two experimental MBR setups indicates the potential biological effect of activated sludge exposure to SiO2 NPs. The maximum I T by SiO2 NPs was as low as 5% (with 28 nm SiO2 NPs) and as high as 60% (with 144 nm SiO2 NPs) (Figure 5).
The lesser inhibitory effect of 28 nm SiO2 NPs compared with that of 144 nm SiO2 NPs may be due to the relatively lower retention of 28 nm SiO2 NPs in an MBR. Despite the same initial concentration of SiO2 NPs in the influent of the two experimental MBR setups, the estimated amount of SiO2 NPs in the mixed liquor actually differed (Figure 2) as did the extent of activated sludge exposure to SiO2 NPs.
The size-dependent toxicity of nanoparticles has been widely reported in literature, particularly in studies of nanoparticle toxicity in pure culture bacteria [22,23]. Previously, we have shown in batch experiments that smaller SiO2 NPs (~12 nm and ~151 nm) were more inhibitory than the larger SiO2 NPs (442 nm and 683 nm) given that the concentration or dose did not change throughout the period of study [24]. The size-dependent toxicity of nanoparticles observed from these studies is most likely due to their greater surface area [25]. However, size-dependent toxicity was not observed in the present study. One reason is that despite the same initial SiO2 NPs concentration, the exposure to 28 nm SiO2 NPs and their respiration inhibitory effect are less than those of 144 nm SiO2 NPs because the smaller SiO2 NPs can easily pass through the membrane, thus having lower retention in MBR activated sludge. Lower retention could mean lower exposure of MBR-activated sludge to SiO2 NPs.
Of the several possible mechanisms of nanoparticle-induced toxicity reviewed in the literature [26], oxidative stress, release of toxic cations and change in protein conformation mainly stand out [27]. However, there is no conclusive evidence for the mechanism of SiO2 NPs inhibition of activated sludge total respiration although indirect evidence from fatty acid methyl ester (FAME) analysis of activated sludge suggests that SiO2 NPs altered the composition of the microbial membrane lipids [24]. The potential biological effects of SiO2 NPs on activated sludge warrants further investigations, especially because in nanotoxicity the key role of the interaction of nanoparticles (including SiO2 NPs) with proteins, which are also a component of activated sludge extracellular polymeric substances (EPS), has been recognized recently [28,29,30].
Similar to that observed in a CAS for yet unclear reasons, activated sludge exposure to SiO2 NPs [8] and their inhibitory effect on total respiration [24] were also not associated with low oxidation of COD and NH3. Over a period of 20 days after the exposure of activated MBR to SiO2 NPs, IT in the presence of 144 nm SiO2 NPs (M = 37, SD = 7) was higher than with 28 nm SiO2 NPs (M = 8, SD = 9), t(10) = −6, p < 0.05. However, there was no statistically significant effect of exposure to both SiO2 NPs on the removal of COD (F(2,15) = 0.08, p > 0.05) and NH3–N (F(2,13) = 0.003, p > 0.05). The removal of TN (F(2,24) = 0.32, p > 0.05) and TP (F(2,24) = 1, p > 0.05) also did not statistically differ between the control and the experimental setups. The overall performance of the control and experimental setups based on the removal of organic matter and nutrients are summarized in Table 1. Although it may be disregarded as a potential threat to the process performance of an MBR, the retention of SiO2 NPs in the mixed liquor may pose a risk of membrane fouling [31,32].

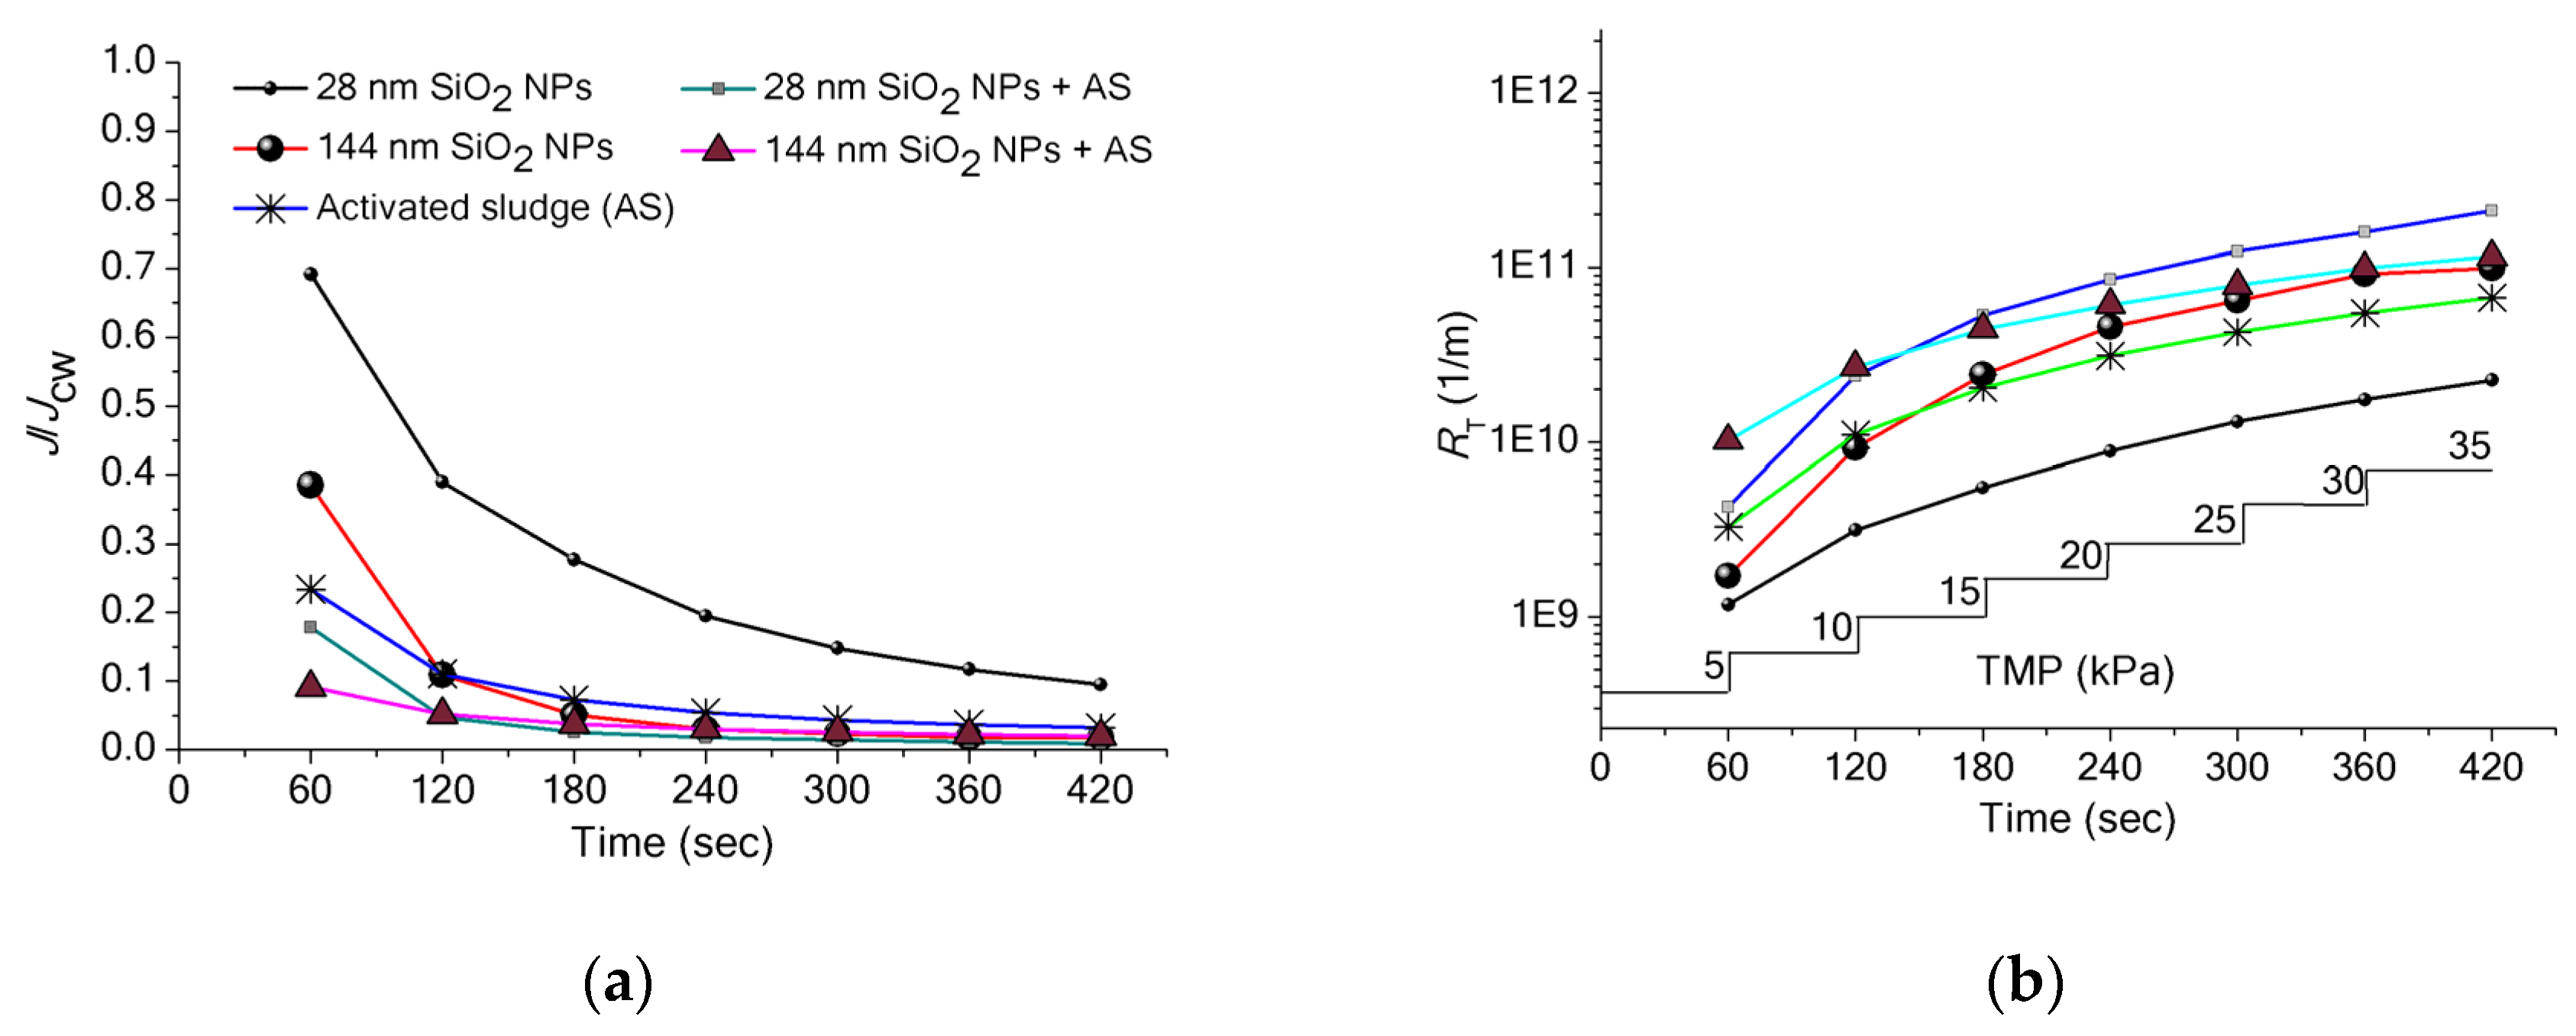
3.3. Implications of SiO2 NPs Retention for Membrane Fouling in an MBR

The slope of the linear portion of the TMP versus time plot of the two experimental MBR setups was relatively higher than that of the control MBR setup (Figure 6). This indicates an occurrence of membrane fouling that is apparently related to the relatively smaller SiO2 NPs (28 nm). The difference in the TMP values between the control and the experimental setups (with 28 nm SiO2 NPs and 144 nm SiO2 NPs) was statistically significant (F (2,78) = 4, p = 0.03). The TMP monitoring data agree with the observations from previous studies regarding the effects of colloidal particles, having relatively smaller size than the membrane pores, on microfiltration. We could infer that the most likely nature of the observed membrane fouling in the experimental MBR is pore plugging [13], although particle accumulation on the membrane surface [12] could also be responsible for this.
The SiO2 NPs, being in the “colloidal size range” between 1 nm and 1000 nm [33], are actually colloids [30]. Colloids are also implicated in membrane fouling, which we specifically refer to as colloidal fouling in the following discussion. Colloidal fouling is a phenomenon typical [31,34,35] but not exclusive to microfiltration processes [13,36,37]. It is influenced by some factors including colloidal particle size, applied pressure and the interaction with other colloidal particles that may be present in activated sludge [11,38,39].
However, the effect of each factor may differ depending on the extent of the other factor. We observed this during the comparative evaluation of permeate flux and total resistance of SiO2 NPs only (28 nm and 144 nm) and a mixture of each SiO2 NPs and activated sludge at increasing TMP during the dead-end filtration tests.
All samples exhibit an initially decreasing permeate flux that levels off towards the end of the range of TMP tested. Alone (as a dispersion) or when mixed with activated sludge, the 28 nm SiO2 NPs exhibited a higher permeate flux than did the 144 nm SiO2 NPs. However, in the experimental group, although the presence of both SiO2 NPs in activated sludge decreases the permeate flux during the initial low-pressure stage, which can be as low as low as 30% (28 nm SiO2 NPs) and as high as 74% (144 nm SiO2 NPs), the permeate flux decline equalizes as TMP further increases from 10 kPa to 35 kPa (Figure 7). The results clearly show that SiO2 NPs can reduce permeate flux during microfiltration of activated sludge.
All samples also show an increasing total resistance over the range of TMP tested. The experimental group generally exhibits a higher total resistance, suggesting that the presence of SiO2 NPs can aggravate membrane fouling. Unlike the SiO2 NPs alone, the 144 nm SiO2 NPs when mixed with activated sludge, exhibit a higher total resistance only at the initial stage when the pressure is between 5 kPa and 10 kPa. The 28 nm SiO2 NPs-activated sludge mixture increases further and surpasses the 144 nm SiO2 NPs at much higher pressures (Figure 7).
In the experimental group, we suspect that the difference in the transport characteristics [36] of the two SiO2 is responsible for the difference in their values of permeate flux decline and total resistance at the initial low-pressure stage. Unlike the 28 nm SiO2 NPs, the 144 nm SiO2 NPs are more easily retained in a cake layer along with other particles originating from activated sludge so they exert more hydraulic resistance and a corresponding permeate flux decline (Figure 7). However, as TMP further increases over time (Figure 6), SiO2 NPs accumulate but the smaller particles form a more compact structure with less degree of porosity [11] as do the 28 nm SiO2 NPs along with other particles originating from activated sludge. This likely explains the observed further decreases in permeate flux and an increasing total resistance in the mixture of 28 nm SiO2 NPs and activated sludge. Although our results clearly demonstrate that SiO2 NPs aggravate membrane fouling in an MBR, it is possible that other factors that were not examined in this study, for example, the size of activated sludge flocs after exposure to SiO2 NPs, also contributed to membrane fouling. A recent study has shown that SiO2 NPs at a final tested concentration of 100 mg/L improved flocculation ability of activated sludge after 24 h of exposure. The improved flocculation resulted from the decrease in the interaction barrier between activated sludge flocs as they were exposed to SiO2 NPs [40]. The clear identification and differentiation of the mechanisms of membrane fouling observed in our study shall be considered for further investigations.

4. Conclusions

The retention of SiO2 NPs in an MBR has no adverse effect on the removal of COD and NH3–N despite the observable inhibition of total respiration in activated sludge. However, it contributes to membrane fouling that results in TMP increases for a given flux, or conversely it can considerably reduce the permeate flux at a given TMP. More specifically, the presence of smaller SiO2 NPs in activated sludge, contrary to that of the larger counterparts, eventually exerts higher total resistance as the TMP increases, although a substantial flux decline can already be observed at low TMP. As our results, which are similar to those in a CAS, show no detrimental effect of SiO2 NPs on the overall performance of an MBR, we anticipate that future studies will further investigate the interaction of SiO2 NPs with activated sludge in an MBR, which is apparently where the challenge in fouling control lies.

Acknowledgments

This research was supported by a grant from the Korean Ministry of Environment (MOE) as “The advancement of scientific research and technology development in environmental science program (2013001340004)”.

Author Contributions

Mark Larracas Sibag and Jinwoo Cho conceived and designed the experiments; Mark Larracas Sibag and Soo Mi Lee performed the experiments; Mark Larracas Sibag and Soo Mi Lee analyzed the data; Jinwoo Cho and Hee Jun Kim contributed reagents/materials/analysis tools; Mark Larracas Sibag, Soo Mi Lee, Hee Jun Kim and Jinwoo Cho contributed to the writing of the manuscript.

Conflicts of Interest

The authors declare no conflict of interest.

Abbreviations

The following abbreviations are used in this manuscript:
CAS
Conventional activated sludge
COD
Chemical oxygen demand
DLS
Dynamic light scattering
TMP
Transmembrane pressure
MBR
Membrane bioreactor
C-PVC
Chlorinated polyvinyl chloride
DO
Dissolved oxygen
MLSS
Mixed liquor suspended solids
MLVSS
Mixed liquor volatile suspended solids
OUR
Oxygen uptake rate
OECD
Organization for economic cooperation and development
TN
Total nitrogen
TP
Total phosphorus

References

  1. Otero-González, L.; Barbero, I.; Field, J.A.; Shadman, F.; Sierra-Alvarez, R. Stability of alumina, ceria, and silica nanoparticles in municipal wastewater. Water Sci. Technol. 2014, 70, 1533–1539. [Google Scholar] [CrossRef] [PubMed]
  2. Otero-González, L.; Field, J.A.; Calderon, I.A.; Aspinwall, C.A.; Shadman, F.; Zeng, C.; Sierra-Alvarez, R. Fate of fluorescent core-shell silica nanoparticles during simulated secondary wastewater treatment. Water Res. 2015, 77, 170–178. [Google Scholar]
  3. Brar, S.K.; Verma, M.; Tyagi, R.D.; Surampalli, R.Y. Engineered nanoparticles in wastewater and wastewater sludge—Evidence and impacts. Waste Manage. 2010, 30, 504–520. [Google Scholar] [CrossRef] [PubMed]
  4. Mohanty, A.; Wu, Y.; Cao, B. Impacts of engineered nanomaterials on microbial community structure and function in natural and engineered ecosystems. Applied Microbiol. Biot. 2014, 98, 8457–8468. [Google Scholar] [CrossRef] [PubMed]
  5. Kiser, M.A.; Ryu, H.; Jang, H.; Hristovski, K.; Westerhoff, P. Biosorption of nanoparticles to heterotrophic wastewater biomass. Water Res. 2010, 44, 4105–4114. [Google Scholar] [CrossRef] [PubMed]
  6. Park, H.J.; Kim, H.Y.; Cha, S.; Ahn, C.H.; Roh, J.; Park, S.; Kim, S.; Choi, K.; Yi, J.; Kim, Y.; Yoon, J. Removal characteristics of engineered nanoparticles by activated sludge. Chemosphere 2013, 92, 524–528. [Google Scholar] [CrossRef] [PubMed]
  7. Rottman, J.; Shadman, F.; Sierra-Alvarez, R. Interactions of inorganic oxide nanoparticles with sewage biosolids. Water Sci. Technol. 2012, 66, 1821–1827. [Google Scholar] [CrossRef] [PubMed]
  8. Zheng, X.; Su, Y.; Chen, Y. Acute and chronic responses of activated sludge viability and performance to silica nanoparticles. Environ. Sci. Technol. 2012, 46, 7182–7188. [Google Scholar] [CrossRef] [PubMed]
  9. Judd, S. The MBR Book: Principles and Applications of Membrane Bioreactors for Water and Wastewater Treatment; Elsevier: Oxford, UK, 2010; pp. 174–176. [Google Scholar]
  10. Auffan, M.; Rose, J.; Bottero, J.Y.; Lowry, G.V.; Jolivet, J.P.; Wiesner, M.R. Towards a definition of inorganic nanoparticles from an environmental, health and safety perspective. Nat. Nanotechnol. 2009, 4, 634–641. [Google Scholar] [CrossRef] [PubMed]
  11. Wang, F.; Tarabara, V.V. Pore blocking mechanisms during early stages of membrane fouling by colloids. J. Colloid Interf. Sci. 2008, 328, 464–469. [Google Scholar] [CrossRef] [PubMed]
  12. Belfort, G.; Davis, R.H.; Zydney, A.L. The behavior of suspensions and macromolecular solutions in crossflow microfiltration. J. Membrane Sci. 1994, 96, 1–58. [Google Scholar] [CrossRef]
  13. Zhu, X.; Elimelech, M. Colloidal fouling of reverse osmosis membranes: measurements and fouling mechanisms. Environ. Sci. Technol. 1997, 31, 3654–3662. [Google Scholar] [CrossRef]
  14. Allen, P.T.; Stephenson, G.M. Inter-group understanding and size of organisation. Brit. J. Ind. Relat. 1983, 21, 312–329. [Google Scholar] [CrossRef]
  15. Hur, J.; Shin, J.; Kang, M.; Cho, J. Tracking variations in fluorescent-dissolved organic matter in an aerobic submerged membrane bioreactor using excitation-emission matrix spectra combined with parallel factor analysis. Bioprocess. Biosyst. Eng. 2014, 37, 1487–1496. [Google Scholar] [CrossRef] [PubMed]
  16. Rice, E.W.; Baird, R.B.; Eaton, A.D.; Clesceri, L.S. Standard Methods for the Examination of Water and Wastewater; American Public Health Association, American Water Works Association and Water Environment Federation: Washington, DC, USA, 2012. [Google Scholar]
  17. Organization for Economic Co-operation and Development (OECD). OECD 209 Guideline for the Testing of Chemicals, Activated Sludge Respiration Inhibition Test; OECD: Paris, France, 1993. [Google Scholar]
  18. Foley, G. Membrane Filtration: A Problem Solving Approach with MATLAB; Cambridge University Press: New York, NY, USA, 2013; pp. 16–45. [Google Scholar]
  19. Cho, J.; Song, K.G.; Ahn, K.H. The activated sludge and microbial substances influences on membrane fouling in submerged membrane bioreactor: unstirred batch cell test. Desalination 2005, 183, 425–429. [Google Scholar] [CrossRef]
  20. Ahmed, Z.; Cho, J.; Lim, B.R.; Song, K.G.; Ahn, K.H. Effects of sludge retention time on membrane fouling and microbial community structure in a membrane bioreactor. J. Membrane Sci. 2007, 287, 211–218. [Google Scholar] [CrossRef]
  21. Munir, A. Dead end membrane filtration, laboratory feasibility studies in environmental engineering. Available online: http://www.egr.msu.edu/~hashsham/courses/ene806/docs/Membrane%20Filtration.pdf (accessed on 27 June 2016).
  22. Simon-Deckers, A.; Loo, S.; Mayne-L’hermite, M.; Herlin-Boime, N.; Menguy, N.; Reynaud, C.; Gouget, B.; Cariere, M. Size-, composition-and shape-dependent toxicological impact of metal oxide nanoparticles and carbon nanotubes toward bacteria. Environ. Sci. Technol. 2009, 43, 8423–8429. [Google Scholar] [CrossRef] [PubMed]
  23. Hajipour, M.J.; Fromm, K.M.; Ashkarran, A.A.; de Aberasturi, D.J.; de Larramendi, I.R.; Rojo, T.; Serpooshan, V.; Parak, W.J.; Mahmoudi, M. Antibacterial properties of nanoparticles. Trends Biotechnol. 2010, 30, 499–511. [Google Scholar] [CrossRef] [PubMed]
  24. Sibag, M.; Choi, B.G.; Suh, C.; Lee, K.H.; Lee, J.W.; Maeng, S.K.; Cho, J. Inhibition of total oxygen uptake by silica nanoparticles in activated sludge. J. Haz. Mat. 2015, 283, 841–846. [Google Scholar] [CrossRef] [PubMed]
  25. Jiang, W.; Mashayekhi, H.; Xing, B. Bacterial toxicity comparison between nano-and micro-scaled oxide particles. Environ. Pollut. 2009, 157, 1619–1625. [Google Scholar] [CrossRef] [PubMed]
  26. Manke, A.; Wang, L.; Rojanasakul, Y. Mechanisms of nanoparticle-induced oxidative stress and toxicity. BioMed Res. Int. 2013, 2013, 942916. [Google Scholar] [CrossRef] [PubMed]
  27. Bottero, J.Y. Environmental risks of nanotechnology: A new challenge? In Nanosciences and Nanotechnology; Springer International Publishing: Cham, Switzerland, 2016; pp. 287–311. [Google Scholar]
  28. Zanganeh, S.; Spitler, R.; Erfanzadeh, M.; Mahmoudi, M. Protein Corona: Opportunities and Challenges. Int. J. Biochem. Cell. Biol. 2016, 75, 143–147. [Google Scholar] [CrossRef] [PubMed]
  29. Saptarshi, S.R.; Duschl, A.; Lopata, A.L. Interaction of nanoparticles with proteins: relation to bio-reactivity of the nanoparticle. J. Nanobiotechnol. 2013, 11, 26. [Google Scholar] [CrossRef] [PubMed]
  30. Lynch, I.; Cedervall, T.; Lundqvist, M.; Cabaleiro-Lago, C.; Linse, S.; Dawson, K.A. The nanoparticle-protein complex as a biological entity; a complex fluids and surface science challenge for the 21st century. Adv. Colloid Interface Sci. 2012, 134, 167–174. [Google Scholar] [CrossRef] [PubMed]
  31. Pan, J.R.; Huang, C.; Jiang, W.; Chen, C. Treatment of wastewater containing nano-scale silica particles by dead-end microfiltration: evaluation of pretreatment methods. Desalination 2005, 179, 31–40. [Google Scholar] [CrossRef]
  32. Singh, G.; Song, L. Quantifying the effect of ionic strength on colloidal fouling potential in membrane filtration. J. Colloid Interface Sci. 2005, 28, 630–638. [Google Scholar] [CrossRef] [PubMed]
  33. Kissa, E. Dispersions: Characterization, Testing, and Measurement; CRC Press: Boca Raton, FL, USA, 1999; Volume 84. [Google Scholar]
  34. Trzaskus, K.W.; Zdeb, A.; de Vos, W.M.; Kemperman, A.; Nijmeijer, K. Fouling behavior during microfiltration of silica nanoparticles and polymeric stabilizers. J. Membrane Sci. 2016, 505, 205–215. [Google Scholar] [CrossRef]
  35. Guo, W.; Ngo, H.H.; Li, J. A mini-review on membrane fouling. Bioresour. Technol. 2012, 122, 27–34. [Google Scholar] [CrossRef] [PubMed]
  36. Boo, C.; Lee, S.; Elimelech, M.; Meng, Z.; Hong, S. Colloidal fouling in forward osmosis: Role of reverse salt diffusion. J. Membrane Sci. 2012, 390, 277–284. [Google Scholar] [CrossRef]
  37. Shirazi, S.; Lin, C.J.; Chen, D. Inorganic fouling of pressure-driven membrane processes—A critical review. Desalination 2010, 250, 236–248. [Google Scholar] [CrossRef]
  38. Rosenberger, S.; Laabs, C.; Lesjean, B.; Gnirss, R.; Amy, G.; Jekel, M.; Schrotter, J.C. Impact of colloidal and soluble organic material on membrane performance in membrane bioreactors for municipal wastewater treatment. Water Res. 2006, 40, 710–720. [Google Scholar] [CrossRef] [PubMed]
  39. Laabs, C.N.; Amy, G.L.; Jekel, M. Understanding the size and character of fouling-causing substances from effluent organic matter (EfOM) in low-pressure membrane filtration. Environ. Sci. Technol. 2006, 40, 4495–4499. [Google Scholar] [CrossRef] [PubMed]
  40. Xu, J.; Li, X.Y. Investigation of the effect of nanoparticle exposure on the flocculability of activated sludge using particle image volecimetry in combination with the extended DLVO analysis. Colloids Surf. B Biointerfaces. 2016, 143, 382–389. [Google Scholar] [CrossRef] [PubMed]
Figure 1. Schematic of the lab-scale membrane bioreactor (MBR) used in the continuous experiment.
Water 08 00277 g001
Figure 2. Effect of SiO2 NPs on the evolution of MLSS during (a) a continuous experiment in a membrane bioreactor (MBR) and (b) batch experiment with pure SiO2 NPs. The shaded area indicates exposure to SiO2 NPs.
Water 08 00277 g002
Figure 3. Particle size distribution of the decantate from batch settling experiments involving (a) 28 nm SiO2 NPs; (b) 28 nm SiO2 NPs + activated sludge; (c) 144 nm SiO2 NPs; (d) 144 nm SiO2 NPs + activated sludge and (e) activated sludge only.
Water 08 00277 g003
Figure 4. Particle size distribution of the permeate from dead-end filtration tests involving (a) 28 nm SiO2 NPs; (b) 28 nm SiO2 NPs + activated sludge; (c) 144 nm SiO2 NPs; (d) 144 nm SiO2 NPs + activated sludge and (e) activated sludge only.
Water 08 00277 g004
Figure 5. Inhibition of activated sludge total respiration ( I T ) in an MBR by SiO2 NPs.
Water 08 00277 g005
Figure 6. Effect of SiO2 NPs on the evolution of transmembrane pressure (TMP) in an MBR. The shaded area indicates exposure to SiO2 NPs.
Water 08 00277 g006
Figure 7. Membrane filtration characteristics in dead-end filtration of activated sludge with SiO2 NPs. (a) normalized permeate flux and (b) total resistance.
Water 08 00277 g007
Table 1. Summary of the performance of MBR with and without exposure to SiO2 NPs.
TreatmentCOD (SD) mg/LRemoval %NH3–N (SD) mg/LRemoval %TN (SD) mg/LRemoval %TP (SD) mg/LRemoval %
InfluentEffluent InfluentEffluent InfluentEffluent InfluentEffluent
MBR control279 (60)10 (2)9639 (9)< 0.029950 (5)47 (4)611 (2)9 (1)18
MBR with 28 nm SiO2 NPs282 (54)10 (2)9641 (7)< 0.029948 (3)44 (3)811 (1)9 (1)18
MBR with 144 nm SiO2 NPs284 (105)11 (2)9640 (9)< 0.029948 (4)45 (4)611 (1)9 (1)18

