Abstract
Over the years, various technologies have been utilized for Natural Organic Matter (NOM) removal with varying degrees of success. Conventional treatment methods comprising of coagulation, flocculation, sedimentation, or filtration are widely used to remove NOM. An alternative to these conventional methods is to use spiral wound membranes. These membranes tend to remove too much hardness whilst being ineffective in disinfection. They also have a low tolerance to chlorine and thus, have limited chemical cleaning options. In this study, we investigated how an alternative and new innovative filtration concept, based on capillary NF membranes from modified polyethersulfone (PES), may be used to treat soft but humus-rich surface waters. Comprehensive performance tests, with a fully automated membrane pilot equipped with a full-scale sized test module (40 m2 membrane surface), were conducted at WTP Görvälnverket, which is operated by the water utility Norrvatten, providing drinking water from Mälaren (SUVA = 2.7–3.3, TOC = 7.0–10.0 mg·L−1) for about 500,000 people in the northern part of the Swedish capital of Stockholm. The removal of both UV and DOC was modeled using a solution diffusion approach. The optimized parameters allow deducing optimal operation conditions with respect to energy, water consumption, and permeate water quality. Optimal cross flow velocity was determined to be 0.75 m·s−1 at 80% recovery and a flux of 12–18 L·m−2·h−1. Under these conditions, 80% of the UV, 75% of the Humic Substances (MW = 600) and 70% of TOC were removed (from 8 to below 2 mg·L−1). A higher cross flow velocity led to marginal improvement (+2%) while both higher and lower membrane fluxes degraded permeate water quality. Apparent optimized diffusion coefficients for UV and TOC were around 1.2–2.4 × 10⁻¹⁰·m2·s−1 and were similar to values found in the literature. Due to their higher diffusion coefficients and higher permeability coefficient, only 40% of the low molecular weight acids (MW = 300–400) were retained. Approximately 30%–40% of the low molecular weight acids in the permeate can be further removed using GAC post NF. The resulting energy consumption of a hypothetical four-stage design, at average operating temperature of 5.73 °C, was calculated to be around 0.6 kWh·m−3 produced water.
1. Introduction
Natural organic matter (NOM) is ubiquitous in waters, sediments, and soils. Aquatic NOM is derived both from the breakdown of terrestrial plants as well as the by-product of bacteria, algae, and aquatic plants. The interrelation between NOM and climate change and notably the rising concentrations of NOM has attracted a lot of attention recently [1,2,3,4,5,6,7,8,9]. Several potential factors, including an increase in air and surface water temperature, rainfall intensity, and atmospheric CO2 and/or a decrease in acid deposition, have been proposed to explain the increased amount of NOM [10], but there is yet no scientific consensus on the issue [11].
NOM has a significant impact on drinking water quality directly, by reacting with water treatment chemicals contributing to disinfection by-product (DBP) formation [12,13], and indirectly, by impacting water treatment processes (including fouling of membranes and reducing the effectiveness of activated carbon for contaminant removal). In the recent years, reports worldwide indicate a continuing increase in the color and NOM of the surface water, which in turn, causes an adverse effect on drinking water purification [14]. Changes in the properties of NOM also influence the treatment significantly [15].
Therefore, the water industry has been focusing on improving current treatment processes and developing new applications for enhanced removal of NOM. One of the latest innovations in nanofiltration (NF) for effective removal of NOM, is capillary NF membranes which combine the chemical resistance of hollow fiber membranes with the organic retention of spiral wound nanofiltration [16,17]. This new type of membrane (HFW1000) is suitable for raw waters that have low hardness and contain organic matter that are difficult to flocculate such as lake water. Recent studies indicated that a combined coagulation and NF process removed more than 90% of the dissolved organic carbon (DOC), and 96% of the absorbance at 254 nm in lake water [18], while using direct NF resulted in NOM removal with 93% in UV-absorbance (UVA) retention and 88% TOC retention [19]. An advanced autopsy of the hollow fiber NF membranes was conducted after 12 months of operation with no substantial changes to the membranes detected [20]. These results encouraged us to evaluate dimensioning parameters for the use of these NF membranes for direct lake water filtration.
The transport of NOM through NF membrane pores is influenced either by convection or diffusion, depending on the hydrodynamic conditions and electrostatic interactions between the membrane surface and NOM molecules. Different mechanisms influencing the removal of small organic compounds have been suggested. The polarity and differences in diffusion rates in a non-porous structure may influence the rejection of small organic compounds in NF [21,22]. The solution-diffusion model is the most widely used model of permeation in non-porous polymer membranes [23,24,25] while the Donnan steric pore model and dielectric exclusion model have also been used to describe mass transfer of electrolytes and neutral solutes through nanofiltration membranes [26] as well as to predict rejections of trace organics by NF membranes [27,28]. The ability of the model to describe all non-porous membrane separation processes has been the subject of several reviews even in the past [23,29,30]. Since the selected capillary NF membrane for this study has been deemed to be a non-porous membrane [31], the solution-diffusion model is used to obtain a design tool for prediction of permeate quality for different settings regarding filtration flux, cross-flow velocity, recovery and for different staging configurations.
This paper describes and evaluates a 6-month (from January 2014 to June 2014) pilot test of hollow fiber nanofiltration by direct filtration of surface water from Lake Mälaren, a drinking water source for more than 2 million citizens. The pilot trials were conducted at Görvälnverket WTP and operated by the water utility, Norrvatten, providing drinking water for about 500,000 people in the northern part of the Swedish capital of Stockholm.
Twenty short-term (<2 h) experiments, at a fixed recovery of 50%, with sufficient variations in filtration flux (5–25 L·m−2·h−1) and cross-flow velocity (0.25–1.0 m·s−1) were performed with a fully automated pilot plant to determine the solute diffusion coefficient and solute permeability coefficient to predict NOM retention (i.e., DOC). These short term experiments were complemented with a long term performance test of direct filtration at fixed filtration flux of 20 L·m−2 h−1 and fixed cross flow (0.5 m·s−1) but at varying recoveries (50%–90%) using the above-mentioned pilot plant. For all experiments, conventional NOM analysis (TOC, DOC, UV absorbance) was combined with LC-OCD analysis for feed water, concentrate and permeate to elucidate the retention of specific NOM fractions as a function of varying operation conditions.
2. Theory
In theory, both the convection and solution diffusion models might be applicable for the HFW 1000 separation process, since the test membrane is positioned between a dense UF and an open NF (MWCO: ~1000 Da). Recent studies of the capillary nanofiltration membrane for determination of source specific model parameters showed a good fit of experimental results based on the solution diffusion model [31,32,33]. According to previous research, the selected membrane is a loose and open NF membrane and therefore can be described as a non-porous membrane. The solution-diffusion model, which is based on the film theory, was used for the active membrane layer. When a driving force is applied on the feed solution, the solvent starts to permeate freely while the solute is partially retained by the membrane. As a result, the solute concentration in the permeate (Cp) will be lower compared with the bulk solution (Cb). Retained solutes accumulate near the membrane surface, gradually increasing the local concentration (Cm). This increase in concentration is the driving force for back diffusion into the bulk of the feed and after a given period, steady state conditions are established. Thus, the driving force for solute permeation is assumed to rely solely on diffusion due to a concentration difference between permeate (Cp) and the concentration at the membrane surface (Cm). A schematic representation of the concentration polarization phenomena is given in Figure 1.
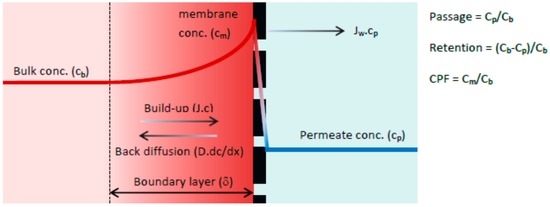
Figure 1.
Concentration polarization phenomena [34].
The boundary layer (δ) is defined as the distance from the membrane surface where the solute concentration equals the bulk concentration (complete mixing). In the boundary layer the solute concentration will reach a maximum value at the membrane surface (Cm). The solution diffusion model differs from the convection model in how solute transport through the membrane is defined. The driving forces for solute permeation are assumed to rely solely on diffusion due to a solute concentration difference between permeate (Cp) and concentration at the membrane surface (Cm). The rate of solute permeation is determined by the solute permeability coefficient (B) expressed in (m·s−1). By performing a mass balance across the concentration polarization layer, the film model is obtained (Equation (1)). Subsequent substitution of the rate of solute permeation yields Equation (2) which describes the passage for the solution diffusion model [34].
where,
- Cp = Concentration in the permeate (e.g., TOC in mg·L−1 or UV extinction in m−1)
- Cb = Concentration in the bulk (actual feed)
- Cm = Concentration at the membrane surface
- Jw = Filtration flux (m3·m−2·s−1)
- k = Mass transfer coefficient (m·s−1)
- v = Cross flow velocity (m·s−1)
- d = Hydraulic membrane diameter (m)
- L = Membrane length (m)
- B = Solute permeability coefficient (m·s−1)
- D = Solute diffusion coefficient (m2·s−1)
The solution diffusion model has two unknown parameters, the solute diffusion coefficient, D, and the solute permeability coefficient, B. These two latter parameters were fitted using the experimental results from pilot trials.
Model fitting was performed through an iterative process with the initial value of solute diffusion coefficient, D, based on the literature value reported by Park et al. [35]. Mass transfer coefficients, k, were calculated using Equation (4) for laminar flow conditions at four different crossflow velocities, ranging from 0 to 3.0 m·s−1 with corresponding Reynolds numbers of 0 to 2400 for 0.8 mm membrane fibres. The TOC and UV254 of the permeate were calculated using Equation (1) and compared with experimentally measured values. The final model fitting parameters of D, and B were determined using the Least Square Error method through the ‘Generalized Reduced Gradient’ (GRG2) algorithm in Excel (Solver).
It should be noted that only the concentrations of fraction (II) of the TOC were used for the model calibration as fraction (I) was only present in the feed water and concentrate, and fractions (III) was present in the same quantitative amount in the feed water and permeate.
3. Material and Methods
3.1. NOM Removal Concept Based on Capillary Nanofiltration
The core of the enhanced NOM removal concept is the innovative HFW 1000 membrane based on a capillary nanofiltration platform developed by X-Flow and recently commercialized by Pentair According to SEM pictures (Figure 1), the structure becomes denser towards the membrane surface which is advantageous for an inside-out filtration process.
Figure 2B illustrates the integrated top-layer with a thickness of approximately 100 nm. By optimizing the membrane production and polymer blend, a thin nanolayer is created at the inner wall of the membrane, which is completely integrated with the open membrane backbone structure and provides the required strength to withstand the applied forces during the filtration process and hydraulic membrane cleaning. Contrary to conventional spiral wound membrane modules, the integrated top-layer allows hydraulic cleaning of the HFW 1000 membrane by backwashing. Since the membrane material is based on modified PES, the HFW 1000 membrane properties can be characterized as highly chemical tolerant and chlorine resistant. This HFW membrane is designed for enhanced and selective removal of organics from surface water. The main characteristics of the selected test membrane are presented in Table 1.
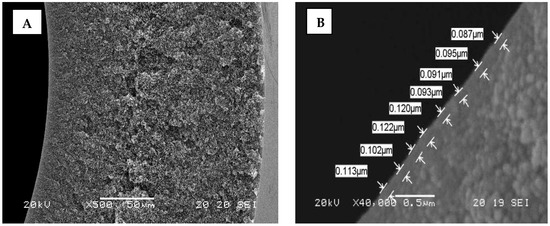
Figure 2.
SEM images of the HFW membrane: (A) Cross-section; (B) Top-layer with replicated measurements of layer thickness.

Table 1.
Manufacturer reported specified properties of the hollow fibre membranes.
3.2. The Pilot Plant and Description of Experimental Trial Periods
3.2.1. The Pilot Plant
For all trials, a 20-foot-long container pilot is used that was designed as a stand-alone unit and equipped with one element adapter for 8-inch commercial size membrane modules. The pilot plant consists of the following main sections (Figure 3):
- Feed section including coagulation dosing and chemical dosing for pH correction (not used during the trial period).
- Membrane system (one adapter for UF or NF test modules) including air integrity testing.
- Permeate and backwash section including the chemical dosing for membrane cleaning.
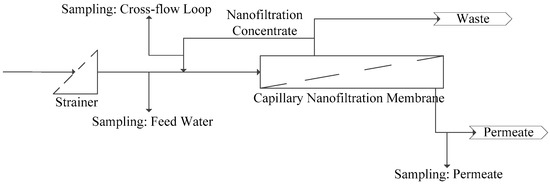
Figure 3.
Schematic diagram of the pilot plant and sampling points.
The system design of the pilot plant was based on feed and bleed, with a slight cross-flow. By applying a minor bleed flow, the fouling layer on the membrane surface was minimized and the fouling potential of the membranes was significantly reduced. The pilot plant was equipped with a computer for systems control and runs automatically. All necessary process parameters were logged and trended on the computer, which can be observed and evaluated on the display. The plant also allowed remote access providing the same functionality as local access, except for Cleaning in Place (CIP) feasibilities. Besides hydraulic cleaning of the membranes via a combined backwash with forward flush, several automatic cleaning sequences have been pre-programmed for specific cleaning protocols. In general, cleaning took place on an elapsed time interval. A cleaning cycle consisted of flushing with clean water (permeate) followed by soaking with a maximum of two different cleaning agents (acidic and caustic). For the particular pilot trials, the feed water section was connected to an external feed pump located in the inlet of the WTP Görväln drinking water treatment plant. Regular membrane cleaning was performed using hydraulic backwash/forward flushing (every 60 min) and chemical enhanced cleaning with sodium hypochlorite and sodium hydroxide (after 72 h).
The average feed water parameters during the comprehensive pilot trial at the treatment work Görvälnverket of Norvatten are shown in Table 2.

Table 2.
Average feed water quality.
3.2.2. Experimental Conditions
After an initial system stabilization period in February 2014 (trial 1) at 10 and 15 L·m−2·h−1 and fixed recovery of 50%, a large number of short term trails were conducted (trial 2, “short term”). Five sets of experiments with different cross-flow velocities from 0.25 to 1.0 m·s−1 at filtration fluxes between 5 and 25 L·m−2·h−1 were performed in random order to minimize the effect of changing water qualities. During those experiments the system recovery was kept constant at 50% (Table 3). Subsequently experiments at increasing filtration flux at a fixed cross flow of 0.5 m·s−1 (trial 3 “filtration flux”) were performed. The final two trials consisted of a longer term performance test in March and April 2014 (trial 4, “long-term”) at 20 L·m−2·h−1 at 50% recovery and a period where recovery was changed while keeping the filtration flux constant (trial 5, “recovery”). Operating conditions during pilot trials can be found in Table 4.

Table 3.
Summary of the short-term trial conditions.

Table 4.
Operating conditions and process parameters during different pilot trials.
During the short-term trials, samples were taken from four sample points: feed water from Lake Mälaren (pre-filtered with 300 μm strainer), circulation loop, concentrate and permeate (Figure 3). Steady state conditions at the moment of sampling were ensured by on-line measurements of conductivity in the circulation loop and permeate line. Between the two experiments, the concentrate and permeate side were completely drained including the membrane module to diminish the influence of previous experiments.
3.3. Characterization of Organic Fractions in Feed Water and Treated Water
3.3.1. Determination of UV, TOC and DOC
Total organic carbon (TOC) and dissolved organic carbon (DOC) were determined using an Elementar (SRN) Vario TOC Cube analyzer with a precision of 0.2 mg·L−1. UV absorbance at 254 nm was determined with a 5 cm cuvette.
3.3.2. Evaluation of NOM Retention by Liquid Chromatography-Organic Carbon Detection (LC-OCD)
The nature of the organics presented in the raw water to the WTP, feedwater to the pilot plant, and effluent from the WTP and the pilot plant were characterised using UV absorbance at 254 nm and using a DOC-LABOR Liquid Chromatography-Organic Carbon Detection (LC-OCD). LC-OCD utilizes a polymethacrylate, size-exclusion column (Toso, Japan) coupled with three detectors (Organic Carbon, Organic Nitrogen and UV-absorbance). This technique allows for subdivision of organic matter into six major sub-fractions: biopolymers, Humic substances, building blocks, low molecular-weight acids, low molecular-weight neutrals, and hydrophobic organic carbon. From the results, the biopolymer’s and humic substances’ nitrogen content can be estimated. The measurement of the protein content of the biopolymer fraction allows for the amount of bound nitrogen to be determined using the UV-detector, while Humic Substances (HS) can be further characterised using the HS-diagram which plots the aromaticity of HS against its nominal molecular weight. Detailed information of the LC-OCD technique can be found in the paper previously published [36].
3.4. Prediction of Removal Efficiency of Full-Scale Plant (First Stage Process)
In order to predict the removal efficiency of the first stage and full-scale processes, mass balance calculations were used. The full-scale design is not based on the full-scale flow and only illustrates the mass balances over the different membrane stages. The objective of staging is to lower the average bulk concentration at the feed side. This is achieved with the first stages operating at a lower overall recovery compared to that of an equivalent single stage process.
According to previous studies [17], TOC analysis can be used as a key parameter for the determination of the solute diffusion coefficient (D) and the solute permeability coefficient (B). As for membrane retention, the TOC can be divided into three fractions; (I) 100% retained; (II) partially retained (based on current process conditions, membrane geometry and membrane properties); and (III) 0% retained. Different mass balances were calculated for all three water fractions. The TOC levels of feed water and permeate were corrected in order to eliminate the influence of fractions (I) and (III). Since fraction (I) was only present in the feed water and concentrate, the TOC level of the feed was corrected by subtracting fraction (I) from the total feed TOC value. Fraction (III) was present in the same quantitative amount in the feed and permeate, and therefore, was also subtracted to obtain the corrected TOC concentration for fraction (I) and (III). Correction factors (C) were determined via a Pentair-developed design tool that utilized trend-line regression. The design tool took into account the effects of filtration flux, and cross-flow velocity on the membrane retention. Based on the fixed membrane retention, the design tool then calculated removal efficiencies for the first stage and a typical 4-stage, full-scale process (Equations (5) and (6)). The number of membrane modules per stage only indicates the ratio of membrane modules over the stages. For example, with the current module ratio 20-10-6-4 (40 modules), a skid could be designed with 80-40-24-16 modules (160 modules in total) for stage 1 to 4.
where,
- η = Removal efficiency (%);
- χII = Partly-retained feed fraction;
- χIII = Non-retained feed fraction;
- C = Correction Factor.
In the applied design tool, in each stage, two modules were operated in series. In this double-pass loop, the concentrate of the first module was the feed for the second module. Between the second and the first module, the circulation pump, pressurized feed line and concentrate line were connected. This setup halves the circulation flow rate, because two modules were operated in series, which resulted in smaller circulation pipes/headers. The disadvantage of this setup was the different Transmembrane Pressure (TMP) for both the modules, due to the pressure drop over the two modules. This caused a filtration flux deviation between the first and second module, which depended on the membrane permeability, filtration flux and cross-flow velocity. The first module was thereby running at the highest filtration flux and limiting the design based on the maximum allowable filtration flux. For the full-scale design, the pilot data and solution diffusion models were used to calculate the mass balances.
4. Results and Discussion
4.1. Long-Term Experiments
4.1.1. Hydraulic Membrane Performance
The hydraulic performance of the membrane module for the entire pilot period from 23 January 2014 to 12 June 2014 was presented in Figure 4. Membrane resistance data showed a stable filtration performance during the entire 4.5 month pilot period, except the period from 10 May 2014 to 15 May 2014 (Table 5). During this period, an issue occurred due to precipitation while dosing the chemical cleaning solution, resulting in scaling. This scaling was caused by the insufficient rinsing of the concentrate loop before the caustic/oxidizer cleaning solution was dosed. Scaling was removed with one standard chemical cleaning with hydrochloric acid at pH 2 with a soak time of 60 min. Implementing the pilot automation, alleviated the scaling issue and the process appeared to be stable with a caustic/oxidizer chemical cleaning only.
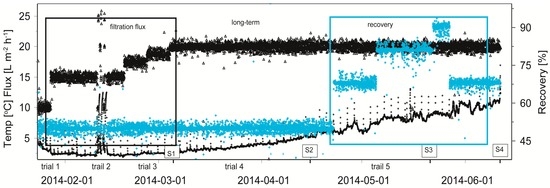
Figure 4.
Hydraulic performance of the capillary NF container test module for time period January to June 2014 at WTP Görvälnverket, Norrvatten. At times (S1, S2, S3 and S4 samples were taken for LC-OCD analysis. Periods of increase infiltration flux and increase of recovery are marked with black and blue frames respectively. Temperature (°C) and flux (L·m−2·h−1) on the left scale with white circles (○) and white triangles (∆) respectively and recovery (%) with grey markers (+).

Table 5.
Variation of membrane performance and parameters during long-term pilot trials.
During first trial period (“increase in filtration flux”) with increasing filtration fluxes from 10 to 20 L·m−2·h−1, an increase in the resistance built-up was observed over time between two chemical cleanings. This increase in resistance built-up was caused by the higher filtration fluxes (higher local forces towards the membrane) and larger filtration volumes per filtration run. However, this increase in resistance built-up was not major and chemical cleaning could easily restore the membrane resistance to ensure stable filtration performances. In the third trial period (“increase in recovery”) with increasing recoveries from 50% to 90%, an increase in the resistance built-up was not observed over time between two chemical cleanings, which suggests that the fouling rate is probably independent of the recovery up to 90%, while the bulk concentration of the organics significant increases with increasing recovery. Therefore, the fouling rate is only affected by the filtration flux and probably not by the used recovery rate (bulk concentration of organics). This fact resulted in equal fouling rates for all the stages in the full-scale process, which led to stable and equal flux distributions over the several stages in time during the filtration cycles. These results are also in line with the measured pressure drop over the module, which was stable during the entire pilot period, indicating no significant risk for fiber plugging during filtration and cleaning.
Membrane retention was shown as a function of the filtration flux and cross-flow velocity for the entire pilot period from 23 January 2014 to 12 June 2014. Membrane retention decreases with increasing filtration flux in the first period (“increase of filtration flux”). After the period with increasing filtration fluxes up to 20 L·m−2·h−1, the membrane resistance was stable and fluctuated only in a small range possibly due to measurement inaccuracies (Figure 5). Even when the recovery was increased from 22 April 2014, the membrane resistance was constant over time. The membrane retentions for UV254 varied between 87.6% and 91.6%, for Pt-Co between 87.5% and 97.5% and for TOC between 82% and 89% during the trial period. The range of membrane retentions achieved in the experimental matrix for the models were broader, with membrane retentions for UV254 between 88.0% and 94.7%, for Pt-Co between 87.5% and 98.4% and for TOC between 79.7% and 92.2% (Table A1).
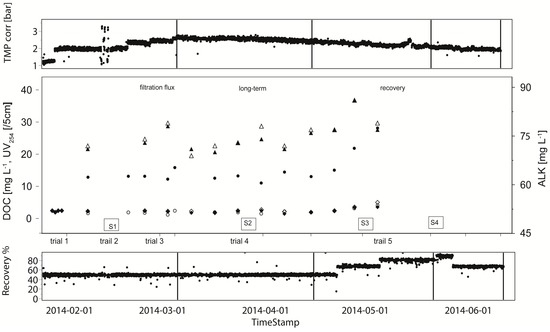
Figure 5.
Membrane performance with respect to DOC (mg·L−1) (in ● and out ○), Alkalinity (right scale (mg·L−1) (ALKin ▲, ALKout ∆) and UV254 (UVin ◆ and UVout ◇) of the capillary NF container test module for time period January to June 2014 at WTP Görvälnverket, Norrvatten. S1–S4 and bars as in Figure 3.
4.1.2. Effects of Cross-Flow Velocity and Recovery
Membrane filtration performance suggested that membrane retentions were strongly affected by the filtration flux and cross-flow velocity. Decreasing cross-flow and increasing recovery deteriorated water quality. The membrane removal was highest for biopolymeres (>95% removal), followed by Humics (>80% removal). This was in accordance with earlier experiments performed [18] using similar types of membranes [37]. LC-OCD results showed that while incoming molecular weight of Humic substances is 660 Dalton, the small fraction of permeating Humic substances have a molecular weight of around 530 Dalton. Due to their low molecular weight of below 500 Dalton, the removal of building blocks (between 65% and 80% removal) and low molecular weight substances (<60%) is poorer. Both the low molecular weights neutrals and the Humic substances follow a similar pattern (Figure 6). At a cross flow velocity of 0.5 m·s−1, recoveries of above 50% significantly deteriorated water quality. Permeate quality improved when the crossflow was increased to 0.8 m·s−1, above which no further improvement was observed. The low molecular weight neutrals (LMWN) were below the molecular cutoff of the HFW1000 membrane with at least 40% passing through into the permeate. This corresponds to LMWN in the range of 1300 ppb in the influent and around 300 ppb detected in the permeate. Post NF Granulated Activated Carbon (GAC) filters should be used to remove these DOC fractions. Earlier experiments using the same type of membrane and source water [18] indicated that at least half of the permeating LMW substances can be removed by GAC filters.
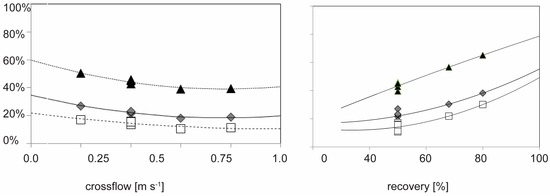
Figure 6.
Effect of recovery rate on the fraction of DOC in the permeate for DOC (◆), Humic substances (□) and Low molecular weight neutrals (▲) at a fixed cross flow of 0.5 m·s−1 in the pilot plant (left, samples S1–S4) and effect of cross flow on the fraction of DOC in the permeate for DOC at fixed recovery of 50%, Humic substances and low molecular weight acids, neutrals for the container plant experiments (right) The lines are second-degree order fits to the data to highlight the trends.
Data points that overlap in the above figure at crossflow of 0.5 m·s−1 and at recovery of 50% are replicate samples at similar conditions but sampled under the short-term experiment described below.
4.2. Short Term Experiments
In Figure 7, UV, DOC and LC-OCD fractionations are shown at four different cross-flow velocities (0.25, 0.50, 0.75 and 1.0 m·s−1) and filtration flux of 15 L·m−2·h−1 at 50% recovery. Comprehensive LC-OCD data is shown in Table A2, while Figure A3, Figure A4, Figure A5 and Figure A6 show the membrane performance during short term trials.
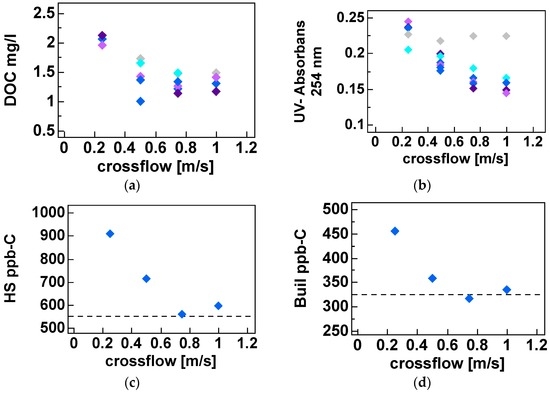
Figure 7.
Membrane performance of the capillary NF pilot test module and effect of crossflow and filtration flux for permeate quality for both UV254 and DOC for all experiments ((a) and (b) respectively) and those where LC-OCD were available for HS and building blocks ((c) and (d) respectively). Different filteration fluxes (L·m−2·h−1) are distinguished with grey (◆5), light blue (◆10), dark blue (◆15), light violet (◆20) and dark violet (◆25) markers.
Although the membrane retention increases with increasing cross-flow velocities, the relative DOC composition of the permeate does not change in terms of retention behavior of humics and building blocks (Figure 6). Increased cross-flow velocities (increased mass-transfer coefficients) affected the membrane retention on the several DOC fractions with comparable magnitudes, the lines in Figure 6 are close to parallel despite the molecular mass being significantly for those DOC fractions.
In accordance with the long-term experiments, crossflow velocities of above 0.8 m·s−1 do not improve water quality with the exception of the UV-absorbance 254. We have no explanation for the slight improvement of UV and must speculate that factors other than DOC or Humics affected the decrease in UV in those experiments. We have no explanation to why UV did not change at filtration fluxes of 5 L·m−2 h−1 and the occurrence of unsystematic variation of DOC at crossflow of 0.5 m·s−1. Part of that variation may be due to the precision of the DOC measurements, which is in the order of 0.3 mg·L−1.
4.3. Water Fractions and Solution Diffusion Model Parameters
4.3.1. Prediction of Membrane Retention Based on TOC and UV Absorbance, UVA254
With initial guesses for fraction (I), fraction (III), solute diffusion coefficient and solute permeability coefficient, the measured membrane passages and predicted membrane passages, based on the solution diffusion model, were fitted with the GRG non-linear solver in Excel. In contradiction to the UV model, the TOC model fitted best with one water fraction only. The total feed concentration was thereby assumed as partly retained based on process conditions and membrane properties. In the UV model, 1.5% of the feed concentration was assumed to permeate unaffected through the membranes and 98.5% are considered as being partly retained. The water fractions and model parameters from the model fitting based on UV254 and TOC are listed in Table 6.

Table 6.
Water fractions and model parameters for UV254 and TOC.
According to the calculations of the model parameters, the solute diffusion coefficients were comparable for UV254 and TOC, while the solute permeability coefficient for TOC was higher compared with the permeability coefficient for UV254. This resulted in lower TOC retentions compared to retentions based on UV254, which was also expected.
The graphs in Figure 8 show the results of the measured membrane passages (data points) and predicted membrane passages (data lines) based on DOC. The four different lines in the figure above indicate the predicted performance when using various cross-flow velocities. It can be seen that the measured and predicted membrane passages are well fitted with probably some outliers. For instance, the fitting is improved with 25%, based on the average error per data point, if experiment 8.1 was not used in the model (vCF: 0.5 m·s−1, Jf: 15 L·m−2·h−1; passage 20%). It can also be pointed out that the membrane passage increases if the cross-flow velocity is decreased. With a certain cross-flow velocity, the passage first decreases when the flux is increased. However, if the filtration flux is further increased the passage increases again. This effect is similar to the UV-retention, caused by the dilution effect (permeate flux) and concentration polarization. Based on the predicted membrane passages, the retention of the first stage (50% recovery) can be calculated by using mass balances. In Figure 8, the measured retentions (raw feed water to permeate) and predicted retentions are shown for the four applied cross-flow velocities. The predicted retentions compare well with the measured retentions with an outlier at 65% retention and filtration flux of 15 L·m−2·h−1. The calculations also indicate that the expected first stage retentions, with 0.5 m/s cross-flow velocity and filtration fluxes between 10 and 20 L·m−2·h−1, are in the range of 78%–80% based on TOC. The first stage retentions could be increased further to 83% by increasing the cross-flow velocity towards 1 m·s−1. From an operational perspective, a cross-flow velocity of 0.5 m·s−1 with a flux-range from 8 to 22 L·m−2·h−1 is the most optimal setting based on the passage and energy consumption.
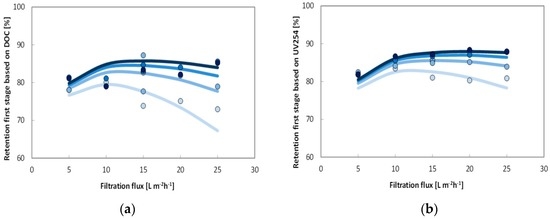
Figure 8.
Model fit of membrane passage of capillary NF pilot test module for DOC (first stage: 50% recovery, (a)) and on UV254 (first stage: 50% recovery, (b)) as a function of filtration flux. Cross flows increases from 0.25 to 1.0 m·s−1 from light to dark blue (●, ●, ●, ● from bottom to top). Best fit model performance of first stage removal and using the parameters displayed in Table 7 for both UV and DOC are displayed with lines in both figures.
4.3.2. Uncertainties
The solver function succeeds in finding a local minimum for the sum of errors for both UV and DOC experimental data. During the optimization procedure, it became evident that a number of combinations of D and B led to acceptable fits with sum of errors close to the local minimum. This was tested by systematically varying B and D stepwise in the range of 0.42–1.42 (0.2 per step) for B and 1.36–2.76 (0.2 per step) for D. The resulting matrix of the sum of errors is displayed in the appendix (Figure A1). Based on that matrix, we could establish a relationship between D and B that covers the area of smallest sum of errors. This also allowed us to evaluate the potential effect of the optimum operation range (Figure A2).
4.4. Modelling of Full-Scale Process Design for Direct Nanofiltration
Figure 9 shows the predicted full-scale retentions for a typical three stage process, whereby all stages operates at 50% recovery, resulting in overall recovery of 82.5%. The predicted full-scale TOC retention is shown for the four applied cross-flow velocities. The overall TOC retention, with 0.5 m·s−1 cross-flow velocity and filtration fluxes between 10 and 20 L·m−2·h−1, was in the range of 67%–69%. Figure 8 also illustrates the comparison of the UV254 and TOC retention, which could be achieved in the above mentioned full-scale installation (3 stages at 50% recovery, overall recovery of 82.5%) at a cross-flow velocity of 0.5 m·s−1. According to the calculations the optimum flux range based on retentions is between 10 and 20 L·m−2·h−1, with the predicted UV254 retention rate corresponding to 78% and the predicted TOC retention reaching approximately 67% to 69%. In general, the TOC retention with a cross-flow velocity of 0.5 m·s−1 is 10% lower compared to the UV retention. Therefore, this shows that by using the adapted models based on UV254 and TOC, the permeate quality and energy consumption of full-scale configurations can be calculated.
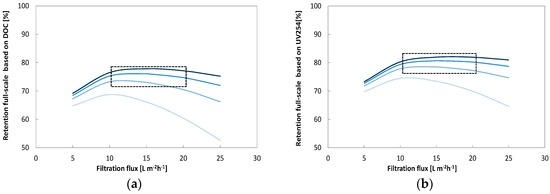
Figure 9.
Influence of filtration flux (5–25 L·m−2·h−1) and cross-flow velocity (0.25–1.0 L·s−1) for a full-scale three stage process with 82.5% overall recovery on membrane passage of DOC (a) based on UV254 (b). The area within the square indicate the range of optimum conditions.
The ranges of membrane retentions, achieved in the experimental matrix, were used to calculate process retentions of a four-stage system with 90.2% recovery during filtration. Membrane (process-) retention were on average 88%–95% (72%–87%) of the UV254, 88%–98% (72%–96%) for color (mg·Pt·L−1) and between 80% and 92% (58%–81%) for TOC (mg·C·L−1).
Based on the results of on-going pilot trials, feasibility studies and sensitivity analyses have been conducted with the aim to develop a preliminary full-scale process design for direct nanofiltration at WTP Görvälnverket. For this purpose, the characteristics for feed water, the required permeate quality and minimum recovery rate were defined. For calculation of mass balances current pilot data and requirements by the utility Görvälnverket were used as listed in Table 7.

Table 7.
Design criteria for preliminary full-scale process design for WTP Görvälnverket.
The most important design criteria for process optimization have been ranked as follows:
- Permeate quality
- Recovery rate
- Operational costs (including energy) and investments
Preliminary calculations indicated a total membrane surface area in the range of 314,000 to 524,000 m2 for the given flow rates of the actual plant capacity. In order to meet the design criteria a four-stage membrane system is proposed. It consists of 7862 modules for 120 m3·day−1 and 13,103 modules for 200 m3·day−1 with an estimated module ratio of 10-5-3-2 for stage 1 to 4. This meant that a 160-module membrane skid could be designed with a 80-40-24-16 per stage configuration. For the full-scale design of the membrane plant, it is assumed that two modules are operated in series for each membrane stage. The selected process configuration enables a double-pass loop, which means that the concentrate of the first module will be the feed water of the second module. The circulation pump as well as the pressurized feed and concentration line are connected between the second and first module. This setup halves the circulation flow rate due to the fact that two modules are operated in series resulting in smaller pipes and headers for the circulation. However, also results in different TMPs for both of the modules due to the pressure drop over the two modules, therefore, resulting in a filtration flux deviation between the first and second module, depending on the membrane permeability, filtration flux and cross-flow velocity. In this case, the first module is running at the highest flux and thus, limits the process design based on the filtration flux. The output of the projection tool for the proposed retrofit of WTP Görvälnverket for direct nanofiltration is summarized in Table 8.

Table 8.
Calculated design parameters for retrofit of WTP Görvälnverket.
Sensitivity analyses were performed to investigate the effects of several design parameters on the full-scale process. In the appendix (Figure A7 Appendix A), the energy consumption per cubic meter of produced water (permeate) versus the feed water temperature, with a fixed retention of 80% based on UV254 is shown. The energy consumptions are corrected at an overall pump efficiency of 75% and for additional pressure losses over the skid and the circulation line. It can be seen that the energy consumption is significant affected by the temperature with the energy consumption for feed water temperatures of 0.5, 5.73 and 18 °C were 0.63, 0.54 and 0.4 kWh·m−3 respectively. Given that the average feed water temperature was 5.73 °C, the predicted average energy consumption would be 0.54 kWh·m−3 of produced water for the proposed full-scale process at WTP Görvälnverket.
5. Conclusions
Pilot studies are valuable to find optimal conditions for nanofiltration of lake water rich in organic material. The NOM removal based on capillary NF membranes from modified polyethersulfone (PES) proved to be suitable for direct nanofiltration of surface water from Lake Mälaren with high removal of NOM and minimal removal of salts.
The influence of filtration and cross flow velocity on permeate quality can be described using the solution diffusion model. Therefore, the HFW1000 membrane can be categorized as a non-porous membrane with respect to NOM removal.
Employing the solution diffusion model, the model parameters ‘B’ and ‘D’ can be determined. For surface water from Lake Mälaren source specific model parameters were calculated based on TOC analysis as:
B = 1.69 × 10⁻⁷ m·s−1
D = 1.65 × 10⁻¹⁰ m2·s−1
These model parameters can be used to design full-scale plants.
The permeate quality was greatly improved after nanofiltration. Preferential removal of UV over HS as compared to DOC was observed. Only low molecular acids and low molecular non-charged matter passed through the membrane, while high molecular compounds were retained.
Optimal cross flow was close to 0.75 m·s−1 at 80% recovery with a flux of 12–18 L·m−2·h−1. Under these conditions, around 80% of the UV, 75% of the Humic substances (Mw = 600) and 70% of TOC (from 8 to below 2 mg·L−1) were removed. Higher cross flow velocities led to a marginal improvement (+2%) while increasing and decreasing membrane flux degraded permeate water quality. Apparent optimized diffusion coefficients for UV and TOC were around 1.2–2.4 × 10⁻¹⁰ m2·s−1 and are close to values found in the literature. Due to their higher diffusion coefficients and higher permeability coefficient only around 40% of the low molecular weight acids (MW = 300–400) were retained. Between 30% and 40% of the low molecular acids that permeate the membrane can be removed with post nanofiltration via granulated activated carbon.
The resulting energy consumption of a hypothetical four-stage design, at average operating temperature of 5.73 °C, for the proposed full-scale process was calculated to be 0.54 kWh·m−3 produced water.
Acknowledgments
Financial support of the GenoMembran-project funded by The Swedish Water and Wastewater Association (Swedish Water Development, SVU) is gratefully acknowledged. Pentair X-Flow is acknowledged for the provision of various test modules. The authors would also like to acknowledge Kristina Dahlberg for her contribution of reagents, materials, and analytical tools, as well as Kenneth M. Persson for advise on data analysis.
Author Contributions
Alexander Keucken and Tom Spanjer designed and planned the experiments; Alexander Keucken performed the experiments; Tom Spanjer and Alexander Keucken contributed analysis tools. All the authors analyzed the data and wrote the paper.
Conflicts of Interest
The authors declare no conflict of interest. The funding sponsors had no role in the design of the study; in the collection, analyses, or interpretation of data; in the writing of the manuscript, and in the decision to publish the results.
Glossary of Terms
| Term | Definition |
| B | Solute Permeability Coefficient |
| C | Correction Factor |
| Cb | Concentration of Bulk |
| CEFF | Chemically Enhanced Forward Flushing |
| CIP | Cleaning In Place |
| Cp | Concentration of Permeate |
| D | Hydraulic Membrane Diameter |
| D | Solute Diffusion Coefficient |
| DBP | Disinfection By-Product |
| DOC | Dissolved Organic Carbon |
| GAC | Granulated Activated Carbon |
| HS | Humic Substances |
| JBW | Backwash Flux |
| JF | Filtration Flux |
| K | Mass Transfer Coefficient |
| L | Membrane Length |
| LC-OCD | Liquid Chromatography-Organic Carbon Detection |
| LMWN | Low Molecular Weight Neutrals |
| MW | Molecular Weight |
| MWCO | Molecular Weight Cut-Off |
| NF | Nanofiltration |
| NOM | Natural Organic Matter |
| PES | Polyethersulfone |
| R | Recovery Rate |
| SEM | Scanning Electron Microscopy |
| SUVA | Specific Ultraviolet Absorbance |
| TMP | Transmembrane Pressure |
| TOC | Total Organic Carbon |
| UF | Ultrafiltration |
| VCF | Cross Flow Velocity |
| WTP | Water Treatment Plant |
| Η | Removal Efficiency |
| χII | Partly-retained Fraction |
| χIII | Non-retained Fraction |
Appendix A

Table A1.
All data (UV, DOC, TOC) and relevant data on container plant.
| Experiment No. | Actual Order | [m·s−1] | [L·m−2·h−1] | [%] | UV Feed | UV Concentrate | UV Permeate | TOC Feed | TOC Concentrate | TOC Permeate | DOC Feed | DOC Concentrate | DOC Permeate |
|---|---|---|---|---|---|---|---|---|---|---|---|---|---|
| 1 | 3 | 0.25 | 5 | 50 | 2.086 | 2.139 | 0.226 | 13.1 | 13.3 | 2.16 | 13.0 | 12.7 | 1.72 |
| 2 | 1 | 0.25 | 10 | 50 | 1.972 | 2.137 | 0.205 | 12.8 | 13.1 | 2.01 | 12.4 | 12.5 | 1.56 |
| 3 | 13 | 0.25 | 15 | 50 | 1.888 | 2.108 | 0.235 | 12.1 | 13.1 | 2.15 | 10.8 | 12.8 | 2.05 |
| 4 | 7 | 0.25 | 20 | 50 | 1.76 | 2.008 | 0.244 | 12.1 | 14.8 | 2.06 | 11.2 | 13 | 1.95 |
| 5 | 12 | 0.25 | 25 | 50 | 1.636 | 1.911 | 0.237 | 10.4 | 12.5 | 2.32 | 10.1 | 11.5 | 2.12 |
| 6 | 6 | 0.5 | 5 | 50 | 2.13 | 2.146 | 0.217 | 12.6 | 12.9 | 2.19 | 12.4 | 12.6 | 1.72 |
| 7 | 16 | 0.5 | 10 | 50 | 2.183 | 2.223 | 0.196 | 14.6 | 15.1 | 1.65 | 14.5 | 15.1 | 1.64 |
| 8.1 | 0 | 0.5 | 15 | 50 | 2.078 | 2.218 | 0.18 | 13.2 | 13.7 | 2.7 | 11.9 | 12.5 | 1.75 |
| 8.2 | 9 | 0.5 | 15 | 50 | 1.996 | 2.143 | 0.176 | 13.6 | 13.7 | 1.7 | 12.5 | 13.2 | 1.36 |
| 8.3 | 21 | 0.5 | 15 | 50 | 2.083 | 2.236 | 0.187 | 14.3 | 15.2 | 1.25 | 14.2 | 15.2 | 1 |
| 9 | 8 | 0.5 | 20 | 50 | 1.963 | 2.117 | 0.184 | 14.1 | 15.4 | 1.75 | 12.3 | 13.5 | 1.42 |
| 10 | 4 | 0.5 | 25 | 50 | 1.994 | 2.21 | 0.199 | 13 | 13.8 | 1.78 | 12.7 | 13.1 | 1.65 |
| 11 | 14 | 0.75 | 5 | 50 | 2.095 | 2.118 | 0.224 | 13.8 | 14.2 | 1.52 | 13.5 | 14.2 | 1.46 |
| 12 | 17 | 0.75 | 10 | 50 | 2.19 | 2.21 | 0.179 | 14.7 | 15.2 | 1.5 | 14.5 | 15.2 | 1.48 |
| 13 | 10 | 0.75 | 15 | 50 | 2.155 | 2.267 | 0.158 | 15.5 | 16 | 1.68 | 13.5 | 13.8 | 1.2 |
| 13.1 | 22 | 0.75 | 15 | 50 | 2.189 | 2.264 | 0.165 | 13.9 | 14.3 | 1.43 | 14.4 | 15.3 | 1.33 |
| 14 | 20 | 0.75 | 20 | 50 | 2.23 | 2.219 | 0.16 | 14.5 | 15.5 | 1.31 | 14.4 | 15.5 | 1.25 |
| 15 | 11 | 0.75 | 25 | 50 | 2.059 | 2.191 | 0.151 | 14.4 | 15.8 | 1.6 | 13.2 | 13.5 | 1.13 |
| 16 | 15 | 1 | 5 | 50 | 2.125 | 2.146 | 0.224 | 14.2 | 14.3 | 1.48 | 14 | 14.3 | 1.48 |
| 17 | 2 | 1 | 10 | 50 | 2.09 | 2.222 | 0.165 | 13.2 | 13.5 | 1.66 | 12.2 | 12.8 | 1.65 |
| 18 | 18 | 1 | 15 | 50 | 2.183 | 2.28 | 0.159 | 14.1 | 14.2 | 1.48 | 14.8 | 15.2 | 1.3 |
| 19 | 5 | 1 | 20 | 50 | 2.078 | 2.194 | 0.144 | 12.5 | 13.1 | 1.52 | 12.6 | 12.8 | 1.4 |
| 20 | 19 | 1 | 25 | 50 | 2.118 | 2.279 | 0.149 | 14.5 | 15.6 | 1.18 | 14.4 | 15.5 | 1.16 |

Table A2.
All data (UV, DOC, LC-OCD) on pilot scale plant (B/D experiments).
| EXP | DOC ppb-C | HOC ppb-C | CDOC ppb-C | Bioply ppb-C | HS ppb-C | SUVA HS L/(mg·m) | MW g/mol | Buil ppb-C | LMW Neut ppb-C | LMW Acids ppb-C | Colloid (m−1) |
|---|---|---|---|---|---|---|---|---|---|---|---|
| A 3 | 7939 | 274 | 7666 | 457 | 183 | 3.86 | 632 | 1165 | 763 | n.q. | 0.082 |
| B 3 | 12,114 | 417 | 11,697 | 371 | 281 | 3.83 | 658 | 1845 | 1249 | n.q. | 0.096 |
| C 3 | 13,108 | 815 | 12,293 | 372 | 309 | 3.96 | 660 | 1932 | 1086 | n.q. | 0.131 |
| D 3 | 2146 | 379 | 1768 | 8 | 32 | 3.15 | 511 | 455 | 384 | 12 | 0.001 |
| A 13.1 | 7945 | 430 | 7515 | 259 | 172 | 3.98 | 658 | 1273 | 756 | n.q. | 0.077 |
| B 13.1 | 13,892 | 656 | 13,237 | 456 | 318 | 3.75 | 658 | 2122 | 1082 | n.q. | 0.150 |
| C 13.1 | 14,287 | 412 | 13,876 | 609 | 340 | 3.81 | 659 | 2165 | 1201 | n.q. | 0.112 |
| D 13.1 | 1433 | 223 | 1209 | 25 | 17 | 3.30 | 534 | 316 | 295 | 13 | 0.010 |
| A 8.2 | 7896 | 375 | 7521 | 215 | 184 | 3.87 | 653 | 1273 | 787 | n.q. | 0.052 |
| B 8.2 | 13,607 | 483 | 13,124 | 640 | 314 | 3.69 | 659 | 2002 | 1117 | n.q. | 0.093 |
| C 8.2 | 13,718 | 393 | 13,324 | 601 | 327 | 3.82 | 655 | 2048 | 1156 | n.q. | 0.090 |
| D 8.2 | 1700 | 248 | 1452 | 18 | 22 | 3.14 | 506 | 358 | 359 | 2 | 0.001 |
| A 18 | 7911 | 374 | 7537 | 251 | 177 | 3.95 | 668 | 1320 | 794 | n.q. | 0.060 |
| B 18 | 14,076 | 259 | 13,816 | 540 | 322 | 3.80 | 658 | 2155 | 1479 | n.q. | 0.120 |
| C 18 | 14,183 | 307 | 13,876 | 628 | 333 | 3.80 | 658 | 2160 | 1207 | n.q. | 0.110 |
| D 18 | 1488 | 205 | 1284 | 30 | 23 | 3.37 | 537 | 334 | 314 | 10 | 0.000 |
| A-S1 | 8496 | 392 | 8103 | 383 | 171 | 4.10 | 675 | 1054 | 750 | 42 | 0.055 |
| B-S1 | 13,260 | 346 | 12,913 | 589 | 279 | 4.10 | 698 | 1608 | 1027 | 47 | 0.095 |
| C-S1 | 14,437 | 600 | 13,837 | 659 | 297 | 4.14 | 696 | 1734 | 1079 | 33 | 0.101 |
| D-S1 | 1944 | 293 | 1651 | 7 | 16 | 3.75 | 559 | 350 | 321 | 34 | 0.001 |
| A-S2 | 8657 | 180 | 8477 | 313 | 183 | 3.99 | 689 | 1242 | 766 | 53 | 0.014 |
| B-S2 | 14,484 | 481 | 14,003 | 473 | 303 | 3.91 | 711 | 2005 | 1068 | 38 | 0.015 |
| C-S2 | 15,535 | 321 | 15,213 | 483 | 328 | 3.93 | 717 | 2209 | 1171 | 59 | 0.006 |
| D-S2 | 2013 | 282 | 1731 | 2 | 19 | 3.34 | 563 | 386 | 345 | 41 | 0.002 |
| A-S3 | 9027 | 141 | 8886 | 365 | 184 | 3.83 | 694 | 1200 | 722 | 75 | 0.075 |
| B-S3 | 30,028 | 419 | 29,610 | 1439 | 652 | 3.75 | 746 | 3279 | 1667 | 50 | 0.334 |
| C-S3 | 32,544 | 683 | 31,861 | 1733 | 643 | 3.67 | 727 | 3270 | 1759 | n.q. | 0.213 |
| D-S3 | 3447 | 308 | 3139 | 17 | 42 | 3.27 | 579 | 637 | 470 | 53 | 0.002 |
| A-S4 | 9033 | 93 | 8939 | 413 | 189 | 3.76 | 712 | 1228 | 756 | 21 | 0.076 |
| B-S4 | 21,003 | 485 | 20,518 | 999 | 475 | 3.82 | 741 | 2697 | 1437 | n.q. | 0.219 |
| C-S4 | 22,346 | 633 | 21,712 | 1090 | 503 | 3.83 | 703 | 2584 | 1410 | n.q. | 0.234 |
| D-S4 | 2740 | 304 | 2436 | 5 | 32 | 3.38 | 567 | 548 | 428 | 29 | 0.005 |
Note: n.q. stands for concentrations not quantifiable or below the detection limit.
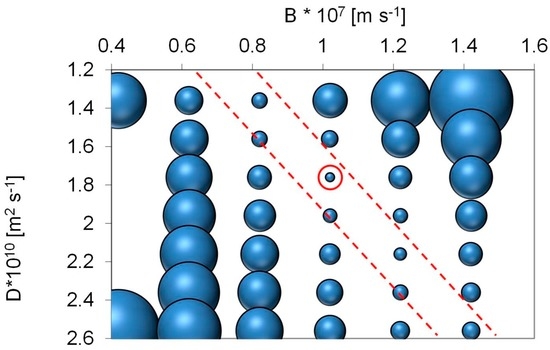
Figure A1.
Plot of sum of systematic change of errors between modelled predicted and experimental DOC data when changing both D and B in increments of 0.2 units. D was varied from 1.36 to 2.76 and B between 0.22 and 1.22. An approximately linear relation exists between D and B (D = −0.28 + 2 × B) that describes in which area space optimum conditions for B and D occur. Points between the two red lines have sum of errors that are within a factor of two with respect to the local minimum for B = 1.02 × 10⁻⁷ and D = 1.76 × 10⁻¹⁰.
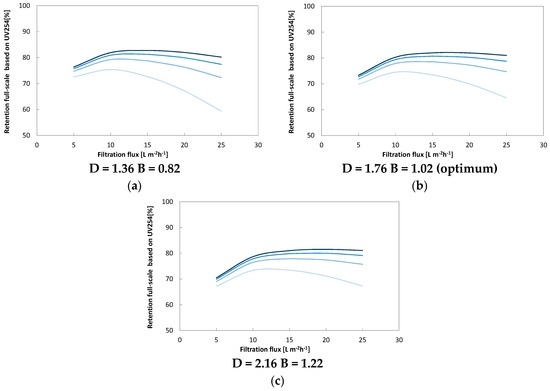
Figure A2.
Illustration of potential outcome of varying optimum conditions for B and D along the optimum line presented above. Small values for both D and B (a), D and B decrease the optimum (b) window while larger values (c) D and B increase the apparent optimum range of operation. Overall this effect is smallest for cross flow rates between 0.5 and 0.75 L·s−1 and larger deviations occur for both the lowest (0.25 L·s−1) and the highest crossflow (L·s−1).
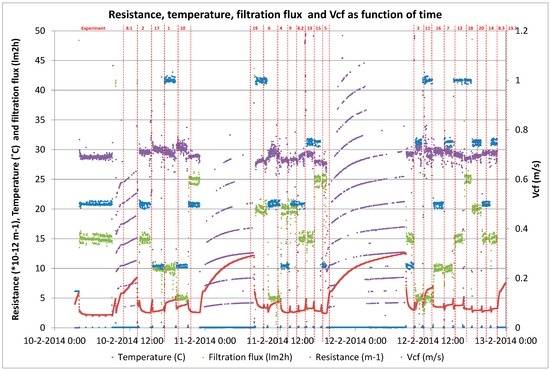
Figure A3.
Membrane performance during short term trials for determination of B/D coefficients.
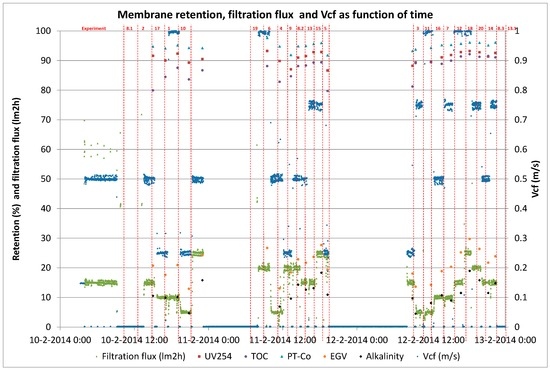
Figure A4.
Retention behavior during short term trials for determination of B/D coefficients.
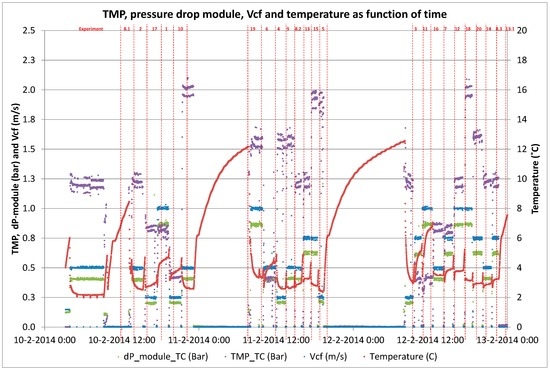
Figure A5.
Membrane performance during short term trials for determination of B/D coefficients.
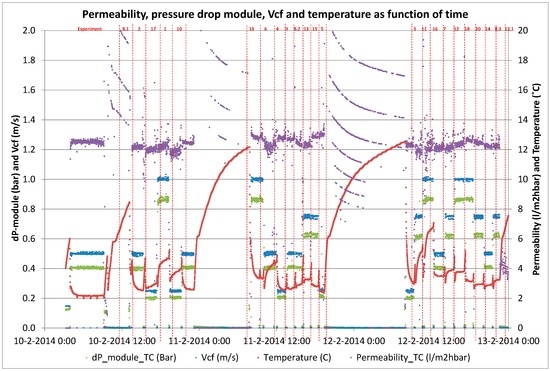
Figure A6.
Membrane performance during short term trials for determination of B/D coefficients.
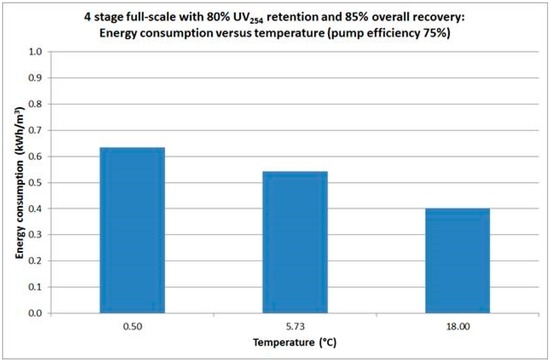
Figure A7.
Influence of temperature related to energy consumption for retrofit design.
References
- Granskog, M.; MacDonald, R.; Mundy, C.-J.; Barber, D. Distribution, characteristics and potential impacts of chromophoric dissolved organic matter (CDOM) in Hudson Strait and Hudson Bay. Canada. Cont. Shelf Res. 2007, 27, 2032–2050. [Google Scholar] [CrossRef]
- Park, J.H.; Kang, S.-Y.; Kim, S.-Y. Hydroclimatic controls on dissolved organic matter (DOM) chararcteristics and implications for trace metal transport in Hwangryoong River Watershed, Korea, during a summer monsoon period. Hydrol. Process. 2007, 21, 3025–3034. [Google Scholar] [CrossRef]
- Clements, W.; Brooks, M.; Kashian, D.; Zuellig, R. Changes in dissolved organic material determine exposure of stream benthic communities to UV-B radiation and heavy metals: Implications for climate change. Glob. Chang. Biol. 2008, 14, 2201–2214. [Google Scholar] [CrossRef]
- Köhler, S.J.; Buffam, I.; Seibert, J.; Bishop, K.H.; Laudon, H. Dynamics of stream water TOC concentrations in a boreal headwater catchment: Controlling factors and implications for climate scenarios. J. Hydrol. 2009, 373, 44–56. [Google Scholar] [CrossRef]
- Sulzberger, B.; Durisch-Kaiser, E. Chemical characterization of dissolved organic matter (DOM): A prerequisite for understanding UV-induced changes of DOM absorption properties and bioavailability. Aquat. Sci. 2009, 71, 104–126. [Google Scholar] [CrossRef]
- Pautler, B.; Woods, G.; Dubnick, A.; Simpson, A.; Sharp, M.; Fitzimons, S.; Simpson, M. Molecular characterization of dissolved organic matter in glacial ice: Coupling natural abundance 1H NMR and fluorescence spectroscopy. Environ. Sci. Technol. 2012, 46, 3753–3761. [Google Scholar] [CrossRef] [PubMed]
- Brezonik, W.; Arnold, W. Water chemistry: Fifty years of change and progress. Environ. Sci. Technol. 2012, 46, 5650–5657. [Google Scholar] [CrossRef] [PubMed]
- Diem, S.; von Rohra, M.; Heringa, J.; Kohlera, H.-P.; Schirmera, M.; von Gunten, U. NOM degradation during river infiltration: Effects of the climate variables temperature and discharge. Water Res. 2013, 47, 6585–6595. [Google Scholar] [CrossRef] [PubMed]
- Ritson, J.P.; Grahamb, N.J.D.; Templetonb, M.R.; Clark, J.M.; Gough, R.; Freemand, C. The impact of climate change on the treatability of dissolved organic matter (DOM) in upland water supplies: A UK perspective. Sci. Total Environ. 2014, 473–474, 714–730. [Google Scholar] [CrossRef] [PubMed]
- Monteith, D.T.; Stoddard, J.L.; Evans, C.D.; de Wit, H.A.; Forsius, M.; Høgåsen, T.; Wilander, A.; Skjelkvåle, B.L.; Jeffries, D.S.; Vuorenmaa, J.; et al. Dissolved organic carbon trends resulting from changes in atmospheric deposition chemistry. Nature 2007, 450, 537–539. [Google Scholar] [CrossRef] [PubMed]
- Delpla, I.; Jung, A.-V.; Baures, E.; Clement, M.; Thomas, O. Impacts of the climate change on surface water quality in relation to drinking water production. Environ. Int. 2009, 35, 1225–1233. [Google Scholar] [CrossRef] [PubMed]
- Trang, V.; Phuong, L.; Dan, N.; Thanh, B.; Visvanathan, C. Assessment on the trihalomethanes formation potential of Tan Hiep Water Treatment Plant. J. Water Sustain. 2012, 2, 43–53. [Google Scholar]
- Lavonen, E.E.; Gonsior, M.; Tranvik, L.J.; Schmitt-Kopplin, P.; Köhler, S.J. Selective chlorination of natural organic matter: Identification of previously unknown disinfection byproducts. Environ. Sci. Technol. 2013, 47, 2264–2271. [Google Scholar] [CrossRef] [PubMed]
- Eikebrokk, B.; Vogt, R.D.; Liltved, H. NOM increase in Northern European source waters: Discussion of possible causes and impacts on coagulation/contact filtration processes. Water Sci. Technol. 2004, 4, 47–54. [Google Scholar]
- Sharp, E.; Jarvis, P.; Parsons, S.; Jefferson, B. Impact of fractional character on the coagulant of NOM. Colloids Surf. A. Physicochem. Eng. Asp. 2006, 286, 104–111. [Google Scholar] [CrossRef]
- Futselaar, H.; Schonewille, H.; Meer, W.V.D. Direct filtration nanofiltration—A new high-grade purification concept. Desalination 2002, 145, 75–80. [Google Scholar] [CrossRef]
- Spenkelink, F.J. Capillary Nanofiltration—Influence of Membrane Characteristics & Process Parameters on Permeate Quality. Master’s Thesis, UNESCO-IHE, Delft, The Netherlands, January 2012. [Google Scholar]
- Köhler, S.J.; Lavonen, E.E.; Keucken, A.; Schmitt-Kopplin, P.; Spanjer, T.; Persson, K.M. Upgrading coagulation with hollow-fibre nanofiltration for improved organic matter removal during surface water treatment. Water Res. 2016, 89, 232–240. [Google Scholar] [CrossRef] [PubMed]
- Lidén, A.; Persson, K.M. Comparison between ultrafiltration and nanofiltration hollow-fiber membranes for removal of natural organic matter—A pilot study. J. Water Supply Res. Technol.-Aqua 2015, 65. [Google Scholar] [CrossRef]
- Keucken, A.; Wang, Y.; Tng, K.H.; Leslie, G.L.; Persson, K.M.; Köhler, S.J.; Spanjer, T. Evaluation of novel hollow fiber membranes for NOM removal by advanced membrane autopsy. Water Sci. Technol. Water Supply 2016, 16, 628–640. [Google Scholar]
- Van der Bruggen, B.; Schaep, J.; Wilms, D.; Vandecasteele, C. Influence of molecular size, polarity and charge on the retention of organic molecules by nanofiltration. J. Membr. Sci. 1999, 156, 29–41. [Google Scholar] [CrossRef]
- Van der Bruggen, B.; Vandecasteele, C. Removal of pollutants from surface water and groundwater by nanofiltration: Overview of possible applications in the drinking water industry. Environ. Pollut. 2003, 122, 435–445. [Google Scholar] [CrossRef]
- Wijmans, J.G.; Baker, R.W. The solution-diffusion model: A review. J. Membr. Sci. 1995, 107, 1–21. [Google Scholar] [CrossRef]
- Wijmans, J.G. The role of permanent molar volume in the solution-diffusion model transport equations. J. Membr. Sci. 2004, 237, 39–50. [Google Scholar] [CrossRef]
- Hoek, E.M.; Elimelech, M. Cake-enhanced concentration polarization: A new fouling mechanism for salt-rejecting membranes. Environ. Sci. Technol. 2003, 37, 5581–5588. [Google Scholar] [CrossRef] [PubMed]
- Bandini, S.; Vezzani, D. Nanofiltration modeling: The role of dielectric exclusion in membrane characterization. Chem. Eng. Sci. 2003, 58, 3303–3326. [Google Scholar] [CrossRef]
- Wang, X.M.; Li, B.; Zhang, T.; Li, X.Y. Performance of nanofiltration membrane in rejecting trace organic compounds: Experiment and model prediction. Desalination 2015, 370, 7–16. [Google Scholar] [CrossRef]
- Kong, F.X.; Yang, H.W.; Wang, X.M.; Xie, Y.F. Assessment of the hindered transport model in predicting the rejection of trace organic compounds by nanofiltration. J. Membr. Sci. 2016, 498, 57–66. [Google Scholar] [CrossRef]
- Kataoka, T.; Tsuru, T.; Nakao, S.I.; Kimura, S. Permeation equations developed for prediction of membrane performance in pervaporation, vapour permeation and reverse osmosis based solution-diffusion model. J. Chem. Eng. Jpn. 1991, 24, 326–333. [Google Scholar] [CrossRef]
- Nagy, E.; Kulcsár, E.; Nagy, A. Membrane mass transport by nanofiltration: Coupled effect of the polarization and membrane layers. J. Membr. Sci. 2011, 368, 215–222. [Google Scholar] [CrossRef]
- Spenkelink, F.J.; Wennekes, W.B.; Blankert, B.; Knops, F.; Dekker, R.; Potreck, J. New Developments in Hollow Fiber Nanofiltration. In Proceedings of the 2nd Dissemination Workshop of the Nano4water Cluster, Chalkidiki, Greece, 24–25 April 2012.
- Romera, C.A.; Davis, R.H. Global model of crossflow microfiltration based on hydrodynamic diffusion. J. Membr. Sci. 1988, 39, 117. [Google Scholar] [CrossRef]
- Thorsen, T. Concentration polarization by natural organic matter (NOM) in NF and UF. J. Membr. Sci. 2004, 233, 79–91. [Google Scholar] [CrossRef]
- Mulder, M. Basic Principles of Membrane Technology, 2nd ed.; Technical University of Twente: Enschede, The Netherlands, 1996. [Google Scholar]
- Park, N.; Cho, J. Natural organic matter diffusivity for transport characterizations in nanofiltration and ultrafiltration membranes. J. Membr. Sci. 2008, 315, 133–140. [Google Scholar] [CrossRef]
- Huber, S.A.; Balz, A.; Abert, M.; Pronk, W. Characterisation of aquatic humic and non-humic matter with size-exclusion chromatography-organic carbon detection-organic nitrogen detection (LC-OCD-OND). Water Res. 2011, 45, 879–885. [Google Scholar] [CrossRef] [PubMed]
- Laurell, P.; Sivonen, K.; Poutanen, H.; Vuoriletho, V.-P.; Hesampour, M.; Kettunen, V.; Tuutijärvi, T.; Vahala, R. Applicability of loose nanofiltration membranes for the removal of natural organic matter from soft surface water. In Proceedings of the 5th IWA Specialist Conference on Natural Organic Matter in Water, Malmö, Sweden, 7–10 September 2015.
© 2016 by the authors; licensee MDPI, Basel, Switzerland. This article is an open access article distributed under the terms and conditions of the Creative Commons Attribution (CC-BY) license (http://creativecommons.org/licenses/by/4.0/).