Article

Microeconomics of Deficit Irrigation and Subjective Water Response Function for Intensive Olive Groves

1
Department of Economic Analysis, University of Sevilla, 41018 Sevilla, Spain
2
Department of Agricultural Economics, University of Córdoba, 14014 Cordoba, Spain
*
Author to whom correspondence should be addressed.
Water 2016, 8(6), 254; https://doi.org/10.3390/w8060254
Submission received: 11 May 2016 / Revised: 6 June 2016 / Accepted: 8 June 2016 / Published: 15 June 2016

Abstract

:
This research paper analyzes the economics of deficit irrigation based on the use of subjective estimates of the crop yield–water relationship to determine water supply in irrigated olive groves. Interviewed farmers were asked to give three estimates for the yield-water relationship as a function of water supply (full irrigation, usual deficit irrigation and extreme deficit irrigation). Those responses are contrasted with the actual irrigation dose and the results appear to support the hypothesis that a majority of farmers use deficit irrigation as a strategy that maximizes the value of limited water input rather than the conventional microeconomic behavior of maximizing the return to land.

1. Introduction

Water is the limiting factor for biomass production in many countries of the world, especially in regions with summer water scarcity where irrigation is generally the main consumer of water resources. Water allocation policies are critical for optimizing the economic benefits of water as a key resource for economic growth, job creation and global well-being.
Agricultural productivity and input use is based on farmers’ decision-making processes, with the farmer acting as a rational agent whose main decision criterion is profit maximization, while also taking into account some other criteria such as risk minimization and a number of subjective factors (risk attitude, uncertainty perception, personal values and beliefs, etc.). In this regard, farmers’ decisions regarding input consumption, which are based on available information and subjective beliefs, affect the local environment. Such decisions also have a local and global impact both on the regional and wider economy through fertilizer levels, seed quality, and the use of pesticides or water.
This paper attempts an exploratory analysis of the microeconomics of deficit irrigation (DI) that may significantly impact the economics of irrigation at both an individual level and at basin scale. Molden et al. [1] argue that water productivity can be improved by practices including water harvesting, supplemental irrigation, deficit irrigation, precision irrigation techniques and soil-water conservation practices. Our research focuses on the technique of deficit irrigation as defined by [1] consisting of the supply of irrigation water below the total irrigation requirements throughout the crop cycle and the subjective beliefs about water production function that farmers could attribute to this technology.
Farmer decision-making determines input combinations (i.e., level of fertilizer use, water dose) and decisions regarding resource use determine the environmental impact of agriculture. Greiner et al. [2] conclude that a better understanding of farmers’ motivations and risk attitudes is required to define public policies that can lead to significant improvements in the environmental performance of agriculture, since take-up is strongly affected by factors other than the financial benefit of the innovation, and particularly by personal factors relating to values, motivation and risk assessment.
This paper aims to test the hypothesis that farmers maximize returns for the water considering water volume as fixed and land as a variable input, instead of the conventional economic optimum of maximum returns for the land with water as the variable input and land as the limited factor. This behavior is consistent with the perception of the water resources in basins or in locations where water resources are considered the most important limiting factor for agricultural production as it is the case for many farmers around the world, especially for those with extensive crops (maize, grain, cotton) in dry countries where the strategy is to maximize returns for the water, not land.
In order to test the above-mentioned hypothesis, we surveyed farmers of irrigated intensive olive groves located in southern Spain in order to determine: (1) whether farmers have rational expectations regarding the water-yield relationship; (2) whether the decisions regarding the level of water use correspond to the maximization returns for water or, conversely, whether farmers behave as if they are maximizing returns for land. We should mention that in 2010–2015 southern Spain produced around 50% of total world olive oil production, so the area under study is the most important in this sector worldwide.
The structure of the paper is as follows. The next section presents the microeconomic foundations of a decision-making model of water use by irrigators; Section 3 presents the material with a brief description of the case study, a descriptive analysis of the survey and the methodology applied. Section 4 illustrates the main results, followed by a discussion in Section 5. Finally, Section 6 outlines the main conclusions of the paper.

2. Water Use Decision-Making by Irrigators

Most of the decision-making models in agriculture are based on the use of objective data about economic and physical attributes (Anderson et al. [3] review the different models). Alternatively, Hardaker and Lien [4] argue that decision-making analysis should explore the subjectivist view where the probability of an outcome is defined as the degree of belief in an uncertain proposition. This is in contrast to the dominant approach based on objective probability, which is defined as the limit of a relative frequency ratio [3].
This paper adopts the alternative approach for two reasons. Firstly, in the context under analysis there is a lack of robust, scientifically observed data. Secondly, we want to compare observed behavior regarding water use with the theoretical predictions produced by economic theory on the microeconomics of deficit irrigation as explained in the seminal work of English [5].
There is limited published research on farmers’ perceived expectations of temporal yield variability (e.g., [6]). Rejesus et al. [7] studied the spatial dimensions of yield variability and subjective perceptions. The paper by Griffiths et al. [8] is one of the limited published works regarding the subjective input-yield relationship.
A previous analysis of farmers’ subjective perceptions of the water-yield relationship in irrigated intensive olive groves is presented by Berbel and Gutierrez [9] and they propose a normative model. On the contrary, this paper is focused on an empirically deduced model. Measuring the relationship between crop yield and used water is the most general approach to water management. It was initially developed by Doorenbos and Kassam [10], while Steduto et al. [11] present an updated and comprehensive review of the coefficients that regulate crop response to water supply. There is a large body of literature that analyzes yield-irrigation functions, since the relationship between irrigation and crop yield provides the basis for optimal irrigation management. As we mention above, however, most of the models are based on estimated agronomic coefficients or experimentally determined water-yield relationships.
Traditionally, a farmer determines the irrigation dose (W) taking into account the level of evapotranspiration (ET), the value of the effective rainfall and irrigation efficiency. Additionally, irrigation efficiency depends on the uniformity of application and the relative irrigation supply (RIS). RIS is a ratio of the applied supply of irrigation water compared to the maximum irrigation needs [12], in contrast to the relative water supply which also includes rainfall. When irrigation tightly fills the gap of water requirements after they are met by rain, RIS is near unity. In the short term, the decision variable that can be managed is the irrigation dose.
The value of water, and water demand, is a function of marginal productivity, which when multiplied by the product’s price yields the marginal value of water. The marginal productivity of relative irrigation water supply is the partial derivative of the production function Y(w) with respect to water “w”.
A majority of the water use models are based on the assumption that there is limited availability of irrigated land, but water supply is unlimited (i.e., it significantly exceeds crop needs). Accordingly, water is treated as a variable input and land as a constrained resource. This assumption implies that farmers displaying rational economic behavior should maximize the following profit equation:
Z = P y Y P w W C
where Z denotes profit, Py is the price of the crop, Pw is the price of water, and C represents fixed costs. In their model of deficit irrigation, Berbel and Mateos [13] expanded the model developed by English [5] to account for deficit irrigation, efficiency changes and the situation in which land is not a binding constraint and water is a limiting factor. Thus, farmers who behave rationally in an economic sense seek to maximize total net income:
Z A = A ( P y Y P w W C )
In this equation, farmers may distribute the irrigation dose over a larger irrigated area “A”, which is considered a variable in the maximization process. In this model, the fixed factor is water volume “V”, which is constrained so that irrigated area “A” is determined by the total volume of available water “V” (e.g., well capacity, water rights, etc.) and the chosen water dose “W”.
A = V W
Optimal water use is then defined by the value of W that optimizes Equations (2) as subject to Equation (3).
A Z W = Z A W
English and Raja [14] illustrate this model with an example based on a quadratic water response production and cost functions, such as those represented below:
Y(w) = a1 + b1W + c1W2
C(w) = a2 + b2W
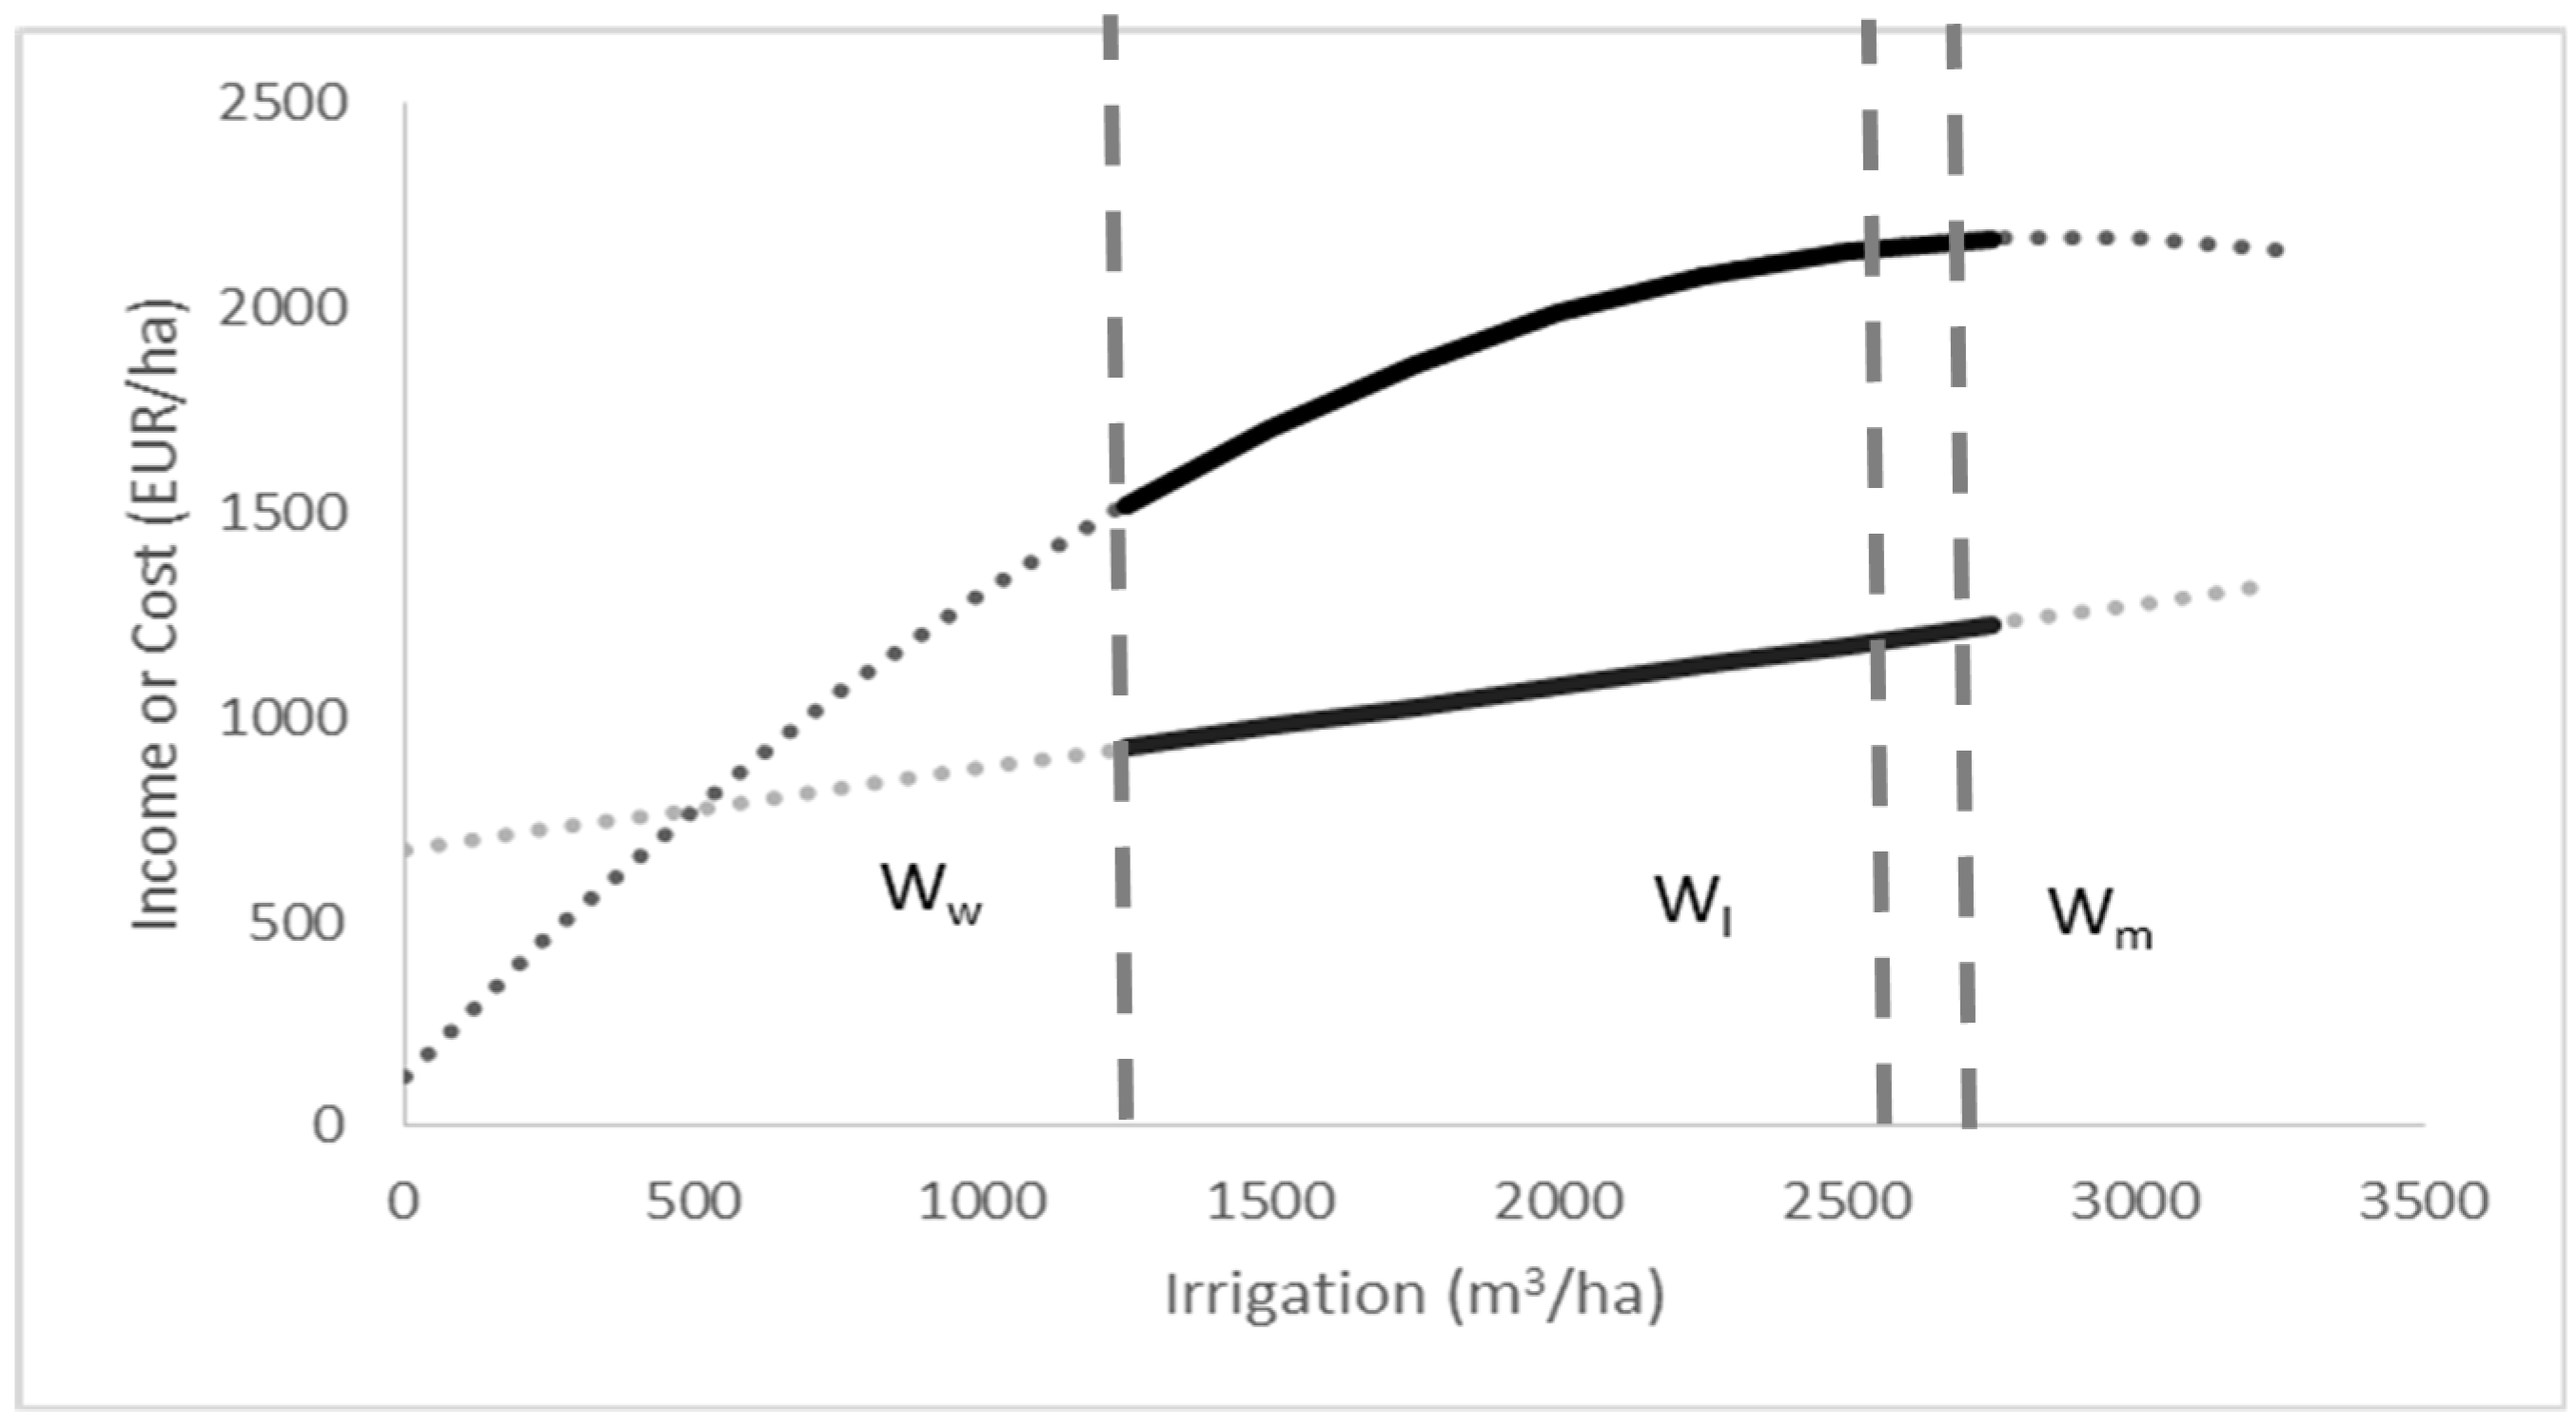
The solution to the optimization problem posed in Equation (1) takes land as the fixed input and water as the variable input. This is based on the conventional assumptions regarding farmer decision-making; that is, that they are seeking economic optima in the use of inputs such as water and others that are considered “freely variable inputs”. The solution to this optimization problem represents the maximum return to land and is determined by the value of water dose “Wl” given by:
W l =   b 2 P y b 1 2   P y c 1
The solution to the second problem posed in Equation (2) considers water as a limited input while land becomes a freely variable input. This alternative model gives the maximum return to water (dose “Ww”) which is determined by solving Equation (4):
W w = ( P y a 1 a 2 P y c 1 ) 1 / 2
Finally, it is relevant to the microeconomic analysis of irrigation to determine the maximum yield solution. This straightforward solution is widely used to determine the maximum irrigation requirements; by solving Equation (1) the maximum yield is found at the point “Wm” represented by:
W m =   b 1 2   c 1
The latter solution is relevant in terms of agronomic analysis, and it is equal to the economic optimum when the price of water is zero in the land-constrained model (Equation (1)). Regarding the parameters in the model, English [5] included all variable costs linked to water application in Pw. Our simplified model focuses on water; therefore, we do not consider substitution relationships between irrigation water and other inputs but consider them as fixed.
This research aims to compare the actual dose that a farmer applies to a crop with these three solutions to the optimization problem. The crop system under study is irrigated intensive olive orchards and the data were obtained by means of a survey that is described in the next section.

3. Materials

3.1. Case Study

The case study selected to analyze farmers’ subjective beliefs about the water-yield relationship focused on irrigated olive groves in Andalusia (southern Spain). The area under study forms part of the Guadalquivir River Basin, which is the longest river in southern Spain with a 650 km length and a total combined length of the river and its tributaries of around 10,700 km. The basin covers an area of 58,000 km2 with a population of 4.1 million (the most populated cities are Seville, Cordoba and Granada). It has a Mediterranean climate with an uneven rainfall distribution (630 mm) and an average annual temperature of 16.8 °C [15]. Annual renewable resources are estimated at 7.1 × 10⁹ m3 for surface waters and 2.6 × 10⁹ m3 for groundwater. In 2005, per capita water consumption in the basin was 1600 m3, and agriculture was the top consumer with 87% of the total. For an analysis of the evolution of the Guadalquivir Basin and the role of irrigated olive production in the basin trajectory see Berbel et al. [16].
In 2014, the Spanish agricultural area dedicated to irrigated olive trees amounted to 740,511 ha [8]. Though initially famers simply installed drip irrigation systems into existing traditional groves (100 trees per hectare), new irrigation technologies have allowed farmers to significantly increase tree densities in order to create intensive groves (between 250 and 300 trees per hectare) or superintensive groves (around 800 trees per hectare).
Moriana et al. [17] estimated the water response for traditional-density olive groves (100 trees per hectare), resulting in a quadratic response of yield (tons of olive oil per ha) to seasonal evapotranspiration. Mesa-Jurado et al. [18] used this production function to estimate the value of water based on the agronomic estimated response.
Our study uses an alternative approach: we take the subjective “perceived production function” as the microeconomic foundation of a farmer’s decision-making process regarding water use, rather than the “objective” production function traditionally used in the literature. The focus of the research is intensive olive groves (around 275 trees per hectare). The original survey consisted of 99 observations (farmers), and average values in the survey are: (a) farm size: 40 ha; (b) density: 283 trees/ha; (c) allocation total water rights: 2723 m3/ha (referred to as the legal water quota owned by the farmer); and (d) irrigation doses: 1028 m3/ha. We observe a discrepancy here, as water use represents 38% of water rights (irrigation dose/water rights = 1028/2723), which we consider an indication of the dominant deficit irrigation strategy studied in our research. Potential evapotranspiration (PET) in the year of the survey was estimated at 492 mm for the intensive olives.

3.2. Survey Description

The field work was conducted in spring 2014 with information given by 99 farmers of intensive olive groves in the Guadalquivir River Basin (southern Spain) regarding yield and irrigation doses per ha, among other data, in the period 2010–2013.
The descriptive statistics of variables that characterize our survey (crop area, density, age of olive groves and assigned irrigation rights) are shown in Table 1, together with information regarding average production (olive kilograms) and irrigation dose (m3) applied in the period 2010–2013. Although the variability within the sample seems high, the table shows that the observed farmers tend to apply an irrigation dose far smaller than that permitted according to their assigned water rights, displaying, on average, a preference for a scenario characterized by deficit irrigation. Accordingly, the next sections of our study compare this observed behavior regarding water use to the theoretical assumptions of economic theory on the microeconomics of deficit irrigation. Additionally, some possible explanations for this behavior will be discussed in Section 5 and Section 6.

3.3. Perceived Water Yield Response

The water production function was elicited by asking farmers about their expectations regarding water volume and yield for three irrigation levels: full irrigation, usual DI and extreme DI. We assume that farmers will give rational answers and we need values that:
  • Identify the volume-yield for each of the three irrigation levels.
  • Exhibit decreasing returns to scale for the different irrigation levels.
  • Generate a water-yield curve in the “normal” agronomic range (maximum yield should be within the normal range for the crop and region).
An example of a valid response from farmer #58 is shown below. This farmer declared that his expectations regarding water-yield for our three irrigation levels are: (a) full irrigation (2600 kg; 8500 m3); (b) usual deficit irrigation (1300 kg; 7000 m3); and (c) extreme deficit irrigation (400 kg; 3000 m3). Using these three points, a production function is estimated: Y = 400 + 4.6w − 0.0008w2. Considering that the average price at the farm gate is 0.43 EUR/kg, and the declared harvesting cost of farmer #42 is 0.12 EUR/kg, we can obtain a net price (Py = 0.31 EUR/kg). By means of this simple calculation, we can obtain our net income curve as Py-Y. The cost function is directly declared by the farmer with a fixed cost of 675 EUR/ha and a water variable cost of 0.20 EUR/m3. Finally, income and cost as a function of irrigated water for farmer #42 is shown in Figure 1.
After finding optima using Equations (5) and (6), a maximum yield point can be obtained (Equation (9)) and it is reached at Wm = 2671 m3/ha. Furthermore, an economic optimum for land as a fixed input and water as a freely variable input is denoted by Wl = 2563 m3/ha and a deficit irrigation water return optimum with land as a freely variable input is obtained at Ww = 1349 m3/ha (where water is the constrained input). In this case, farmer #42 registers an average water use in the observed time period (2010–2013) of Wo = 1500 m3/ha, which is close to the volume of 1349 m3/ha that is this farmer optimal irrigation level (or usual DI) for the maximum return to water optima.
Figure 1 helps to illustrate the three possible solutions: (a) maximum yield “Wm” is the point where the income (upper curve) reaches its maximum; (b) profit is the distance between income and cost (lower line), and the maximum distance between both curves is reached at Wl; (c) and finally Ww shows the profit per hectare when the objective is to optimize returns to water instead of returns to land.
In the following section, this model is applied to all farmers in the survey.

4. Results

4.1. Subjective Water Yield Response

Our research is focused on the expected or declared water production function compared to the observed behavior. A similar procedure to that used with farmer#58 as described above has been followed with all valid observations and the results are summarized in Table 2. From our initial sample of farmers (99), 21 of them (21.2%) provided information about only two levels of our elicited water-yield relationship, meaning that it was not possible to estimate an elicited production function in these cases. In the case of a further 30 observations (30.3%), despite providing information on the three levels, they presented estimation errors and were therefore not considered valid responses. Consequently, our sample was reduced to 48 behavioral observations. The different estimated optimal irrigation levels and the corresponding statistic parameters for the three possible scenarios (extreme DI, usual DI and full irrigation) are shown in Table 2.
As mentioned above, our model of decision-making behavior is based on farmers’ perceptions rather than measured information and this research thus uses a normative model rather than a descriptive or explicative model. In this regard, Table 2 shows our farmers’ perceptions regarding yield returns in response to an increase in the applied irrigation dose (from extreme DI to full irrigation). The elicited results show that farmers believed that they would obtain diminishing yield returns in response to the application of increasing irrigation doses (as was the case with observation #58). While the variability of the observations is high in all three irrigation scenarios, they all display a similar “rational” yield response to an increase in the applied irrigation doses.

4.2. Theoretical Solutions

Our aim is to test the hypothesis that in the context of water scarcity, farmers maximize returns to water rather than the classical assumption that they aim for a maximum profit per hectare (when land is the limited input). In this regard, our study compares actual irrigation doses applied by farmers to a crop with the three optimal solutions to the profit maximizing problem as set out by English [5] and described in Section 2.
To do so, we estimate the values of optimal solutions, Wm, Wl and Ww, for each farmer of our survey sample. The descriptive parameters of the estimates in each individual microeconomic model are shown in Table 3, along with the values corresponding to the most frequently-used irrigation dose (usual DI) given by the surveyed farmers and the average real irrigation doses applied in the period 2010–2013.
As Table 3 shows, the solution for maximum returns for land (Wl), known as the traditional economic optimum, is very different from the average dose applied by farmers (Wo) and the usual DI dose (Wu). Furthermore, the average dose is close to the irrigation dose which maximizes returns for water when water is the limited resource (Ww). A simple t-test of significance between the mean values of the data distributions for Wo and Wu, and that obtained from the estimated distribution of variable Ww, show that peer data distributions Wo and Ww, as well as the peer Wu and Ww, have similar distributions with statistically equal mean values. As the confidence interval includes zero at a 95% significance level, we can affirm that there is no significant difference between the means of the two contrasting data distributions. This result would seem to indicate that our farmers display similar behavior (on average) to that corresponding to the maximization of the returns to water, thus moving away from maximizing production or achieving the economic optimum.
The results obtained from the estimated microeconomic model confirm that olive grove farmers tend to maximize returns to water, considering water volume as a fixed input and land as a variable input. Thus, farmers’ irrigation decisions are not made with respect to the traditional consideration of maximum returns to land, where the economic optimum, in the sense of general microeconomic theory, is achieved with water as a freely variable input and land as a fixed resource.

5. Discussion

This paper has deliberately used farmers’ subjective beliefs as the basis for the microeconomic model. To our knowledge, there are no precedents for this approach for irrigated olive groves. One previous study in the agronomic literature has focused on low-density olive orchards (100 trees per hectare), resulting in an irrigation volume for maximum transpiration of around 2740 m3·ha−1, above which the marginal productivity is null [18]. The Guadalquivir Hydrological Plan establishes a water rights allocation of 1500 m3/ha for the traditional density of 100 trees per hectare [19]; this allocation is increased to 2500 m3/ha for intensive olive groves with densities of around 300 trees per hectare, such as those we have studied. Our research found that observed irrigation (2010–2013) in our high-intensity sample is 1103 m3/ha, that is, less than the allocated water rights but close to subjective economic optima considering water as a limited resource (with a theoretical solution of 1163 m3/ha).
The regional or basin-level impact of deficit irrigation has been addressed by Berbel, Mesa-Jurado and Piston [20]. They found that for the Guadalquivir Basin, with over 800,000 irrigated ha, the global average RIS for all crops is estimated at 71%, with some crops such as citrus, fruits and rice receiving full irrigation while others such as wheat, cotton or olive groves are cultivated under deficit irrigation regimes. In this regard, Berbel, Pedraza and Giannoccaro [16] explain the evolution and the trajectory of the basin that has led to this situation.
Although some authors have suggested that a strategy of deficit irrigation is the most financially profitable when both land and water are limited (see Ali et al. [21], for example), this technique has been advocated as a method to substantially increase the productivity of water [22] used in agriculture in order to meet food and environmental security goals [23]. In contrast, the approach of our research is not normative as in the three above-mentioned references (among others). On the contrary, we have presented here a description of the findings of our survey, concluding that farmers behave “as if” their goal were to maximize financial returns to water as a limiting factor. This strategy maximizes the productivity of water when compared with the technical maximum or land return maximization (which is always relatively close to the maximum yield) and it can be considered the key finding of our research.
The individual behavior of maximizing economic returns to water and consequently maximizing water productivity may have positive societal impacts, as outlined in the previous paragraph, but as Fereres et al. [24] argue, ”the complexity associated with the disposition of water in a hydrologic basin and beyond makes it difficult to assess the real impact of measures aimed at improving water productivity”. We believe that the aggregate consequences of the behavior described by our research should be analyzed at basin and at global levels in order to capture the full complexities of the water management systems where farmers become key players and agronomy becomes a critical science.
Furthermore, widespread adoption of deficit irrigation strategies may have agronomic and basin-scale hydrological consequences in terms of the so-called “rebound effect” described by Dagnino and Ward [25], who conclude that water administrators need to guard against increased depletion of the water sources with growing subsidies that reward reduced water applications. A complete review of the evidence regarding this effect can be found in the work of Berbel et al. [26]. All previous published research on the rebound effect of water-saving technologies analyzes infrastructure (distribution network improvement and equipment, e.g., drip irrigation), although deficit irrigation is an agronomic technique requiring no additional capital investment and therefore has not yet been examined in the literature on the rebound effect. The widespread application of deficit irrigation strategies may also have a rebound effect and the impact of a general use of deficit irrigation in the basin hydrological cycle has not yet been sufficiently explored.

6. Concluding Remarks

This study has presented preliminary results regarding the microeconomics of deficit irrigation but further research is required in order to account for other aspects such as uncertainty and farmer attitudes toward risk, which may explain some of the observed differences between farmer behavior and microeconomic analytical predictions. Although our research has found good aggregate similarities between predicted and observed water use, some individual differences still remain.
As we have pointed out, our research is focused on a specific area and crop and it has demonstrated a general use of deficit irrigation as a technique that allows the farmer to seek maximum returns to water. The extensive adoption of this technique will have serious consequences at the basin or aquifer level, requiring further research that is beyond the scope of our preliminary analysis.
Additionally, we need to expand the microeconomic analysis of deficit irrigation by extending the study to other crops, in order to produce more robust results regarding water use that are more generally applicable, since we understand that olive groves may be a very specific case. We hope that this paper may open an avenue for research in the field of water economics in terms of modeling farmers’ behavior and irrigation decision-making.

Acknowledgments

This research has been financed by the Secretaría General de Ciencia, Tecnología e Innovación (MINECOAGL2014-53417-R). We thank our colleagues L.M., F.O. and C.G. who provided insight and expertise that were of great assistance in this research. We also thank the editor and two anonymous reviewers for their constructive comments, which helped us to improve this manuscript.

Author Contributions

The authors contributed equally to this work.

Conflicts of Interest

The authors declare no conflict of interest.

Abbreviations

The following abbreviations are used in this manuscript:
DIDeficit Irrigation.
ETEvapotranspiration.
RISRelative Irrigation Supply.
WIrrigation Dose.

References

  1. Molden, D.; Oweis, T.; Steduto, P.; Bindraban, P.; Hanjra, M.A.; Kijne, J. Improving agricultural water productivity: Between optimism and caution. Agric. Water Manag. 2010, 97, 528–535. [Google Scholar] [CrossRef]
  2. Greiner, R.; Patterson, L.; Miller, O. Motivations, risk perceptions and adoption of conservation practices by farmers. Agric. Syst. 2009, 99, 86–104. [Google Scholar] [CrossRef]
  3. Anderson, J.R.; Dillon, J.L.; Hardaker, J.B. Agricultural Decision Analysis; Iowa State University Press: Ames, IA, USA, 1977. [Google Scholar]
  4. Hardaker, J.B.; Lien, G. Probabilities for decision analysis in agriculture and rural resource economics: The need for a paradigm change. Agric. Syst. 2010, 103, 345–350. [Google Scholar] [CrossRef]
  5. English, M. Deficit irrigation. I: Analytical framework. J. Irrig. Drain. Eng. 1990, 116, 399–412. [Google Scholar] [CrossRef]
  6. Clop-Gallart, M.M.; Juárez-Rubio, F. Elicitation of subjective crop yield PDF. Span. J. Agric. Res. 2007, 5, 16–24. [Google Scholar] [CrossRef]
  7. Rejesus, R.M.; Marra, M.C.; Roberts, R.K.; English, B.C.; Larson, J.A.; Paxton, K.W. Changes in producers’ perceptions of within-field yield variability after adoption of cotton yield monitors. J. Agric. Appl. Econ. 2013, 45, 295–312. [Google Scholar]
  8. Griffiths, W.E.; Anderson, J.R.; Hamal, K.B. Subjective distributions as econometric response data. Aust. J. Agric. Econ. 1987, 31, 127–141. [Google Scholar] [CrossRef]
  9. Berbel, J.; Gutiérrez-Martín, C. Farmer’s subjective elicited water response function for intensive olives and compromise programming method for irrigation supply decision. Econ. Agrar. Recur. Nat. 2015, 15, 51–68. [Google Scholar] [CrossRef]
  10. Doorenbos, J.; Kassam, A. Yield response to water. In FAO Irrig. Drain. Pap. 33; Food and Agriculture Organization of the United Nations: Rome, Italy, 1979; p. 193. [Google Scholar]
  11. Steduto, P.; Hsiao, T.C.; Raes, D.; Fereres, E. CropYield Response to Water; Food and Agriculture Organization of the United Nations: Rome, Italy, 2012. [Google Scholar]
  12. Molden, D.; Sakthivadirel, R.; Perry, C.J.; de Fraiture, C.; Koezen, W. Indicators for Comparing Performance of Irrigated Agricultural Systems; Research Report 20; International Water Management Institute: Colombo, Sri Lanka, 1998. [Google Scholar]
  13. Berbel, J.; Mateos, L. Does investment in irrigation technology necessarily generate rebound effects? A simulation analysis based on an agro-economic model. Agric. Syst. 2014, 128, 25–34. [Google Scholar] [CrossRef]
  14. English, M.; Raja, S.N. Perspectives on deficit irrigation. Agric. Water Manag. 1996, 32, 1–14. [Google Scholar] [CrossRef]
  15. Confederación Hidrográfica del Guadalquivir. Propuesta de Proyecto de Plan Hidrológico de la Demarcación Hidrográfica del Guadalquivir; MAGRAMA: Madrid, Spain, 2010. [Google Scholar]
  16. Berbel, J.; Pedraza, V.; Giannoccaro, G. The trajectory towards basin closure of a European river: Guadalquivir. Int. J. River Basin Manag. 2013, 11, 111–119. [Google Scholar] [CrossRef]
  17. Moriana, A.; Orgaz, F.; Pastor, M.; Fereres, E. Yield responses of a mature olive orchard to water deficits. J. Am. Soc. Hortic. Sci. 2003, 128, 425–431. [Google Scholar]
  18. Mesa-Jurado, M.A.; Berbel, J.; Orgaz, F. Estimating marginal value of water for irrigated olive grove with the production function method. Span. J. Agric. Res. 2010, 8, 197–206. [Google Scholar] [CrossRef]
  19. Ministerio de Agricultura, Alimentación y Medio Ambiente (MAGRAMA). Plan Hidrologico de Guadalquivir 2015; MAGRAMA: Madrid, Spain, 2016. [Google Scholar]
  20. Berbel, J.; Mesa-Jurado, M.A.; Piston, J.M. Value of irrigation water in Guadalquivir Basin (Spain) by residual value method. Water Resour. Manag. 2011, 25, 1565–1579. [Google Scholar] [CrossRef]
  21. Ali, M.H.; Hoque, M.R.; Hassan, A.A.; Khair, A. Effects of deficit irrigation on yield, water productivity, and economic returns of wheat. Agric. Water Manag. 2007, 92, 151–161. [Google Scholar] [CrossRef]
  22. Fereres, E.; Soriano, M.A. Deficit irrigation for reducing agricultural water use. J. Exp. Bot. 2007, 58, 147–159. [Google Scholar] [CrossRef] [PubMed]
  23. Molden, D.; Murray-Rust, H.; Sakthivadivel, R.; Makin, I. A water-productivity framework for understanding and action. In Water Productivity in Agriculture: Limits and Opportunities for Improvement; Kijne, J., Barker, R., Molden, D., Eds.; CAB International: Wallingford, UK, 2003; pp. 1–18. [Google Scholar]
  24. Fereres, E.; Orgaz, F.; Gonzalez-Dugo, V.; Testi, L.; Villalobos, F.J. Balancing crop yield and water productivity tradeoffs in herbaceous and woody crops. Funct. Plant Biol. 2014, 41, 1009–1018. [Google Scholar] [CrossRef]
  25. Dagnino, M.; Ward, F.A. Economics of agricultural water conservation: Empirical analysis and policy implications. Int. J. Water Resour. Dev. 2012, 28, 577–600. [Google Scholar] [CrossRef]
  26. Berbel, J.; Gutiérrez-Martín, C.; Rodríguez-Díaz, J.A.; Camacho, E.; Montesinos, P. Literature Review on Rebound Effect of Water Saving Measures and Analysis of a Spanish Case Study. Water Resour. Manag. 2014, 29, 663–678. [Google Scholar] [CrossRef]
Figure 1. Illustrative example of farmer #42. Values of net income and total cost per hectare for three solutions: maximum yield (Wm), maximum return to land (Wl) and maximum return to water (Ww). Water-yield relationship is obtained by eliciting farmers’ subjective beliefs.
Water 08 00254 g001
Table 1. Basic descriptive parameters.
Area(ha)Density (trees/ha)Age (years)Irrigation Rights (m3/ha)Yield (kg/ha)Irrigation Dose (m3/ha)
Average4028315272363821028
StDev6480618462344388
Min12084200333200
Max40057130700013,8332500
Table 2. Subjective water yield response descriptive values.
Extreme DIUsual DIFull Irrigation
Irrigation Dose (m3/ha)Yield (kg/ha)Irrigation Dose (m3/ha)Yield (kg/ha)Irrigation Dose (m3/ha)Yield (kg/ha)
Max.8008000250014,000500016,000
Min.3001000600200012002750
Mean53539151357696026779099
St. Dev.147162242524487962848
Table 3. Solutions to the microeconomic model and observed behavior.
Analytical SolutionSurvey
m3/haMax. Yield (Wm)Max. Return to Land (Water Free) (Wl)Max. Return to Water (Land Free) (Ww)Usual Dose (Wu)Avg. Dose 2010–2013 (Wo)
Maximum67596566273125002500
Minimum538613248600600
Median30602802101314501042
Average317830051163 1,21357 11103 2
St. Dev.13911298571425350
Notes: 1 At a 95% confidence interval, the t-test for the difference between means determines that Mean Wu = Mean Ww; 2 At a 95% confidence interval, the t-test for the difference between means determines that Mean Wo = Mean Ww.

