Article

Role of Conservation Adoption Premiums on Participation in Water Quality Trading Programs

1
Baruch Institute of Costal Ecology and Forest Science, Clemson University, P.O. Box 569, Clemson, SC 29442, USA
2
Department of Soil Science, North Carolina State University, Raleigh, NC 27695, USA
3
Department of Agricultural and Resource Economics, Colorado State University, Fort Collins, CO 80523-1172, USA
*
Author to whom correspondence should be addressed.
Water 2016, 8(6), 245; https://doi.org/10.3390/w8060245
Submission received: 26 April 2016 / Revised: 24 May 2016 / Accepted: 2 June 2016 / Published: 9 June 2016

Abstract

:
Over half of lakes, reservoirs, and ponds in the United States are threatened or impaired, mostly by nutrients. One policy to improve water quality is water quality trading (WQT). While the concept is appealing, adoption of conservation practices in these programs has been anemic at best. Using a case study in the newly-formed WQT market in Jordan Lake, North Carolina, we propose that part of the problem is a large adoption premium (AP) for this program. AP is the amount that farmers require over and above direct adoption costs to participate. In this study, farmers were asked at in-person interviews about their willingness to accept (WTA) a payment to adopt a particular conservation practice (riparian buffers) in order to generate and sell credits. We compared farmers’ WTA to their direct cost of participation, which allowed us to estimate an AP. On average, the AP more than doubles the cost of purchasing credits. The AP sums all of the known indirect costs already cited in the literature, and more, into a single value and is relatively simple to estimate. Knowing the AP would improve the ability of policy makers to accurately estimate what is needed to boost adoption rates in WQT programs and other conservation programs as well.

Graphical Abstract

1. Introduction

Degradation of water quality by nutrients is a concern facing communities all over the world. In the United States, in 2006, 60% of assessed lakes, reservoirs, and ponds were threatened or impaired for their designated uses, mostly due to nutrients [1]. Many different policies have been used to improve water quality, including water quality trading (WQT). Water quality trading is a market-based approach that allows sources with high pollution abatement cost to meet their regulatory obligations by buying pollution reductions from sources with a lower pollution reduction cost. In theory, water quality can be improved at a lower cost using WQT than command and control policies such as regulation [2]. Despite its appeal, the number of successful applications has been limited. Out of 37 WQT programs in the US, only three had actually experienced any trading activity by 2003 [3]. A recently released study by the National Network of Water Quality Trading [4] and others (e.g., [5,6]) suggests that programs can find success with knowledge and careful planning, but the idea has not generated any functioning markets to date, despite many attempts.
A low rate of adoption for conservation practices is not uncommon [7,8,9,10]. For example, in 2010, only 34% of major crop acres in the United States utilized no-tillage [11] grassed waterways occupied 22.5%, terraces 14.9%, and contour or strip copping was utilized on just 9.1% of major crop acreage. When developing programs, policy makers rely on adoption cost estimates to implement successful programs, but these estimates may be very different than what farmers themselves require to adopt practices [12]. Direct costs are straightforward to estimate and generally include implementation, maintenance, and opportunity costs for lost production. However, several studies have pointed out that farmers also have to consider transaction costs such as legal costs [13], and risk and uncertainty [2,14], for example, which are indirectly related to these direct costs but nevertheless very real. In addition, there may be other costs on top of these that have not yet been formally explored in the literature, which explains why programs that offer to just offset direct costs often fail to generate the desired results.
A growing number of studies have looked specifically at why WQT programs have failed to thrive and have identified several indirect costs, or hurdles to implementation [1,3,6,15,16,17,18,19]. Measuring the cost of these hurdles falls on a spectrum from relatively easy, such as direct costs, to difficult, including the impact of a trading ratio, and transaction costs, or baseline requirement, to nearly impossible (e.g., complete distrust of government). Perhaps the three most discussed indirect costs are transaction costs [13,19], trust [20,21,22], and risk and uncertainty [2]. For example, new trading rules and regulations create uncertainties for the WQT participants, leading producers, and their trading partners, to lack trust in the system or the participants [6,23,24]. Feather and Amacher showed that uncertain farm profit and uncertain environmental impacts affect adoption [25], but adoption increased when producers became more informed about a practice. Although both risk and trust are important, informing producers about practices in order to reduce their perceived risk, and to increase trust, was more important than actually reducing risk.
All indirect costs increase a farmer’s need to ask for more financial assistance, or for an adoption premium (AP), to cover their costs to participate in WQT programs, or any other conservation program for that matter. Failure to recognize and account for this premium will lead policy makers to underestimate the cost of farmers’ participation. If APs are large, it could help explain low adoption rates in most conservation programs. It could also help explain the nature of why some conservation practices are adopted more readily than others—some practices are more risky than others, for example. This study imputes the existence and impact of an AP on participation and adoption of conservation practices in an emerging WQT program in Jordan Lake, North Carolina. Our purpose is to compute the size and nature of indirect costs relative to direct costs in our case study, and infer whether this could explain why so many programs that offer financial incentives for adoption have failed to generate as much interest as intended. We show that the AP in our example more than doubles the cost of purchasing credits. Estimating the AP is simplistic compared to individually measuring all indirect costs, such as transactions costs and risk (as illustrated in [26]), but carries the advantage that it is relatively simple to estimate and that it includes all indirect costs, including many that could not be measured individually, like a distaste for cooperating with outsiders. We estimate that transactions cost only accounts for about 10% of the AP in our case study, leaving 90% to risk and other unobserved issues. While it is ultimately important to identify and disentangle all of the individual indirect costs in the AP, policy makers may find it more cost effective to estimate the AP directly so they know what has to be offered for higher adoption rates.

2. Materials and Methods

2.1. Case Study Background

In 2011, the North Carolina Department of Environmental Quality (NCDEQ) approved the implementation of a WQT program for Jordan Lake, North Carolina to control excess total nitrogen (TN) and total phosphorus (TP) loads responsible for the lake’s eutrophication. Per program rules [27], farmers participating in the WQT program can either install riparian buffer zones (conservation practice) to generate credits or allow mitigation bankers to purchase the rights to develop riparian buffer zones on non-buffered land adjacent to streams and sell them to developers. These credits can be sold to new urban developers to meet their required pollution reduction. The total cost to purchase a credit includes direct costs and trading costs; trading costs are the indirect costs of participating in this new program as perceived by the farmer. We measured farmers’ total direct plus indirect costs of participating in this program by surveying farmers about their willingness to accept (WTA) a payment to adopt a conservation practice. The direct costs of installing riparian buffer zones were specified to farmers during the survey process. The AP is therefore any difference between farmers’ WTA and their direct costs. It includes any willingness of a farmer to share the cost of adoption and therefore can be positive or negative. A positive premium indicates that additional incentives are required over and above direct cost in order to induce conservation, and a negative premium indicates that farmers do not require full compensation even for direct costs.
Interviews were conducted with 90 farmers located in the Jordan Lake watershed between July 2012 and April 2013. Farmers were recruited using mailers, emails, and snowball sampling [28,29]. Multiple distinct contacts were made across a variety of venues, then snowballed, to assure an adequate representation of different agricultural sectors in the watershed (such as row crops, livestock, orchards, vegetables, and community-supported agriculture [CSA] farmers). The interviews were semi-structured, where the researcher follows a set of predetermined questions, while pursuing more information on specific answers as the farmers give them, in a conversational style [30,31]. The interviewer asked questions about the farm history, demographics, farm management, conservation practices, and the new WQT program in the watershed. After describing the parameters of North Carolina’s new program and the options for creating and selling credits, study participants were asked about their willingness to participate in the WQT program. In order to ensure that all farmers were working from the same information, they were given a written statement describing the WQT program for the Jordan Lake watershed and the interviewer read the statement aloud. Next, farmers were asked if they had any clarifying questions about the WQT program. The statement and handout were developed in consultation with the local agency responsible for implementing the WQT program, the North Carolina Department of Environment and Natural Resources, Division of Water Resources. This handout clarified that the farmers’ nutrient credits would be allocated away from agriculture and towards the urban development community based on the amount of their water pollution reduction after installing riparian buffers adjacent to the streams on their farms. Once farmers indicated that they understood the description, they were asked questions related to specifics of the WQT program.
This segment of the interviews used two layers of questions. First, farmers were introduced to the WQT program, and then asked: “Would you allow developers to buy nutrient credits from you?” Second, farmers were provided with more detailed information about the conservation practice of riparian buffers and how much it was expected to cost (the direct cost). The interviewees were told that they would be able to sell credits based on installing a riparian buffer zone at least 15.24 m (50 ft) wide from either side of a creek or stream on their farm. If farmers were willing to consider installing this type of conservation practice, they were asked about their minimum WTA a payment. In order to disaggregate the farmers’ direct and indirect costs, the cost of riparian buffer installation (e.g., stated installation cost) was provided as described below:
“Experience shows that it would cost about $450 OR $2,200 (including fencing) per ac ($1,110 OR $5,400 (including fencing) per ha) to install permanent riparian buffers along streams. Given that developers could pay for part, all or more than your costs with the water quality trading, how much would be your willingness to accept to install riparian buffers? ______$/ac.”
We did not include opportunity and maintenance costs in the statement because we could compute them easily ourselves in order to assure some consistency across farms in prices, yields, and costs.
The contingent valuation method (CVM) was used to determine farmers’ WTA for participating in this program. The CVM is based on a questionnaire that includes responses to hypothetical questions respecting the value that people put on environmental goods when actual market data is lacking [32]. The most common question asked in CVM is the maximum amount that people would be willing to pay (WTP) or minimum amount that they would be willing to accept (WTA) for a specific change to occur [33,34,35]. Buckley et al. write that “Dupraz et al. [36] found that CVM is a reliable method to reveal the behaviors of farmers facing the invitation to participate in an agri-environmental scheme” [37] (p. 6). This type of question is called open-ended, which yields a continuous variable because the respondent is open to say any amount that they are willing to.
Despite its popularity for valuing environmental amenities, CVM has been criticized for several limitations, such as information bias, non-response bias, and hypothetical bias [38,39,40,41,42]. One concern with open-ended questions about WTA is that responses can be unrealistically high, as some respondents use their response to demonstrate their unwillingness to cooperate [43]. While this is a risk, we wanted to use a method that enables farmers to express a value that reflects their full AP, which might actually be very high. A common way to check whether bids are an unrealistic protest is to ask indirect questions. Fisher indicated that indirect questions can provide a better trace of a person’s true feelings than direct questions in cases where someone feels social pressure to behave in a certain manner [44]. Therefore, we asked respondents the following indirect question:
“After thinking it a little more, are you confident with your earlier answer that you would be willing to accept $ X to install the permanent buffers?”
After being asked this question, 92% of farmers maintained their original estimate of WTA. Of the 8% who changed their bids, only two farmers indicated that they would accept less than their original estimate. The remaining five participants increased their estimates to greater than cost, or unwilling to sell at any price. This increased our confidence that the bids represented a premium to adopt the practice, not a protest bid.

2.2. Computing the Adoption Premium

As shown in Figure 1, the general nature of supply-side indirect cost is to shift the supply curve inward, driving price up and quantity supplied down. An initial solution to supply and demand for credits, with no indirect costs, is found where S1 intersects demand. Transaction costs and other indirect costs act as a wedge that drives up costs by shifting supply inward, from S1 to S2. Other indirect costs in the AP increase the size of the wedge, and shift supply even further inward, from S2 to S3. The magnitude of these shifts is an empirical question, but it is one that we can estimate for the Jordan Lake program using the data we collected from our 90 in-person interviews and a detailed field-by-field analysis of available credits based on direct costs [26]. The AP will reduce the effectiveness of the Jordan Lake program, but is it large enough to keep the program from being successful?
When farmers report a minimum WTA as a payment to install a conservation practice, such as riparian buffers, it must cover total costs to implement the conservation practice (CP). Total costs (TC) include direct costs to the farmers, such as conservation practice installation cost (ICCP) and opportunity cost (OCCP), plus indirect costs (e.g., trading costs) as follows:
TC = installation cost (ICCP) + Opportunity cost (OCCP) + Trading cost
where trading cost is the sum of all indirect costs including transactions costs.
Trading costs can be derived from the premium that each producer requests (WTA) above direct costs, by rearranging Equation (1) to solve for trading cost. The AP is the trading cost, less any stewardship share that a farmer is willing to contribute. It sums costs mentioned in the literature, like transactions costs and risk, which could have been more directly and precisely estimated separately (e.g., [14]), plus a variety of issues that have not been measured or noted in the literature, like trust or unwillingness to cooperate with government. Per Jordan Lake rules, buffer zones must be 15.24 m (50 ft.) wide on each side of the field adjacent to the stream. Installation costs were estimated at $1,110 per ha ($450 per ac) for farms producing crops and $5,400 per ha ($2,200 per ac) for livestock farmers [45,46]. The opportunity cost for livestock and crop farmers was assumed to equal the net revenue of the hay or crop lost where the conservation practices were installed. Yield and price data for North Carolina crops and hay were obtained from the National Agricultural Statistics Service [47]; the costs of producing hay and crops were extracted from North Carolina State University and A&T State University Cooperative Extension [48]. A discount rate of 4.6% in perpetuity was used to annualize the investment costs [46].
One limitation of our study is that transaction costs were not collected in the interviews. Therefore, we approximated them based on other existing studies. Estimated transaction costs for environmental markets or conservation programs range from 10% to 50% of the other costs for generating credits (e.g., [49]). Fang et al. estimated a 35% transaction cost factor for a nutrient program in the Minnesota River Basin [13]. Moreover, the Chesapeake Bay Commission adopted a 38% adjustment factor for calculating transaction cost [49]. We use a 35% adjustment factor, on top of direct costs, for transaction costs in this study.

3. Results

3.1. The Adoption Premium

Many authors have measured certain indirect costs. For example, as a way of dealing with risk and uncertainty, Dixit and Pindyck proposed a complicated way to measure a farmer’s option value to invest when that investment is irreversible, and the farmer is uncertain future returns will be known in the future by waiting [14]. This is supported by a farmer that told us, “You want more than you have in it because it’s a permanent thing”. Breetz et al. provide a long, detailed discussion about how farmers’ willingness to participate in a WQT program has a strong social component and is highly affected by trust in program administrators [20]. One farmer told us, “I don’t trust the bureaucracy of who is going to maintain it”. Many of the farmers were concerned about transaction costs too. For example, one farmer said, “Then when I started talking to them, he was like I got my lawyers. Everything out of them was lawyers this and lawyer that”. However, we believe that the AP is bigger than what can be explained by risk and uncertainty, trust or transaction costs. For example, some expressed concerns about government, “No. I didn’t want the government involved telling me what to do”, “Once they pay you, they think they own it” and that government intervention “distorts the economy and ends up not being particularly helpful”. Others had concerns about the aesthetic values, “I don’t think it would look very nice. It would be grow’d up.” Likewise, while some were concerned about the environment, “I want us all to be doing the right thing and not for money, but because it is the right thing to do for the environment”, others felt that it might be someone else’s responsibility, “I don’t see how they can ask farmers, dairymen to control the waste when these big towns and big cities are dumping waste in the River. I think you’re wasting your time”. Farmers expressed many reasons that are probably not worth the cost and effort to estimate individually, but collectively they can have the effect of inflating the AP. Therefore, we estimate the total AP directly as a useful tool for policy makers to increase conservation practice adoption.

3.2. Profile of Farmers in the Jordan Lake Study

Farmers who participated in the study were older, reporting an average age of 56.6, with only 12% indicating that they were 39 years or younger. Notably, most (70%) had lived in their community for the entirety of their lives. Of farmers who had settled more recently, only 8% had lived in the community for less than 20 years. These aging, long-term residents of the Jordan Lake watershed were primarily full-time farmers (89%), working farms with an average size of 153 ha (377 acres). All farmers had adopted some type of conservation practices, including no-till, riparian buffers, exclusion fencing, and grass waterways. Relatedly, 79% of research participants reported participating in subsidy programs to assist with the adoption of conservation practices on their farms.

3.3. The Role of Information
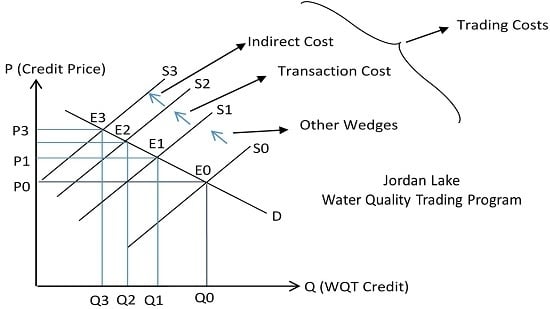
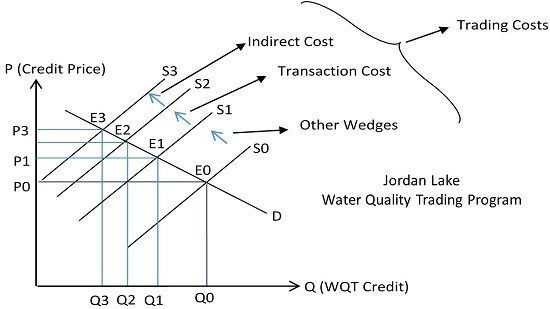
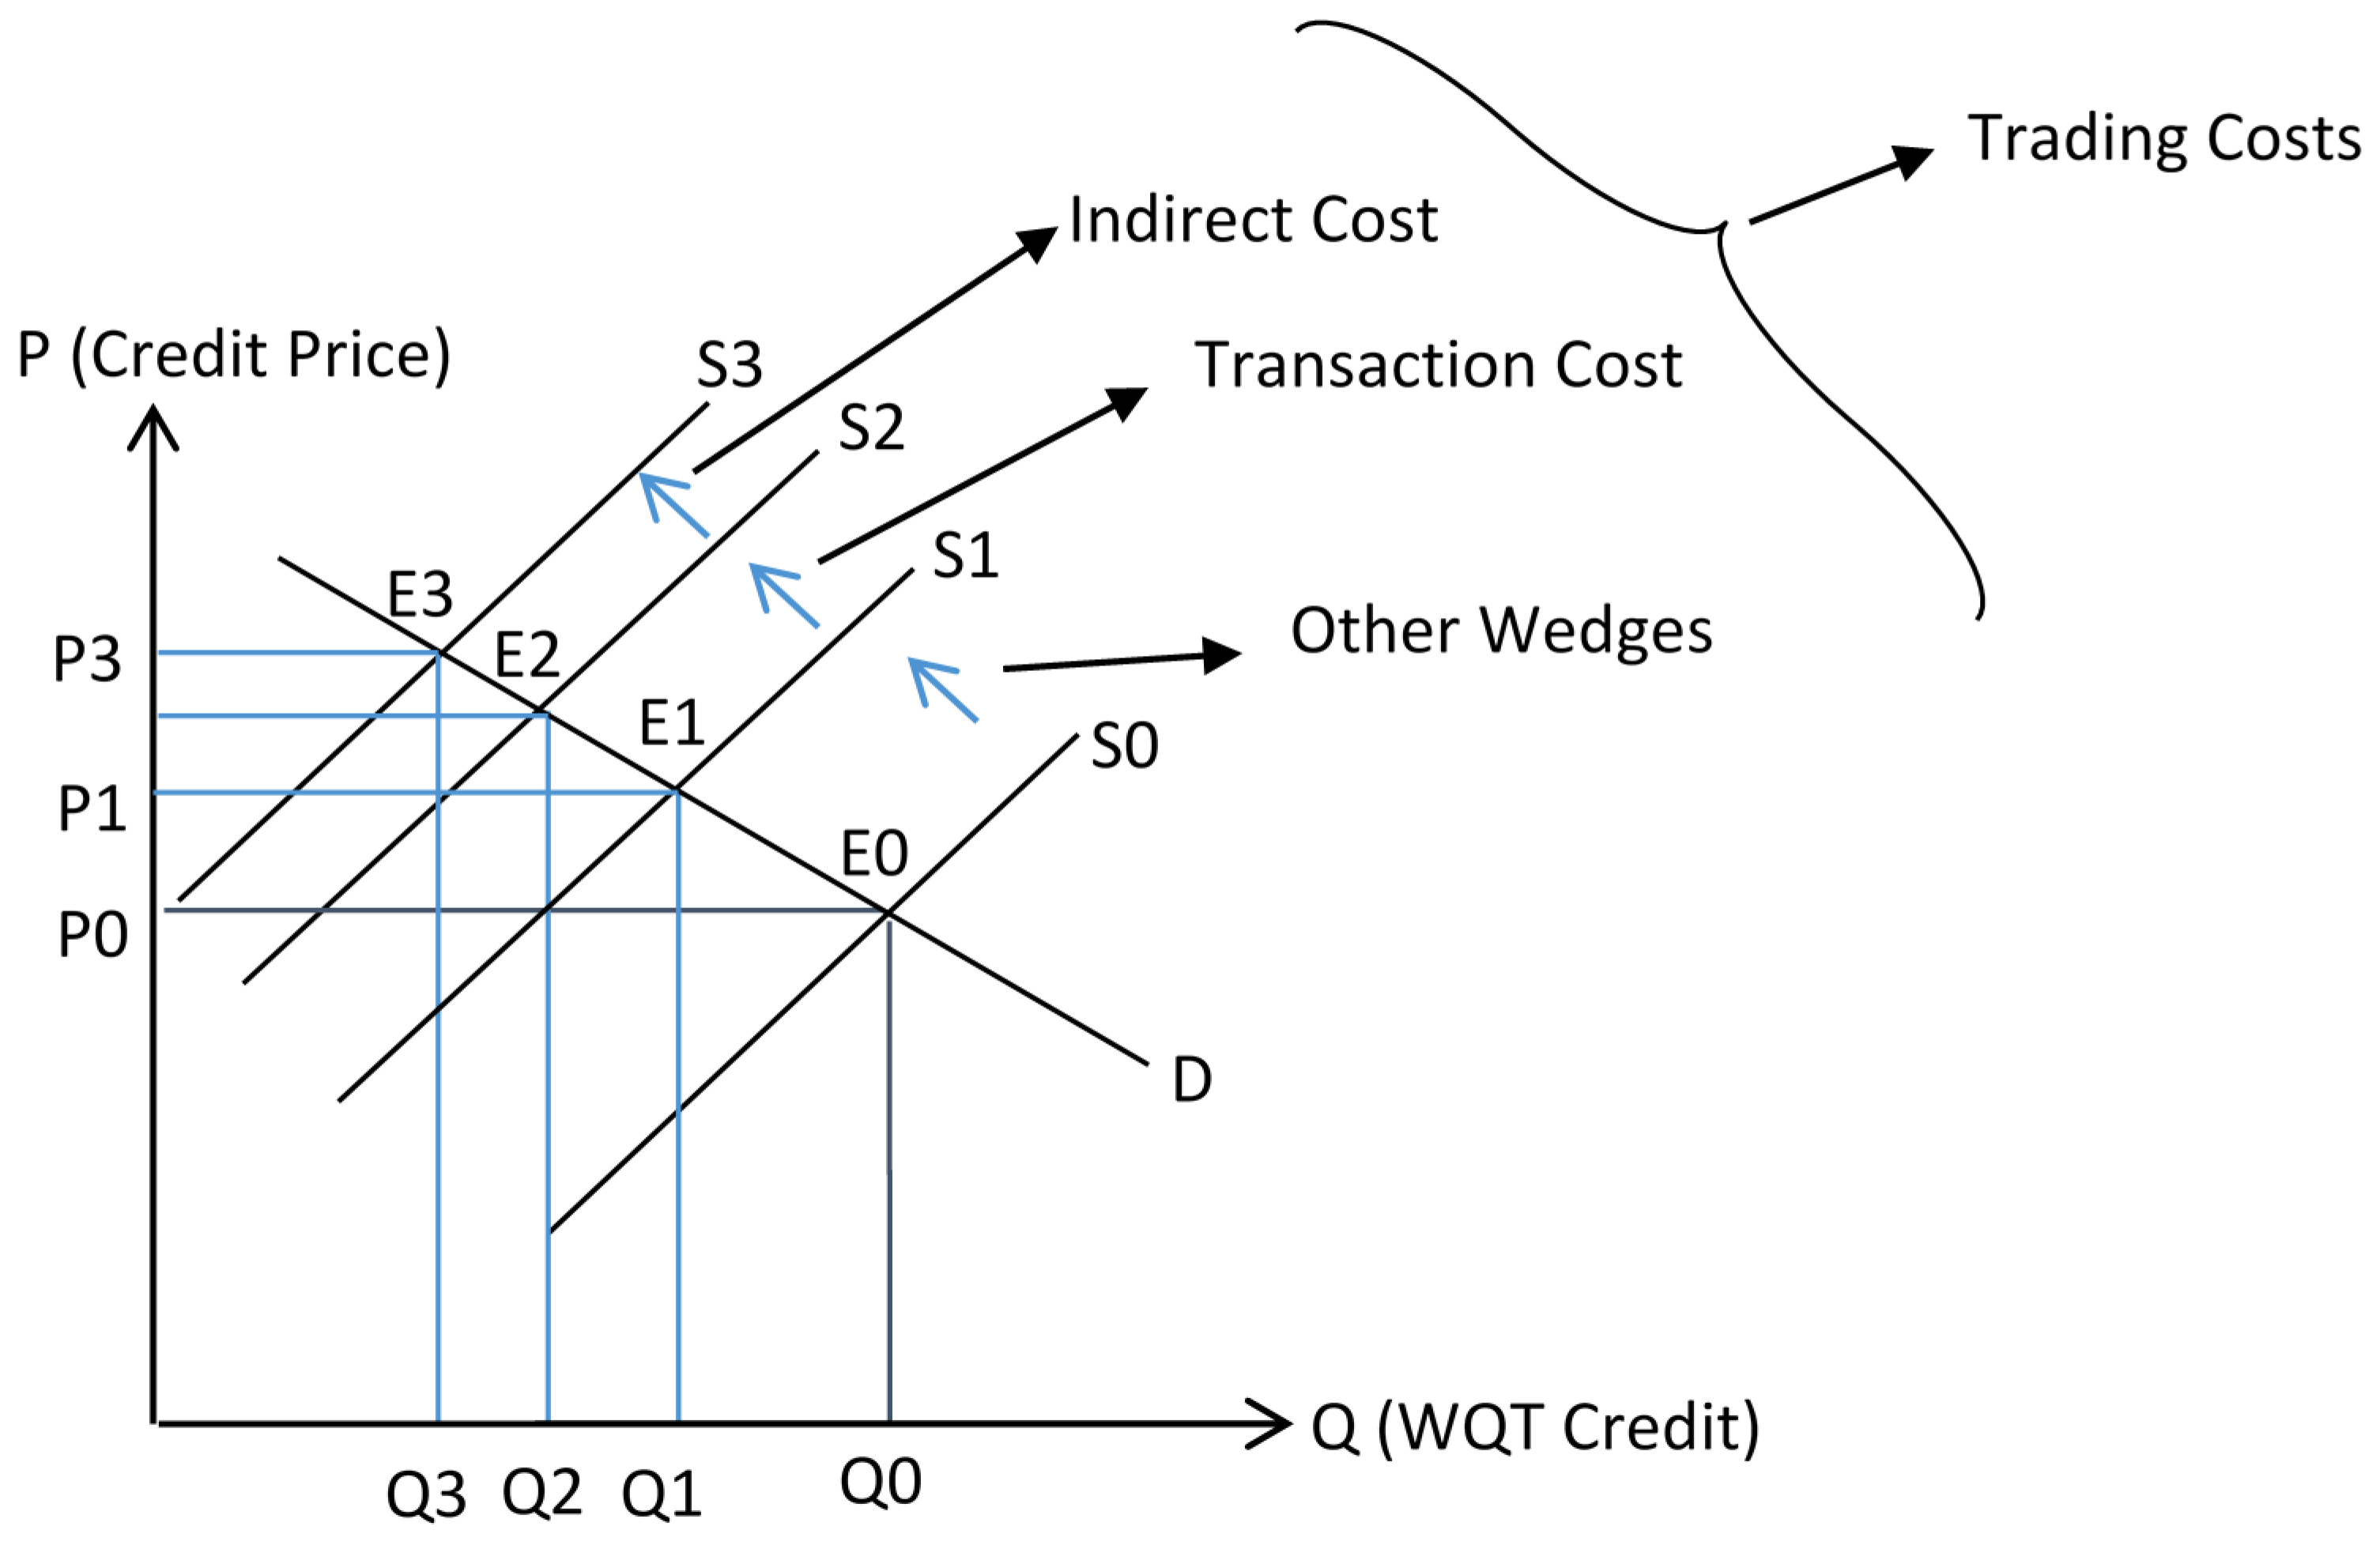
Before providing participants of the survey with the riparian buffer installation cost, just 27% of farmers said they were willing to consider adopting conservation methods in order to sell credits. However, when provided with additional information about the practice and program parameters, and asked to estimate how much they would charge if they participated in the program, just as predicted by by Feather and Amacher, willingness to entertain adoption for credit sales rose to about 93% [25] (Table 1). The remaining 7% still declined to offer an estimate, instead reiterating that they would not participate under any circumstance. These results bolster our proposition that farmers might be adding a large AP to participate in programs that they do not trust, and that providing information can increase trust.
A Probit model was used to formally test whether familiarizing farmers with information about the costs to install practices did indeed increase participation. The data were pooled to create the dummy variable, 0 = no stated installation cost, and 1 = stated installation cost. The log likelihood of the fitted model is −68.78, and the Log Ratio Chi-Square was 20.5, with a p value of 0.0, indicating that our model as a whole is statistically significant (Table 2). Four variables affected acceptance of the Jordan Lake WQT program: years of residency, education, agree upon installing buffers with trees (yes = 1, otherwise = 0), and stated installation cost (e.g., dummy variable, 0 = no stated installation cost, and 1 = stated installation cost). As shown in Table 2, a significant coefficient for stated installation cost indicates that specifying the installation cost plays a notable role in reducing farmers’ unfamiliarity with participating in this program. That is, farmers are unfamiliar with the costs and risks of participating in a WQT program, so providing some sort of information increased their willingness to participate. Higher levels of education also had a significant positive role. Farmers’ willingness to put in a permanent buffer with trees, which allows them to sell nutrient credits to developers, also had a positive effect on willingness to accept. Length of residency in their community had a significant, negative influence on program acceptance, with long-term residence lowering participants’ likelihood to participate in the WQT program. Finally, if farmers had experienced a failure connected to prior implementation of conservation practices, it had a negative, yet insignificant, impact on their willingness to participate in the WQT program.

3.4. Trading Cost

Initial participation costs for this program are greater for livestock farmers (e.g., $5,400 per ha ($2,200 per ac) including fencing) than for crop farmers (e.g., $1,110 per ha ($450 per ac)). Therefore, WTA was normalized by the buffer installation and opportunity cost so that livestock and crop farmers could be compared. While some farmers had both livestock and crops, the conservation practice was dictated by whether livestock would be present. Table 3 shows the normalized farmer’s rates of WTA compared to the expected cost to adopt. Because they are normalized, the rate for a crop farmer who is willing to accept $1,110 per ha ($450 per ac) is directly comparable to a livestock farmer who is willing to accept $5,400 per ha ($2,200 per ac). Recalling that the AP includes the trading cost, net of any stewardship contribution from a farmer, any positive premium would require that farmers be compensated over and above direct costs in order to adopt conservation practices. Only two farmers would be willing to accept less than the cost of installation while thirteen would accept payment equal to the direct cost to install their conservation practice. The vast majority of farmers (83%) were only willing to accept more than the direct cost. Of these farmers, nearly half would ask more than twice the cost, about one third would ask for more than three times the direct cost, and almost 3 percent would ask more than 10 times their installation costs. Farmers’ WTA is notably higher than their conservation practice direct costs, which indicates that trading costs are high.
We next estimated supply and demand for credits, with and without the AP, in order to determine the overall impact of the AP on the WQT program in the Jordan Lake watershed. We first estimated a supply function (shown as S1 in Figure 1) for the Jordan Lake watershed based on farmers’ direct costs of participating in the WQT program. Then, we estimated a demand function (shown as D in Figure 1) by computing urban developers’ cost to install stormwater control measures; demand for credits occurs where urban developers break even by upgrading their own systems or buying credits (See [50] for details).
We expected some farmers would ask for exorbitant prices; some asked for as much as 20 times the direct costs. There is no perfect way to know when a farmer is making a protest bid. However, Motallebi showed that a farmer who required ten or more times the direct cost for installing a conservation practice would find no demand from an urban developer because, above that price, developers will control nutrients on site instead of seeking to buy credits [50]. Therefore, we excluded farmers asking more than ten times the marginal cost (MC) of participating in the WQT program from our estimate of WTA. Before normalization, the average WTA for farmers in Jordan Lake watershed, shown in Table 4, was $28,858 per ha ($11,757 per ac) for livestock farmers and $12,920 per ha ($5,264 per ac) for crop farmers. We derived the adoption premium by subtracting direct costs from the farmer’s WTA. The average premium for crop farmers is about $9,190 per ha ($3,744 per ac), or about 2.5 times more than their conservation practice installation and opportunity costs. The average premium for livestock farmers is about $20,802 per ha ($8,475 per ac), or about 2.6 times more than their conservation practice installation and opportunity costs. If we assume that 35% of the calculated trading cost belongs to the transaction cost [13], the remaining AP for crop and livestock farmers would be $18,912 and $8,802 per ha ($7,705 and $3,586 per ac), respectively, or 2.4 times direct costs for both land use types. Therefore, the AP more than doubled the cost of providing credits, even after netting out the willingness of farmers to help pay for conservation. Furthermore, transactions costs likely accounted for only about 10% of the AP, implying that the indirect costs that are more difficult to measure might be substantial.

4. Farmer’s Willingness to Bear Some Costs

Based on the interviews, we were intrigued about why farmers ask for a WTA that differs from the direct cost of conservation practices. Is it just a financial matter or do they lean toward a less precise rationale, such as the role of land stewardship? While asking about the specific rationale as to how farmers determine value was not the focus of the survey, we were able to get some information about that rationale through indirect questions. We asked an indirect question about farmers’ perceptions concerning why they thought other farmers might choose a different WTA from their own choice [51]. Most of the farmers in this study indicated a higher WTA than the conservation practice installation cost (positive AP); accordingly they were asked:
“In your opinion, why would other farmers be willing to accept less than the cost of installation (for the conservation practice)?”
Many farmers were skeptical that their peers would actually be WTA less, saying things like, “I don’t know those people. They don’t exist around here.” Following the disbelief that fellow farmers would accept a partial payment, the most common suggestions for why another farmer would accept less than the installation costs were attributed to individual beliefs about social responsibility and environmental stewardship. Another frequent refrain speculated that such farmers were not true farmers or were not fully aware of the true costs to participate. As one farmer explained, “I can see persons who own farmland and they are physically separated from it. It gives them some assurance that there is activity going on the farm. They could be in Chicago or LA or some other location and it just gives them, it lets them know that they’ve got-that they have a reliable plan of action in place and [are] not dependent on the farm for any type of revenue.” Another respondent reasoned, “Probably an elderly person that don’t farm anymore and planning to sell the land and no one to give it to.” Some answers suggested that farmers WTA less might have already implemented similar conservation practices on their farm and recognized a personal value more similar to cost-share scenarios, “If you are going to do it anyhow for another reason, then that helps share the cost. That would be the only reason I can think of.” Other reasons offered included: perceived wealth, and consequently, no need for income from conservation practices; substantial financial support from children or off-farm jobs; and that they may be tired of farming and prefer to sell their farm or put their acreage in alternative programs.
In our study, a minority of farmers indicated their WTA as equal to or lower than the cost of the conservation practice installation. These farmers were offering to shoulder some of the costs of conservation, essentially creating a stewardship discount (as opposed to an AP). Accordingly, they were asked:
“In your opinion, why would other farmers need to accept more than their cost of conservation practice installation?”
For these farmers, their responses indicated that they were self-aware that their choice would not be replicated by many of their peers and they expected the average farmer to require more, whether driven by profit “Well, they are greedy”, or good business, “The average farmer these days is in it in a big way and is a good businessman and manages it and isn’t going to let anybody get ahead of them to well on something like that. They are going to get what they think it is worth.” Others suggested that the high payment requirements came from issues surrounding property rights and the WQT program design saying it was, “possibly because it’s [the conservation practice] a permanent fixture”. Other issues raised included: land tenure, with farmers pointing out that many people rent a good portion of the land that they are farming, and consequently, agreements to sell credits would include the farmer and the landlord, leading to the need for profit as a motivator to make such complex agreements happen; that the buyers of credits were developers; and farmers protecting themselves from the perception that they might be taken advantage of in the sale of credits.

5. Conclusions

Many conservation programs seem attractive on paper, but the success of these programs depends on a large set of complicated, real-world factors that affect the acceptability of the program by the involved parties. One way that the effectiveness of conservation programs has been marginalized is high indirect costs on top of the direct costs to adopt a conservation practice. We call these indirect costs an AP since they represent the financial equivalent to compensate someone enough so that they would be willing to adopt a practice. The AP is net of any discount offered by farmers that want to share adoption costs, and therefore can be positive, negative, or zero. Although several studies have looked at indirect costs of one type or another, no study, to our knowledge, has looked at the total magnitude of these costs compared to direct costs, which are relatively easier to identify and measure. It would be possible, for example, to conclude that offering to cover transaction costs would mitigate a farmer’s unwillingness to adopt a conservation practice, when this might not be true because transactions costs are only a small part of the AP. Therefore, we examined the magnitude of an AP in the Jordan Lake WQT program. The results show that farmers’ average WTA for participating in this program is $28,858 and $12,920 per ha ($11,757 and $5,264 per ac) for livestock and crop producers, respectively. The AP more than doubles the cost of participation for most farmers.
Three commonly cited indirect costs are transactions costs, risk and uncertainty, and trust. One limitation of this study, and research should be undertaken on this in future studies, is that we did not estimate the individual indirect components of the AP that could be estimated as a way of validating and comparing the AP to what has already been published about indirect costs. While we could not estimate the value of other indirect costs, it is likely that the high AP in Jordan Lake, NC, also includes other indirect costs, such as a lack of trust between the involved parties (e.g., credit sellers, credit buyers, regulators, and program facilitators). Using estimates from other studies, we found that only 10% of the premium could be explained just by transaction costs. Knowing something about the nature of these costs could help reduce the AP. For example, building trust makes information more believable to farmers and reduces the risk that farmers may perceive in participating in the trading scheme [22]. Lack of trust is a temporary issue and can be reduced or eliminated by policy makers if they start building a link between the involved parties before implementing the targeted policy. Jones et al. determined that “reputations have economic consequences” and “it reduces the uncertainty by providing information about the reliability and goodwill of others” [52] (pp. 932–933). Farmers that we surveyed also mentioned risk. Perceived financial risks are often interconnected [53] with other forms of risk, such as the risk to autonomy [54], and have been shown to prevent or limit adoption or participation for farmers. Ethical risks, both personal and institutional, can also impede participation among farmers [55]. Correspondingly, perceived risks are more likely to be undertaken when the risk can be demonstrably mediated or if potential benefits are perceived to outweigh them [51,56,57]. Shortle stated that successful trading requires developed institutions for organizing trading that can be trusted by the program participants [6]. Building institutional trust with the capacity to mediate perceived risks for potential participants could help to reduce the AP for new conservation programs such as WQT.
This study is limited in scope, both by the size of the sample and the regional uniqueness of the problem, and in complexity—careful measures of indirect costs. However, the results indicate that the AP could be significant and could be the marginal difference between success and failure for many of the WQT programs in the United States. Our contribution to the literature is that farmers require an AP and that it may be more practical to measure that AP directly than to build it from the ground up by measuring all of its components. The AP applies to all conservation, not just those considered for water quality trading credits. Policy makers and those who implement these programs are able to maneuver toward reducing the AP through simple actions such as providing information and building trust, and this is very positive news compared to many other hurdles in the way of these programs. Anyone interested in increasing adoption should consider the importance related to their own situation, as it will affect adoption success. Finally, while it is important to continue to study why there are indirect costs and how they might be reduced, it may be more important to just know how much they are compared to direct costs as far as program efficacy is concerned. The AP is likely to be a key barrier to adoption, but it can be measured and reduced.

Acknowledgments

This research was supported by a grant from USDA National Institute of Food and Agriculture Integrated Water Quality Grant award # 2011-05151. Our thanks to Richard Gannon (NC Department of the Environment and Natural Resources, Division of Water Resources) for providing information on the trading program and to the landowners in Jordan Lake watershed who very graciously gave of their time and Bill Westermeyer for his transcription services.

Author Contributions

All authors contributed extensively to the work presented in this paper. Caela O’Connell conducted the interviews and recorded, synthesized and analyzed the data; Marzieh Motallebi and Dana Hoag added the economic analyses presented in this paper. Deanna Osmond provided oversight and guidance to all phases, including survey design (especially assuring technical accuracy on farm practices and interpretation of the Jordan Lake policies), funding and local networking. All authors discussed the results and implications and critically commented on the manuscript at all stages.

Conflicts of Interest

The authors declare no conflict of interest.

References

  1. Selman, M.; Greenhalgh, S.; Branosky, E.; Jones, C.; Guiling, J. Water Quality Trading Programs: An International Overview; World Resources Institute Issue Brief; WRI: Washington, DC, USA, 2009; Available online: http://www.wri.org/publication/water-quality-trading-programs-international-overview (accessed on 15 August 2013).
  2. United States Environmental Protection Agency (USEPA). Water Quality Trading Toolkit for Permit Writers. Available online: http://water.epa.gov/type/watersheds/trading/WQTToolkit.cfm (accessed on 10 September 2013).
  3. King, D.M.; Kuch, P.J. Will nutrient credit trading ever work? An assessment of supply and demand problems and institutional obstacles. In The Environmental Law Reporter; Environmental Law Institute: Washington, DC, USA, 2003; pp. 10352–10368. [Google Scholar]
  4. Willamette Partnership; World Resources Institute; The National Network on Water Quality. Building a Water Quality Trading Program: Options and Considerations. Available online: http://willamettepartnership.org/wp-content/uploads/2015/06/BuildingaWQTProgram-NNWQT.pdf (accessed on 18 June 2015).
  5. Newburn, D.A.; Woodward, R.T. An ex post evaluation of the Great Miami water quality trading program. J. Am. Water Resour. Assoc. 2012, 48, 156–169. [Google Scholar] [CrossRef]
  6. Shortle, J. Economics and environmental markets: Lessons from water quality trading. Agric. Resour. Econ. Rev. 2013, 42, 57–74. [Google Scholar]
  7. Nowak, P.; O’Keefe, G.; Bennett, C.; Anderson, S.; Trumbo, C. Communication and Adoption Evaluation of USDA Water Quality Demonstration Projects. Plant and Animal Science Production and Protection and Processing, CSREES/USDA: Washington, DC, USA, 1997; Available online: https://archive.org/details/CAT10844774 (accessed on 1 August 2013).
  8. Lichtenberg, E.; Parker, D.; Lane, S. Best Management Practice Use and Nutrient Management in Maryland: A 2010 Snapshot; University of Maryland Center for Agricultural and Natural Resource Policy: College, MD, USA, 2010; p. 23. Available online: https://agresearch.umd.edu/sites/default/files/_docs/2010PolicyAnalysisReport_BMP.pdf (accessed on 1 August 2013).
  9. Hoag, D.L.K.; Luloff, A.E.; Osmond, D.L. Socioeconomic analysis: National institute of food and agriculture—Conservation Effects Assessment. In How to Build Better Agricultural Conservation Programs to Protect Water Quality: The National Institute of Food and Agriculture—Conservation Effects Assessment Project Experience, 1st ed.; Deanna, L., Osmond, D.L., Meals, D.W., Hoag, D.L.K., Arabi, M., Eds.; Soil and Water Conservation Society: Ankeny, IA, USA, 2012; pp. 120–137. [Google Scholar]
  10. Center for Agriculture in the Environment. The Adoption of Conservation Practices in Agriculture; American Farmland Trust: Washington, DC, USA, 2013; Available online: https://4aa2dc132bb150caf1aa-7bb737f4349b47aa42dce777a72d5264.ssl.cf5.rackcdn.com/Adoption-of-Conservation-Practices-in-Agriculture.pdf (accessed on 10 September 2013).
  11. USDA Economic Research Service. Some Conservation Practices Are More Widely Adopted than Others. Available online: http://www.ers.usda.gov/data-products/chart-gallery/detail.aspx?chartId=53856 (accessed on 21 September 2015).
  12. Ball, A.G.; Heady, E.O.; Baumann, R.V. Economic Evaluation of the Use of Soil Conservation and Improvement Practices in Western Iowa. No. 157185, Technical Bulletins. United States Department of Agriculture, Economic Research Service, 1957. Available online: http://ageconsearch.umn.edu/bitstream/157185/2/tb1162.pdf (accessed on 1 September 2013).
  13. Fang, F.; Easter, K.W.; Brezonik, P.L. Point-nonpoint source water quality trading: A case study in the Minnesota River basin. J. Am. Water Resour. Assoc. 2005, 41, 645–657. [Google Scholar] [CrossRef]
  14. Dixit, A.K.; Pindyck, R.S. Investment under Uncertainty, 1st ed.; Princeton University Press: Princeton, NJ, USA, 1994. [Google Scholar]
  15. Hoag, D.; Hughes-Popp, J. Theory and practice of pollution credit trading in water quality management. Rev. Agric. Econ. 1997, 19, 252–262. [Google Scholar] [CrossRef]
  16. Shortle, J.S.; Horan, R.D. The economics of water quality trading. Int. Rev. Environ. Resour. Econ. 2008, 2, 101–133. [Google Scholar] [CrossRef]
  17. Ghosh, G.; Ribaudo, M.; Shortle, J. Baseline requirements can hinder trades in water quality trading programs: Evidence from the Consetoga Watershed. J. Environ. Manag. 2011, 92, 2076–2084. [Google Scholar] [CrossRef] [PubMed]
  18. Suter, J.; Spraggon, J.; Poe, G.L. Thin and lumpy: An experimental investigation of water quality trading. Water Res. Econ. 2013, 1, 36–60. [Google Scholar] [CrossRef]
  19. Peterson, J.M.; Smith, C.M.; Leatherman, J.C.; Hendricks, N.P.; Fox, J.A. Transaction costs in payment for environmental service contracts. Am. J. Agric. Econ. 2015, 97, 219–238. [Google Scholar] [CrossRef]
  20. Breetz, H.L.; Fisher-Vanden, K.; Jacobs, H.; Schary, C. Trust and communication: Mechanisms for increasing farmers’ participation in water quality trading. Land Econ. 2005, 81, 170–190. [Google Scholar] [CrossRef]
  21. Peterson, J.M.; Fox, J.A.; Leatherman, J.C.; Smith, C.M. Choice experiments to assess farmers, willingness to participate in a water quality trading market. In Proceedings of the American Agricultural Economics Association Annual Meeting, Portland, OR, USA, 29 July–1 August 2007; Available online: http://ageconsearch.umn.edu/bitstream/9726/1/sp07pe03.pdf (accessed on 1 October 2015).
  22. Mariola, M.J. Farmers, trust, and the market solution to water pollution: The role of social embeddedness in water quality trading. J. Rural Stud. 2012, 28, 577–589. [Google Scholar] [CrossRef]
  23. Morgan, C.; Woverton, A. Water Quality Trading in the United States; NCEE Working Paper Series 200507; EPA National Center for Environmental Economics: Washington, DC, USA, 2005. Available online: https://www.epa.gov/home/pdf-files (accessed on 10 October 2014).
  24. Shortle, J. Water Quality Trading in Agriculture. Report to the Organization for Economic Cooperation and Development, Directorate for Trade and Agriculture, OECD Publishing. 2010. Available online: https://www.oecd.org/tad/sustainable-agriculture/49849932.pdf (accessed on 5 April 2012).
  25. Feather, P.M.; Amacher, G.S. Role of information in the adoption of best management practices for water quality improvement. Agric. Econ. 1994, 11, 159–170. [Google Scholar] [CrossRef]
  26. O’Connell, C.; Motallebi, M.; Osmond, D.L.; Hoag, D. Trading on Risk: The moral logics and economic reasoning of North Carolina farmers in water quality trading markets. Econ. Anthropol. 2017. accepted. [Google Scholar]
  27. Natural Resources Conservation Service (NRCS). Practice Payment. Available online: http://www.nrcs.usda.gov/wps/portal/nrcs/main/national/technical/econ/costs/ (accessed on 1 December 2012).
  28. Baker, R.; Bartczak, A.; Chilton, S.; Metcalf, H. Did people “buy” what was “sold”? A qualitative evaluation of a contingent valuation survey information set for gains in life expectancy. J. Environ. Manag. 2014, 133, 94–103. [Google Scholar] [CrossRef] [PubMed]
  29. Schenk, A.; Hunziker, M.; Kienast, F. Factors influencing the acceptance of nature conservation measures—A qualitative study in Switzerland. J. Environ. Manag. 2007, 83, 66–79. [Google Scholar] [CrossRef] [PubMed]
  30. Bernard, H.R. Research Methods in Anthropology: Qualitative and Quantitative Approaches, 5th ed.; AltaMira Press: Lanham, MD, USA, 2011. [Google Scholar]
  31. Fontana, A.; Frey, J.H. The interview: From neutral stance to political involvement. In The SAGE Handbook of Qualitative Research, 3rd ed.; Denzin, N.K., Lincoln, Y.S., Eds.; SAGE Publications: London, UK, 2005; pp. 695–727. [Google Scholar]
  32. Pagiola, S. Economic Analysis of Investment in Cultural Heritage: Insights from Environmental Economics; World Bank: Washington, DC, USA, 1996; Available online: https://www.elaw.org/system/files/Economic.Analysis.Investments.Cultural.Heritage_0.pdf (accessed on 10 October 2014).
  33. Freeman, A.M. The Measurement of Environmental and Resource Values. In Theory and Methods; Resource for the Future: Washington, DC, USA, 1993. [Google Scholar]
  34. Loomis, J.; Kent, P.; Strange, L.; Faush, K.; Covich, A. Measuring the total economic value of restoring ecosystem services in an impaired in river basin: Result from a contingent valuation survey. Ecol. Econ. 2000, 33, 103–117. [Google Scholar] [CrossRef]
  35. Carson, R.T.; Flores, N.E.; Meade, N.F. Contingent valuation: Controversies and evidence. Environ. Resour. Econ. 2001, 19, 173–210. [Google Scholar] [CrossRef]
  36. Dupraz, P.; Vermersch, D.; Henry, D.F.B.; Delvaux, L. The environmental supply of farm households: A flexible willingness to accept model. Environ. Resour. Econ. 2003, 25, 171–189. [Google Scholar] [CrossRef]
  37. Buckley, C.; Stephen, H.; Sarah, M. Operating or not Operating at the Margin: Farmers Willingness to Adopt a Riparian Buffer Zone. Working Paper No. 148830. 2012. Available online: https://www.nuigalway.ie/semru/documents/12wpsemru03.pdf (accessed on 10 February 2016).
  38. Edwards, S.; Anderson, G. Overlooked biases in contingent valuation surveys. Land Econ. 1987, 63, 168–178. [Google Scholar] [CrossRef]
  39. Loomis, J.; Gonzalez-Caban, A.; Gregory, R. Do reminders of substitutes and budget constraints influence contingent valuation estimates? Land Econ. 1994, 70, 499–506. [Google Scholar] [CrossRef]
  40. Neill, H.R.; Cummings, R.G.; Ganderton, R.G.; Harrison, G.W.; McGuckin, T. Hypothetical surveys and real economic commitments. Land Econ. 1994, 70, 145–154. [Google Scholar] [CrossRef]
  41. List, J.; Berrens, R.; Bohara, A.; Kerkvliet, J. Examining the role of social isolation on stated preferences. Am. Econ. Rev. 2004, 94, 741–752. [Google Scholar] [CrossRef]
  42. List, J.A.; Gallet, C.A. What experimental protocol influence disparities between actual and hypothetical stated values? Environ. Resour. Econ. 2001, 20, 241–254. [Google Scholar] [CrossRef]
  43. Mitchell, R.; Carson, T. Using Surveys to Value Public Goods: The Contingent Valuation Method; Resources for the Future: Washington, DC, USA, 1989. Available online: http://www.waterboards.ca.gov/waterrights/water_issues/programs/bay_delta/wq_control_plans/1995wqcp/admin_records/part05/380.pdf (accessed on 1 August 2013).
  44. Fisher, R.J. Social desirability bias and the validity of indirect questioning. J. Consum. Res. 1993, 20, 303–315. [Google Scholar] [CrossRef]
  45. Natural Resources Conservation Service (NRCS). Rate for Federal Water Projects. Available online: http://www.economics.nrcs.usda.gov/cost/priceindexes/rates.html (accessed on 1 August 2013).
  46. North Carolina Division of Water Resources (NCDEQ). Jordan Lake Rules. Available online: http://portal.ncdenr.org/web/jordanlake/tmdl (accessed on 1 February 2013).
  47. United States Department of Agriculture. National Agricultural Statistics Services. Available online: http://www.nass.usda.gov/ (accessed on 2 May 2014).
  48. NC State University and A&T State University Cooperative Extension. Field Crops Publications. 2014. Available online: http://www.ces.ncsu.edu/publications-on-field-crops/ (accessed on 20 December 2014).
  49. Van Houtven, G.; Loomis, R.; Baker, J.; Beach, R.; Casey, S. Nutrient Credit Trading for the Chesapeake Bay: An Economic Study: Prepared for Chesapeake Bay Commission. RTI International: Research Triangle Park, NC, USA. Available online: http://www.chesbay.us/Publications/nutrient-trading-2012.pdf (accessed on 1 May 2012).
  50. Motallebi, M. Water Quality Trading In Jordan Lake, North Carolina: Economic, Hydrological, Behavioral, and Ecological Aspects. Ph.D. Thesis, Colorado State University, Fort Collins, CO, USA, 2015. [Google Scholar]
  51. Taylor, B.M.; Van Grieken, M. Local institutions and farmer participation in agri-environmental schemes. J. Rural Stud. 2015, 37, 10–19. [Google Scholar] [CrossRef]
  52. Jones, C.; Hesterly, W.S.; Borgatti, S.P. A general theory of network governance: Exchange conditions and social mechanisms. Acad. Manag. Rev. 1997, 22, 911–945. [Google Scholar]
  53. Van Winsen, F.; De Mey, Y.; Lauwers, L.; Van Passel, S.; Vancauteren, M.; Wauters, E. Cognitive mapping: A method to elucidate and present farmers’ risk perception. Agric. Syst. 2013, 122, 42–52. [Google Scholar] [CrossRef]
  54. Blackstock, K.L.; Richards, C. Evaluating stakeholder involvement in river basin planning: A Scottish case study. Water Policy 2007, 9, 493–512. [Google Scholar] [CrossRef]
  55. Bryant, L.; Garnham, B. Beyond discourses of drought: The micro-politics of the wine industry and the mental health of farmers. J. Rural Stud. 2013, 32, 1–9. [Google Scholar] [CrossRef]
  56. Mettepenningen, E.; Vandermeulen, V.; Delaet, K.; Van Huylenbroeck, G.; Wailes, E.J. Investigating the influence of the institutional organization of agri-environmental schemes on scheme adoption. Land Use Policy 2011, 33, 20–30. [Google Scholar] [CrossRef]
  57. Reimer, A.P.; Weinkauf, D.K.; Prokopy, L.S. The influence of perceptions of practice characteristics: An examination of agricultural best management practice adoption in two Indiana watersheds. J. Rural Stud. 2012, 28, 118–128. [Google Scholar] [CrossRef]
Figure 1. Role of indirect cost on adoption premium in water quality trading market.
Water 08 00245 g001
Table 1. Farmers’ willingness to entertain adoption estimates for water quality trading program before and after stated conservation practice installation cost.
Before Stated Installation CostAfter Stated Installation Cost
AnswerFrequencyPercentAnswerFrequencyPercent
Yes2427Yes8493
No2528No56
Maybe3943Maybe--
No Answer22No Answer11
Sum90100Sum90100
Table 2. The role of offering a monetary payment on participation in the water quality trading program in Jordan Lake, North Carolina.
VariableCoefficientStd. Errort-Test
Constant−1.170.805−1.46
Years of Residency−0.0170.008−2.12 **
Education0.270.141.96 *
Type of Buffer0.370.162.37 **
Size of Farm−0.000420.0004−1.05
Experience−0.0890.26−0.34
Stated Installation Cost (dummy variable)2.0830.268.12 **
Pseudo R 20.4LR Chi-Square20.5
Log Likelihood−68.78Prob > Chi-Square0.000
Notes: ** Statistical signifficance at the 1% level; * Statistical significance at the 5% level.
Table 3. Normalized frequency and percentage of Jordan Lake farmers’ willingness to trade (WTA—willingness to accept /installation and opportunity cost).
RateFrequencyPercentage
0–12429
122
1–21923
2–31518
3–434
4–556
5–634
6–745
7–822
8–922
9–1022
10–1111
20<22
Table 4. Rate and amount of willingness to accept, trading cost, and adoption premium.
Livestock Farming *
WTA ($)Trading Cost ($)Trading Cost RateAdoption Premium ($)Adoption Premium Rate
28,858 per ha
(11,757 per ac)
20,802 per ha
(8,475 per ac)
2.5918,912 per ha
(7,705 per ac)
2.35
Crop Farming **
WTA ($)Trading Cost ($)Trading Cost RateAdoption Premium ($)Adoption Premium Rate
12,920 per ha
(5,264 per ac)
9,190 per ha
(3,744 per ac)
2.468,802 per ha
(3,586 per ac)
2.36
Notes: * Conservation practice installation cost is $5,400 per ha ($2,200 per ac) including fencing; ** Conservation practice installation cost is $1,100 per ha ($450 per ac).

