
Variations on Soil Salinity and Sodicity and Its Driving Factors Analysis under Microtopography in Different Hydrological Conditions

Abstract
:1. Introduction
2. Material and Methods
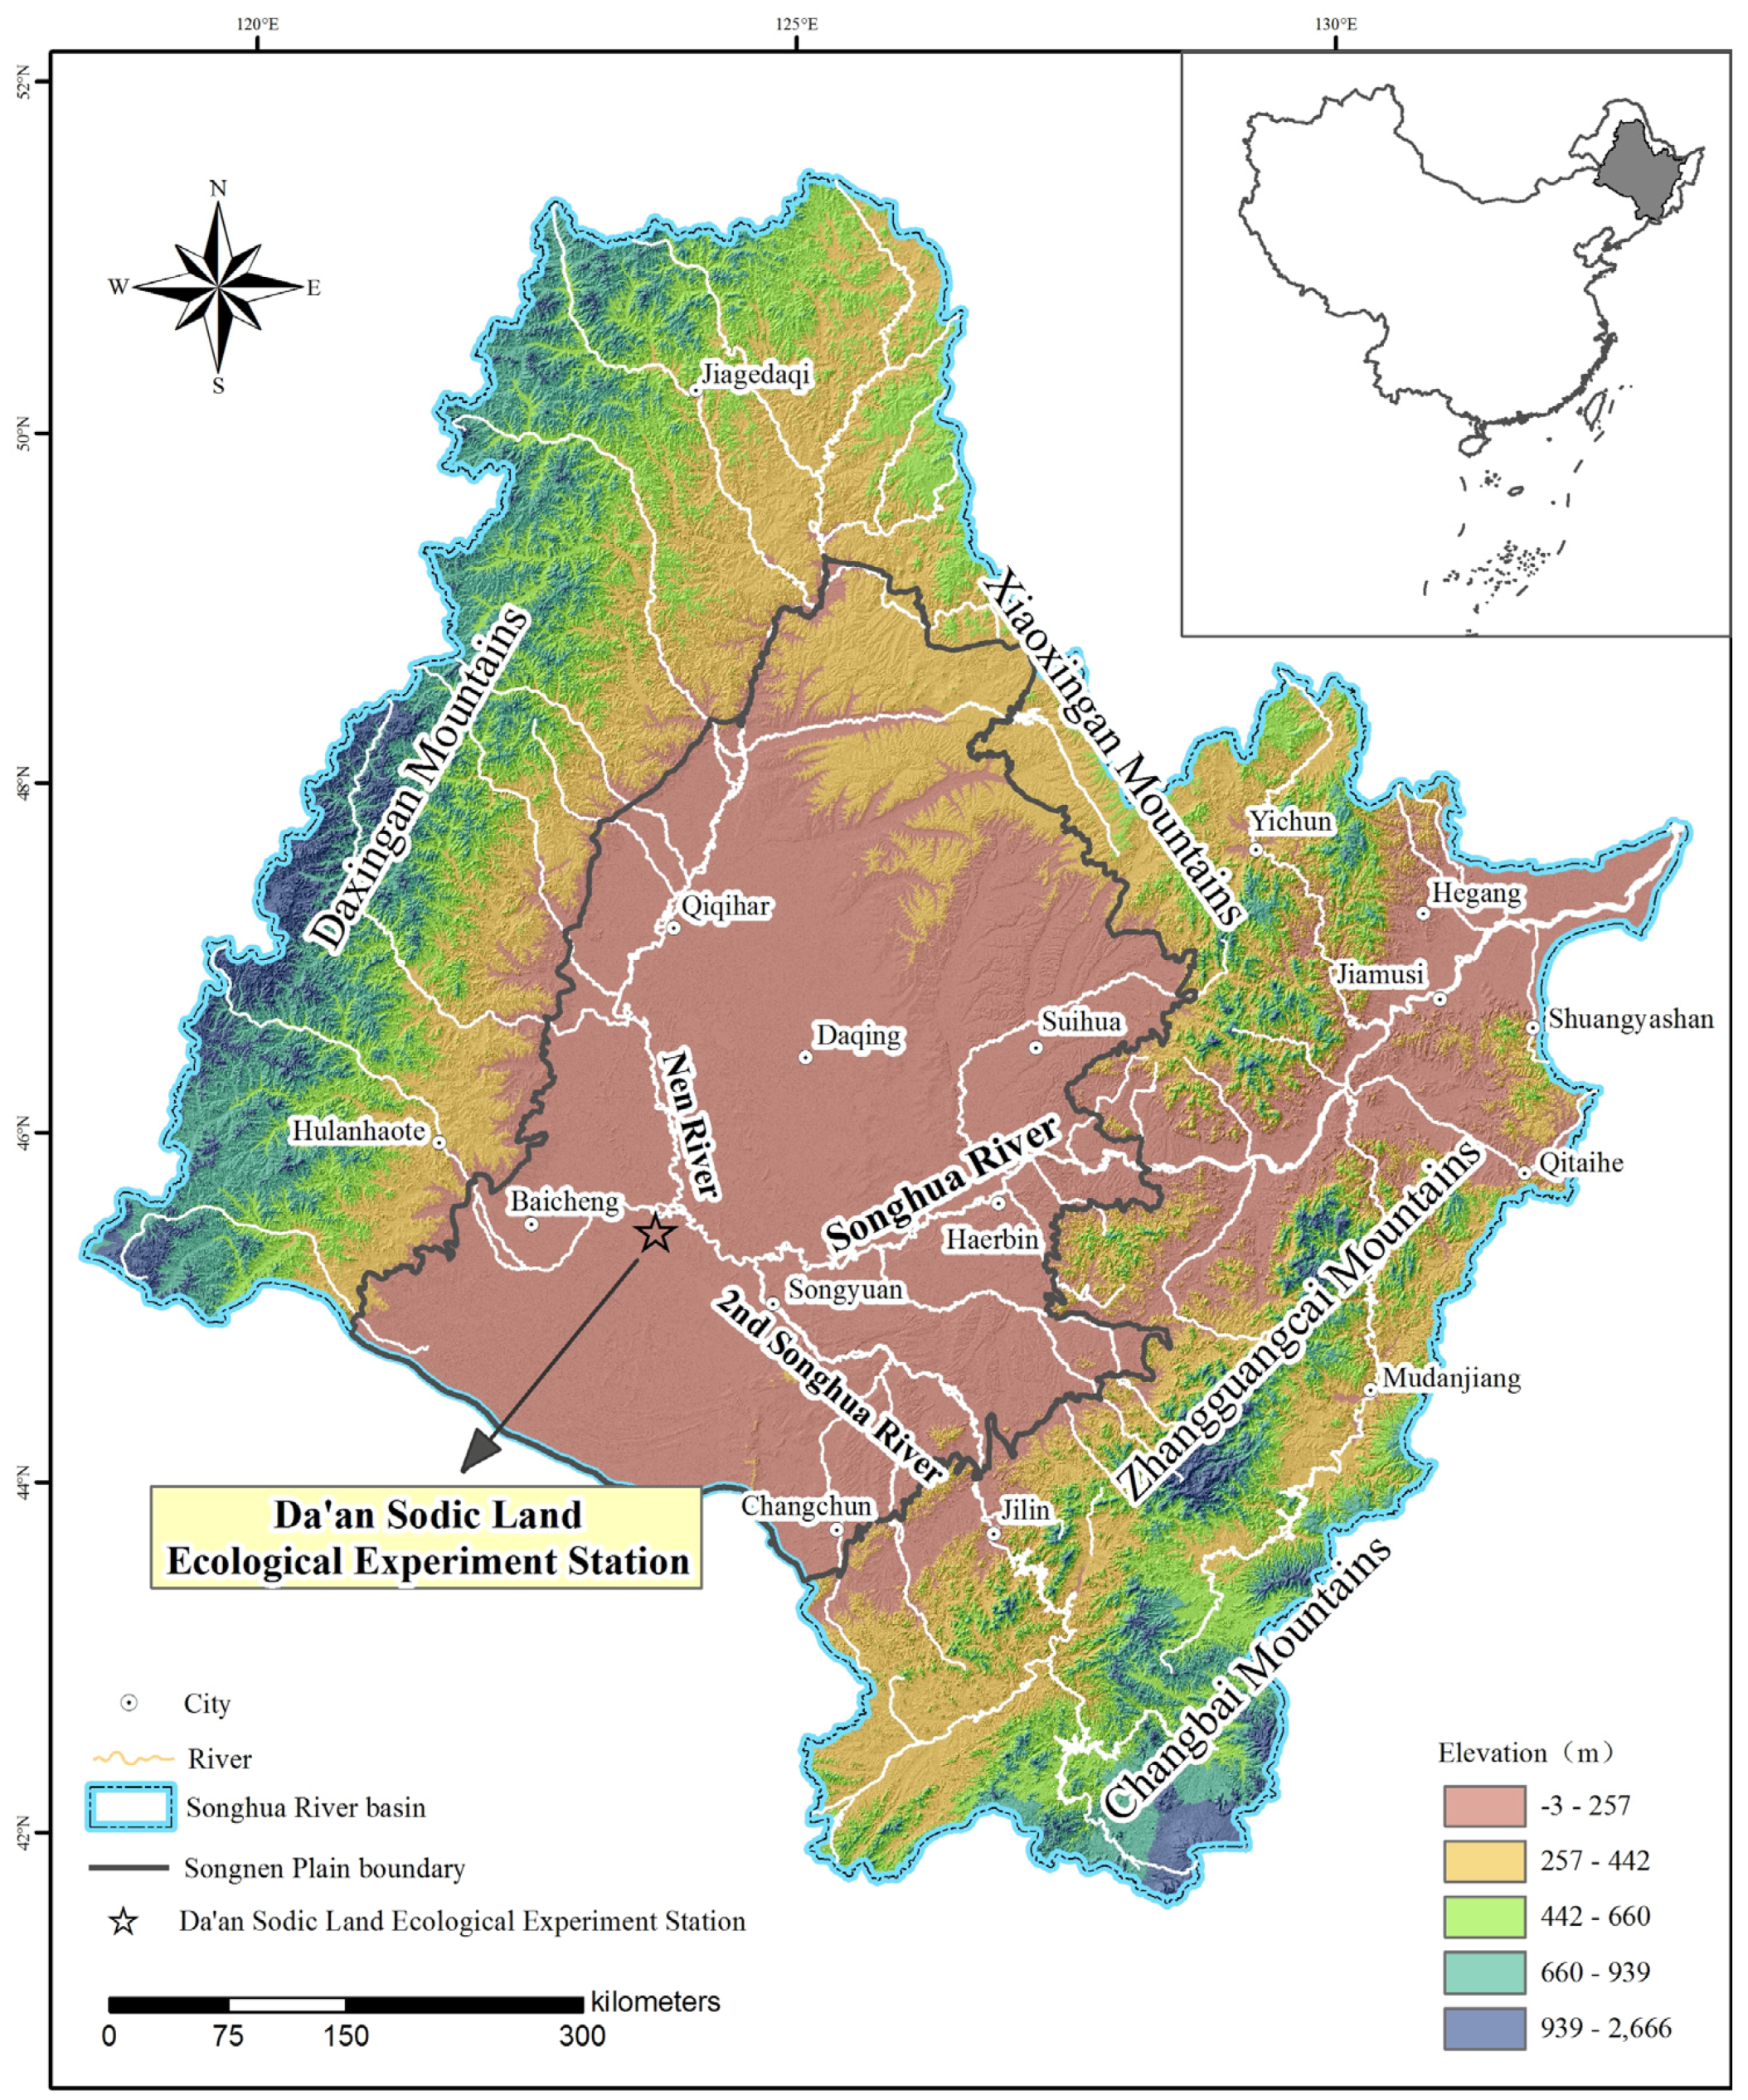
2.1. Study Area
2.2. Field and Laboratory Analysis
2.3. Redundancy Analysis
3. Results and Analysis
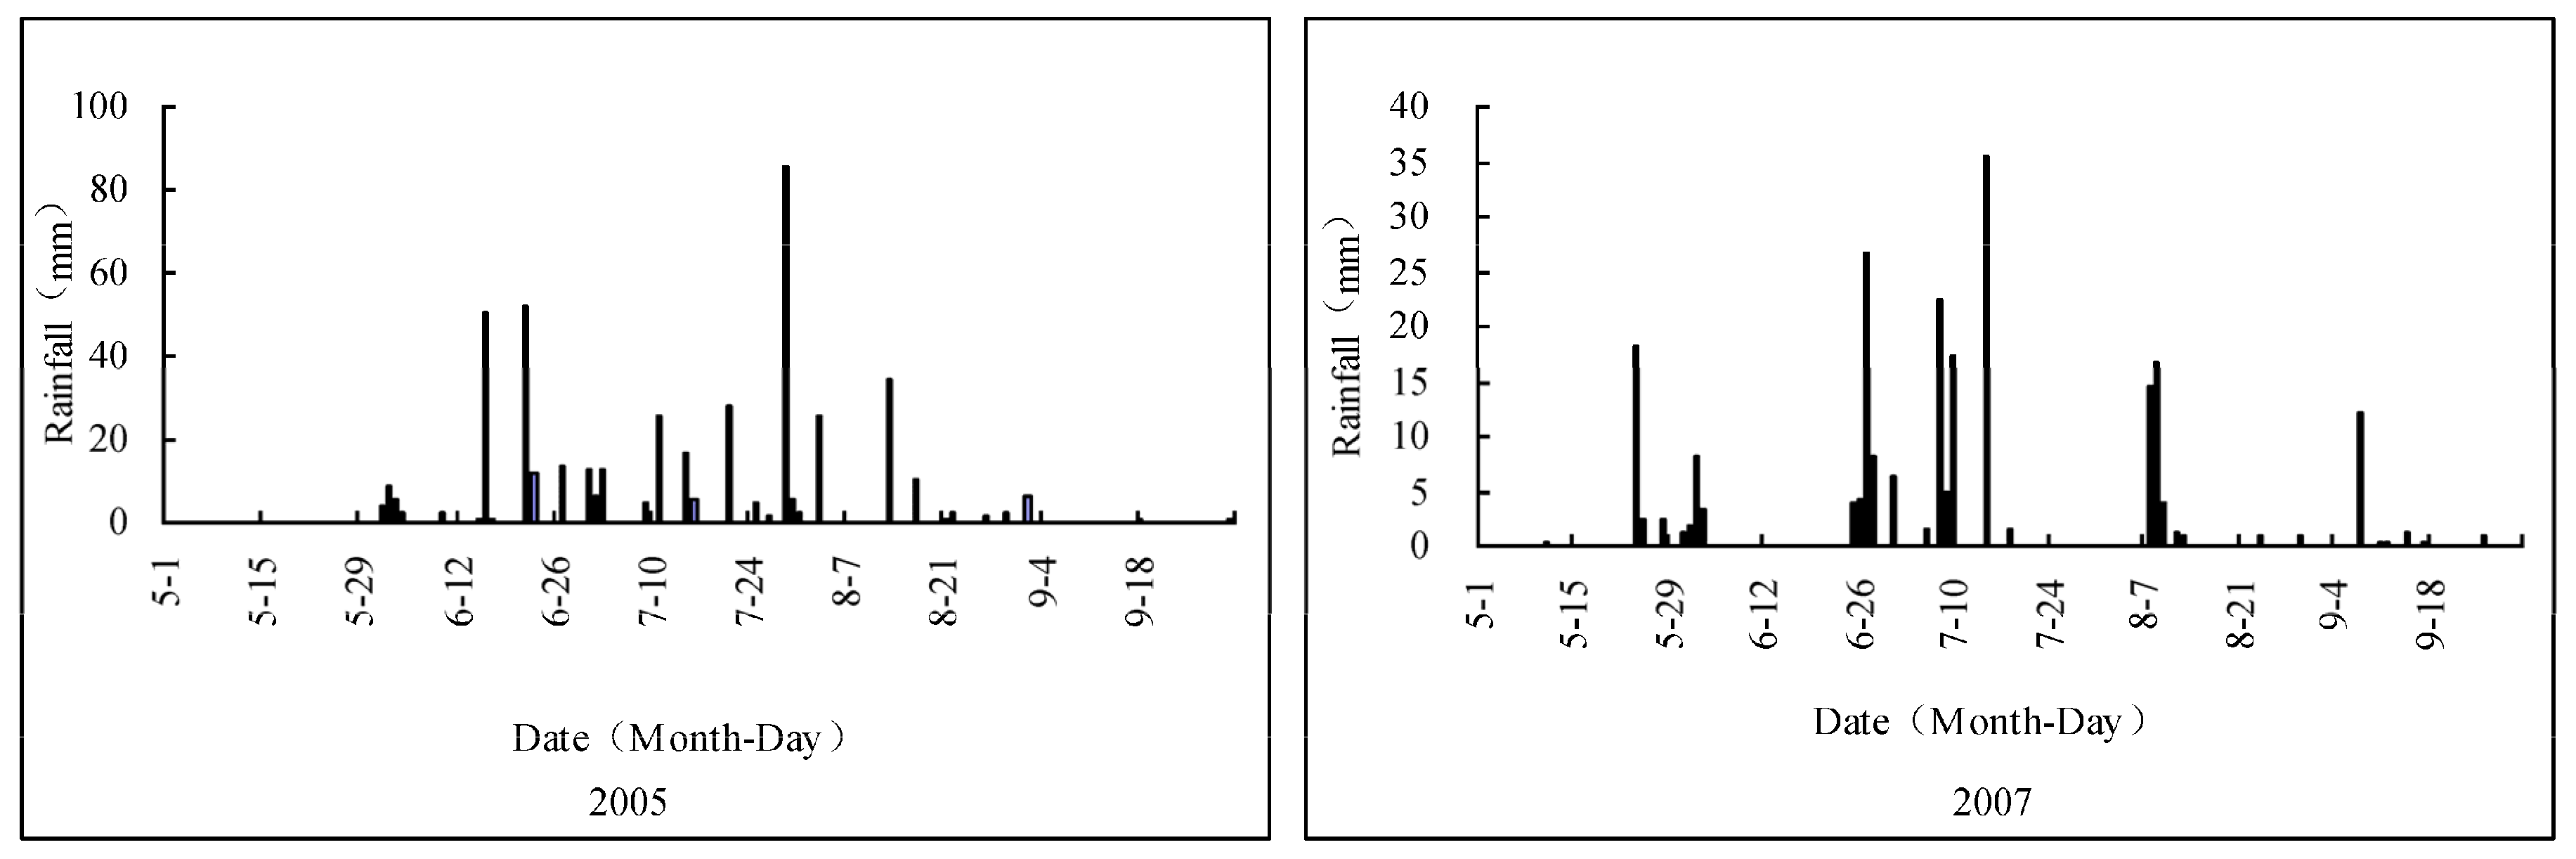
3.1. Rainfall during Different Hydrological Years
3.2. Comparison of Surface Soil Salinity–Sodicity Parameters between Wet and Dry Years
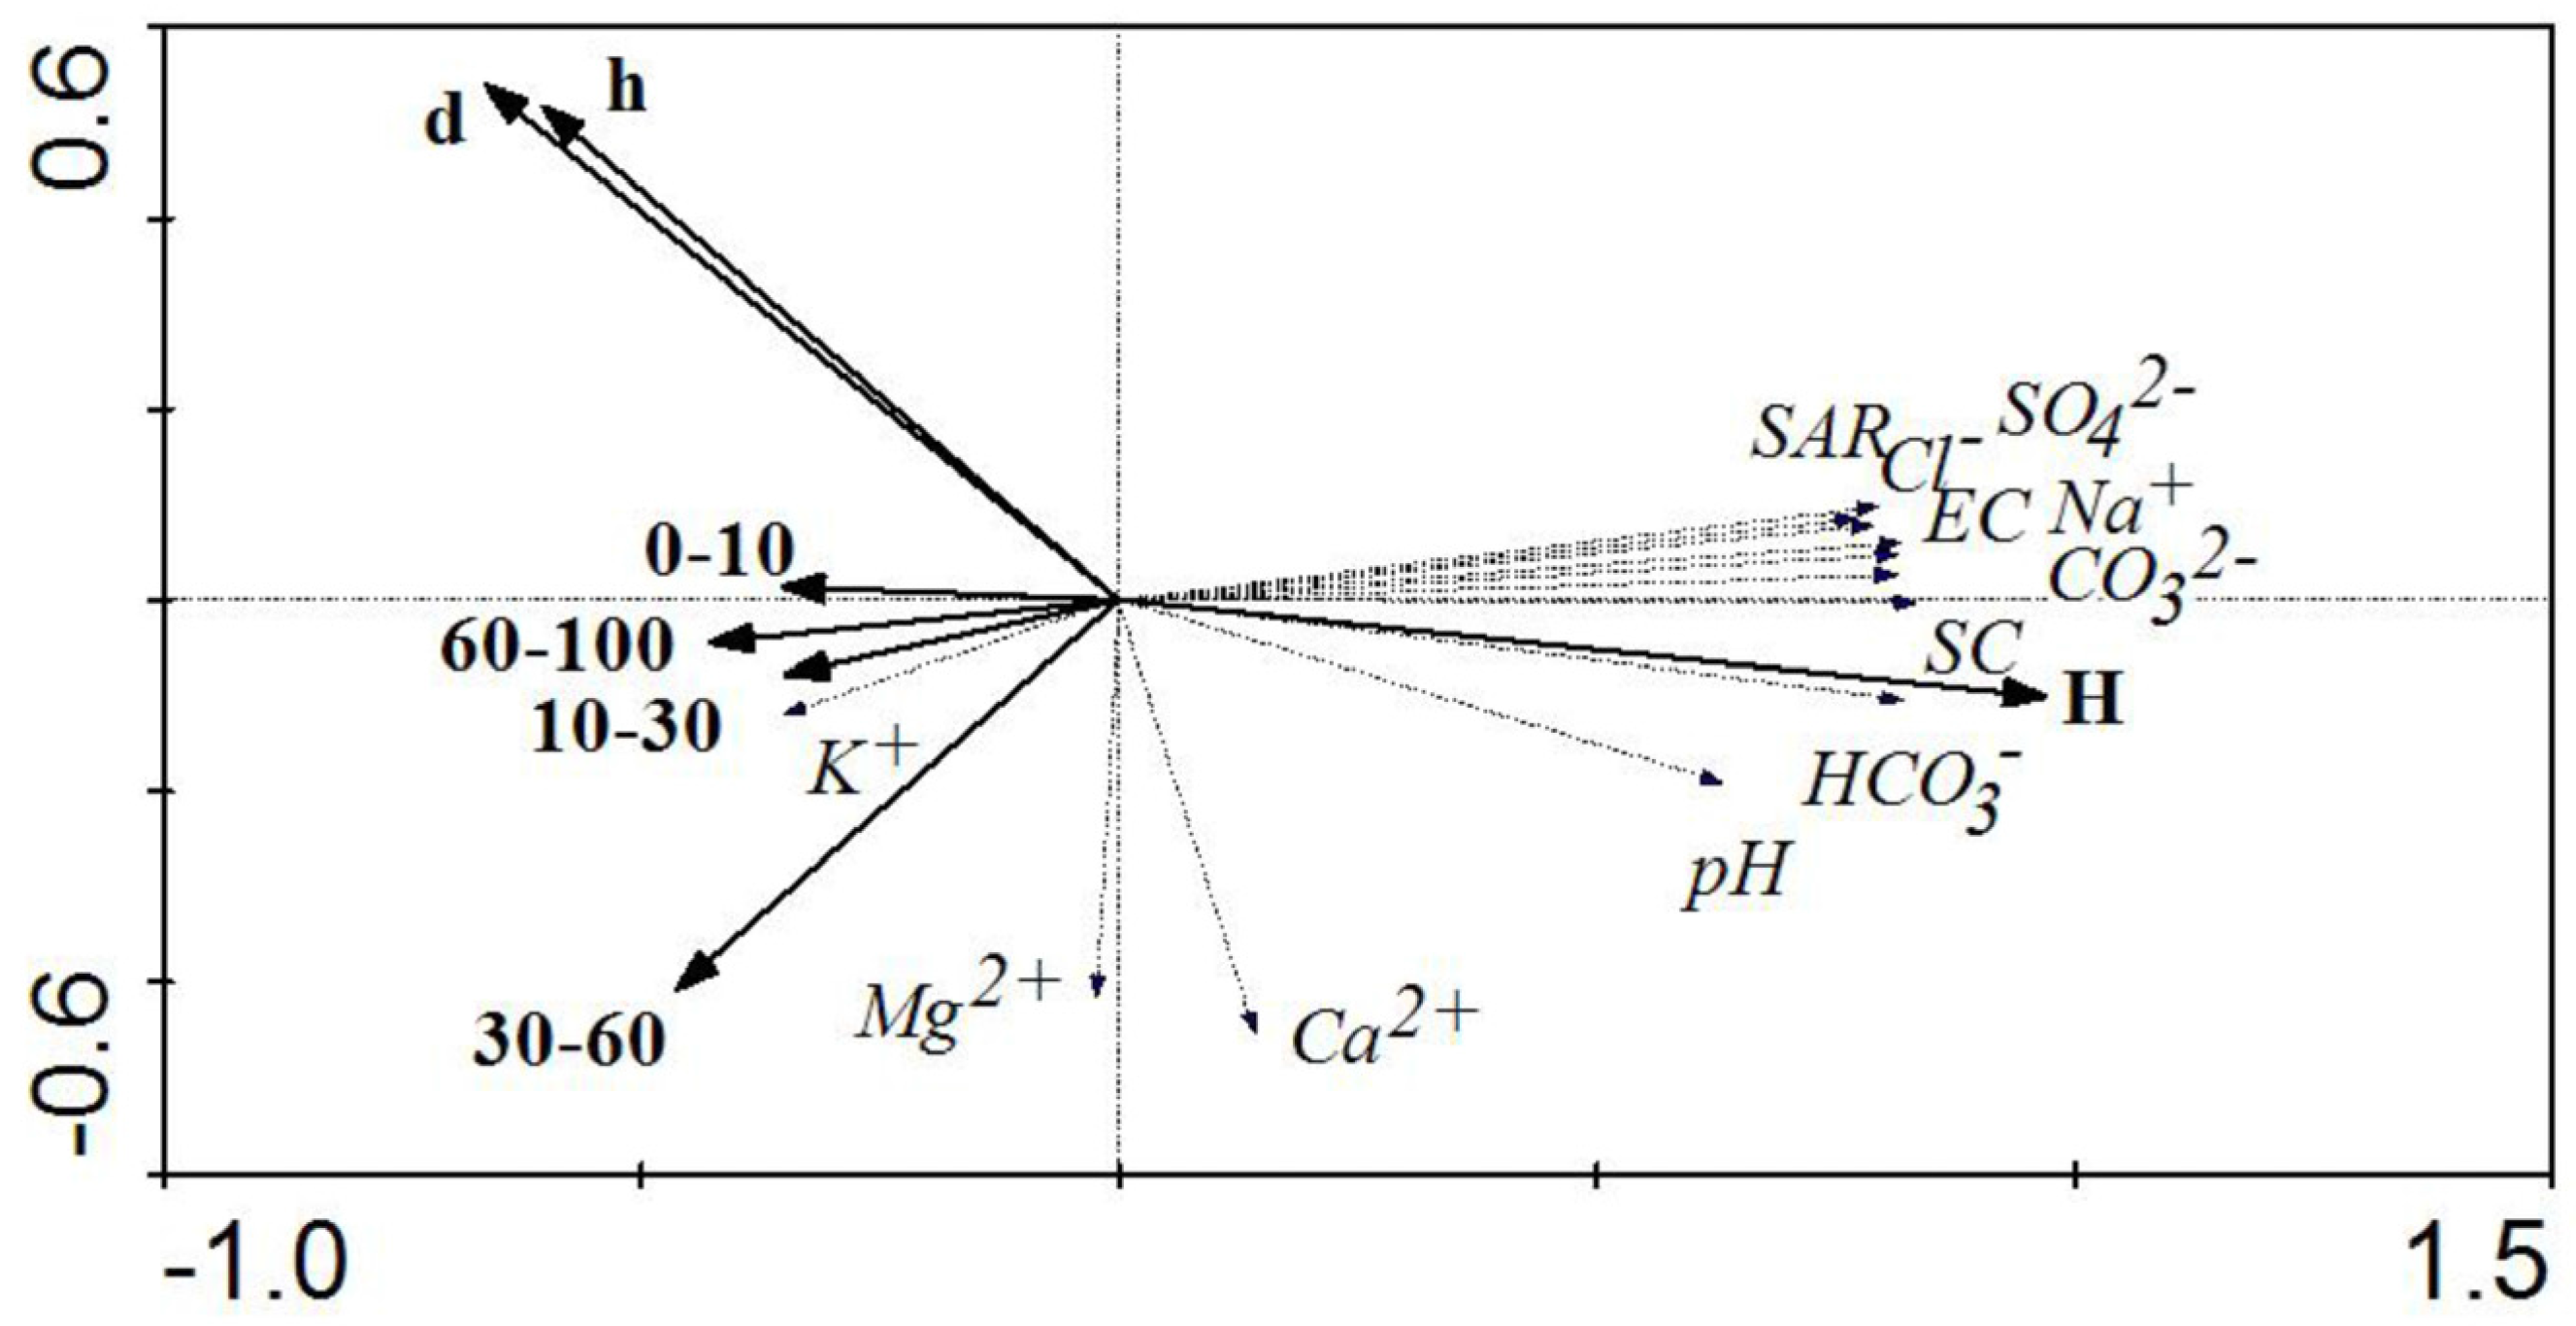
3.3. Relationship between Surface Soil Salinity–Sodicity and Environment Factors
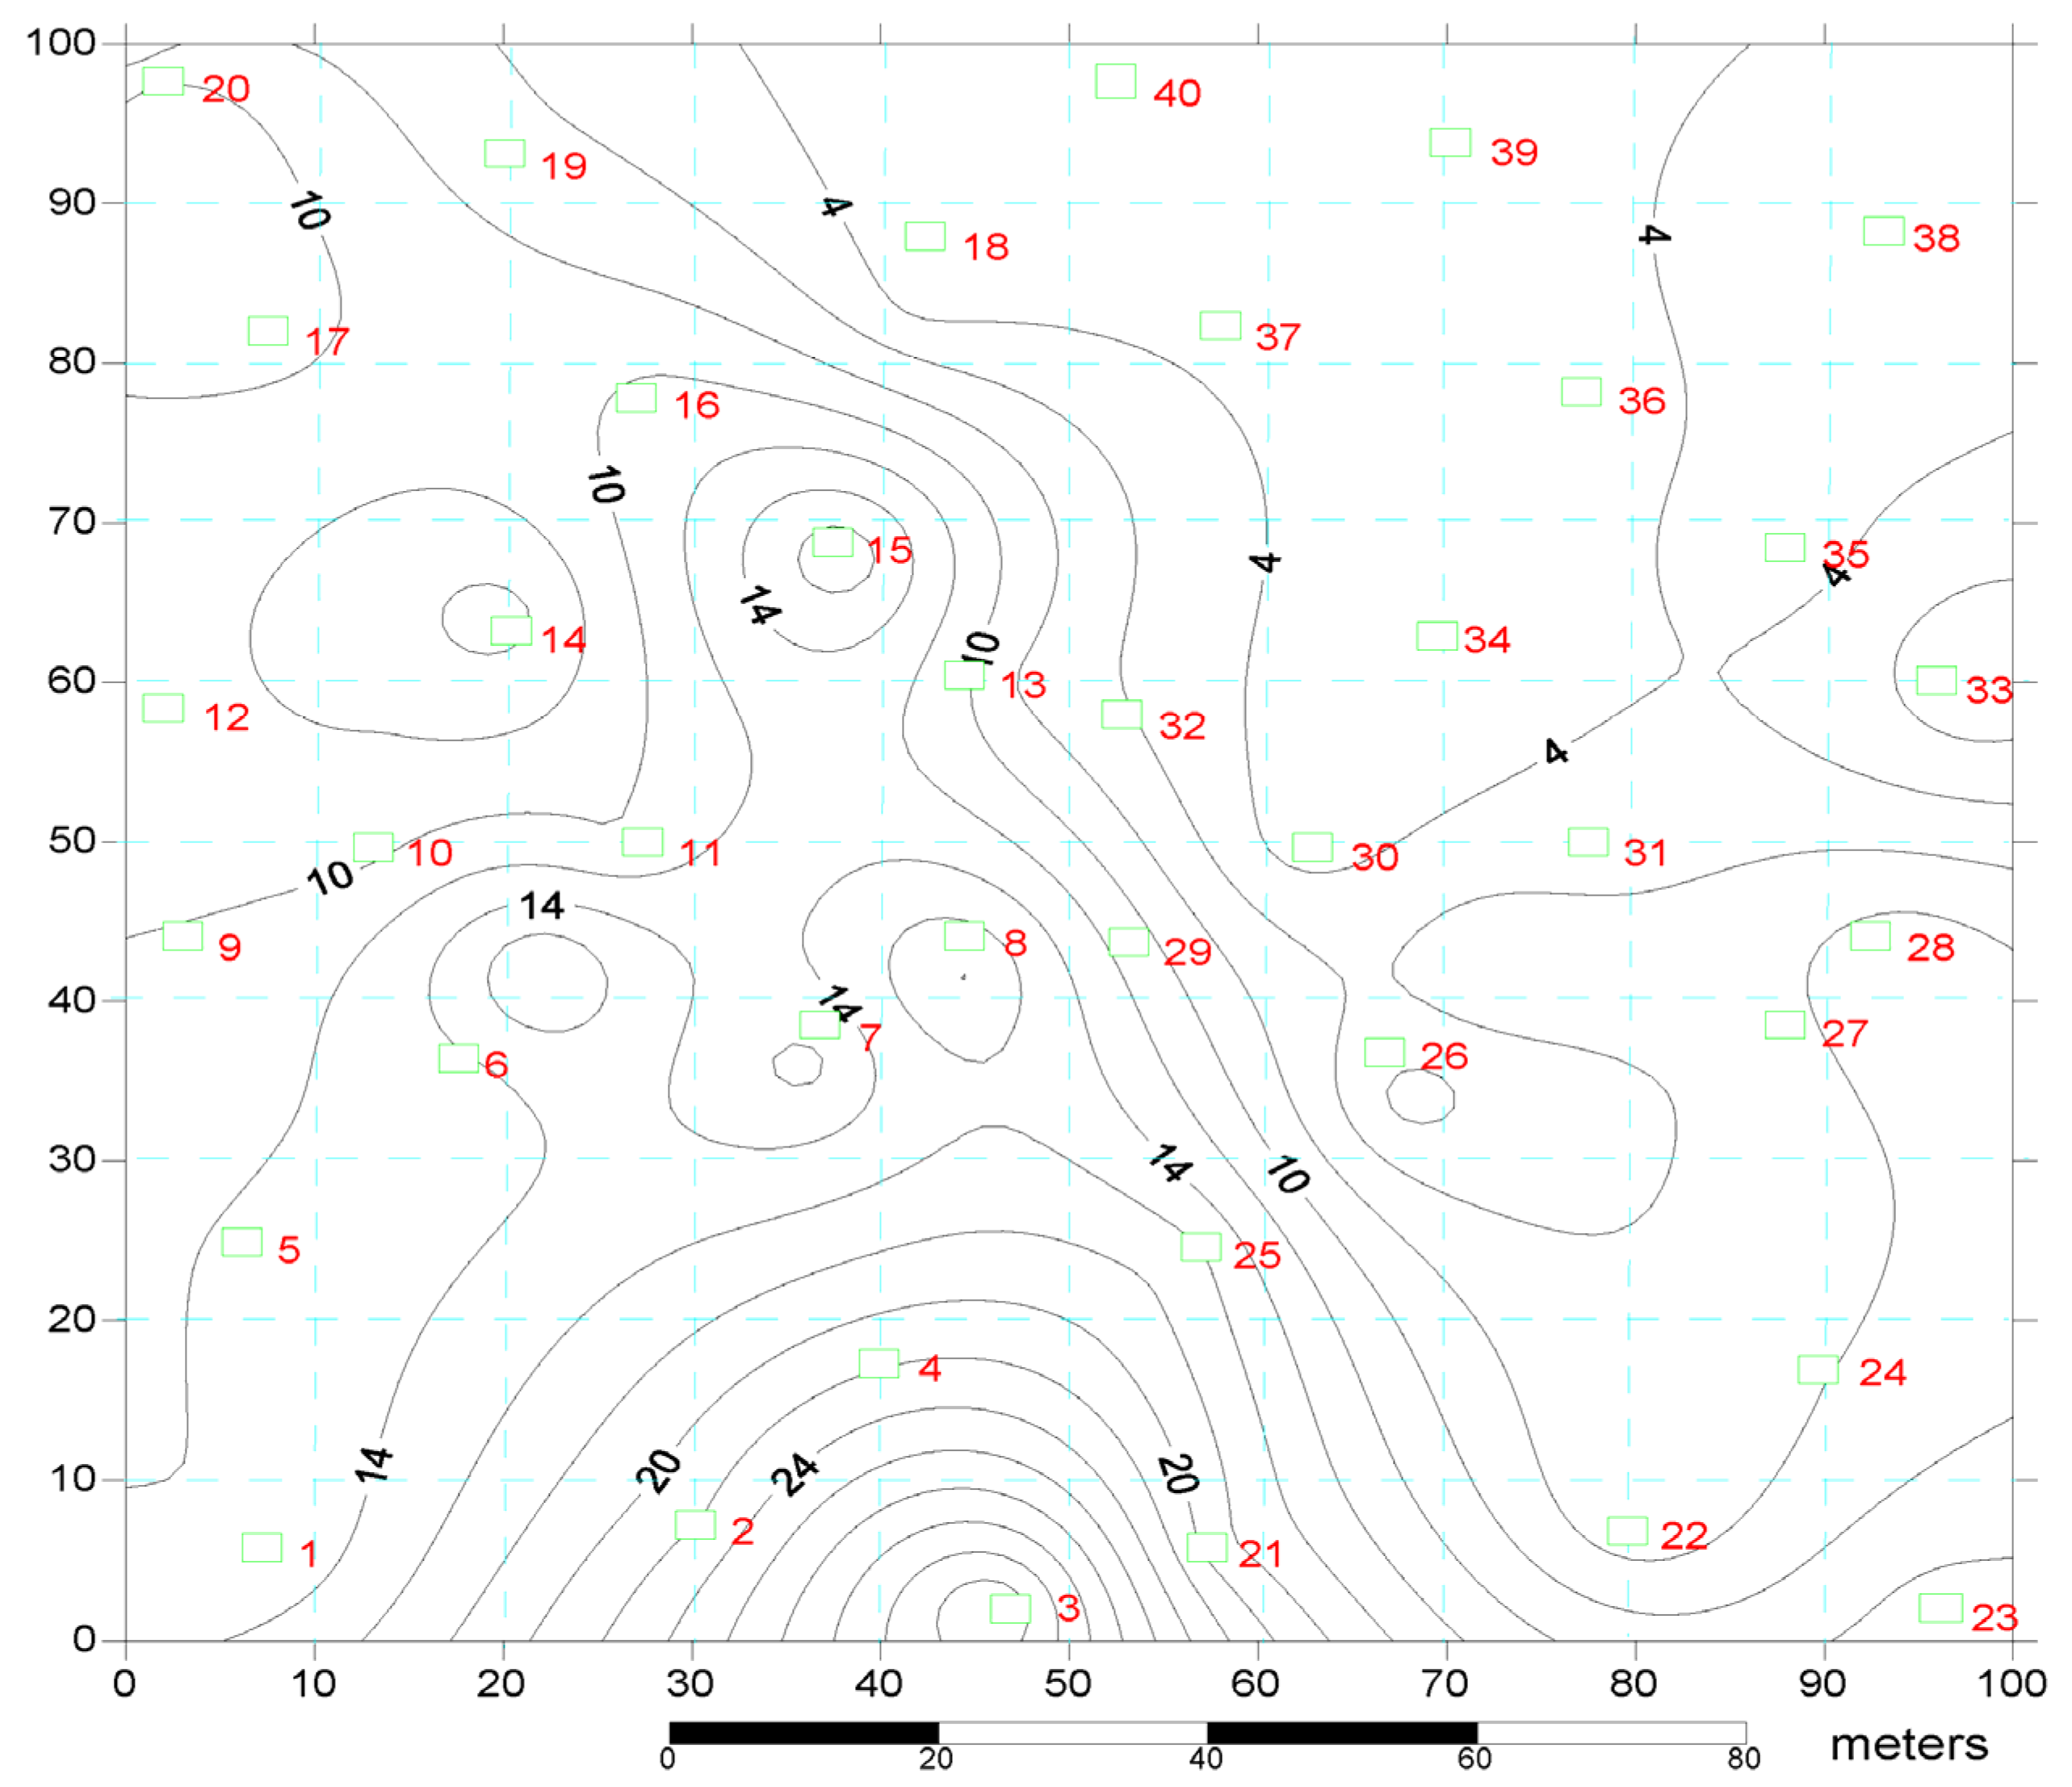
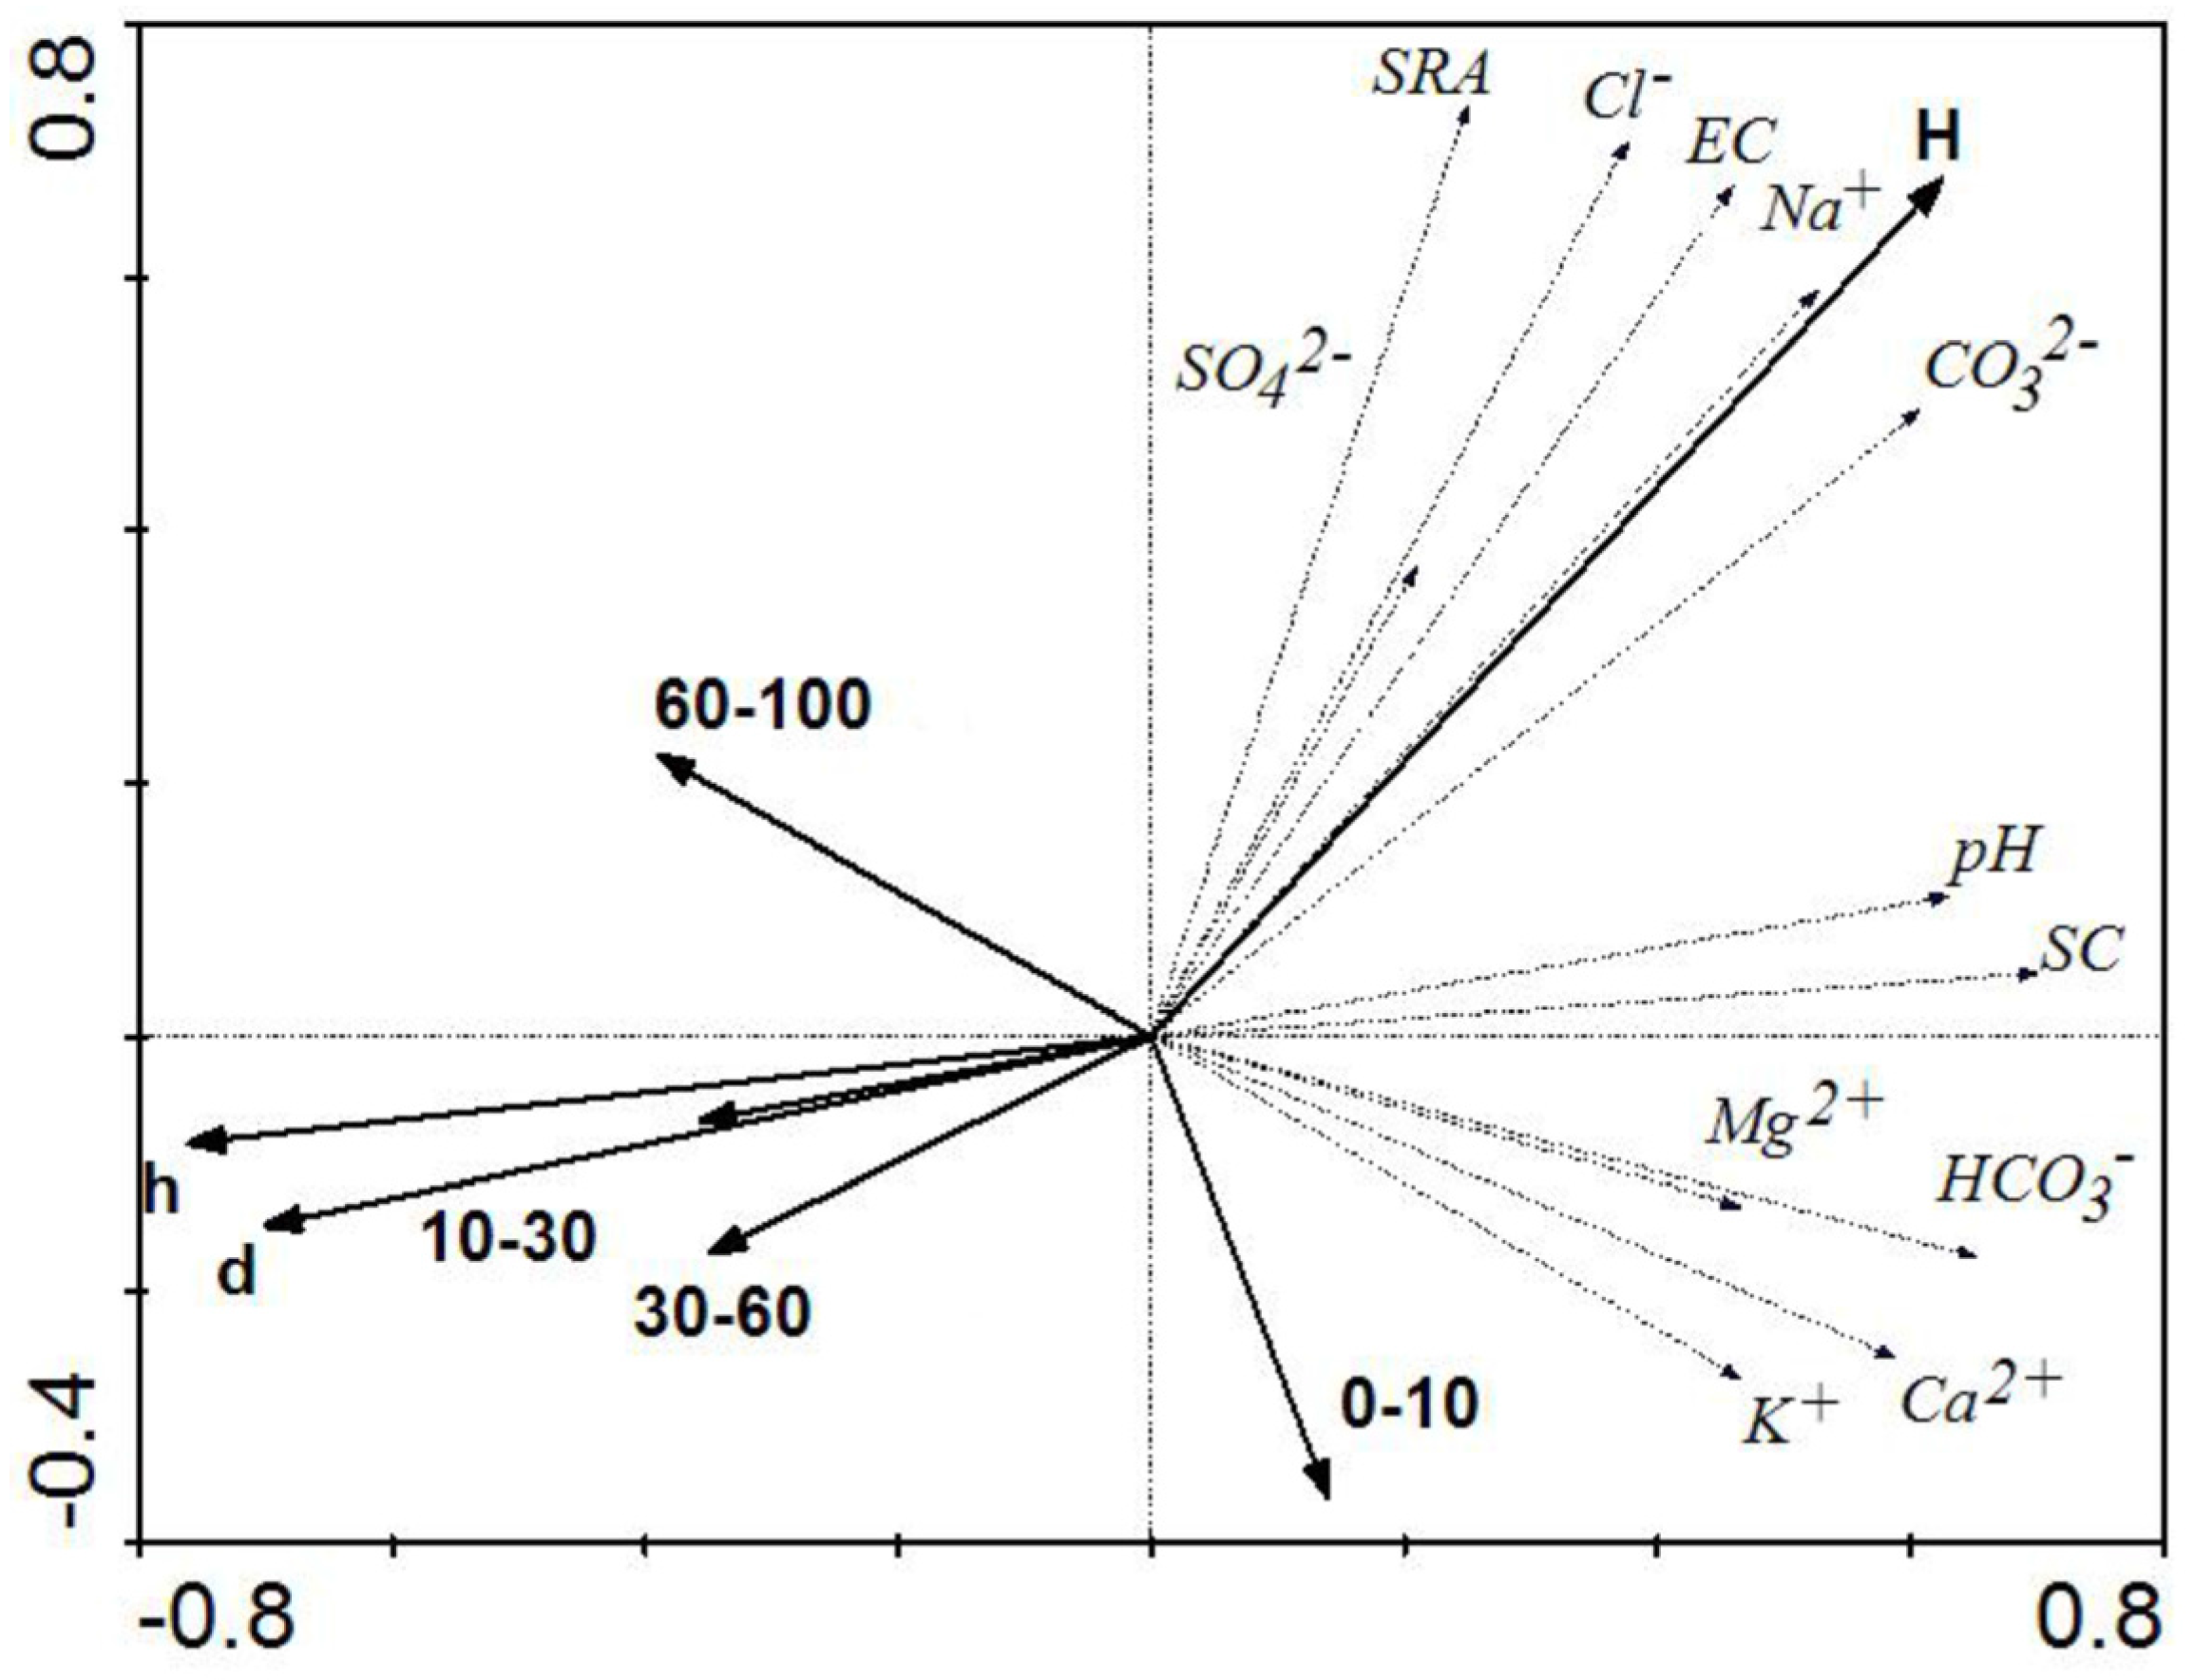
3.4. Key Factors Affecting Spatial Distribution of Surface Soil Salinity–Sodicity
4. Conclusions
Acknowledgments
Author Contributions
Conflicts of Interest
References
- Qadir, M.; Schubert, S.; Ghafoor, A.; Murtaza, G. Amelioration strategies for sodic soils: A review. Land Degrad. Dev. 2001, 12, 357–386. [Google Scholar] [CrossRef]
- Shaw, R.; Brebber, L.; Ahern, C.; Wein, M. A review of sodicity and sodic soil behavior in Queensland. Aust. J. Soil Res. 1994, 32, 143–172. [Google Scholar] [CrossRef]
- Ammari, T.G.; Tahhan, R.; Abubaker, S.; Al-Zu’Bi, Y.; Tahboub, A.; Ta’any, R.; Abu-Romman, S.; Al-Manaseer, N.; Stietiya, M.H. Soil salinity changes in the Jordan Valley potentially threaten sustainable irrigated agriculture. Pedosphere 2013, 23, 376–384. [Google Scholar] [CrossRef]
- Liu, X.T. Management on Degraded Land and Agricultural Development in the Songnen Plain; Science Press: Beijing, China, 2001. (In Chinese) [Google Scholar]
- Wang, L.; Seki, K.; Miyazaki, T.; Ishihama, Y. The causes of soil alkalinization in the Songnen Plain of Northeast China. Paddy Water Environ. 2009, 7, 259–270. [Google Scholar] [CrossRef]
- Li, X.Y.; Wang, Z.M.; Song, K.S.; Zhang, B.; Liu, D.W.; Guo, Z.X. Assessment for salinized wasteland expansion and land use change using GIS and remote sensing in the west part of Northeast China. Environ. Monit. Assess. 2007, 131, 421–437. [Google Scholar] [CrossRef] [PubMed]
- Jordán, M.M.; Navarro-Pedreño, J.; Garcia-Sánchez, E.; Mateu, J.; Juan, P. Spatial dynamics of soil salinity under arid and semi-arid conditions geological and environmental implications. Environ. Geol. 2004, 45, 448–456. [Google Scholar] [CrossRef]
- Rakhimbaev, F.M.; Bezpalov, N.F.; Khamidov, M.K. Peculiarities of Crop Irrigation in Lower Amu Dary River Areas; Fan Iashkent: Tashkent, Uzbekistan, 1992. (In Russian) [Google Scholar]
- Ibrakhimov, M.; Khamzina, A.; Forkutsa, I.; Paluasheva, G.; Lamers, J.P.A.; Tischbein, B.; Vlek, P.L.G.; Martius, C. Groundwater table and salinity: Spatial and temporal distribution and influence on soil salinization in Khorezm region (Uzbekistan, Aral Sea Basin). Irrig. Drain. Syst. 2007, 21, 219–236. [Google Scholar] [CrossRef]
- Luo, J.M.; Yang, F.; Wang, Y.J.; Ya, Y.J.; Deng, W.; Zhang, X.P.; Liu, Z.J. Mechanism of soil sodification at the local scale in Songnen Plain, northeast China, as affected by shallow groundwater table. Arid Land Res. Manag. 2011, 25, 234–256. [Google Scholar] [CrossRef]
- Song, C.C.; Deng, W. Characters of groundwater and influence on the interior salt-affected soil in the west of Jilin Province. Sci. Geogr. Sin. 2000, 20, 246–250. (In Chinese) [Google Scholar]
- Yang, F.; Zhang, G.X.; Yin, X.R.; Liu, Z.J.; Huang, Z.G. Study on capillary rise from shallow groundwater and critical water table depth of a saline-sodic soil in western Songnen Plain of China. Environ. Earth Sci. 2011, 64, 2119–2126. [Google Scholar] [CrossRef]
- Zhang, G.X. Study on the Evolution of Groundwater Environment and Safety Management in the Taoer River Basin. Ph.D. Thesis, Chinese Academy of Sciences, Beijing, China, 2004. [Google Scholar]
- Zhou, Y.; Fu, Z.; Liu, D.; Wang, L.; Wang, L. A study on the processes of grassland degradation, land salinization and soil desertification in the west of Jilin province. J. Jilin Univ. Earth Sci. Ed. 2003, 33, 348–354. (In Chinese) [Google Scholar]
- Joeckel, R.M.; Clement, B.J.A. Soils, surficial geology, and geomicrobiology of saline-sodic wetlands, North Platte River Valley, Nebraska, USA. CATENA 2005, 61, 63–101. [Google Scholar] [CrossRef]
- Ardahanlioglu, O.; Oztas, T.; Evren, S.; Yilmaz, H.; Yildirim, Z.N. Spatial variability of exchangeable sodium, electrical conductivity, soil pH and boron content in salt- and sodium-affected areas of the Igdir plain (Turkey). J. Arid Environ. 2003, 54, 495–503. [Google Scholar] [CrossRef]
- Corwin, D.L.; Lesch, S.M.; Oster, J.D.; Kaffka, S.R. Monitoring management-induced spatio-temporal changes in soil quality through soil sampling directed by apparent electrical conductivity. Geoderma 2006, 131, 369–387. [Google Scholar] [CrossRef]
- Emadi, M.; Baghernejad, M. Comparison of spatial interpolation techniques for mapping soil pH and salinity in agricultural coastal areas, northern Iran. Arch. Agron. Soil Sci. 2014, 60, 1315–1327. [Google Scholar] [CrossRef]
- Zhao, C.W.; Xu, L.; Wang, Z.C.; Wang, Y.H.; Chi, C.M. Studying Soil Salinity and Its Relations with Microtopography and Vegetation at Field Scale. Pol. J. Environ. Study 2013, 22, 1227–1237. [Google Scholar]
- Odeh, I.O.A.; Chittleborough, D.J.; McBratney, A.B. Elucidation of soil-landform interrelationships by canonical ordination analysis. Geoderma 1991, 49, 1–32. [Google Scholar] [CrossRef]
- McKenzie, N.J.; Austin, M.P. A quantitative Australian approach to medium and small scale surveys based on soil stratigraphy and environmental correlation. Geoderma 1993, 57, 329–355. [Google Scholar] [CrossRef]
- Gui, D.W.; Lei, J.Q.; Zeng, F.J.; Runge, M.; Mu, G.J.; Yang, F.X.; Zhu, J.T. Ordination as a tool to characterize soil particle size distribution, applied to an elevation gradient at the north slope of the Middle Kunlun Mountains. Geoderma 2010, 158, 352–358. [Google Scholar] [CrossRef]
- TerBraak, C.J.F. CANOCO—A Fortran Program for Canonical Community Ordinatin by Partial, Detrended, Canonical Correspondence Analysis and Redundancy Analysis (Version 2.1); Technical Report LWA-88-2 TNO; Agricultural Mathematics Group: Wageningen, The Netherlands, 1988. [Google Scholar]
- Deng, W.; Qiu, S.W.; Liang, Z.W. Background of Regional Eco-Environment in Da’an Sodic Land Experiment Station of China; Science Press: Beijing, China, 2005. (In Chinese) [Google Scholar]
- Eaton, A.D.; Clesceri, L.S.; Rice, E.W.; Greenberg, A.E. (Eds.) Standard Methods for the Examination of Water and Wastewater, 21st ed.; APHA Publication: Washington, DC, USA, 2005.
- Mahmoodabadi, M.; Yazdanpanah, N.; Sinobas, L.R.; Pazira, E.; Neshat, A. Reclamation of calcareous saline sodic soil with different amendments (I): Redistribution of soluble cations within the soil profile. Agric. Water Manag. 2013, 120, 30–38. [Google Scholar] [CrossRef]
- TerBraak, C.J.F.; Šmilauer, P. CANOCO Reference Manual and Canocodraw for Windows User’s Guide: Software for Canonical Community Ordination (Version 4.5); Microcomputer Power: New York, NY, USA, 2002. [Google Scholar]
- Lei, Z.D.; Yang, S.X.; Xu, Z.R.; Vachaud, G. Preliminary investigation of the spatial variability of properties. J. Hydraul. Eng. 1988, 9, 10–21. (In Chinese) [Google Scholar]
- Yang, J.F.; Deng, W.; Zhang, G.X. Water balance and temporal variation in water content in alkaline sodic soils with shallow water table. Hydrogeol. Eng. Geol. 2007, 4, 61–69. (In Chinese) [Google Scholar]
- Kilic, K.; Kilic, S. Spatial variability of salinity and alkalinity of a field having salination risk in semi-arid climate in northern Turkey. Environ. Monit. Assess. 2007, 127, 55–65. [Google Scholar] [CrossRef] [PubMed]
- Rengasamy, P.; Olson, K.A. Sodicity and Soil Structure. Aust. J. Soil Res. 1991, 29, 935–952. [Google Scholar] [CrossRef]
- Yang, J.F.; Zhang, G.X. Effect of hydrological process change on soil salinization in western Songnen Plain. J. Arid Land Resour. Environ. 2010, 24, 168–172. (In Chinese) [Google Scholar]
- Yang, F.; Zhang, G.X.; Yin, X.R.; Liu, Z.J. Field-Scale Spatial Variation of Saline-Sodic Soil and Its Relation with Environmental Factors in Western Songnen Plain of China. Int. J. Environ. Res. Public Health 2011, 8, 374–387. [Google Scholar] [CrossRef] [PubMed]
- Chi, C.M.; Wang, Z.C. Soil salinity, sodicity and alkalinity characteristics of degraded grassland in the west of Jinlin province, China. Ecol. Environ. Sci. 2013, 22, 1534–1537. (In Chinese) [Google Scholar]
- Rengasamy, P. Transient salinity and subsoil constraints to dry land farming in Australian sodic soils: An overview. Aust. J. Exp. Agric. 2002, 42, 351–361. [Google Scholar] [CrossRef]
- Cemek, B.; Guler, M.; Kilic, K.; Demer, Y.; Arslan, H. Assessment of spatial variability in some soil properties as related to soil salinity and alkalinity in Bafra plain in northern Turkey. Environ. Monit. Assess. 2007, 124, 223–234. [Google Scholar] [CrossRef] [PubMed]


| Chemical Property | Year | Number of Points | Minimum | Maximum | Mean | Standard Deviation | Coefficient of Variation |
|---|---|---|---|---|---|---|---|
| EC (µs·cm−1) | 2005 | 40 | 82.8 | 2710 | 392 ± 63.2a | 400 | 1.02 |
| 2007 | 40 | 123 | 4730 | 660 ± 145.4a | 920 | 1.39 | |
| pH | 2005 | 40 | 7.87 | 10.7 | 9.51 ± 0.13a | 0.81 | 0.09 |
| 2007 | 40 | 8.25 | 10.6 | 9.48 ± 0.11a | 0.69 | 0.07 | |
| SAR | 2005 | 40 | 3.09 | 86.85 | 10.61 ± 2.0a | 12.59 | 1.19 |
| 2007 | 40 | 5.55 | 305.89 | 35.92 ± 11.2b | 70.87 | 1.97 | |
| SC (mg/kg) | 2005 | 40 | 587.7 | 13,616 | 5212 ± 606a | 3833 | 1.25 |
| 2007 | 40 | 873.8 | 22,826 | 4069 ± 807a | 5105 | 0.74 | |
| Cation content (mg/kg) | |||||||
| Na+ | 2005 | 40 | 83.6 | 5062 | 809 ± 123a | 781 | 0.96 |
| 2007 | 40 | 161.5 | 8499 | 1238 ± 312a | 1976 | 1.60 | |
| K+ | 2005 | 40 | 4.94 | 65.6 | 27.5 ± 3.1a | 19.3 | 0.70 |
| 2007 | 40 | 3.46 | 17.8 | 8.89 ± 0.49b | 3.09 | 0.34 | |
| Mg2+ | 2005 | 40 | 7.76 | 620 | 108 ± 19.6a | 124 | 1.14 |
| 2007 | 40 | 0.51 | 59.9 | 13.4 ± 1.78b | 11.3 | 0.84 | |
| Ca2+ | 2005 | 40 | 42.4 | 1515 | 501 ± 71.4a | 451 | 0.90 |
| 2007 | 40 | 44 | 571 | 130 ± 16.9b | 107 | 0.81 | |
| Anion content (mg/kg) | |||||||
| CO32− | 2005 | 40 | 0.0 | 1386 | 189 ± 62.9a | 258 | 1.37 |
| 2007 | 40 | 0.0 | 3240 | 368 ± 118a | 748 | 2.03 | |
| HCO3− | 2005 | 40 | 366 | 9699 | 3369 ± 408a | 2581 | 0.77 |
| 2007 | 40 | 439.2 | 6881 | 1583 ± 237b | 1500 | 0.95 | |
| Cl− | 2005 | 40 | 71 | 1793 | 198 ± 41.9a | 265 | 1.33 |
| 2007 | 40 | 142 | 3186 | 543 ± 127b | 805 | 1.48 | |
| SO42− | 2005 | 40 | 0.0 | 36.5 | 9.14 ± 1.07a | 6.78 | 0.74 |
| 2007 | 40 | 34.76 | 951 | 183 ± 32.4b | 205 | 1.12 | |
| Ground Elevation (cm) | Year | Na+ mg/kg | CO32− mg/kg | EC µs/cm | pH | SC mg/kg |
|---|---|---|---|---|---|---|
| 0–10 | 2005 | 594 ± 70a | 103 ± 30a | 286 ± 23a | 9.18 ± 0.12a | 4444 ± 3675a |
| 2007 | 496 ± 275a | 90 ± 138a | 316 ± 35a | 9.18 ± 0.12a | 2044 ± 968b | |
| 10–20 | 2005 | 844 ± 102a | 238 ± 178a | 397 ± 144a | 9.8 ± 0.22a | 6227 ± 3752a |
| 2007 | 1013 ± 184a | 263 ± 215a | 617 ± 432a | 9.7 ± 0.14a | 3550 ± 1874b | |
| 20–40 | 2005 | 2219 ± 1433a | 660 ± 379a | 1200 ± 462a | 10.4 ± 0.15a | 7324 ± 2952a |
| 2007 | 7797 ± 520b | 2844 ± 310b | 3263 ± 766b | 10.5 ± 0.04a | 20,850 ± 1342b |
| Wet Year (2005) | Dry Year (2007) | |||||||
|---|---|---|---|---|---|---|---|---|
| AX1 | AX2 | AX3 | AX4 | AX1 | AX2 | AX3 | AX4 | |
| Eigenvalue | 0.48 | 0.036 | 0.000 | 0.000 | 0.687 | 0.001 | 0.000 | 0.000 |
| Species-environment correlation | 0.695 | 0.771 | 0.324 | 0.153 | 0.835 | 0.429 | 0.310 | 0.249 |
| Cumulative percentage variance (%) | 94.6 | 100 | 100 | 100 | 99.8 | 100 | 100 | 100 |
| Ground elevation (H) | 0.4339 * | 0.5213 ** | −0.1001 | 0.0029 | 0.8092 ** | −0.0433 | −0.0349 | −0.0243 |
| W0–10 | −0.0972 | −0.2798 | 0.1884 | −0.0888 | −0.2937 | 0.0064 | −0.1147 | 0.2058 |
| W10–30 | −0.2478 | −0.0513 | 0.0897 | −0.0941 | −0.2904 | −0.0334 | −0.0757 | 0.0922 |
| W30–60 | −0.2424 | −0.1314 | −0.0242 | −0.0808 | −0.3866 * | −0.1747 | 0.1645 | 0.0853 |
| W60–100 | −0.2706 | 0.1714 | 0.1879 | −0.0422 | −0.3564 * | −0.0190 | 0.0291 | 0.0222 |
| Ponding depth (h) | −0.5281 ** | −0.0651 | 0.0825 | −0.0136 | −0.5032 ** | 0.2217 | 0.1108 | 0.1025 |
| Ponding time (d) | −0.4864 ** | −0.1155 | 0.1106 | −0.0009 | −0.5532 ** | 0.3312 | 0.0830 | 0.0852 |
| Year | Variable | Na+ | Ca2+ | CO32− | HCO3− | Cl− | SO42− | SC | pH | EC | SAR |
|---|---|---|---|---|---|---|---|---|---|---|---|
| 2005 | H | 0.728 ** | 0.203 | 0.744 ** | 0.289 | 0.688 ** | 0.310 | 0.471 ** | 0.558 ** | 0.733 ** | 0.629 ** |
| W30–60 | −0.286 | −0.140 | −0.306 | −0.200 | −0.266 | −0.057 | −0.252 | −0.256 | −0.269 | −0.214 | |
| W60–100 | −0.076 | −0.291 | −0.192 | −0.292 | 0.049 | 0.02 | −0.262 | −0.351 * | −0.031 | 0.122 | |
| h | −0.452 ** | −0.429 ** | −0.530 ** | −0.481 ** | −0.324 * | 0.12 | −0.537 ** | −0.553 ** | −0.399 * | −0.240 | |
| d | −0.458 ** | −0.382 * | −0.531 ** | −0.430 ** | −0.340 * | 0.06 | −0.498 ** | −0.560 ** | −0.413 ** | −0.265 | |
| 2007 | H | 0.783 ** | 0.199 | 0.788 ** | 0.805 ** | 0.763 ** | 0.768 ** | 0.809 ** | 0.736 ** | 0.625 ** | 0.784 ** |
| W30–60 | −0.394 * | 0.064 | −0.352 * | −0.337 * | −0.429 ** | −0.407 ** | −0.386 * | −0.370 * | −0.225 | −0.396 * | |
| W60–100 | −0.346 * | −0.113 | −0.344 * | −0.344 * | −0.348 * | −0.327 * | −0.356 * | −0.317 * | −0.290 | −0.362 * | |
| h | −0.461 ** | −0.423 ** | −0.454 ** | −0.545 ** | −0.460 ** | −0.438 ** | −0.505 ** | −0.397 * | −0.527 ** | −0.458 ** | |
| d | −0.511 ** | −0.411 ** | −0.508 ** | −0.598 ** | −0.501 ** | −0.471 ** | −0.555 ** | −0.444 ** | −0.591 ** | −0.504 ** |
| Marginal Effects | Conditional Effects | ||||
|---|---|---|---|---|---|
| Variable | Lam. | Variable | Lam. | P | F |
| h | 0.27 | h | 0.27 | 0.002 | 13.79 |
| d | 0.23 | H | 0.08 | 0.024 | 4.58 |
| H | 0.19 | W0–10 | 0.04 | 0.098 | 2.79 |
| W60–100 | 0.07 | W60–100 | 0.05 | 0.100 | 2.88 |
| W10–30 | 0.06 | d | 0.04 | 0.118 | 2.71 |
| W30–60 | 0.06 | W10–30 | 0.00 | 0.666 | 0.22 |
| W0–10 | 0.01 | W30–60 | 0.01 | 0.826 | 0.10 |
| Marginal Effects | Conditional Effects | ||||
|---|---|---|---|---|---|
| Variable | Lam. | Variable | Lam. | P | F |
| H | 0.35 | H | 0.35 | 0.002 | 19.27 |
| d | 0.25 | W60–100 | 0.10 | 0.049 | 8.68 |
| W30–60 | 0.15 | h | 0.02 | 0.106 | 2.69 |
| W60–100 | 0.13 | W30–60 | 0.01 | 0.650 | 0.21 |
| W0–10 | 0.09 | d | 0.00 | 0.742 | 0.17 |
| W10–30 | 0.08 | W0–10 | 0.00 | 0.960 | 0.03 |
© 2016 by the authors; licensee MDPI, Basel, Switzerland. This article is an open access article distributed under the terms and conditions of the Creative Commons Attribution (CC-BY) license (http://creativecommons.org/licenses/by/4.0/).
Share and Cite
Yang, F.; An, F.; Ma, H.; Wang, Z.; Zhou, X.; Liu, Z. Variations on Soil Salinity and Sodicity and Its Driving Factors Analysis under Microtopography in Different Hydrological Conditions. Water 2016, 8, 227. https://doi.org/10.3390/w8060227
Yang F, An F, Ma H, Wang Z, Zhou X, Liu Z. Variations on Soil Salinity and Sodicity and Its Driving Factors Analysis under Microtopography in Different Hydrological Conditions. Water. 2016; 8(6):227. https://doi.org/10.3390/w8060227
Chicago/Turabian StyleYang, Fan, Fenghua An, Hongyuan Ma, Zhichun Wang, Xia Zhou, and Zhijun Liu. 2016. "Variations on Soil Salinity and Sodicity and Its Driving Factors Analysis under Microtopography in Different Hydrological Conditions" Water 8, no. 6: 227. https://doi.org/10.3390/w8060227
APA StyleYang, F., An, F., Ma, H., Wang, Z., Zhou, X., & Liu, Z. (2016). Variations on Soil Salinity and Sodicity and Its Driving Factors Analysis under Microtopography in Different Hydrological Conditions. Water, 8(6), 227. https://doi.org/10.3390/w8060227