Article

Can Rapid Assessments Predict the Biotic Condition of Restored Streams?

1
NC Sea Grant and Biological and Agricultural Engineering Department, Box 8605, NC State University, Raleigh, NC 27695, USA
2
Biological and Agricultural Engineering Department, Box 7625, NC State University, Raleigh, NC 27695, USA
3
Statistics Department, NC State University, Raleigh, NC 27695, USA
4
Biological and Agricultural Engineering Department, NC State University, Raleigh, NC 27695, USA
*
Author to whom correspondence should be addressed.
Current address: Apple Inc., 505 N Mathilda Ave, Sunnyvale, CA 94085, USA
Current address: NC Division of Mitigation Services; 217 West Jones St, Raleigh, NC 27603, USA
Water 2016, 8(4), 143; https://doi.org/10.3390/w8040143
Submission received: 28 January 2016 / Revised: 14 March 2016 / Accepted: 5 April 2016 / Published: 13 April 2016

Abstract

:
Five rapid visual stream assessment methods were applied to 65 restored streams in North Carolina, and the results were correlated with measured macroinvertebrate community metrics to evaluate predictive ability. The USEPA Rapid Bioassessment Protocol (RBP), USDA Stream Visual Assessment Protocol (SVAP), Peterson’s Riparian Channel and Environmental Inventory (RCE), NCSU Eco-Geomorphological Assessment (EGA), and NCSU Stream Performance Assessment (SPA) were applied by teams with expertise in hydrology, fluvial geomorphology, and aquatic ecology. Predictions of most macroinvertebrate metrics were improved by re-weighting assessment variables using principal component analysis (PCA) and including watershed factors (e.g., size, slope, land use). The correlations of EGA, RCE, SPA and SVAP assessment results to macroinvertebrate metrics were most improved by variable re-weighting using PCA, while the correlations of RBP were most improved by adding watershed parameters. Akaike’s Information Criterion (AIC) indicates that PCA re-weighting including watershed parameters improves the predictor model for the total number of dominant EPT taxa more than using the sum total raw points for all five assessment methods. To demonstrate the application of the study results, a single-value index was generated for the RBP method using principal component regression (PCR) based on the EPT (Ephemeroptera, Plecoptera and Trichoptera) taxa metric.

1. Introduction

1.1. Stream Restoration Definition and Goals

Stream restoration projects are implemented to enhance water quality, better manage riparian zones, improve in-stream habitat, promote fish passage, and stabilize streambanks [1]. Many funding agencies have realized the need to ensure that restoration projects are meeting the intended objectives. However, the biggest challenge for many mitigation programs is accurately and efficiently assessing stream functions within a regulatory program’s time and resource constraints [2].
The US Environmental Protection Agency (EPA) [3] defines ecological restoration as “the restoration of chemical, physical, and/or biological components of a degraded system to a pre-disturbance condition.” Restoration often strives to recover both structure and function to degraded riverine ecosystems [4]. A common assumption often paired with the goal of returning both structure and function is that “if you build it they will come.” USEPA [5] ascertains that strengthening structural or functional components will improve water quality and habitat, which will lead to improvements in aquatic and terrestrial communities that depend on water. However, establishing links between the biological outcomes that result from the changes or inputs to the ecosystem can be difficult. Further, the functional uplift—improvement in physical, chemical and biological conditions that occur in ecosystems—due to restoration or enhancement can be confounded by factors that exist upstream or within the catchment. Therefore, there is a need to define the relationships between physical attributes and habitats in restored streams with respect to the biotic communities that serve as indicators of stream health similar to what has been done in un-restored streams [6,7,8]. These relationships can in turn be used to guide future restoration design, monitoring and assessment.

1.2. Stream Assessment Methods and Their Prediction of Biological Condition

Biological assessments are designed to characterize the status and monitor the trends of water resources, and macroinvertebrates are the most widely used assemblages for these assessments [9]. Rapid bioassessments are designed to be efficient, cost-effective tools for screening aquatic life support of streams [9,10]. Several existing rapid stream assessments may be useful for evaluating condition and the potential functional uplift of a stream achieved by restoration projects. Examples of existing visual rapid stream assessments include the visual habitat assessment portion of the USEPA Rapid Bioassessment Protocol (RBP) [10], the USDA Stream Visual Assessment Protocol (SVAP) [11,12], the Riparian Channel and Environmental Inventory (RCE) [13], the Qualitative Habitat Evaluation Index (QHEI) [14], and the Bureau of Land Management (BLM) Proper Functioning Condition (PFC) method [15]
Habitat-based rapid assessments such as the RBP, QHEI and SVAP often show high correlation with one another; however, a strong relationship between these assessments and those based on hydrologic function is often lacking (i.e., PFC) [12,16,17]. Further, quantitative assessments are more labor intensive and significant uncertainty remains in their ability to detect habitat changes associated with management actions [18].
Establishing links between physical, chemical, and biological factors in streams has been difficult without adding the confounding factors associated with restoration, such as extensive changes in geometry, soil disturbance, and inclusion of man-made structures. Several studies have worked to develop habitat, morphology, and stability assessments that correspond to biotic measures of streams with limited success. Despite Stauffer and Goldstein [16] finding good correlation among QHEI, RCE, and RBP stream assessments, all three methods failed to statistically relate to biotic community metrics. Hughes et al. [19] tested the SVAP, QHEI, and RBP assessments and USEPA quantitative rapid bioassessments on 51 agricultural streams in 10 states. They found high correlation among the four physical habitat indices (Pearson 0.87–0.88), but only low to moderate correlation with previously calculated metrics for fish and macroinvertebrates. Some quantitative metrics, such as substrate mean diameter, were found to better correlate with macroinvertebrate metrics than the qualitative metrics. Similarly, the Natural Resources Conservation Service (NRCS) [12] tested the SVAP in several states finding moderate correlations to biotic integrity in Virginia and weak correlation to macroinvertebrate and fish community metrics in the Carolinas. Their comparison of the SVAP to the QHEI in Ohio streams revealed much higher correlation. Hughes et al. [19] speculate that poor correlation may be due to water catchment, riparian, and/or chemical factors that are not accounted for. Cortes et al. [20] assert that despite several stream assessments existing in Europe, Australia, and the United States, successful integration of these procedures with biological descriptors is rare.
While significant work has been done to develop and apply qualitative and quantitative sampling methods to assess stream habitat condition [18], application of these methods to stream restoration and enhancement projects to determine restoration potential and functional uplift is limited. As such, Sommerville & Pruitt [18] recommend a nationwide effort to conduct further testing of assessments in a variety of ecoregions to improve regulatory and management decisions affecting these resources. They conclude that stream assessments used for the Clean Water Act Section 404 (CWA 404) should include: classification to narrow the natural variability of streams, objectivity to limit observer bias, quantitative methods, an emphasis on fluvial geomorphology and careful management of the data from these assessments. The National Research Council [4] concurs that hydrology and fluvial geomorphology principles and analytical methods should be applied more extensively to stream restoration projects.

1.3. Watershed Links to Stream Condition

Expecting watershed conditions to explain relationships between stream assessment scores and biotic outcomes is reasonable, given that research since the 1970s has linked watershed development and hydrologic factors to stream condition, function, and health. As little as 10% impervious cover has been linked to stream degradation, with the severity increasing as impervious cover increases [21]. Urban cover or impervious cover can result in increased peak discharges [22], channel enlargement [23,24] and associated erosion, a decline in water quality and habitat as well as a decline in macroinvertebrate community metrics [7]. Booth [6] concluded that biological condition was highly variable with low levels of anthropogenic development, but was consistently poor at high levels of impervious cover percentage and associated urban cover. Despite this strong relationship, most of the rapid assessment procedures capture little if any watershed factors in their evaluation procedures.

1.4. Identifying Procedures for Improving the Predictive Capability of Rapid Stream Assessments

Restoration and enhancement projects are typically implemented with a goal of improving stream health, which can be evaluated using macroinvertebrate communities or other biological indicators. Monitoring of project effectiveness is often limited by resource constraints, meaning that comprehensive biological monitoring and assessment is rarely conducted in conjunction with the common geomorphic assessments of physical condition. As a complement to biological assessment, several rapid stream assessments have been developed to evaluate stream conditions. These rapid assessments primarily focus on physical attributes and habitat in the stream that are believed to influence the quality of the water resource and the condition of the resident aquatic community [10]. These rapid assessments are typically based on visual and/or quantitative measures that are summed or averaged to produce single value scores. The resulting score is then compared to a set of standard scores in ranges that reflect an expected level of biotic, ecological or environmental integrity. A weakness of these approaches is that they either assign subjective importance to assessment variables or they assume each of the assessment measures are equally indicative of stream health, and consequently are often not good predictors of macroinvertebrate community or other biotic metrics. We suggest in this paper that a viable alternative is to minimize the subjectivity of variable weights in order to explicitly define stream health in terms of macroinvertebrate metrics. This can be done by regression of macroinvertebrate metrics on the assessment variables, where ordination methods (such as Principal Component Analysis, PCA) are applied to address collinearity between measured components and improve prediction. Further, we hypothesize that in addition to PCA, inclusion of watershed condition factors will improve the ability of the stream assessments to predict macroinvertebrate metrics.
A primary objective of this research was to identify tools that can be used to evaluate restoration need and potential functional uplift for stream restoration projects. This study included assessment and analysis of restored streams only and applied rapid habitat assessment tools for evaluating ecological conditions in restored streams. However a more comprehensive effort should include assessment of un-restored streams representing a variety of ecological conditions (e.g., degraded to high-quality reference streams). Improvements in richness and diversity of aquatic organisms (e.g., fish and macroinvertebrates) is often a desired goal for many restoration efforts. To gauge the potential use of rapid stream assessment methods as tools for measuring functional uplift, five assessment methods were tested to determine how well they predicted stream health as measured by macroinvertebrate community metrics. The number of dominant EPT taxa (EPT taxa), which includes taxa from the “pollution sensitive” macroinvertebrate orders of Ephemeroptera (mayflies), Plecoptera (stoneflies) and Trichoptera (caddisflies), was chosen for the prediction analysis. EPT taxa were chosen for this and other select graphical and statistical analyses because they are widely used as indicators of environmental disturbances and urbanization [25], they show a response to a wide array of pollutants over both long-term and short-term exposures, they are an indicator of flow persistence [26], and they are considered an appropriate richness measure for evaluating stream health [10]. A final objective of this study was to provide techniques for improving rapid habitat assessment tools so that they can serve as better indicators of the biological communities that can be expected to colonize restored streams. For demonstration purposes, a new single-value index based explicitly on EPT taxa prediction was developed for the RBP method by defining variable weights using coefficients obtained from Principal Component Regression (PCR).

2. Materials and Methods

2.1. Stream Assessment

This research effort applied five rapid stream assessment methods to 65 restored streams including two new methods and three existing methods. The two new methods developed include the Eco-Geomorphological Assessment (EGA) and the Stream Performance Assessment (SPA) [27]. Both methods focus on restored streams with an emphasis on fluvial geomorphology as recommended by others [4,18]. The SPA is a rapid visual qualitative assessment that is comparable in scope and effort to the three existing methods (RBP, RCE and SVAP). The EGA, in contrast, requires more extensive effort and expertise and is a combination of quantitative and qualitative measures.
The EGA was developed to evaluate restored streams for the N.C. Clean Water Management Trust Fund (CWMTF) [28]. The EGA was designed as a rapid assessment that includes semi-quantitative and quantitative sampling combined with qualitative visual assessments for morphology, stream structures, vegetation, and macroinvertebrates. The EGA assessment requires a team with field expertise in aquatic macroinvertebrate taxonomy, macroinvertebrate sampling procedures, vegetation identification and assessment, fluvial geomorphology, and knowledge of stream restoration practices, including in-stream vane, weir, and riffle structures. Restoration project sites were assessed during a 2- to 4-hour site visit by a team of four to eight people. The assessment includes scoring 55 individual variables for total possible points of 172. Table 1 lists the overall categories assessed, numbers of variables, and the total points. The point values for each variable were designed to facilitate field scoring. Most variables were assessed on a scale of whole numbers ranging from 1 to 4, with 1 = poor, 2 = fair, 3 = good and 4 = excellent. However, number class definitions were tailored to certain specific variables. For example, for assessment of planted trees and shrubs, 1 = dead/missing, 2 = damaged, 3 = stressed/patchy and 4 = healthy. The EGA combines averaging and adding of the subcategories which are then tallied for a total point value.
The second assessment developed is the SPA, which is a rapid visual assessment that is very similar to the three existing methods applied. The SPA was developed based on seven factors that are key elements of stream restoration design: channel bedform, channel pattern, in-stream habitat, sediment transport, streambank condition, streambank vegetation, and floodplain function. Channel bedform and in-stream habitat are further broken into sub-variables (five and seven, respectively) that are individually evaluated. As a result, there are 17 total components that are individually evaluated at each project site. The total possible point value for the SPA is 110 (Table 2) [27]. Unlike the EGA, the SPA is intended to be a rapid systematic method that can be implemented by a single assessor with training and experience in stream morphology and ecology, similar to the other three visual methods applied.
Each SPA and EGA variable was assigned a point range designed to facilitate field evaluation of each specific parameter, similar to the RCE method. In contrast, the SVAP and RBP assign equal weight to all variables assessed. The SPA, RBP and RCE all add individual variable point values to determine a sum total rank while the SVAP averages the point values for all variables assessed at each stream. The purpose of the five rapid stream assessment methods include:
  • EGA: Assessment of four major components of stream restoration
  • SPA: Assess eco-geomorphological performance of restored streams
  • RBP: Describe the overall quality of stream physical habitat
  • RCE: Assess the physical and biological conditions of small streams
  • SVAP: Evaluate the condition of aquatic ecosystems associated with wadeable streams
Comparisons of the five stream assessment methods including which variable categories are assessed by each method are provided in Table 3 and Table 4.

2.2. Site Selection

Sixty-five restored streams throughout North Carolina (Figure 1) were selected for eco-geomorphological condition assessment including macroinvertebrate sampling. The selection of streams assessed was a non-randomized sample based on available project documents and data, funding and physical access. Only restored streams that applied natural channel design restoration practices [29] including modifications to channel and/or floodplain geometry and/or additions of rock and log structures were included [30]. The degree of restoration varied from enhancement (grading of floodplain benches and addition of rock and/or log structures) to complete channel relocation and/or reconfiguration of channel size and shape. Between March of 2011 and May of 2012, all 65 streams were visited and all five stream assessment protocols were applied. The streams are located in a wide range of ecoregions, watershed conditions, bed material size classes, valley type, and restoration approaches. Projects ranged in age from new construction to 15 years old. All sites were visited during March to October.

2.3. Macroinvertebrate Sampling

Aquatic macroinvertebrate samples were collected using methods adapted from the N.C. Division of Water Quality [31]. Samples were collected from at least one location within the restored stream feature. Macroinvertebrates were collected by a kick net sample from a riffle area, a sweep net sample from bank habitats, a leaf pack sample, and visual inspections of stable substrate material. All specimens were identified to the lowest practical taxonomic level (i.e., genus and in some cases species) in the field by an experienced macroinvertebrate biologist and all dominant taxa (two or more organisms) were recorded. Sampling results were used to calculate five macroinvertebrate metrics: number of dominant taxa (dominant taxa), number of dominant EPT taxa (EPT taxa), EPT abundance, % shredders and predators, and number of indicator taxa (indicator taxa).

2.4. Watershed Assessment

Watershed analysis was conducted using ArcGIS Desktop 10.0 software [32] in order to measure six watershed parameters including basin slope, time of concentration (tc), watershed size, runoff curve number (CN), percentage of impervious cover (% impervious), and percentage of developed land (% developed). Drainage boundaries for the downstream end of each restored stream reach were manually delineated, referencing contours, aerial photography, and hydraulic unit boundaries where applicable. Soil data from 31 counties containing the target watersheds were obtained from the Natural Resources Conservation Services [33]. Watersheds were divided by hydraulic soil group (A, B, C, or D) according to soil type. Land use data were obtained from the USGS National Land Cover Dataset [34]. Land cover data were reclassified to represent eight land cover classes: open water, developed, barren, forested, shrubland, herbaceous, cultivated, and wetlands according to the Multi-Resolution Land Characteristics Consortium (MRLC) 2001 Landcover definitions [35]. The landcover data were then combined with the processed soils data to generate a composite runoff Curve Number (CN) for each watershed [36]. The CN is an empirical parameter used in hydrology for predicting direct runoff or infiltration from rainfall excess [37].
The percentage of impervious cover was determined using the 2006 USGS National Land Cover Dataset Percent Developed Imperviousness [34]. A series of polygons that represent percent impervious cover in 10% intervals was produced. Each polygon area was summarized to compute a composite value for the total impervious area of each individual watershed. Manual measurements were also taken in ArcGIS to determine the slope of the drainage basin and to estimate time of concentration (tc) in minutes using the Kirpich Equation [38] for each restored reach. Time of concentration is the time required for water to flow from the most remote point in a watershed to the watershed outlet [39]. While the Kirpich Equation is generally limited to small rural watersheds (≤0.8 km2), it provided a consistent reasonable comparison of watershed size, morphology and the associated flow path.

2.5. Statistical Analyses

2.5.1. Comparing Assessment Methods

Total raw points for the five stream assessments were compared using paired comparison with Pearson’s correlation coefficient. The five macroinvertebrate metrics were then regressed on the total raw point values for each of the five stream assessments using linear regressions. Not all component variables were included for the EGA, RCE and the SVAP methods. Because some streams had very few structures (cross-vanes, rootwads, etc.) or a limited number of structure types, only two structure variables (rather than 7) including a single overall average condition score and a single average of the four key function scores were included in the EGA. The macroinvertebrate scoring components, totaling 24 possible points, were also removed from the EGA score because these point values are directly based on the metric values obtained from macroinvertebrate sampling. Similarly, the macroinvertebrate variable for the RCE and SVAP were also removed since these parameter scores were also based directly on the macroinvertebrate sampling. Manure presence, embeddedness and salinity variables were removed from the SVAP as these variables were not applicable at many of the streams. Eliminating variables from the EGA, RCE and SVAP allowed for consistent and thus comparable score tallies for all 65 streams assessed. A visual correlation diagram displaying the correlation coefficients, the results of significance from the comparison tests and bivariate scatterplots with least squares fitted lines was prepared to graphically show the results. EPT taxa were also included in the correlation visualization diagram with the five stream assessment methods in order to evaluate correlation and significance between EPT and the assessment methods.

2.5.2. Improving Prediction of EPT Taxa Using Ordination and Regression Tools

PCR was applied to improve predictions of macroinvertebrate metrics as it is designed as a prediction tool for high-dimensional correlated data [40]. PCR was conducted first on the individual variable scores for each of the five assessment methods. The first step for the PCR analysis was to conduct PCA on the matrix of individual variables. The assessments all include individual scoring of multiple variables ranging from as low as 11 variables for SVAP to 44 variables for the EGA. Many of the individual variables lack independence, thus they exhibit collinearity. For example, streambank stability in most cases is strongly influenced by both floodplain access and streambank vegetation. Bedform relates to channel pattern, e.g., pools usually form in the outside bends of meandering streams [41]. PCR was also conducted on a matrix that included assessment variables for each method combined with six watershed variables, and a final PCR analysis was completed for a matrix of the six watershed variables alone.
In all three PCR analysis scenarios, PCA was implemented on the scaled and centered full matrix of individual variables (PRCOMP in R) [42]. Enough principal components (PCs) were retained to explain at least 75% of the variance. Each of the five macroinvertebrate metric values were then regressed on the resulting PC scores using multiple linear regressions. Residual plots were checked for normality and constant variance. Coefficients of determination were obtained for all PCR analyses and were compared among scenarios and to the regression analyses of total raw stream assessment points.

2.5.3. Determining the Influence of Watershed

To evaluate the influence of watershed condition on predicting macroinvertebrate community metrics, watershed variables were compared directly to macroinvetebrate metrics and were combined with the individual stream assessment variables using PCR for predicting the metrics. Each of five macroinvertebrate metrics were compared to the six watershed metrics obtained from GIS analysis (basin slope, tc, watershed size, CN, % impervious, % developed) using multiple linear regression. All macroinvertebrate metrics were graphically compared to the six watershed variables individually to explore potential correlations. In addition, a biplot of the first two watershed PCs was prepared to visualize the variability among watershed conditions for the 65 streams assessed and to identify redundancy in watershed variables. A biplot is a two-dimensional graph that allows for visualization of high-dimensional data. The PC1 and PC2 scores for each stream are displayed as points and watershed variables as vectors. If the angle between two variable vectors is small, they are strongly associated relative to PC1 and PC2. The cosine of the angle between them approximates their correlation [43].

2.5.4. Determining the Best Model to Predict EPT Taxa

Akaike’s Information Criterion (AIC) was used to compare the goodness of fit for three linear models using the stream assessments and watershed variables to predict the total number of dominant EPT taxa, including 1) total raw points, 2) PCA of individual variables, and 3) PCA of individual variables combined with watershed factors. Further, Akaike’s Information Criterion (AIC) was used to compare the goodness of fit for each of these three linear models for predicting the total number of dominant EPT taxa. AIC is a “goodness-of-fit” measure that considers the value of adding variables to a model [44]. AIC can be used for any regression approach and is designed to prevent overly complex models where numerous predictors are added to mathematically improve a statistical model (e.g., increase in R2), without contributing useful information. AIC penalizes the model based on the addition of predictors in order to minimize unnecessary additional variables. AIC scores for each of the three models were generated for all five stream assessment methods. To evaluate predictive performance of each model, cross-validation using a leave-one-out method was also performed. Each model was iteratively formulated 65 times by removing one single observation at a time from the data set. A predicted score for the missing observation and the associated prediction error were then calculated. The sum of the prediction errors equates to the overall prediction error or cross-validation score [45].

2.5.5. Creating Stream Assessment Indices

Using PCA creates new predictor variables (PC scores) that change emphasis for each assessment component variable to eliminate collinearity between these predictors or explanatory variables, while maximizing their variability in values. As such, the PC scores should better predict macroinvertebrate metrics. However, using the multiple PC scores for each stream (in order to explain 75% or more of the variability) makes comparisons among streams difficult. Therefore, a single-value index based on PCR is desirable for facilitating its application. As such, indices that are designed to modify the existing stream assessment methods so that they better predict macroinvertebrate metrics were created. The indices are based on macroinvertebrate counts as they are useful proxies for stream health. For example purposes, a re-weighted index was developed for the RBP method by using the results of PCR with EPT taxa. The steps for creating the index included:
  • Perform PCA on the centered and scaled matrix of individual variables for the stream assessment method. Retain enough PCs to explain 75% of the variability.
  • Calculate PC scores for all streams for each retained PC.
  • Regress EPT taxa on the PC scores to obtain regression coefficients.
  • Obtain scaled weights for each variable by multiplying the matrix of PCA variable loadings (i.e., a matrix whose columns contain the eigenvectors) by the regression coefficients.
  • Calculate un-scaled weights or multipliers by dividing the scaled weights by the standard deviation for each variable.
  • Calculate new single-value index scores for each stream by multiplying the un-scaled weight by the original raw variable point values (as scored in the field) for each stream. The re-weighted point values for each variable are then summed to compute the single-value index score.
The scaled weights from step 4 provide insight into the relative importance of each variable for correlation to EPT taxa, while the un-scaled weights from step 5 are multipliers that can be used with the original data as it was collected from the field to calculate new "relative" ranks or index scores for each stream. While this effort focuses on macroinvertebrates and EPT taxa in particular, the predictive approach outlined could be applied to any proxy of interest. Using the results of the PCR statistical analysis that included watershed factors, another set of re-weighted indices were developed for the RBP stream assessment method.

3. Results

3.1. Comparing Assessment Methods

Comparisons of total raw points for each of the five stream assessments for the 65 restored streams using paired comparisons with Pearson’s correlation coefficient (Figure 2) indicated that all methods were significant and positively correlated (r = 0.57 to 0.76; p < 0.0001) to each other. The most significant correlations were for the EGA to SPA (r = 0.76) and the EGA to RBP (r = 0.71).
When the five macroinvertebrate metrics were regressed on the total points of all five assessment methods, many of the macroinvertebrate metrics were significantly related to the assessment methods (Table 5) as well. However, low coefficients of determination (ranging from 0.07 to 0.42) revealed substantial variability in the macroinvertebrate metric data not explained by the total raw points for each stream assessment method (Table 6). Dominant taxa, EPT taxa, EPT abundance, and indicator taxa were all very significantly related (p < 0.001) to the EGA and the RBP. In contrast, SPA was the only significant predictor of % shredders and predators (p < 0.05). Overall, the SPA and RCE were less significant predictors of the macroinvertebrate metrics among the five assessment methods. The SVAP raw score was not significant for any of the macroinvertebrate metrics. EPT taxa were then compared with the total raw point values for all five stream assessment methods using a visual correlation diagram (Figure 2). This comparison indicates some correlation between all five assessment methods and with EPT taxa (except for the SVAP). Correlation is strongest for the RBP (r = 0.61; p < 0.0001).

3.2. Improving Prediction of Macroinvertebrates Using Principal Component Regression

PCA analysis on the matrix of individual variables for all five stream assessment methods was conducted. PCR was then performed by regressing the five macroinvertebrate metrics on the resulting PCs (explaining a minimum of 75% of the variability). The regression analyses revealed that the PCs obtained from all five habitat methods were significant predictors for four of the five macroinvertebrate metrics, including dominant taxa, EPT taxa, EPT abundance, and indicator taxa. In contrast, % shredders and predators were only significantly related to the EGA and RBP (p = 0.049 and p = 0.018, respectively) despite the re-weighting of variables through PCA. In addition, substantial improvements in the coefficients of determination were observed when each of the macroinvertebrate metrics were regressed on PC scores as the explanatory variables as compared to the total raw points (Table 6). Improvements in prediction were most significant for the EGA, SPA, SVAP, and RCE compared to all taxa metrics except for % shredders and predators, producing R2 values in the range of 0.32 to 0.68. In comparison, the increases in R2 values were less significant for the RBP.

3.3. Determining the Influence of Watershed Condition

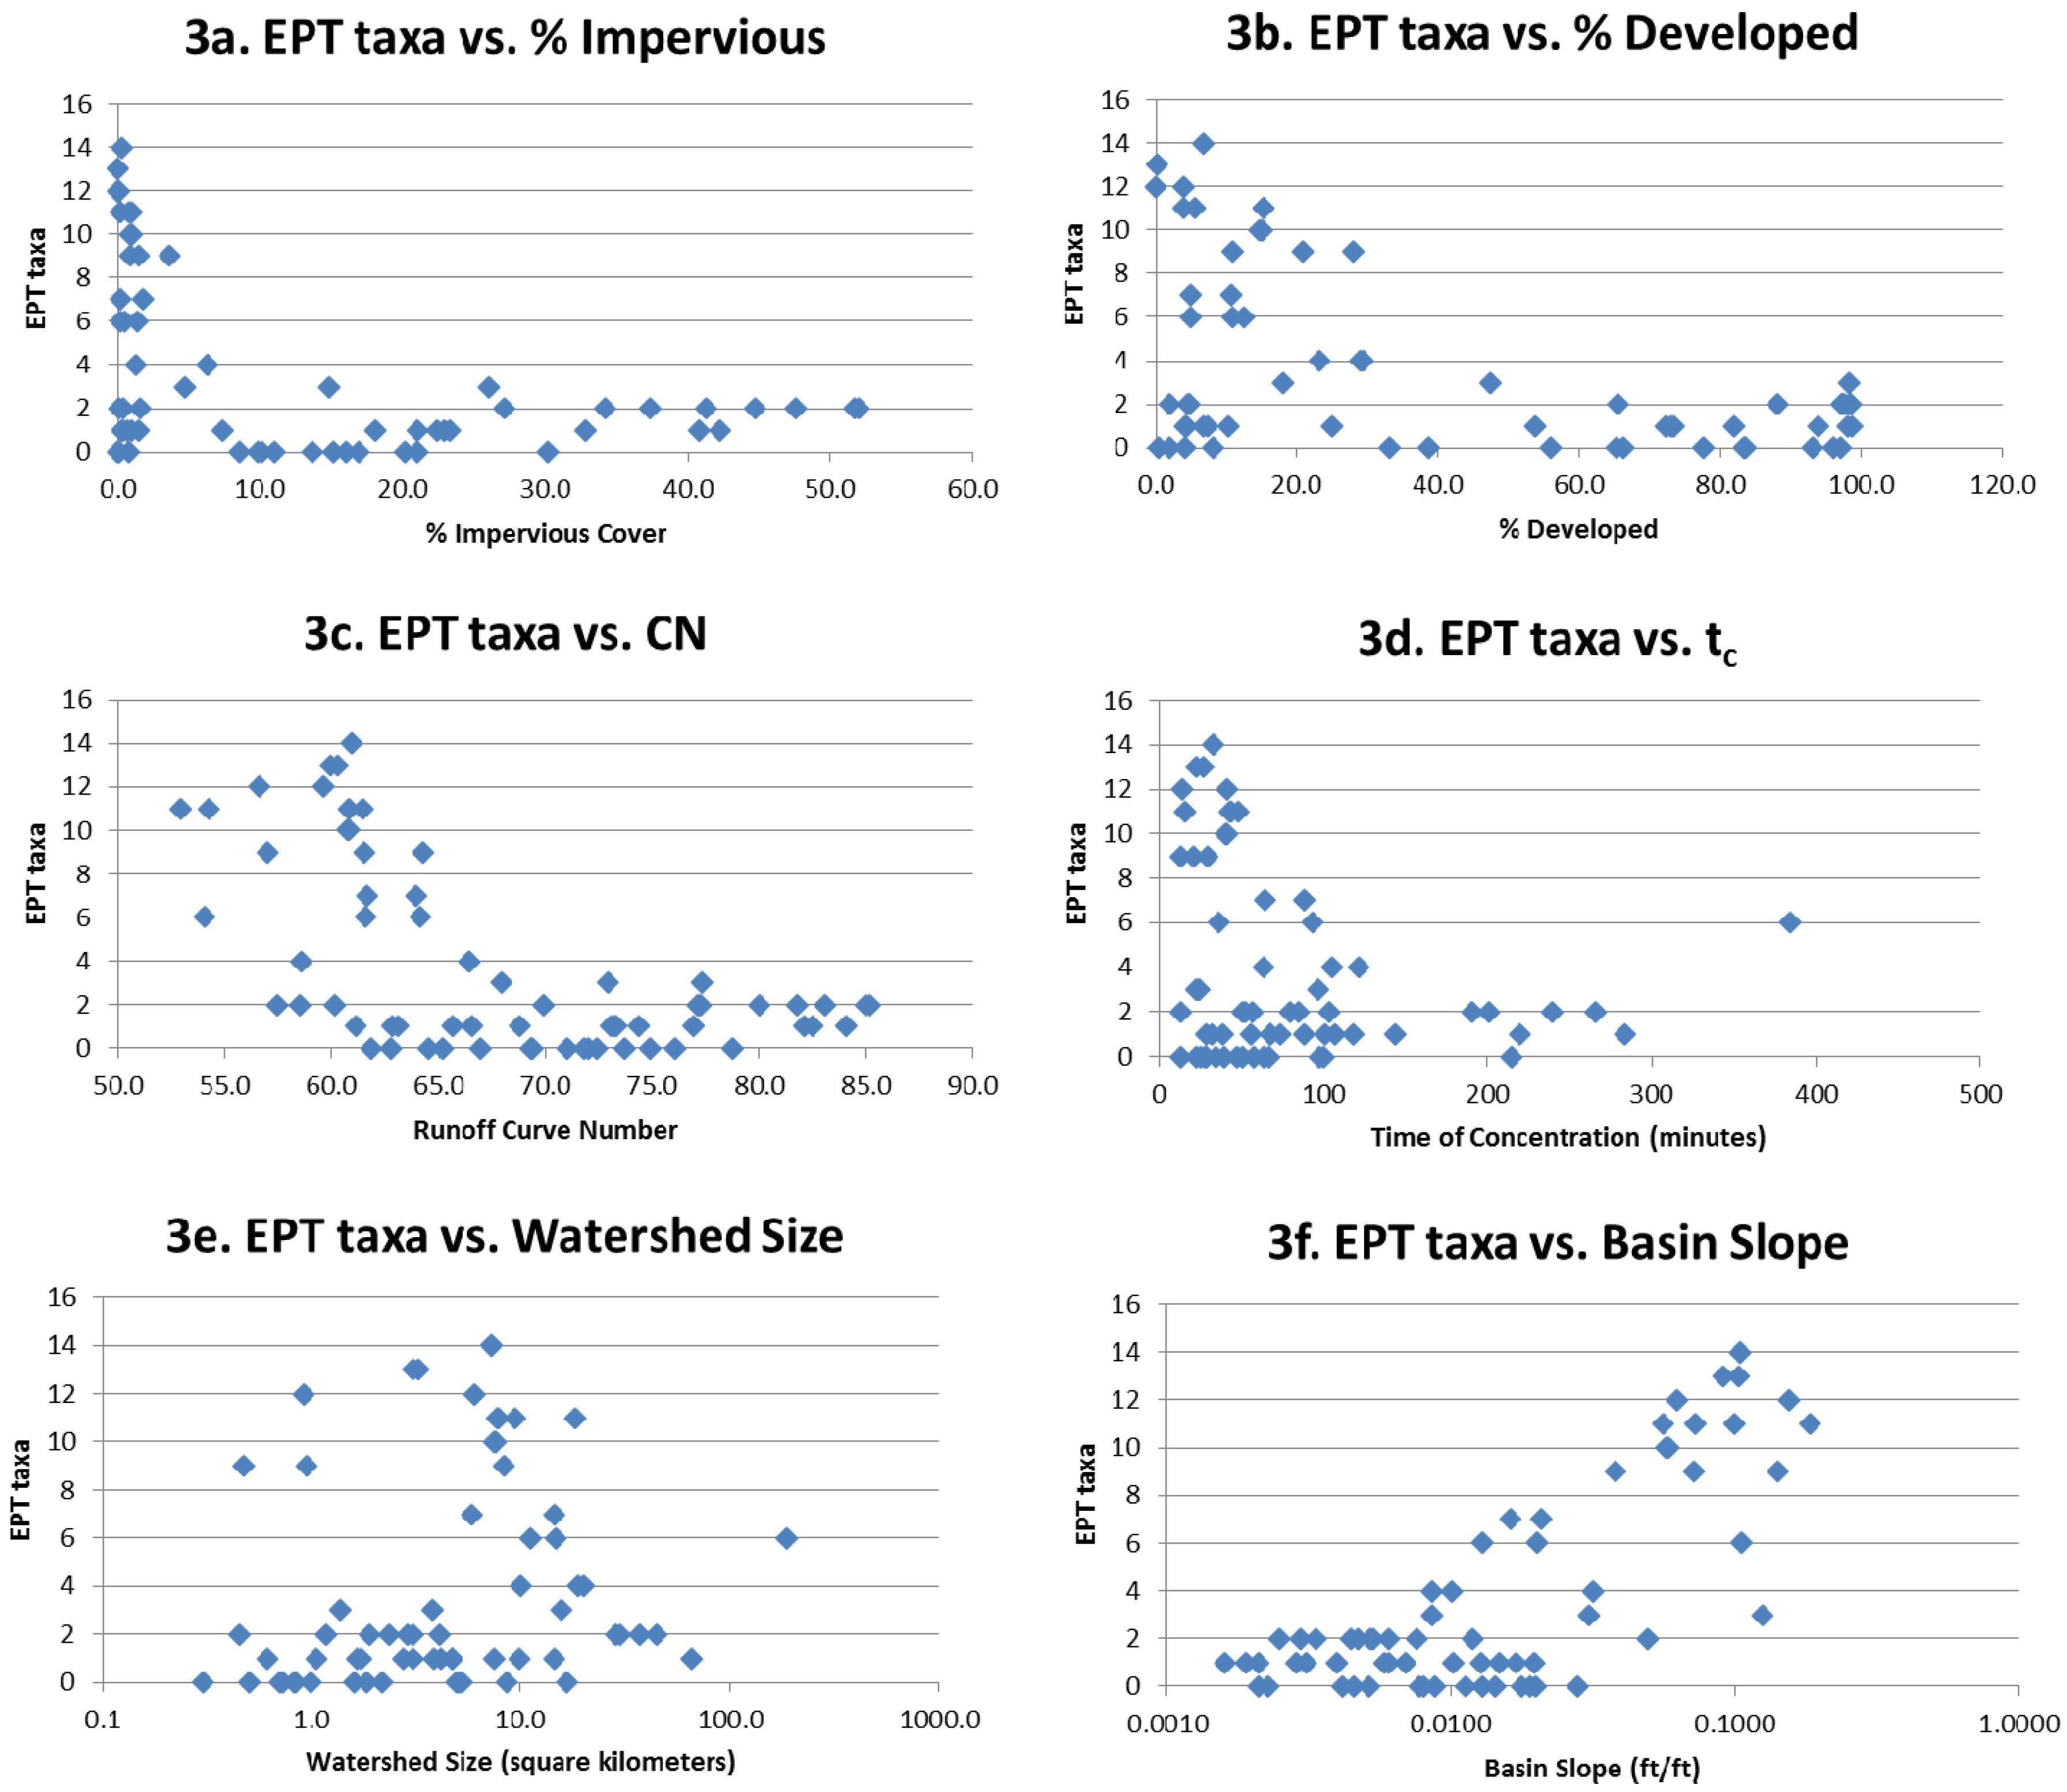
Multiple linear regression was used to determine relationships between each macroinvertebrate taxa metric and the six watershed variables. Coefficients of determination for each macroinvertebrate metric regressed on the six watershed variables are provided in the bottom two rows of Table 6. EPT taxa exhibited the strongest correlation with watershed variables. Scatterplots of EPT taxa versus each of the six watershed variables are provided in Figure 3. Watershed size and basin slope were log-transformed to better show the range of values for these two variables (see figures 3e and 3f for EPT taxa). Dominant taxa, EPT taxa, EPT abundance, and indicator taxa all exhibited notable decline in macroinvertebrate metric scores in relation to impervious cover exceeding 5% to 10%. Macroinvertebrates showed a significant decline at around 30% developed and at CN values in the range of 65 to 70. Macroinvertebrate metrics did not exhibit a strong linear relationship with watershed size. It should be noted that high EPT abundance was primarily associated with medium sized watersheds of greater than 2.6 to less than 26 square kilometers. A strong positive relationship was revealed for dominant taxa, EPT taxa (Figure 3f), EPT abundance and indicator taxa to basin slope. Similar to the stream assessments, % Shredders and Predators exhibited little to no relationship with watershed variables.
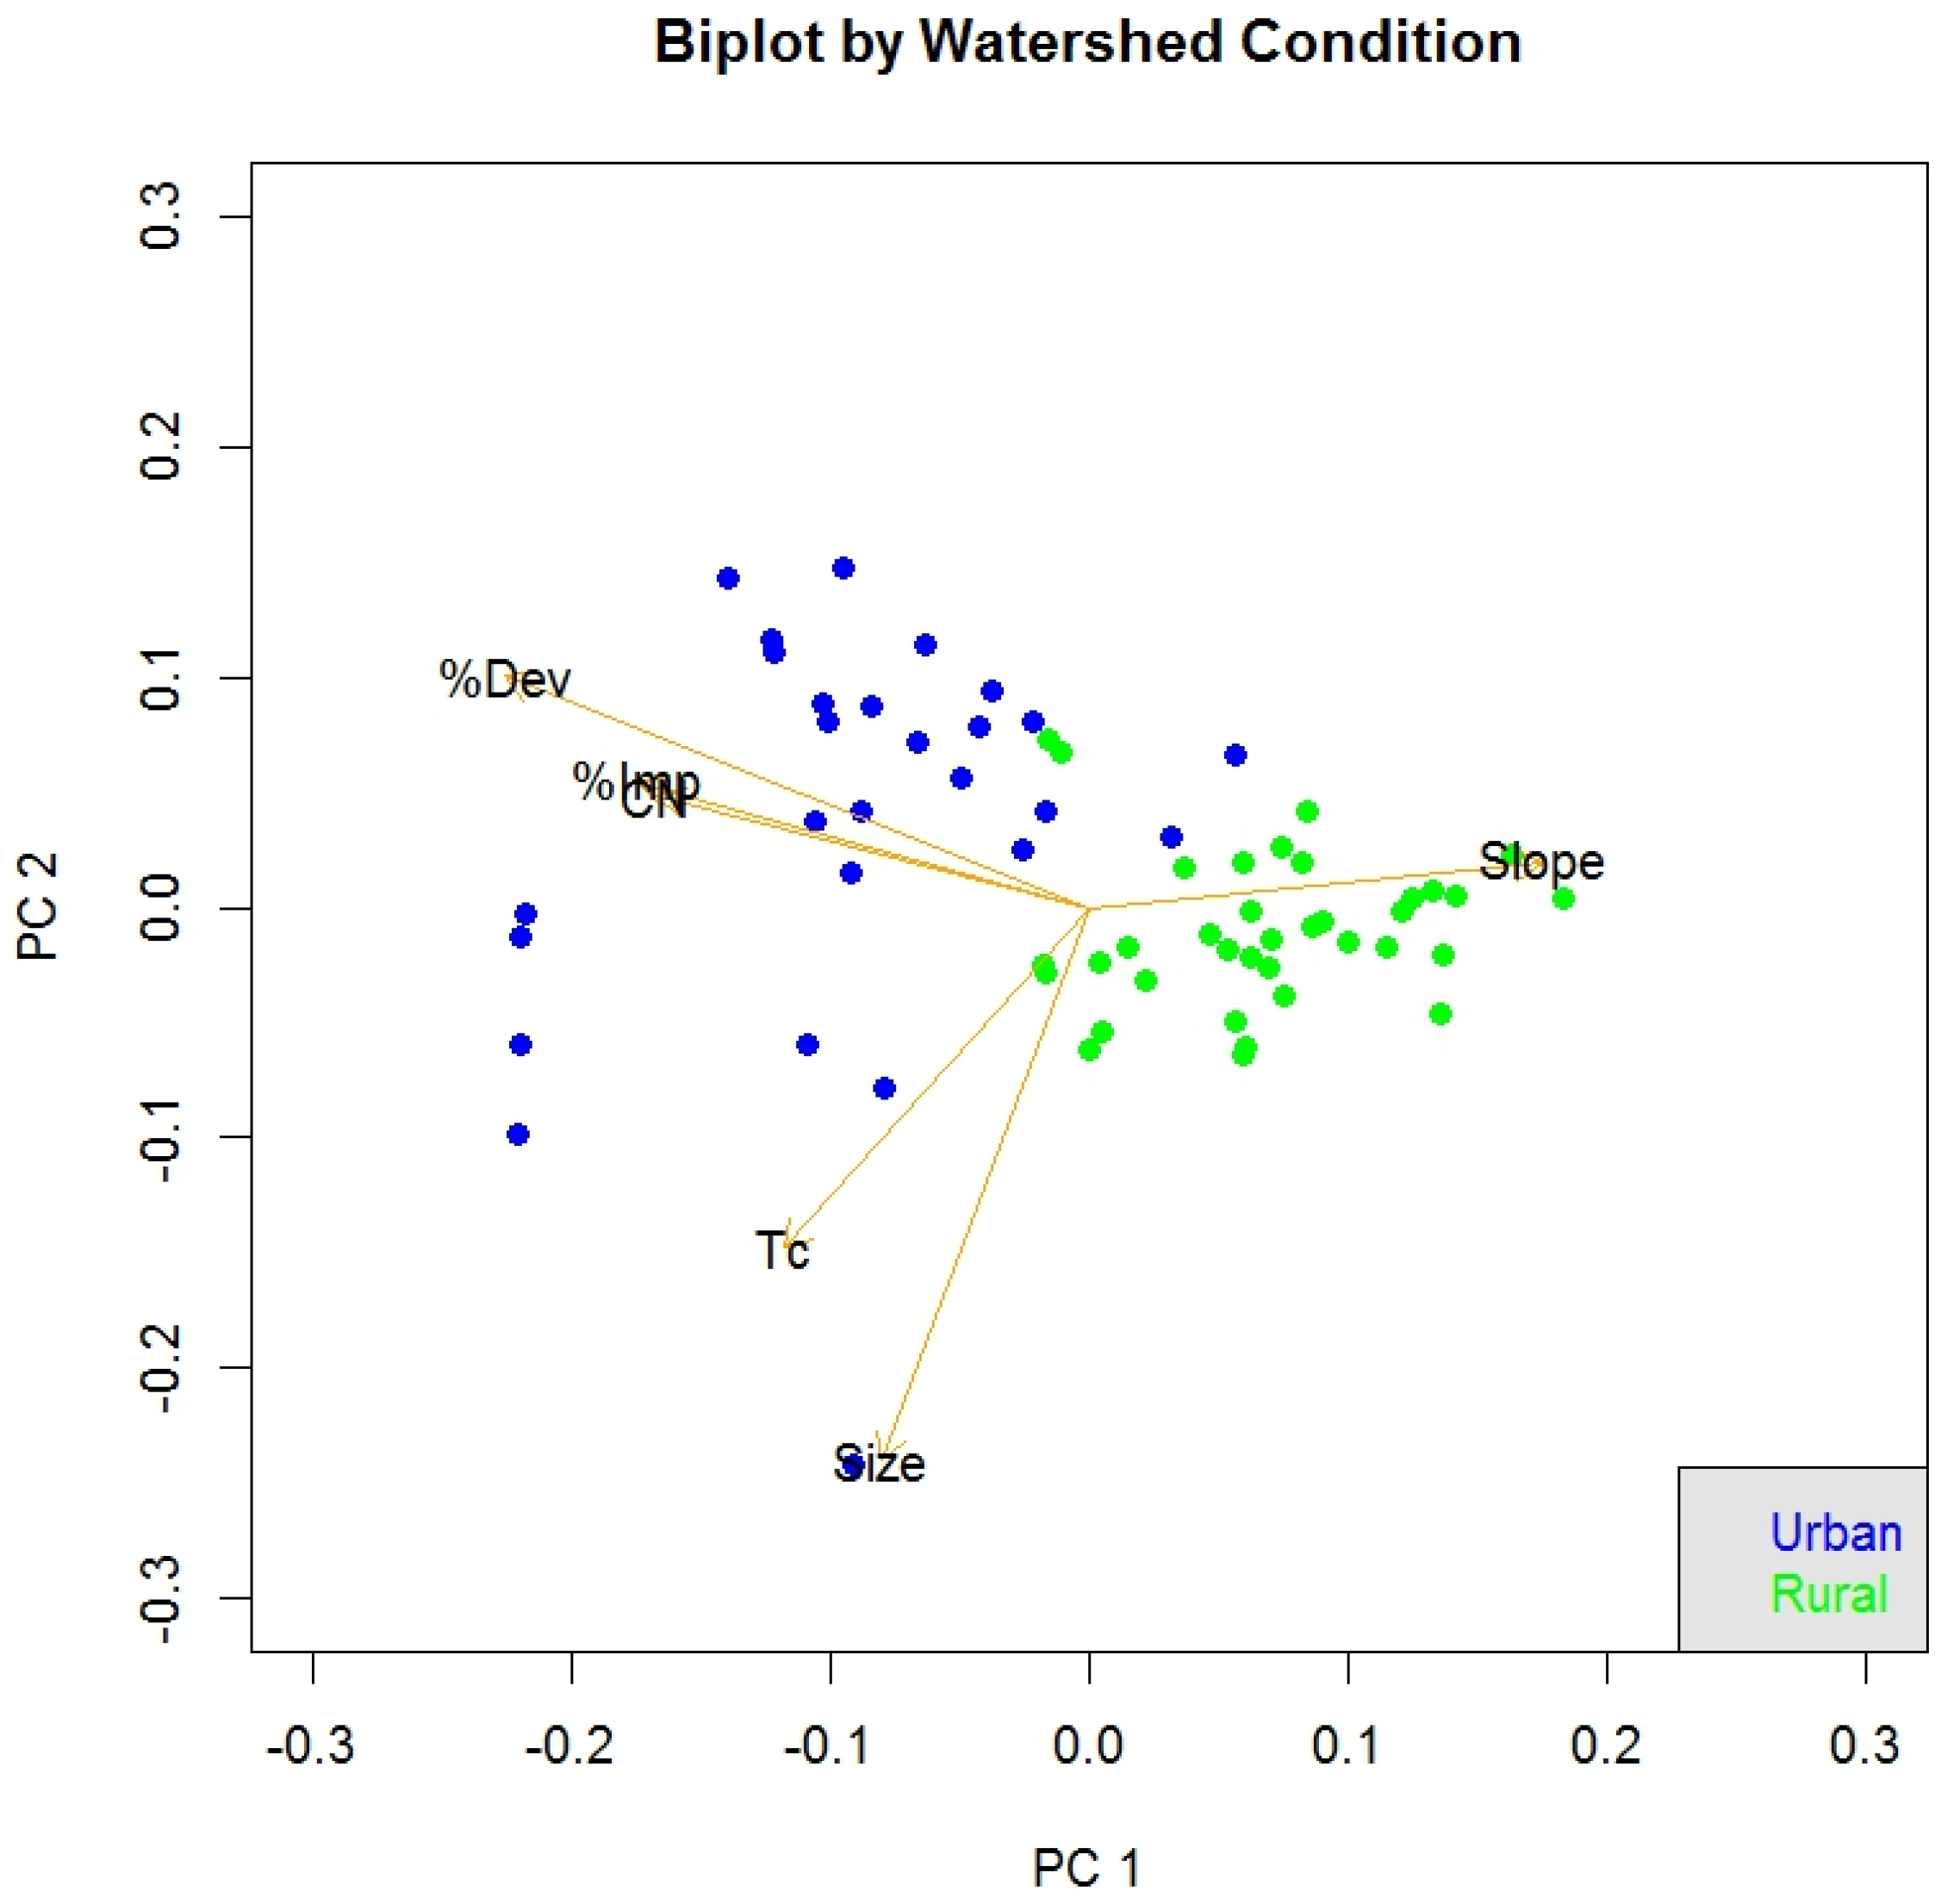
In addition, PCA was applied to the watershed variables. The first two PCs were retained as they explained 78.6% of the variance. A biplot of the individual scores for the first two PCs are shown in Figure 4. The stream symbols are coded by urban compared with rural land use. A strong grouping of urban compared with rural streams is revealed. Redundancy in the % impervious, % developed and CN variables is revealed by the close negative alignment of the vectors for these three variables. Multiple linear regression analyses of the five macroinvertebrate metrics to six watershed factors resulted in higher coefficients of determination than when the metrics were regressed against the watershed PCs (from PCA) (see last two rows in Table 6). This indicates that it is necessary to retain all the watershed variability (not limit to 75%) in order to more effectively predict the macroinvertebrate metrics.
PCA was next reapplied using the stream assessment variables combined with six watershed variables (CN, % impervious, % developed, watershed size, basin slope, and tc). One additional PC was retained for each stream assessment method except the SVAP in order to explain a minimum of 75% of the variance. The multiple linear regression analysis of the five macroinvertebrate metrics on the retained PCs indicated that the addition of watershed variables to the PCA further improved coefficients of determination for most of the stream assessment comparisons (Table 6).
Coefficients of determination from linear regression of five macroinvertebrate metrics compared to each of five stream assessments for 65 streams using three approaches—1) total raw stream assessment score, 2) PCA of individual assessment variables, and 3) PCA of individual assessment and watershed variables combined—are provided in Table 6. All five stream assessment methods realized increased coefficients of determination when watershed factors were added to the PCR analysis and compared to most of the five macroinvertebrate metrics. However, little to no change occurred for all five methods relative to % shredders and predators. The RBP method experienced the greatest increase in coefficients of determination as a result of adding watershed factors. The other four methods, SPA, SVAP, RCE and EGA, experienced a benefit from both PCA and the addition of watershed factors.

3.4. Comparing Models for Goodness of Fit Relative to EPT Taxa

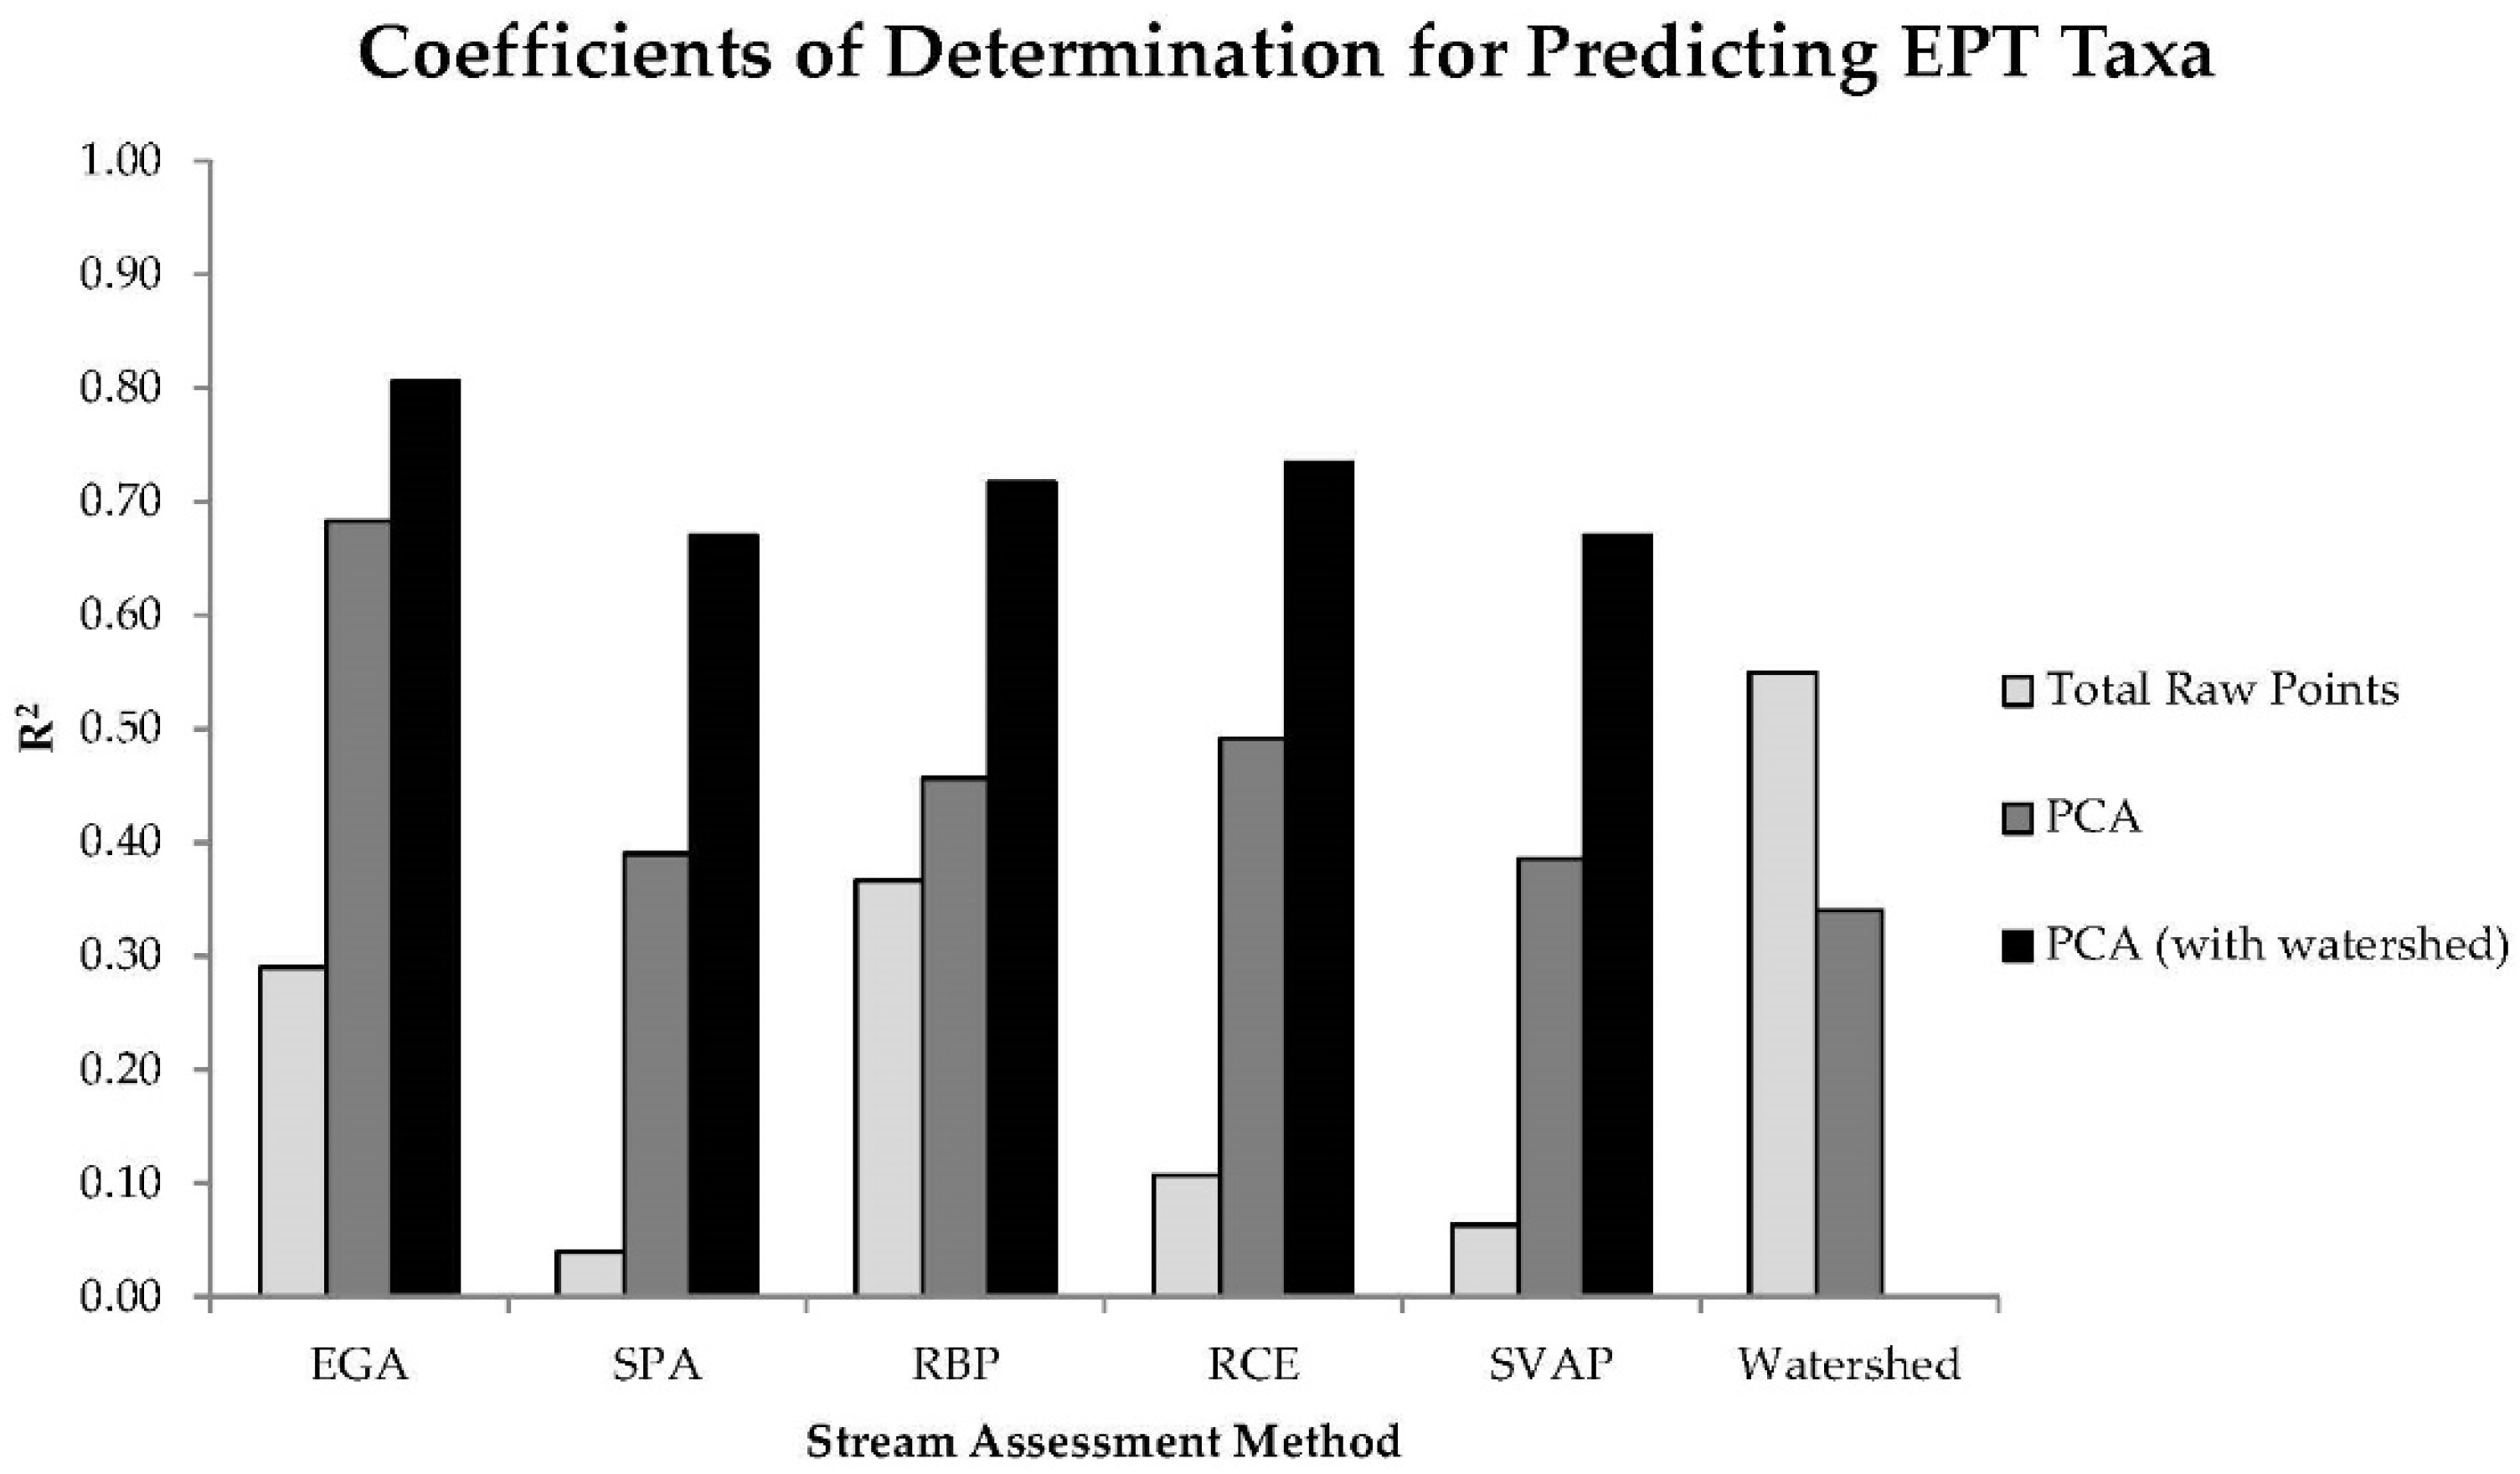
Both applying PCA and including watershed factor substantially improved prediction of EPT taxa over using the total raw point scores for the five habitat assessment methods (Figure 5). AIC scores were generated for three linear models comparing stream assessment scores and watershed variables to EPT taxa, including: (1) total raw points, (2) PCs from PCA of individual variables, (3) PCs from PCA of individual variables combined with watershed parameters, to compare their goodness of fit. AIC was also applied to validate that the added predictors are contributing useful information and not just serving to mathematically improve the statistical model (e.g., increase in R2). Resulting AIC scores for each of three models are provided in Table 7. The AIC scores indicate that the PCA of the individual variables that includes watershed parameters for the five stream assessment methods provides the best fit for EPT taxa (lowest AIC score). Retaining the separate PC scores for the linear regressions, which resulted in a range of 5 to 12 predictors (PCs) depending on the stream assessment method and whether or not watershed factors were included, provide a better fit model that the original total raw points for all methods (lower AIC scores) despite the penalty applied by AIC for the additional predictors. The numbers of PCs retained were based on selecting those that explain at least 75% of the variability of the habitat data. Cross-validation using a leave-one-out method was performed to evaluate predictive performance of each of the regression models. The overall prediction error or cross-validation score is also provided in Table 7. The RBP produced the lowest combined AIC and CV Score (349 and 11) among the five assessment methods for total raw score. However, the multiple linear regression of the six watershed variables produced both lower AIC and CV scores than the raw score for the five assessment methods (311 and 6.9). Despite the more time-consuming nature of the EGA assessment, this method produced the lowest combined AIC and CV scores for the PCR models, the lowest AIC score for the PCR with watershed models and the lowest overall AIC score among all models evaluated (294). The PCA of the RCE method combined with watershed produced the lowest cross-validation score (6.3) and the third lowest AIC score (308).

3.5. Five Stream Assessment Indices

To demonstrate how the stream methods can be reconfigured to incorporate the ordination and regression analysis benefits, a re-weighted index was prepared for the RBP assessment method based on the PCA and PCR to EPT taxa. The scaled and un-scaled weights for the RBP method are provided in Table 8. The scaled weights provide insight into the relative importance of each variable for correlation to EPT taxa, while the un-scaled weights are multipliers that can be used with the original data as it was collected from the field to calculate new "relative" ranks or index scores for each stream. Points for individual variables as determined in the field are multiplied by the un-scaled weight before summing the points to determine the final single value index score for each stream. The RBP was selected for index development demonstration since it is readily available for use from the US EPA and is currently used by many agencies and biological assessment practitioners. The variables are sorted from largest to smallest by coefficient weights. The larger weights are shown in bold to indicate those variables that have the strongest influence on EPT taxa. In the case of RBP, bedform, substrate and flow variables most strongly influence correlation with EPT taxa.
A second re-weighted index was prepared for the RBP assessment methods based on PCR to EPT taxa with the addition of watershed factors for the PCA analysis. The scaled and un-scaled weights for the RBP method are provided below in Table 9. The variables are sorted from largest to smallest by coefficient weights. The larger weights are shown in bold to indicate those variables that have the strongest increase in the prediction of EPT taxa. In the case of RBP with watershed factors included, bedform, basin slope, watershed size, and flow variables have the strongest positive prediction of EPT taxa. In addition, CN, % impervious and % developed have a strong negative prediction of EPT taxa. Watershed condition (both topography and land use condition) and streambed substrate and habitat were the strongest predictors of EPT taxa for all five of the re-weighted habitat assessment indices.

4. Discussion

Five stream assessment methods, the EGA, RCE, SPA, RBP and SVAP, were applied to 65 restored streams located throughout North Carolina. Paired comparison of the total raw points for the five stream assessments revealed that all methods were significant and positively correlated (r = 0.57 to 0.76) to each other. These results are similar to those found by others when comparing stream assessment method points at non-restored streams [12,16,17,19]. In addition, macroinvertebrates were also collected from all 65 restored streams. Linear regression of macroinvertebrate metrics to the five stream assessment methods resulted in some significant relationships; however, unexplained variance in data was high, as demonstrated by low coefficients of determination. Weak correlation results are similar to other studies that compared rapid assessment results to fish and macroinvertebrate community or biotic integrity metrics [12,16,19].
Recognizing the inextricable links between watershed condition and biotic condition of streams, watershed assessment was conducted on all 65 streams and six metrics were obtained including CN, % impervious, % developed, watershed size, basin slope, and tc. Regression of macroinvertebrate metrics to all six watershed factors resulted in higher coefficients of determination than PCR indicating that all the watershed variability is important to predicting the macroinvertebrate metrics. This supports the findings of Booth [6] that multiple factors are responsible for the decline of macroinvertebrate communities. EPT taxa exhibited the strongest correlation with watershed variables. Dominant taxa, EPT taxa, EPT abundance, and indicator taxa all exhibited notable decline in macroinvertebrate metric scores in relation to impervious cover exceeding 5% to 10%. The decline is slightly lower than the 7% to 14% impervious range reported by others [21]. Macroinvertebrates showed a significant decline at around 30% developed and at CN values in the range of 65 to 70.
To address issues of collinearity and subjective importance assigned to assessment variable weights and/or the assumption that all measured variables are equally indicative of stream health, macroinvertebrate metrics were regressed on PCs obtained from PCA of individual assessment variable points. Following dimension reduction and re-weighting of the specific stream assessment variables using PCA and subsequent linear regression of the macroinvertebrate metrics on the resulting PCs, the prediction by the SPA, EGA, SVAP and RCE stream assessments for several of the macroinvertebrate metrics greatly improved. This supports the assertion by the NRCS that equal weighting of the SVAP variables dampened the effect of specific key variables that strongly influenced the biotic condition of the streams evaluated [12]. These results suggest that stream assessment metrics (both quantitative and visual) may prove useful in assessing condition and perhaps functional uplift of stream restoration projects, as long as individual variables are weighted to maximize the prediction of the desired outcomes (e.g., aquatic life).
To incorporate the importance of watershed factors in the prediction of macroinvetebrate metrics, the PCR analyses were modified to include a combined matrix of watershed factors with stream assessment variables. This approach further improved prediction of macroinvertebrate metrics for most of the stream assessments. The RBP benefited more from the addition of watershed factors, while the other four methods, SPA EGA, SVAP, and RCE, significantly benefited from both PCA and watershed factors.
Several of the stream assessment methods (following PCA and addition of watershed variables) were good predictors of dominant taxa, indicator taxa, EPT Taxa and EPT abundance metrics. In contrast, prediction of % shredders and predators was much weaker by all the stream assessments, despite re-weighting of variables and inclusion of watershed condition variables. Therefore, the variables scored by the rapid assessment method are not relevant to all biotic metrics and statistical testing must first occur to determine which biotic metrics of interest are best predicted by the rapid assessment(s) of choice. An evaluation of AIC scores validated that the additional predictors (PCs for individual assessment variables and watershed factors) did contribute useful information for the prediction of EPT taxa and are not simply providing an improvement in correlation. The AIC analyses revealed that the PCR of the EGA method combined with watershed variables was the best fit model for predicting EPT taxa (lowest AIC score), while the RCE method combined with watershed variables produced the lowest cross-validation score. The AIC and CV analyses also showed very good prediction of EPT taxa with the multiple linear regression of the six watershed factors, which retained 100% of the variability of the watershed variables. This outcome reinforces the notion that reach-scale stream restoration efforts alone cannot be expected to mitigate for hydrologic or chemical alterations that are responsible for the loss of sensitive taxa [46], as watershed condition are strong controlling variables for these conditions. This finding also suggest that perhaps macroinvertebrate species composition or biodiversity measures are not appropriate endpoints for restoration ecology efforts in urbanized settings [47].
In addition, a new, re-weighted index was generated for all five stream assessment methods based on PCR predictions for EPT taxa. In the case of RBP, bedform, substrate and flow variables have a strong positive influence on the prediction of EPT taxa while CN, % impervious and % developed have a strong negative prediction of EPT taxa. Watershed condition (both topography and land use condition) and streambed substrate and habitat were the strongest predictors of EPT taxa for all five of the re-weighted habitat assessment indices. Potter et al. [8] also found watershed variables to explain more variability in macroinvertebrate community than riparian variables in North Carolina. Further, Richards and Host [48] found substrate in addition to woody debris to highly correlate with macroinvertebrate richness and composition using ordination statistics. In contrast, Cortes et al. [20] found riparian variables to be the determinant factors for macroinvertebrate assemblages in Portugal using ordination of the River Habitat Survey (RHS) variables. Surprisingly, for the SVAP index, riparian vegetation is a significant negative factor in predicting EPT taxa.
These results indicate that ordination approaches that address collinearity among assessment variables and subjective variable weights can improve prediction of macroinvertebrate communities made with rapid physical and habitat assessments. These results are similar to Wright et al. [49], who applied multiple discriminant analysis (MDA) to predict macroinvertebrate groupings (obtained from ordination) in 268 sites in Great Britain using 28 environmental variables with a 76.1% success rate. In contrast, Goforth and Bain [49] combined a watershed and habitat protocol obtained from map and aerial photo analysis with the RCE in an attempt to predict several biotic metrics. The protocol, known as the Watershed Habitat Evaluation Biotic Integrity Protocol (WHEBIP), includes geology, morphology, season, flow and water chemistry variables. However, investigators had limited success in predicting benthic macroinvertebrate community measures despite adjusting metric weightings of the WHEBIP through an iterative process. However, this approach was likely less successful than Wright et al. [50] and this study as it does not appear that collinearity among the individual variables of the WHEBIP and RCE assessments were addressed.
Unlike many other ecological assessment measures, the indices developed in this study using PCR and watershed factors reflect the range of stream conditions found in North Carolina and are designed to maximize prediction of macroinvertebrate populations in these streams. The resulting indices may serve as a scale for evaluating restoration potential as well as the ecological functional uplift of various management and restoration efforts. However, the indices generated by this effort are preliminary and limited in application due to being developed from restored streams only. Refinement of the indices would require assessment and macroinvertebrate sampling of a full range of stream conditions including high-quality reference and impaired streams in addition to restored streams. In addition, consideration should be given to adding water chemistry, flow and sampling season, as all of these factors have relevance to macroinvertebrate metrics [51,52,53,54]. The SPA was applied to 156 restored and un-restored streams between 2006 and 2012 [27]. The un-restored streams exhibited a range of conditions from degraded to high quality reference streams. That effort was useful in identifying factors where restoration efforts have achieved reference quality geomorphic condition (e.g., streambank vegetation and condition, pattern, floodplain function and sediment transport) and in many cases where restoration projects have not met the mark for establishing high quality bedform and habitat.
This study documents how rapid stream assessments may be tailored to a specific region and aquatic community (e.g., fish, mussels, benthic macroinvertebrates, or a multi-metric index of biotic integrity) by creating an index using PCR. Because of the ease in implementing rapid assessments, many more streams can be assessed with more frequent visits to streams for assessment. The statistical procedures outlined by this project can improve the value of these assessments by improving their reliability for predicting the biotic community that is considered a good indicator of stream health. Specifically, developing the index requires a one-time effort to collect data through biological sampling, applying a rapid assessment method of choice, and conducting a GIS-based watershed analysis on numerous streams in a region that exhibit a wide range of physical and biological conditions. The resulting stream condition index can serve as a scale for determining restoration need and potential uplift, and for gauging project performance over time. Further, the inclusion of watershed condition in the index development will help project designers and managers establish realistic biological uplift goals for streams in developed watersheds, which cannot reach the same conditions as those in un-developed watersheds. The ordination approach outlined by this effort is similar to procedures followed since the 1970’s to develop regional water quality and biotic indices [55] and for identifying factors that influence biotic communities [56].

Supplementary Materials

The following are available online at www.mdpi.com/2073-4441/8/4/143/s1; Table S1: Principal component scores for six watershed variables for 65 streams, Table S2: Eco-geomorphological Assessment Method (EGA) index scaled and un-scaled (multiplier) weights, Table S3: Stream Performance Assessment (SPA) index scaled and un-scaled (multiplier) weights, Table S4: Riparian Channel and Environmental Inventory (RCE) index scaled and un-scaled (multiplier) weights, Table S5: Stream Visual Assessment Protocol (SVAP) index scaled and un-scaled (multiplier) weights, Table S6: Eco-geomorphological Assessment Method (EGA) index (including watershed factors) scaled and un-scaled (multiplier) weights, Table S7: Stream Performance Assessment (SPA) index (including watershed factors) scaled and un-scaled (multiplier) weights, Table S8: Riparian Channel and Environmental Inventory (RCE) index (including watershed factors) scaled and un-scaled (multiplier) weights, Table S9: Stream Visual Assessment Protocol (SVAP) index (including watershed factors) scaled and un-scaled (multiplier) weights.

Acknowledgments

Funding for this research was provided in part by the NC Clean Water Management Trust Fund (CWMTF). Funding has not been provided to cover the costs to publish in open access. Thank you to Karen R. Hall and Michael B. Shaffer for vegetation assessment data collection.

Author Contributions

Barbara Doll designed the study, organized field data collection, prepared most of the statistical code, analyzed the results and wrote the manuscript as part of her dissertation research. Greg Jennings assisted with the study design, field data collection and data interpretation. Jean Spooner assisted with the study design, statistical analyses and interpretation of results. Dave Penrose developed the EGA assessment protocol, conducted the benthic surveys, and assisted with field work. Joseph Usset assisted with the statistical analyses and prepared some statistical code. James Blackwell conducted the GIS-based watershed analysis. Mark Fernandez performed data entry, database management and assisted with field data collection.

Conflicts of Interest

The authors declare no conflict of interest.

Abbreviations

CN
Soil Conservation Service runoff curve number
EGA
NCSU’s Eco-Geomorphological Assessment
EPT
Ephemeroptera (mayflies), Plecoptera (stoneflies) and Trichoptera (caddisflies)
GIS
Geographical Information Systems
NCD
Natural Channel Design
PC
Principal Component
PCA
Principal Component Analysis
RBP
USEPA’s Rapid Bioassessment Protocol
RCE
Riparian Channel and Environmental Inventory
SPA
NCSU’s Stream Performance Assessment
SVAP
USDA’s Stream Visual Assessment Protocol

References

  1. Bernhardt, E.S.; Palmer, M.; Allan, J.; Alexander, G.; Barnas, K.; Brooks, S.; Carr, J.; Clayton, S.; Dahm, C.; Follstad-Shah, J.; et al. Synthesizing U.S. River restoration efforts. Science 2005, 308, 636–637. [Google Scholar] [CrossRef] [PubMed]
  2. Sparks, J.; Hagman, T.; Messer, D.; Townsend, J. Eastern kentucky stream assessment protocol: Utility in making mitigation decisions. Aquat. Resour. News Regulat. Newsl. 2003, 2, 4–10. [Google Scholar]
  3. US Environmental Protection Agency (USEPA). Ecological Restoration: A Tool to Manage Stream Quality; USEPA: Washington, DC, USA, 1995; p. 168.
  4. National Research Council (US). Restoration of Aquatic Ecosystems: Science, Technology, and Public Policy (1992); Haworth Press: Binghamton, NY, USA, 1992. [Google Scholar]
  5. US Environmental Protection Agency (USEPA). Principles for the Ecological Restoration of Aquatic Resources; 4501F; USEPA: Washington, DC, USA, 2000; p. 4.
  6. Booth, D.B.; Karr, J.R.; Schauman, S.; Konrad, C.P.; Morley, S.A.; Larson, M.G.; Burges, S.J. Reviving urban streams: Land use, hydrology, biology, and human behavior. J. Am. Water Resour. Assoc. 2004, 40, 1351–1364. [Google Scholar] [CrossRef]
  7. Deacon, J.R.; Soule, S.A.; Smith, T.E. Effects of Urbanization on Stream Quality at Selected Sites in the Seacoast Region in New Hampshire, 2001-03; US Department of the Interior, US Geological Survey: Menlo Park, CA, USA, 2005.
  8. Potter, K.M.; Cubbage, F.W.; Schaberg, R.H. Multiple-scale landscape predictors of benthic macroinvertebrate community structure in north carolina. Landsc. Urb. Plan. 2005, 71, 77–90. [Google Scholar] [CrossRef]
  9. Resh, V.H.; Norris, R.H.; Barbour, M.T. Design and implementation of rapid assessment approaches for water resource monitoring using benthic macroinvertebrates. Aust. J. Ecol. 1995, 20, 108–121. [Google Scholar] [CrossRef]
  10. Barbour, M.T.; Gerritsen, J.; Snyder, B.; Stribling, J. Rapid Bioassessment Protocols for Use in Streams and Wadeable rivers; US Environmental Protection Agency (USEPA): Washington, DC, USA, 1999.
  11. Bjorkland, R.; Pringle, C.M.; Newton, B. A stream visual assessment protocol (SVAP) for riparian landowners. Environ. Monit. Assess. 2001, 68, 99–125. [Google Scholar] [CrossRef] [PubMed]
  12. The United States Department of Agriculture (USDA). Stream Visual Assessment Protocol; NRC Environmental Services Inc.: Alameda, CA, USA, 1998; p. 36.
  13. Peterson, B.J.; Wollheim, W.M.; Mulholland, P.J.; Webster, J.R.; Meyer, J.L.; Tank, J.L.; Martí, E.; Bowden, W.B.; Valett, H.M.; Hershey, A.E.; et al. Control of nitrogen export from watersheds by headwater streams. Science 2001, 292, 86–90. [Google Scholar] [CrossRef] [PubMed]
  14. Rankin, E.T.; Ohio, E. The Qualitative Habitat Evaluation Index [QHEI]: Rationale, Methods, and Application; State of Ohio Environmental Protection Agency (Ohio EPA): Columbus, OH, USA, 1989.
  15. Prichard, D.; Bridges, C.; Krapf, R.; Leonard, S.; Hagenbuck, W. Riparian Area Management: Process for Assessing Proper Functioning Condition for Lentic Riparian-Wetland Areas; US Department of the Interior, Technical Reference: Denver, CO, USA, 1994.
  16. Stauffer, J.C.; Goldstein, R.M. Comparison of three qualitative habitat indices and their applicability to prairie streams. North Am. J. Fish. Manag. 1997, 17, 348–361. [Google Scholar] [CrossRef]
  17. Ward, T.; Tate, K.; Atwill, E.; Lile, D.; Lancaster, D.; McDougald, N.; Barry, S.; Ingram, R.; George, H.; Jensen, W. A comparison of three visual assessments for riparian and stream health. J. Soil Water Conserv. 2003, 58, 83–88. [Google Scholar]
  18. Somerville, D.; Pruitt, B. Physical Stream Assessment: A Review of Selected Protocols for Use in the Clean Water Act Section 404 Program; Prepared for the US Environmental Protection Agency, Office of Wetlands, Oceans, and Watersheds, Wetlands Division (Order No. 3W-0503-NATX): Washington, DC, USA, 2004.
  19. Hughes, R.M.; Herlihy, A.T.; Kaufmann, P.R. An evaluation of qualitative indexes of physical habitat applied to agricultural streams in ten us states. J. Am. Water Resour. Assoc. 2010, 46, 792–806. [Google Scholar] [CrossRef]
  20. Cortes, R.M.V.; Varandas, S.; Hughes, S.J.; Ferreira, M.T. Combining habitat and biological characterization: Ecological validation of the river habitat survey. Limnetica 2008, 27, 39–55. [Google Scholar]
  21. Schueler, T.R. The importance of imperviousness. Watershed Prot. Technique. 1994, 1, 100–111. [Google Scholar]
  22. Hammer, T.R. Impacts of Urbanization on Peak Streamflow; Regional Science Research Institute: Philadelphia, PA, USA, 1973. [Google Scholar]
  23. Hammer, T.R. Stream Channel Enlargement Due to Urbanization; Regional Science Research Institute: Philadelphia, PA, USA, 1972. [Google Scholar]
  24. Doll, B.A.; Wise-Frederick, D.E.; Buckner, C.M.; Wilkerson, S.D.; Harman, W.A.; Smith, R.E.; Spooner, J. Hydraulic geometry relationships for urban streams throughout the piedmont of north carolina. J. Am. Water Resour. As. 2002, 38, 641–651. [Google Scholar] [CrossRef]
  25. Purcell, A.H.; Friedrich, C.; Resh, V.H. An assessment of a small urban stream restoration project in northern california. Restor. Ecol. 2002, 10, 685–694. [Google Scholar] [CrossRef]
  26. Feminella, J.W. Comparison of benthic macroinvertebrate assemblages in small streams along a gradient of flow permanence. J. N. Am. Benthol. Soc. 1996, 15, 651–669. [Google Scholar] [CrossRef]
  27. Doll, B.A.; Jennings, G.D.; Spooner, J.; Penrose, D.L.; Usset, J.L. Evaluating the eco-geomorphological condition of restored streams using visual assessment and macroinvertebrate metrics. J. Am. Water Resour. As. 2015, 51, 68–83. [Google Scholar] [CrossRef]
  28. NCSU Water Quality Group. Stream Restoration Evaluation Assessment Form; Prepared for the North Carolina Clean Water Management Trust Fund, NC State University: Raleigh, NC, USA, 2006. [Google Scholar]
  29. Hey, R.D. Fluvial geomorphological methodology for natural stable channel design. J. Am. Water Resour. Assoc. 2006, 42, 357–374. [Google Scholar] [CrossRef]
  30. US Department of Agriculture (USDA). Rosgen geomorphic channel design. In Restoration DesignNational Engineering Handbook; USDA: Washington, DC, USA, 2007; Volume 654, p. 76. [Google Scholar]
  31. NC Department of Environment & Natural Resources (NCDENR). Standard Operating Procedures for Biological Monitoring; Division of Water Quality: Raleigh, NC, USA, 2006; p. 52.
  32. Arcgis Desktop; Release 10; Environmental Systems Research Institute (ESRI): Redlands, CA, USA, 2011.
  33. Natural Resources Conservation Service (NRCS). U.S. Soil Survey Geographic (SSURGO) Database for North Carolina and Virginia; NRCS: Washington, DC, USA, 2012.
  34. Fry, J.A.; Xian, G.; Jin, S.; Dewitz, J.A.; Homer, C.G.; Limin, Y.; Barnes, C.A.; Herold, N.D.; Wickham, J.D. Completion of the 2006 national land cover database for the conterminous United States. Photogramm. Eng. Rem. S. 2011, 77, 858–864. [Google Scholar]
  35. US Environmental Protection Agency (USEPA). National Land Cover Database (NLCD) 2001 Land Cover Class Definitions, Multi-Resolution Land Characteristics Consortium (MRLC); USEPA: Washington, DC, USA, 2007.
  36. Natural Resources Conservation Service (NRCS). Hydrologic Soil-Cover Complexes. In National Engineering Handbook: Part 630—Hydrology; USDA Soil Conservation Service: Washington, DC, USA, 2004; p. 20. [Google Scholar]
  37. Cronshey, R. Urban Hydrology for Small Watersheds; Technical release 55 (tr55); US Government Printing Office: Washington, DC, USA, 1986.
  38. Bureau of Reclamation. Design of Small Dams; U.S. Government Publishing Office (USGPO): Washington, DC, USA, 1974.
  39. Haan, C.T.; Barfield, B.J.; Hayes, J.C. Design Hydrology and Sedimentology for Small Catchments; Elsevier: Philadelphia, PA, USA, 1994. [Google Scholar]
  40. Massy, W.F. Principal components regression in exploratory statistical research. J. Am. Stat. Assoc. 1965, 60, 234–256. [Google Scholar] [CrossRef]
  41. Leopold, L.B. A View of the River; Harvard University Press: Cambridge, MA, USA, 1994. [Google Scholar]
  42. R; software environment for statistical computing and graphics; R foundation for statistical computing: Vienna, Austria, 2012; ISBN 3-900051-07-0: 2014.
  43. Kroonenberg, P.M. Applied Multiway Data Analysis; John Wiley & Sons: Hoboken, NJ, USA, 2008; Volume 702. [Google Scholar]
  44. Burnham, K.P.; Anderson, D.R. Model Selection and Multimodel Inference: A Practical Information-Theoretic Approach; Springer Science & Business Media: Berlin, Germany, 2002. [Google Scholar]
  45. Picard, R.R.; Cook, R.D. Cross-validation of regression models. J. Am. Stat. Assoc. 1984, 79, 575–583. [Google Scholar] [CrossRef]
  46. Bernhardt, E.S.; Palmer, M.A. River restoration: The fuzzy logic of repairing reaches to reverse catchment scale degradation. Ecol. Appl. 2011, 21, 1926–1931. [Google Scholar] [CrossRef] [PubMed]
  47. Violin, C.R.; Cada, P.; Sudduth, E.B.; Hassett, B.A.; Penrose, D.L.; Bernhardt, E.S. Effects of urbanization and urban stream restoration on the physical and biological structure of stream ecosystems. Ecol. Appl. 2011, 21, 1932–1949. [Google Scholar] [CrossRef] [PubMed]
  48. Richards, C.; Host, G. Examining land use influences on stream habitats and macroinvertebrates: A GIS approach. Water Resour. Bull. 1994, 30, 729–738. [Google Scholar] [CrossRef]
  49. Goforth, R.R.; Bain, M.B. Assessing stream integrity based on interpretations of map-based riparian and subbasin properties. Landsc. Ecol. Eng. 2012, 8, 33–43. [Google Scholar] [CrossRef]
  50. Wright, J.; Moss, D.; Armitage, P.; Furse, M. A preliminary classification of running-water sites in great britain based on macro-invertebrate species and the prediction of community type using environmental data. Freshw. Biol. 1984, 14, 221–256. [Google Scholar] [CrossRef]
  51. Sawyer, J.A.; Stewart, P.M.; Mullen, M.M.; Simon, T.P.; Bennett, H.H. Influence of habitat, water quality, and land use on macro-invertebrate and fish assemblages of a southeastern coastal plain watershed, USA. Aquat. Ecosyst. Health Manag. 2004, 7, 85–99. [Google Scholar] [CrossRef]
  52. Wallace, J.B.; Grubaugh, J.W.; Whiles, M.R. Biotic indices and stream ecosystem processes: Results from an experimental study. Ecol. Appl. 1996, 6, 140–151. [Google Scholar] [CrossRef]
  53. Poff, N.L.; Zimmerman, J.K. Ecological responses to altered flow regimes: A literature review to inform the science and management of environmental flows. Freshw. Biol. 2010, 55, 194–205. [Google Scholar] [CrossRef]
  54. Helms, B.S.; Schoonover, J.E.; Feminella, J.W. Seasonal variability of landuse impacts on macroinvertebrate assemblages in streams of western georgia, USA. J. N. Am. Benthol. Soc. 2009, 28, 991–1006. [Google Scholar] [CrossRef]
  55. Joung, H.; Miller, W.; Mahannah, C.; Guitjens, J. A generalized water quality index based on multivariate factor analysis. J. Environ. Qual. 1979, 8, 95–100. [Google Scholar] [CrossRef]
  56. Norris, R.H.; Georges, A. Analysis and interpretation of benthic macroinvertebrate surveys. In Freshwater Biomonitoring Benthic Macroinvertebrates; Chapman & Hall: New York, NY, USA, 1993; pp. 234–286. [Google Scholar]
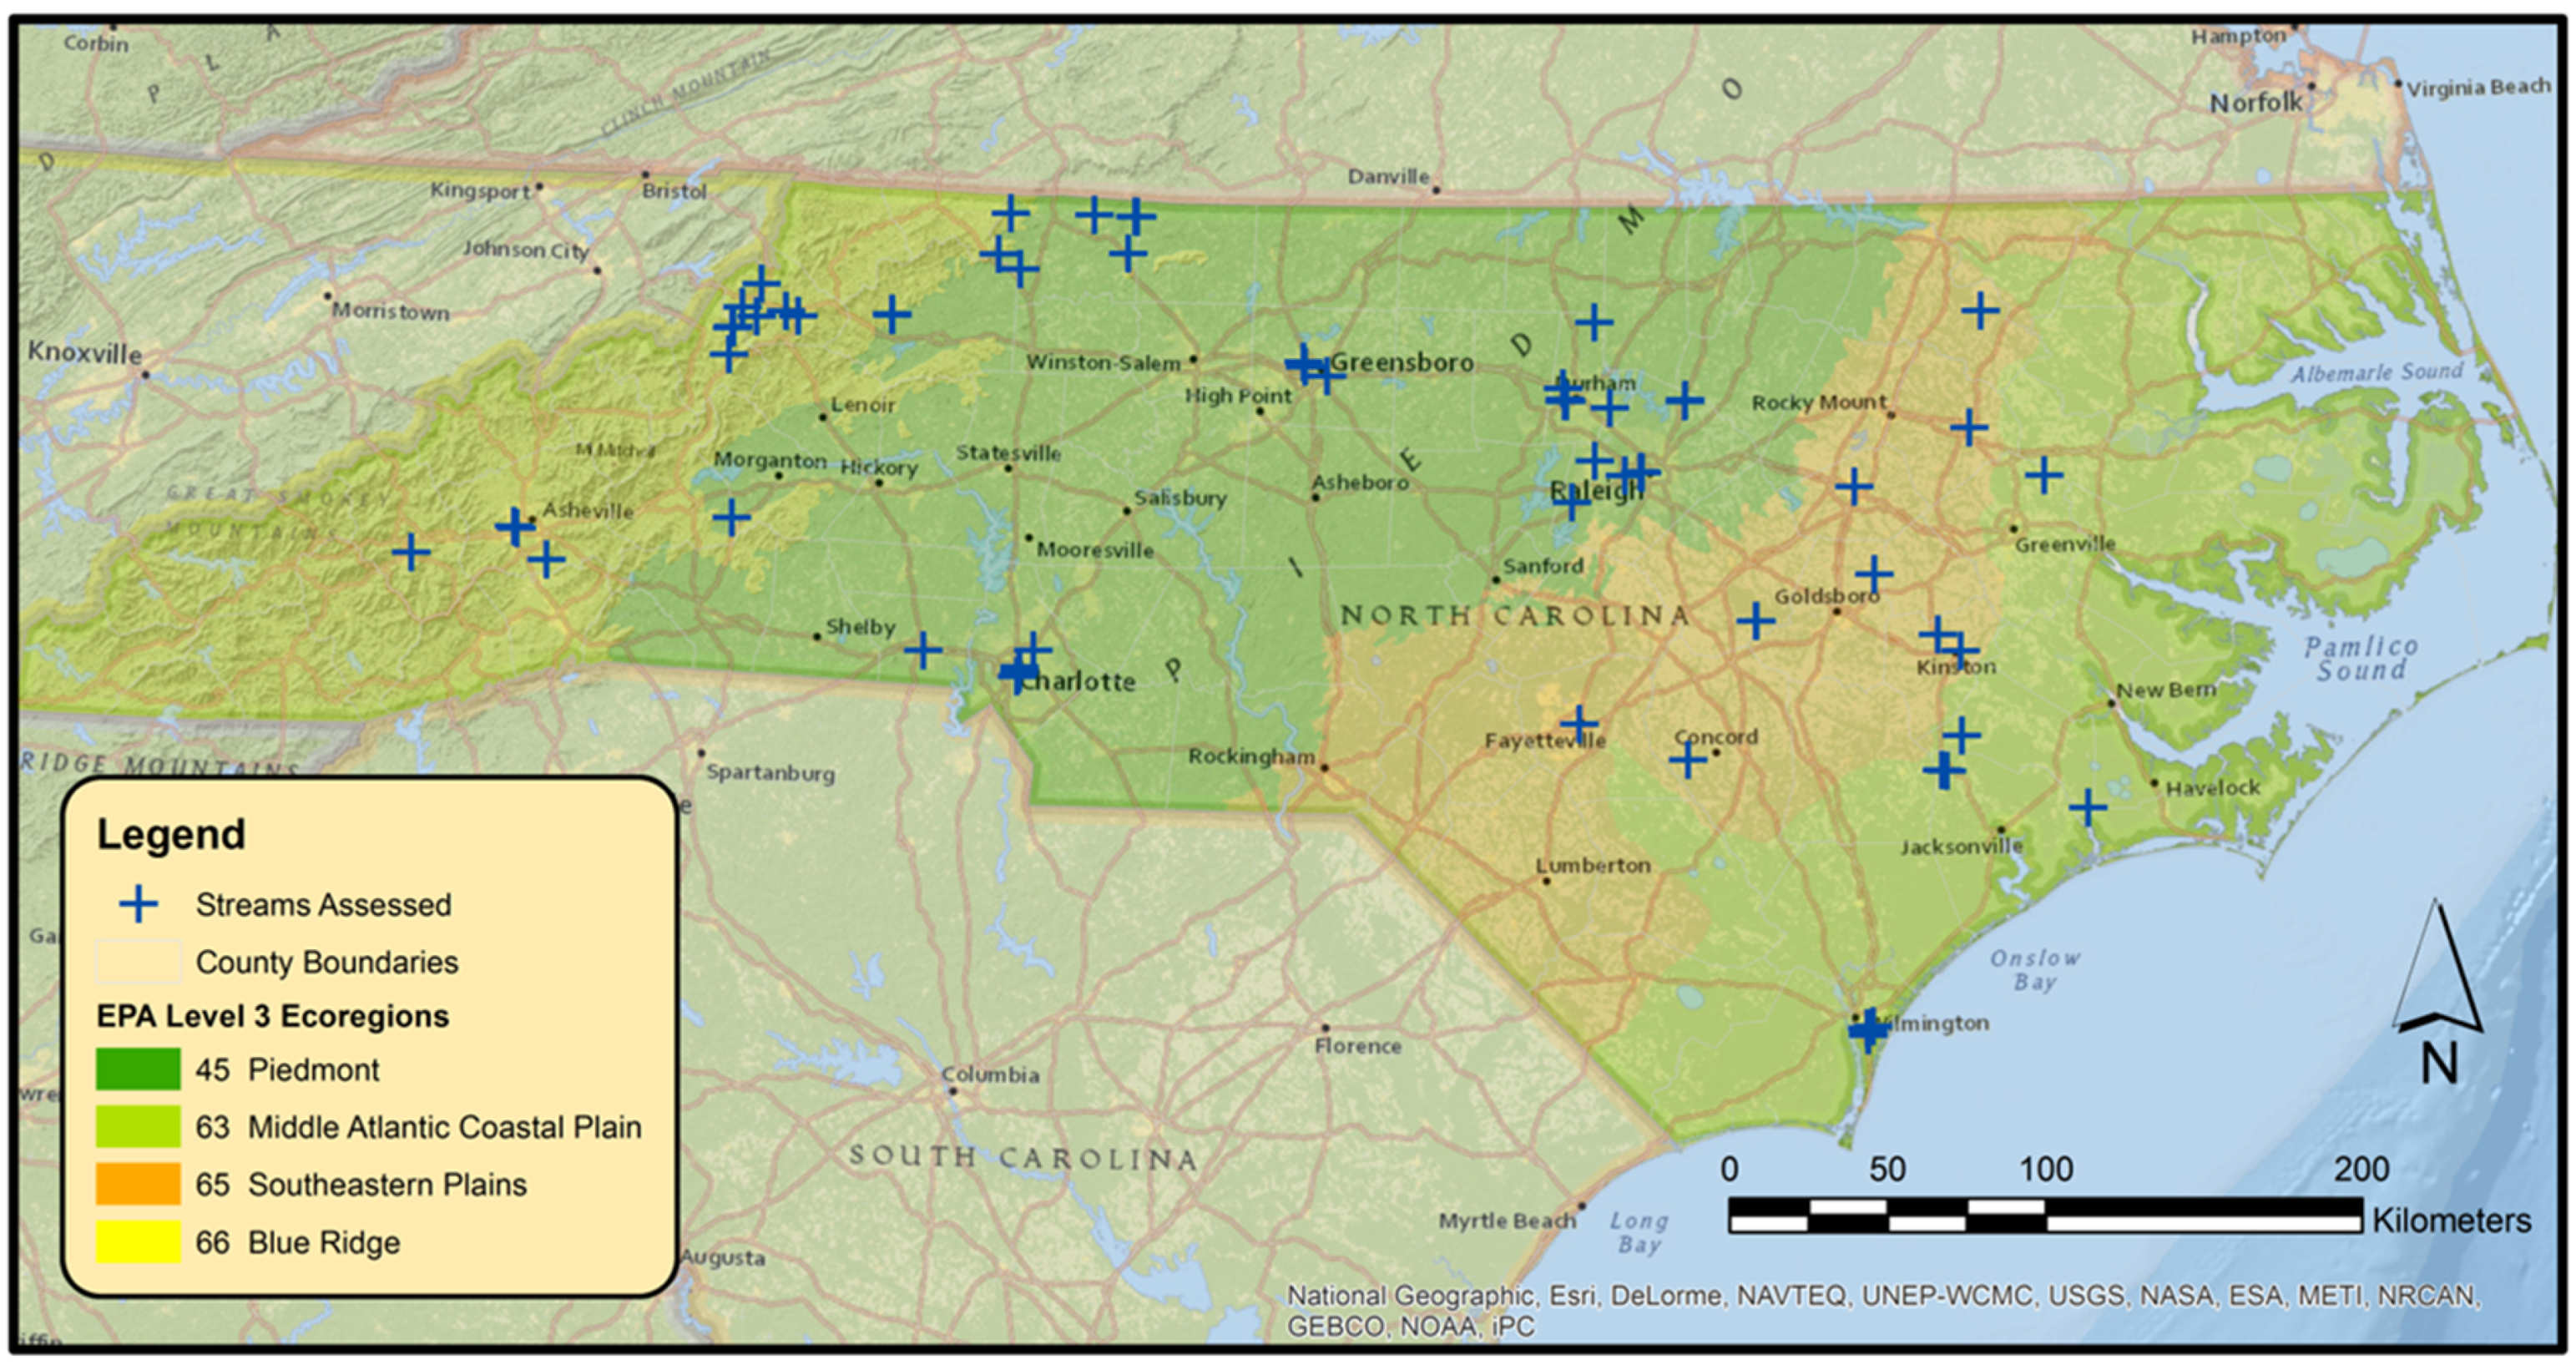
Figure 1. Location of stream restoration projects assessed.
Water 08 00143 g001
Figure 2. Correlation visualization diagram comparing total raw points for five stream assessment methods and EPT Taxa values for 65 streams using correlation, results of test for association between paired samples using Pearson’s correlation coefficient and bivariate scatterplots with a weighted least squares fitted line. Significance indicated by *** ≤ 0.0001, ** ≤ 0.001, * ≤ 0.01. The x-axis (including axis scale) for each scatterplot corresponds to the column label (vertical) and the y-axis corresponds to the row label (horizontal).
Water 08 00143 g002
Figure 3. EPT taxa plotted in relation to six watershed parameters (n = 65 streams) with (a) EPT taxa versus % Impervious cover; (b) EPT taxa versus % Developed; (c) EPT taxa versus curve number; (d) EPT taxa versus time of concentration; (e) EPT taxa versus watershed size in square kilometers; (f) EPT taxa versus basin slope.
Water 08 00143 g003
Figure 4. Biplot of the first two principal components for watershed conditions with stream symbols coded by urban compared with rural classification (n = 65 streams).
Water 08 00143 g004
Figure 5. Coefficients of determination (R2) resulting from prediction of EPT taxa values for 65 streams using three linear models of five rapid assessment methods and watershed variables including: (1) total raw points, (2) PCs from PCA of individual variables, (3) PCs from PCA of individual variables combined with watershed parameters.
Water 08 00143 g005
Table 1. EGA stream restoration assessment components.
Evaluation CategoriesSub-CategoriesNo. of VariablesMax. Possible Points
Channel ConditionBedform Condition1020
Dominant Substrate Material312
Streambank Stability624
Riparian HabitatRiparian Vegetation520
Floodplain Condition624
Macro invertebratesCommunity Structure624
Cover and Refuge1220
In-stream StructuresStructure Function416
Structure Condition312
Total Points55172
Table 2. Stream Performance Assessment (SPA) categories and point values.
Evaluation CategorySub-CategoryPoints
Bedform (riffle-pool or step-pool or ripple-pool features)Riffles-Pools present in regular alternating sequence3
Riffles-Pools properly located3
Riffles appropriate length & slope3
Riffles clean washed course material3
Pools adequate length & depth; point bar slopes3
PatternAppropriate to valley slope and type10
In-Stream HabitatLarge woody debris (excluding root wads)3
Leaf packs3
Stable undercut banks3
Root mats and/or fine roots along toe of streambanks3
Overhanging vegetation3
Root wads and/or large root masses along streambanks3
Bedrock, boulders or boulder clusters2
Sediment TransportEvaluate bed incision or deposition15
Streambank ConditionEstimate percentage of streambanks eroding20
Streambank VegetationEvaluate bank vegetative cover and presence of invasive plants15
Floodplain FunctionEvaluate bank height ratio and floodplain width15
Total Points110
Table 3. Characteristic comparisons of five rapid stream assessment methods.
CharacteristicEGASPARBPRCESVAP
Number of Variables5517131915
Equal variable weights X X
Unequal variable weightsXX X
Variable points summed XXX
Variable points averaged X
Sum/Average combinedX
Table 4. Variable comparisons among five rapid stream assessment methods.
Assessment CategoriesEGASPARBPRCESVAP
BedformXXXXX
Substrate 1XXXXX
Streambank stabilityXXXXX
Riparian vegetationXXX X
Riparian widthX XXX
Riparian completeness X
Floodplain accessibilityXX X
Aquatic insects 2X XX
Fish X
In-stream habitatXXXXX
Structures (x-vanes, etc.)X
Debris dams X
Channel pattern X
Sediment transport XXX
Channel velocity X
Channel flow X
Channel modification X X
Land use 3 X
Width-to-depth ratio X
Algal presence XX
Water clarity X
Fish barriers X
Manure presence 1 X
Salinity1 X
1 Embeddedness (substrate), manure presence, and salinity variables were not included in statistical analyses for the SVAP as these variables were not applicable to all sites; 2 The aquatic insect variable from the EGA, SVAP and RCE was not included in the statistical analyses; 3 Land Use characterized immediately beyond the riparian zone.
Table 5. Results of slope significance based on p-values obtained from linear regressions of five macroinvertebrate metrics compared to total raw points for five stream assessment methods. n = 65 for all metrics except DIC where n = 52 streams. Significance indicated by *** ≤ 0.0001, ** ≤ 0.001, * ≤ 0.01, · ≤0.05, ns = not significant.
Dominant TaxaEPT TaxaEPT Abundance% Shredders & PredatorsIndicator Taxa
EGA*********ns***
SPA·*··*
RBP*********ns***
RCE***nsns**
SVAPnsnsnsns*
Table 6. Coefficients of determination and significance of the slope based on p-values obtained from linear regression of five macroinvertebrate metrics compared to five stream assessments for 65 streams using three approaches: 1) total raw points, 2) PCA of individual habitat variables and 3) PCA of individual habitat variables combined with six watershed variables. Coefficients of determination are also included from multiple linear regression analyses of five macroinvertebrate metrics to six watershed factors and to watershed PCs (from PCA). Slope significance indicated by *** ≤ 0.0001, ** ≤ 0.001, * ≤ 0.01, • ≤ 0.05, ns = not significant.
Dominant TaxaEPT TaxaEPT Abundance% Shredders & PredatorsIndicator TaxaNo. of VariablesTotal No. of PCs% Variability Explained by PCs
EGA Total Points0.24***0.29***0.23***0.03ns0.26***1
PCA EGA0.61***0.68***0.62***0.29·0.58***441176.3
PCA (EGA +Watershed)0.74***0.81***0.72***0.26ns0.70***501277.3
SPA Total Points0.07·0.10*0.07·0.09·0.14*1
PCA SPA0.49***0.47***0.32*0.16ns0.39**17778.1
PCA (SPA + Watershed)0.66***0.68***0.53***0.20ns0.56***23878.8
RBP Total Points0.31***0.37***0.33***0.03ns0.42***1
PCA RBP0.37***0.46***0.39***0.20·0.45***13577.4
PCA (RBP + Watershed)0.63***0.72***0.59***0.24·0.65***19677.4
RCE Total Points0.15*0.11**0.16ns0.01ns 0.31**1
PCA RCE0.45***0.49***0.45***0.20ns 0.65***18878.7%
PCA (RCE + Watershed)0.70***0.73***0.63***0.16ns 0.73***24978.2%
SVAP Total Points0.02ns0.04ns0.05ns0.01ns 0.33.1
PCA SVAP0.33**0.39***0.34**0.09ns 0.66**11680.3%
PCA (SVAP + Watershed)0.58***0.67***0.56***0.11ns 0.66***17675.7%
Watershed0.65***0.70***0.55***0.22ns0.52***6
PC Watershed0.41***0.43***0.34***0.09ns0.40***6278.6%
Table 7. Akaike’s Information Criterion (AIC) scores and cross-validation (CV) scores for three linear models to predict EPT taxa by five separate stream assessment methods and by watershed variables. The number of predictors (#) is also provided for each model.
Linear Regression of Total Raw ScorePCRPCR (Assessment + Watershed Variables)
AICCV#AICCV#AICCV#
EGA35613.113248.8112947.112
SPA37116.6134910.873197.38
RBP34911.2134710.453077.46
RCE36615.4134811.383086.39
SVAP37617.7135712.363166.56
Watershed3116.963449.92
Table 8. RBP Index scaled and un-scaled (multiplier) weights. Variables with larger scaled weights (absolute value ≥ 0.4) are shown in bold. Scaled weight indicates the relative importance of each variable for prediction of EPT taxa. The multiplier can be used with the field collected data points for each variable to calculate new index scores for each stream.
Variable #Variable NameScaled WeightMultiplier
3Pool variability or velocity1.100.20
7Channel sinuosity or riffle frequency0.840.16
1Epifaunal substrate0.830.23
2Pool substrate or embeddedness0.690.18
5Channel flow status0.560.10
8Bank stability LB0.420.38
9Bank stability RB0.380.34
4Sediment deposition0.260.07
11Vegetative protection RB0.050.02
6Channel alteration0.040.01
10Vegetative protection LB0.010.00
13Riparian zone RB–0.07–0.03
12Riparian zone LB–0.18–0.06
Table 9. RBP Index (including watershed factors) scaled and un-scaled (multiplier) weights. Variables with larger scaled weights (absolute value ≥ 0.4) are shown in bold. Scaled weight indicates the relative importance of each variable for prediction of EPT taxa. The multiplier can be used with the field collected data points for each variable to calculate new index scores for each stream.
Variable #Variable NameScaled WeightMultiplier
7Channel sinuosity or riffle frequency0.860.16
14Basin Slope0.8119.13
3Pool variability or velocity0.740.13
5Channel flow status0.630.12
2Pool substrate or embeddedness0.530.14
16Watershed Size0.430.05
4Sediment deposition0.380.10
1Epifaunal substrate0.370.10
8Bank stability LB0.190.17
9Bank stability RB0.140.12
15Time of Concentration0.060.00
6Channel alteration–0.010.00
13Riparian zone RB–0.14–0.05
11Vegetative protection RB–0.15–0.08
10Vegetative protection LB–0.17–0.09
12Riparian zone LB–0.23–0.07
19% Impervious–0.40–0.03
18% Developed–0.49–0.01
17Curve Number–0.75–0.09