
Efficiency of a Horizontal Sub-Surface Flow Constructed Wetland Treatment System in an Arid Area


Abstract
:1. Introduction
2. Materials and Methods
2.1. Site Description

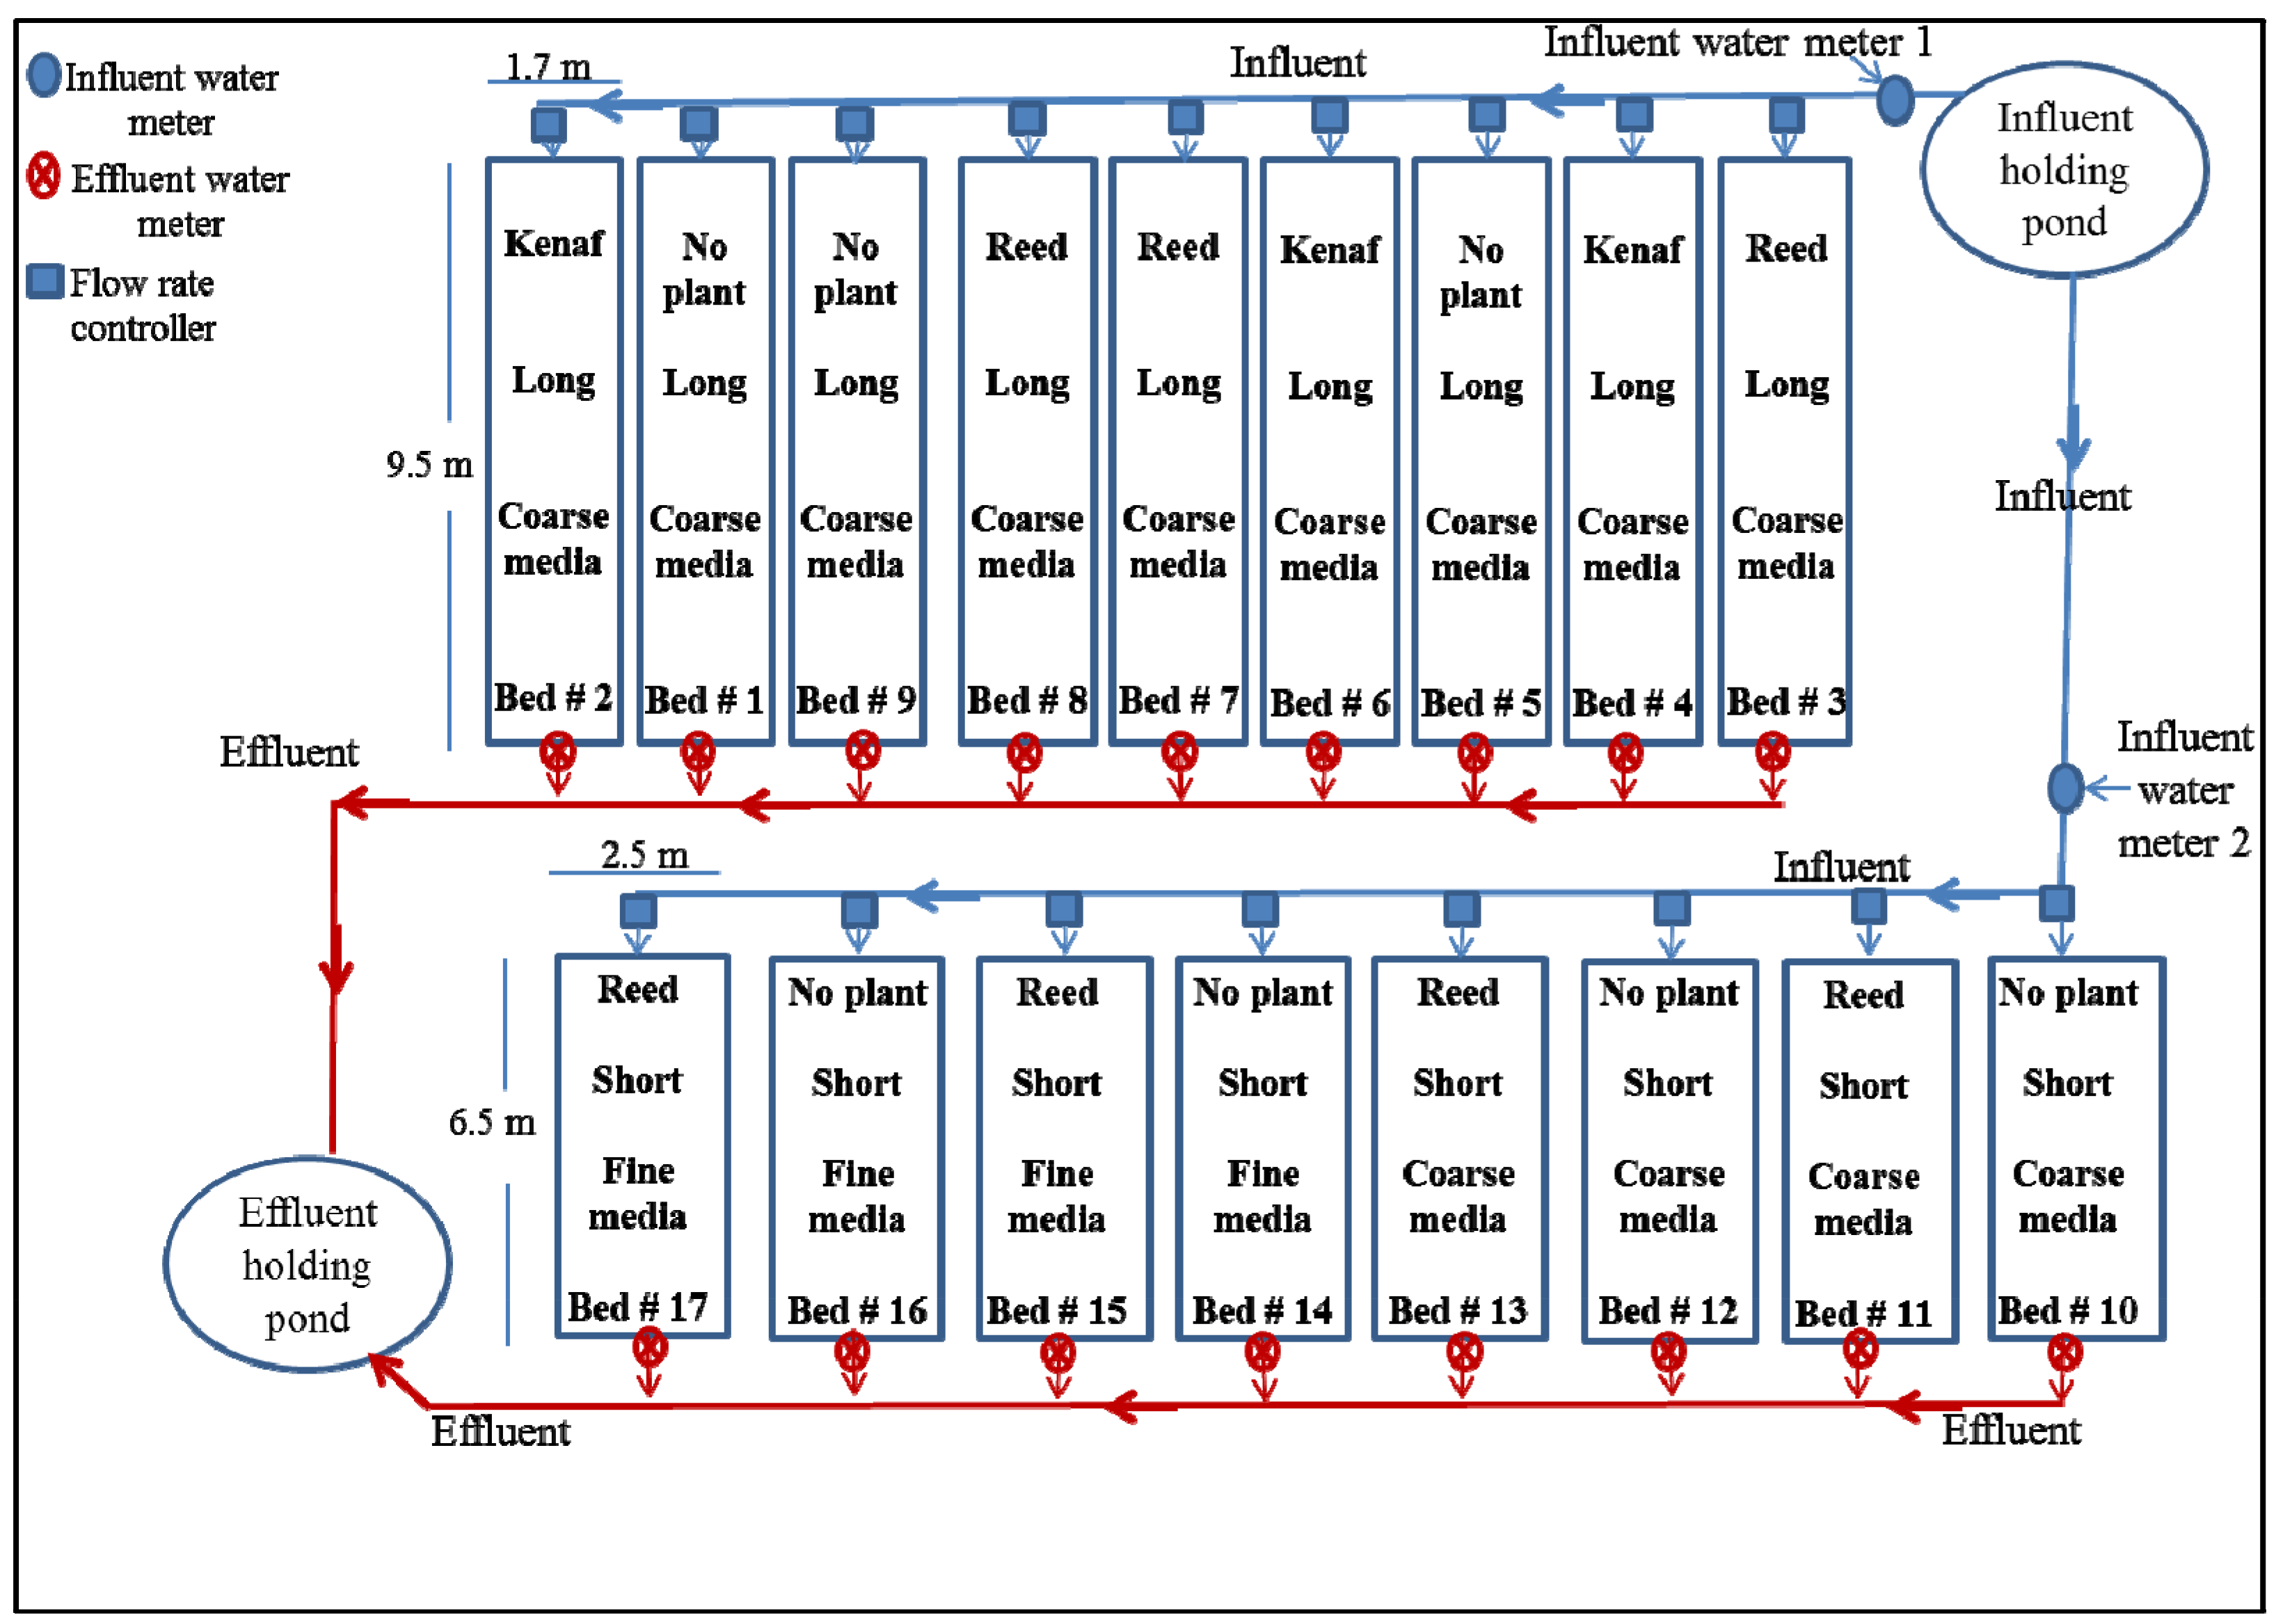
2.2. Treatment System Design
2.3. Wastewater Quality Monitoring
2.4. Wastewater Flow Rates and Distribution
2.5. Statistical Analyses
2.6. Climate Data
3. Results

| Type of Bed | Influent (m3/day) | Effluent (m3/day) | Percentage of Losses (%) | ||
|---|---|---|---|---|---|
| In the Summer Seasons | In the Winter Seasons | In All the Study Period | |||
| Reed bed | 1.62 | 1.15 | 45 | 17 | 29.4 |
| Kenaf bed | 1.62 | 1.37 | 30 | 3.2 | 15.5 |
| Unplanted bed | 1.62 | 1.56 | 6 | 2.8 | 4.0 |
| All the beds | 27.62 | 23.07 | 26.9 | 8.6 | 16.5 |
3.1. HSF-CW Performance
| Parameter | Long Beds | Short Beds | Short Beds | ||||||
|---|---|---|---|---|---|---|---|---|---|
| Coarse Media | Coarse Media | Fine Media | Coarse 1 Media | Fine 2 Media | |||||
| No Plant | Kenaf | Reed | No Plant | Reed | No Plant | Reed | |||
| Group 1 | Group 2 | Group 3 | Group 4 | ||||||
| BOD5 | |||||||||
| Mass flow removal * efficiency (%) | 51 | 56 | 66G1 | 37 | 62G2 | 50 | 67G3 | 50 | 59G4 |
| Number of samples | 41 | 42 | 41 | 22 | 22 | 22 | 22 | 40 | 40 |
| COD | |||||||||
| Mass flow removal * efficiency (%) | 42 | 49 | 58 | 38 | 56 | 47 | 64 | 47 | 55 |
| Number of samples | 38 | 38 | 38 | 24 | 24 | 24 | 23 | 48 | 47 |
| TSS | |||||||||
| Mass flow removal* efficiency (%) | 56 | 64 | 73 | 67 | 79 | 65 | 64 | 73 | 63 |
| Number of samples | 53 | 54 | 53 | 34 | 34 | 34 | 34 | 68 | 68 |
| P | |||||||||
| Mass flow removal * efficiency (%) | 38 | 46 | 64G1 | 35 | 61G2 | 58 | 75G3 | 49 | 67G4 |
| Number of samples | 53 | 54 | 53 | 34 | 34 | 34 | 34 | 68 | 68 |
| FC | |||||||||
| Log reduction * | 0.4 | 0.5 | 0.5 | 0.6 | 0.9 | 1.2 | 1.2 | 0.8 | 1.1G4 |
| Number of samples | 47 | 48 | 47 | 26 | 26 | 26 | 26 | 52 | 52 |
3.2. Changes in the EC, Major Anions, and Cations

| Parameters | Long Beds | Short Beds | Short Beds | ||||||
|---|---|---|---|---|---|---|---|---|---|
| Coarse Media | Coarse Media | Fine Media | Coarse1 Media | Fine2 Media | |||||
| No Plant | Kenaf | Reed | No Plant | Reed | No Plant | Reed | |||
| Group 1 | Group 2 | Group 3 | Group 4 | ||||||
| Ca2+ | +25 * | +23 * | +35 * | +27 * | +9 * | +38 * | +45 * | +20* | +47 *,G4 |
| Mg2+ | 0 | −7 | −10 | +6 | −24 *,G2 | +11 | −5 | − 9 | +4 G4 |
| Na+ | +6 | −1 | −4 | +9*G2 | −14* | +10 | −3 | −2 | +6 |
| K+ | +17 *,G1 | +5 | −18 *,G1 | +15 *,G2 | −17* | +26 *,G3 | −11 | 0 | +8 |
| Cl− | +6 | 0 | −1 | +10 *,G2 | −12* | +14* | +4 | 0 | +12 |
| SO42− | +46 | +40 | +74 * | +50 * | +35 | +77* | +85 * | +46 * | +87 * |
| HCO3− | −5 G1 | −10 * | −23 *,G1 | −5 | −27 *,G2 | −10 | −23 *,G3 | −15* | −15 * |
| CO3− | +11 | +3 | −23 G1 | +16 | −20 G2 | +22 | −19G3 | −2 | 0 |
| Cd | −19 | −33 * | −48 *,G1 | −24 | −45 * | −9 | −38 * | −35 * | −24 a |
| Co | −19 | −42 | −54 *,G1 | −21 | −37 | −13 | −28 | −28 | −19 |
| Zn | −40 * | −59 * | −50 * | −30 | −57 * | −59* | −69 * | −44 * | −64 * |
3.3. Changes in Micronutrients and Heavy Metals
4. Discussion
5. Conclusions
- Our horizontal sub-surface flow constructed wetland treatment system has adequately removed BOD5, COD, TSS, and P. The effluents of the long and short beds of equal bed volume did not show statistically significant differences.
- Reed plants were efficient in removing organic contaminants but they consumed a lot of water and therefore concentrated the effluents. Beds with kenaf plants and beds without plants showed similar quality in their effluents.
- Evaporation caused water losses and concentrated effluents. Therefore the removal efficiencies were compared based on mass flows instead of concentrations.
- Both fine and coarse media without vegetation removed significant amounts of organic contaminants while minimizing water losses to only 4%.
- The unplanted beds with either fine or coarse media acted as granular filters and performed better than other design combinations studied.
- A granular filtration system with media suitable for microbial growth and surface contact with the wastewater is suggested for future implementation. However, further research on constructed wetland in arid areas are still needed concerning evaporation loss, media selection, hydraulic retention time, and related design combinations.
Acknowledgments
Author Contributions
Conflicts of Interest
Appendix
| Parameters | Measurements | Influent | Effluent * | ||||||||
|---|---|---|---|---|---|---|---|---|---|---|---|
| Long Beds | Short Beds | Short Beds | |||||||||
| Coarse Media | Coarse Media | Fine Media | Coarse1 Media | Fine2 Media | |||||||
| No Plant | Kenaf | Reed | No Plant | Reed | No Plant | Reed | |||||
| Group 1 | Group 2 | Group 3 | Group 4 | ||||||||
| Mean flow per bed L·day−1 | 1600 | 1560 | 1400 | 1100 | 1560 | 1100 | 1560 | 1100 | 1330 | 1330 | |
| BOD/COD | 0.45 | 0.38 | 0.39 | 0.36 | 0.46 | 0.39 | 0.43 | 0.41 | 0.43 | 0.42 | |
| BOD5 | Mean concentration mg·L−1 | 142 | 72 | 72 | 69 | 91 | 79 | 73 | 68 | 85 | 71 |
| Number of samples | 27 | 41 | 42 | 41 | 22 | 22 | 22 | 22 | 40 | 40 | |
| Concentration’s standard deviation | 53 | 43 | 41 | 41 | 38 | 29 | 34 | 31 | 35 | 34 | |
| Mean mass flow g·day−1 | 227 | 112 | 101 | 76 G1 | 142 | 87 G2 | 114 | 75 G3 | 114 | 93 G4 | |
| Mass flow’s standard deviation | 85 | 64 | 56 | 40 | 59 | 32 | 54 | 34 | 50 | 48 | |
| COD | Mean concentration mg·L−1 | 316 | 188 | 184 | 191 | 199 | 201 | 171 | 167 | 200 | 169 |
| Number of samples | 27 | 38 | 38 | 38 | 24 | 24 | 24 | 23 | 48 | 47 | |
| Concentration’s standard deviation | 119 | 114 | 126 | 94 | 83 | 82 | 78 | 76 | 82 | 80 | |
| Mean mass flow g·day−1 | 505 | 294 | 258 | 210 | 311 | 221 | 266 | 184 | 266 | 225 | |
| Mass flow’s standard deviation | 190 | 160 | 177 | 104 | 130 | 91 | 122 | 83 | 109 | 102 | |
| TSS | Mean concentration mg·L−1 | 72 | 32 | 30 | 28 | 25 | 22 | 26 | 38 | 23 | 32 |
| Number of samples | 37 | 53 | 54 | 53 | 34 | 34 | 34 | 34 | 68 | 68 | |
| Concentration’s standard deviation | 59 | 24 | 18 | 22 | 17 | 16 | 18 | 63 | 16 | 47 | |
| Mean mass flow g·day−1 | 115 | 50 | 42 | 31 | 38 | 24 | 40 | 42 | 31 | 42 | |
| Mass flow’s standard deviation | 94 | 38 | 25 | 25 | 27 | 17 | 28 | 69 | 22 | 62 | |
| P | Mean concentration mg·L−1 | 14.3 | 9.1 | 8.9 | 7.4 | 9.6 | 8.0 | 6.2 | 5.3 | 8.8 | 5.7G4 |
| Number of samples | 37 | 53 | 54 | 53 | 34 | 34 | 34 | 34 | 68 | 68 | |
| Concentration’s standard deviation | 3.1 | 4.2 | 4.1 | 4.1 | 3.8 | 3.4 | 4.1 | 3.6 | 3.6 | 3.9 | |
| Mean mass flow g·day−1 | 23 | 14 | 12 | 8 G1 | 15 | 9 G2 | 10 | 6 G3 | 12 | 8 G4 | |
| Mass flow’s standard deviation | 5.0 | 6.5 | 5.8 | 4.5 | 5.9 | 3.7 | 6.4 | 4.0 | 4.8 | 5.1 | |
| FC | Mean (Log10 CFU/100 mL) | 5.2 | 4.8 | 4.7 | 4.7 | 4.6 | 4.3 | 4.0 | 4.0 | 4.4 | 4.1 G4 |
| Standard deviation (Log10 CFU/100 mL) | 1.0 | 1.1 | 1.0 | 1.3 | 1.0 | 1.0 | 1.1 | 0.9 | 1.0 | 1.0 | |
| Number of samples | 30 | 47 | 48 | 47 | 26 | 26 | 26 | 26 | 52 | 52 | |
| Standard deviation of FC counts | 224,186 | 147,225 | 116,745 | 209,638 | 51,898 | 36,322 | 28,130 | 47,156 | 43,859 | 43,362 | |
| Parameters | Influent | Effluent | |||||||||
|---|---|---|---|---|---|---|---|---|---|---|---|
| Long Beds | Short Beds | Short Beds | |||||||||
| Coarse Media | Coarse Media | Fine Media | Coarse1 Media | Fine2 Media | |||||||
| No Plant | Kenaf | Reed | No Plant | Reed | No Plant | Reed | |||||
| Group 1 | Group 2 | Group 3 | Group 4 | ||||||||
| Mean flow per bed L·day−1 | 1600 | 1560 | 1400 | 1100 | 1560 | 1100 | 1560 | 1100 | 1330 | 1330 | |
| Number of samples | 35 | 50 | 51 | 50 | 32 | 32 | 32 | 32 | 64 | 64 | |
| Ca2+ | Mean concentration mg·L−1 | 70 | 90 * | 99* | 138*G1 | 91* | 111 *,G2 | 99* | 148 *,G3 | 101* | 124 *,G4 |
| Concentration’s standard deviation | 17 | 31 | 42 | 75 | 31 | 44 | 44 | 86 | 39 | 72 | |
| Mean mass flow g·day−1 | 112 | 140 * | 138 * | 151* | 142* | 122 * | 155 * | 163 * | 134 * | 164 *,G4 | |
| Mass flow’s standard deviation | 27 | 49 | 58 | 83 | 49 | 48 | 68 | 95 | 52 | 96 | |
| Mg2+ | Mean concentration mg·L−1 | 52 | 53 | 55 | 68 *,G1 | 57 | 57 | 59 | 72* | 57 | 65*G4 |
| Concentration’s standard deviation | 10 | 14 | 17 | 28 | 14 | 15 | 23 | 37 | 14 | 31 | |
| Mean mass flow g·day−1 | 83 | 83 | 77 | 75 | 88 | 63 *,G2 | 92 | 79 | 76 | 87G4 | |
| Mass flow’s standard deviation | 15 | 22 | 24 | 31 | 21 | 16 | 36 | 40 | 19 | 41 | |
| Na+ | Mean concentration mg·L−1 | 303 | 330 | 344 * | 422 *,G1 | 339 * | 380 *,G2 | 342 * | 429 *,G3 | 359* | 386 * |
| Concentration’s standard deviation | 53 | 85 | 103 | 153 | 87 | 98 | 97 | 157 | 94 | 137 | |
| Mean mass flow g·day−1 | 485 | 515 | 482 | 465 | 529 *,G2 | 417 * | 534 | 472 | 478 | 513 | |
| Mass flow’s standard deviation | 86 | 132 | 145 | 168 | 136 | 107 | 151 | 173 | 125 | 182 | |
| K+ | Mean concentration mg·L−1 | 39 | 47 * | 47 * | 47 * | 46 * | 47 * | 50* | 50* | 46 * | 50 * |
| Concentration’s standard deviation | 6 | 8 | 9 | 13 | 8 | 10 | 15 | 17 | 9 | 16 | |
| Mean mass flow g·day−1 | 62 | 73 *,G1 | 65 | 51 *,G1 | 71 *,G2 | 52* | 78 *,G3 | 55 | 62 | 67 | |
| Mass flow’s standard deviation | 9 | 12 | 12 | 14 | 12 | 11 | 23 | 18 | 12 | 21 | |
| Cl− | Mean concentration mg·L−1 | 408 | 443 | 465 * | 588 *,G1 | 461 * | 521 *,G2 | 477 * | 619 *,G2 | 491* | 548 *,G2 |
| Concentration’s standard deviation | 57 | 98 | 123 | 247 | 99 | 151 | 155 | 278 | 131 | 235 | |
| Mean mass flow g·day−1 | 653 | 691 | 651 | 648 | 718 *,G2 | 573 * | 744 * | 681 | 653 | 729 | |
| Mass flow’s standard deviation | 92 | 153 | 172 | 271 | 154 | 167 | 242 | 306 | 174 | 312 | |
| SO42− | Mean concentration mg·L−1 | 137 | 206 | 220 * | 349 *,G1 | 212 * | 270 *,G2 | 249* | 369 *,G3 | 241 * | 309 * |
| Concentration’s standard deviation | 108 | 192 | 196 | 257 | 162 | 178 | 184 | 263 | 172 | 233 | |
| Mean mass flow g·day−1 | 220 | 322 | 307 | 384* | 331* | 297 | 389* | 406 * | 320* | 411 * | |
| Mass flow’s standard deviation | 173 | 299 | 275 | 283 | 253 | 196 | 287 | 290 | 228 | 310 | |
| HCO3 | Mean concentration mg·L−1 | 422 | 414 G1 | 436 | 476 | 413 | 447 G2 | 389 | 471 G3 | 430 | 430 |
| Concentration’s standard deviation | 96 | 89 | 94 | 160 | 76 | 106 | 97 | 157 | 93 | 136 | |
| Mean mass flow g·day−1 | 676 | 645 G1 | 610* | 524 *,G1 | 644 | 492 *,G2 | 607 | 518 *,G3 | 572* | 572 * | |
| Mass flow’s standard deviation | 154 | 140 | 131 | 176 | 119 | 117 | 151 | 173 | 124 | 181 | |
| CO3− | Mean concentration mg·L−1 | 21 | 22 | 21 | 17 | 22 | 18 | 23 | 21 | 20 | 22 |
| Concentration’s standard deviation | 15 | 15 | 16 | 16 | 16 | 17 | 17 | 15 | 17 | 16 | |
| Mean mass flow g·day−1 | 34 | 38 | 35 | 26 G1 | 39 | 27 G2 | 42 | 27 G3 | 33 | 34 | |
| Mass flow’s standard deviation | 24 | 21 | 20 | 16 | 24 | 17 | 23 | 13 | 20 | 18 | |
| Cd | Mean concentration mg·L−1 | 0.012 | 0.010 | 0.010 | 0.009 | 0.010 | 0.010 | 0.012 | 0.011 | 0.010 | 0.011 |
| Concentration’s standard deviation | 0.01 | 0.01 | 0.01 | 0.01 | 0.01 | 0.01 | 0.01 | 0.01 | 0.01 | 0.01 | |
| Mean mass flow g·day−1 | 0.019 | 0.016 | 0.013* | 0.010 *,G1 | 0.015 | 0.011 * | 0.018 | 0.012 * | 0.013 * | 0.015 a | |
| Mass flow’s standard deviation | 0.02 | 0.01 | 0.01 | 0.01 | 0.01 | 0.01 | 0.02 | 0.01 | 0.01 | 0.01 | |
| Co | Mean concentration mg·L−1 | 0.027 | 0.022 | 0.018 | 0.018 | 0.022 | 0.025 | 0.024 | 0.028 | 0.023 | 0.026 |
| Concentration’s standard deviation | 0.04 | 0.03 | 0.03 | 0.02 | 0.03 | 0.03 | 0.03 | 0.04 | 0.03 | 0.03 | |
| Mean mass flow g·day−1 | 0.043 | 0.035 | 0.025 | 0.020 *,G1 | 0.034 | 0.027 | 0.037 | 0.031 | 0.031 | 0.035 | |
| Mass flow’s standard deviation | 0.06 | 0.05 | 0.04 | 0.03 | 0.04 | 0.03 | 0.05 | 0.04 | 0.04 | 0.05 | |
| Zn | Mean concentration mg·L−1 | 0.06 | 0.04 * | 0.03 * | 0.05 G1 | 0.05 | 0.04 | 0.03 * | 0.03 * | 0.04 | 0.03 *G4 |
| Concentration’s standard deviation | 0.04 | 0.05 | 0.02 | 0.05 | 0.05 | 0.05 | 0.04 | 0.04 | 0.05 | 0.04 | |
| Mean mass flow g·day−1 | 0.1 | 0.06 * | 0.04 * | 0.05 * | 0.07 | 0.04 * | 0.04* | 0.03 * | 0.06 * | 0.04 * | |
| Mass flow’s standard deviation | 0.07 | 0.07 | 0.03 | 0.05 | 0.08 | 0.05 | 0.07 | 0.05 | 0.06 | 0.06 | |
References
- Vymazal, J. Constructed wetlands for wastewater treatment: Five decades of experience. Environ. Sci. Technol. 2010, 45, 61–69. [Google Scholar] [CrossRef] [PubMed]
- Vymazal, J. Natural and Constructed Wetlands: Nutrients, Metals and Management; Backhuys: Trebon, Czech, 2005; Volume 10. [Google Scholar]
- Kivaisi, A.K. The potential for constructed wetlands for wastewater treatment and reuse in developing countries: A review. Ecol. Eng. 2001, 16, 545–560. [Google Scholar] [CrossRef]
- Göçmez, S.; Kayam, Y.; Bilir, Z.L. Constructed Wetlands for Municipal Waste Water Treatment; Case Study of Çakirbeyli Village. In Proceedings of International Sustainable Water and Wastewater Management Symposium, Konya, Turkey, 26–28 October 2010.
- Vymazal, J.; Kröpfelová, L. Wastewater Treatment in Constructed Wetlands with Horizontal Sub-Surface Flow; Springer Science & Business Media: Dordrecht, The Netherlands, 2008; Volume 14. [Google Scholar]
- Diemont, S.A. Mosquito larvae density and pollutant removal in tropical wetland treatment systems in Honduras. Environ. Int. 2006, 32, 332–341. [Google Scholar] [CrossRef] [PubMed]
- Zhang, D.Q.; Jinadasa, K.B.S.N.; Gersberg, R.M.; Liu, Y.; Ng, W.J.; Tan, S.K. Application of constructed wetlands for wastewater treatment in developing countries—A review of recent developments (2000–2013). J. Environ. Manag. 2014, 141, 116–131. [Google Scholar] [CrossRef] [PubMed]
- Vera, I.; Verdejo, N.; Chávez, W.; Jorquera, C.; Olave, J. Influence of hydraulic retention time and plant species on performance of mesocosm subsurface constructed wetlands during municipal wastewater treatment in super-arid areas. J. Environ. Sci. Health Part A 2016, 51, 105–113. [Google Scholar] [CrossRef] [PubMed]
- Department of Statistics (DOS). Jordan in Figures 2010; Issue 13; Department of Statistics: Amman, Jordan, 2011. [Google Scholar]
- Al-Omari, A.; Fayyad, M. Treatment of domestic wastewater by subsurface flow constructed wetlands in Jordan. Desalination 2003, 155, 27–39. [Google Scholar] [CrossRef]
- Standard Methods for the Examination of Water and Wastewater; American Public Health Association, Water Environment Federation: Washington, DC, USA, 1995; p. 19.
- Ryan, J.; Estefan, G.; Rashid, A. Soil and Plant Analysis Laboratory Manual; International center for Agricultural Research in the Dry Areas (ICARDA): Aleppo, Syria, 2001. [Google Scholar]
- Reed, S.C. Subsurface Flow Constructed Wetlands for Wastewater Treatment: A Technology Assessment; EPA 832-R-93-008; United States Environmental Protection Agency, Office of Water (4204): Washington, DC, USA, 1993.
- Rani, S.H.C.; Din, M.F.M.; Yusof, M.B.M.; Shreeshivadasan, C. Overview of Subsurface Constructed Wetlands Application in Tropical Climates. Univers. J. Environ. Res. Technol. 2011, 1, 103–114. [Google Scholar]
- Kiracofe, B.D. Performance Evaluation of the Town of Monterery Wastewater Treatment Plant Utilizing Subsurface Flow Constructed Wetlands. Master’s Thesis, Virginia Polytechnic Institute of State University, Blacksburg, VA, USA, 2000. [Google Scholar]
- Puigagut, J.; Villaseñor, J.; Salas, J.J.; Bécares, E.; García, J. Subsurface-flow constructed wetlands in Spain for the sanitation of small communities: A comparative study. Ecol. Eng. 2007, 30, 312–319. [Google Scholar] [CrossRef]
- Cooper, P.F. Reed Beds and Constructed Wetlands for Wastewater Treatment; WRc Publications: Swindon, UK, 1996. [Google Scholar]
- Decamp, O.; Warren, A. Investigation of Escherichia coli removal in various designs of subsurface flow wetlands used for wastewater treatment. Ecol. Eng. 2000, 14, 293–299. [Google Scholar] [CrossRef]
- Karathanasis, A.; Potter, C.; Coyne, M.S. Vegetation effects on fecal bacteria, BOD, and suspended solid removal in constructed wetlands treating domestic wastewater. Ecol. Eng. 2003, 20, 157–169. [Google Scholar] [CrossRef]
- Mairi, J.P.; Lyimo, T.J.; Njau, K.N. Performance of Subsurface Flow Constructed Wetland for Domestic Wastewater Treatment. Tanzan. J. Sci. 2013, 38, 53–64. [Google Scholar]
- Ohio-EPA. Guidance Document for Small Subsurface Flow Constructed Wetlands with Soil Dispersal System; OAC 3745-42; Ohio Environmental Protection Agency, Division of Surface Water: Columbus, OH, USA, 2007. [Google Scholar]
- Kadlec, R.; Knight, R. Treatment Wetlands; CRC: Baca Raton, FL, USA, 1996. [Google Scholar]
- Sarafraz, S.; Mohammad, T.A.; Noor, M.J.M.M.; Liaghat, A. Wastewater treatment using horizontal subsurface flow constructed wetland. Am. J. Environ. Sci. 2009, 5, 772–778. [Google Scholar]
- Al-Dwairi, R.; Ibrahim, K.; Khoury, H. Occurrences and Properties of Jordanian Zeolites and Zeolitic Tuff; VDM: Saarbrücken, Germany, 2010. [Google Scholar]
- Shuib, N.; Baskaran, K.; Jegatheesan, V. Evaluating the performance of horizontal subsurface flow constructed wetlands using natural zeolite (escott). Int. J. Environ. Sci. Dev. 2011, 2, 311–315. [Google Scholar]
- Al Dwairi, R.A.; Ibrahim, K.M.; Khoury, H.N. Potential use of faujasite–phillipsite and phillipsite–chabazite tuff in purification of treated effluent from domestic wastewater treatment plants. Environ. Earth Sci. 2014, 71, 5071–5078. [Google Scholar] [CrossRef]
- Kuechler, R.; Noack, K.; Zorn, T. Investigation of gypsum dissolution under saturated and unsaturated water conditions. Ecol. Model. 2004, 176, 1–14. [Google Scholar] [CrossRef]
© 2016 by the authors; licensee MDPI, Basel, Switzerland. This article is an open access article distributed under the terms and conditions of the Creative Commons by Attribution (CC-BY) license (http://creativecommons.org/licenses/by/4.0/).
Share and Cite
Albalawneh, A.; Chang, T.-K.; Chou, C.-S.; Naoum, S. Efficiency of a Horizontal Sub-Surface Flow Constructed Wetland Treatment System in an Arid Area. Water 2016, 8, 51. https://doi.org/10.3390/w8020051
Albalawneh A, Chang T-K, Chou C-S, Naoum S. Efficiency of a Horizontal Sub-Surface Flow Constructed Wetland Treatment System in an Arid Area. Water. 2016; 8(2):51. https://doi.org/10.3390/w8020051
Chicago/Turabian StyleAlbalawneh, Abeer, Tsun-Kuo Chang, Chi-Su Chou, and Sireen Naoum. 2016. "Efficiency of a Horizontal Sub-Surface Flow Constructed Wetland Treatment System in an Arid Area" Water 8, no. 2: 51. https://doi.org/10.3390/w8020051
APA StyleAlbalawneh, A., Chang, T.-K., Chou, C.-S., & Naoum, S. (2016). Efficiency of a Horizontal Sub-Surface Flow Constructed Wetland Treatment System in an Arid Area. Water, 8(2), 51. https://doi.org/10.3390/w8020051