Article

Reservoir Routing on Double-Peak Design Flood

DICATECh-Politecnico di Bari, E. Orabona St. 4, 70125 Bari, Italy
Water 2016, 8(12), 553; https://doi.org/10.3390/w8120553
Submission received: 21 June 2016 / Revised: 9 November 2016 / Accepted: 18 November 2016 / Published: 25 November 2016

Abstract

:
This work investigates the routing effect provided by an artificial reservoir to a double-peak flood of a given return period. The present paper introduces a dimensionless form of the reservoir balance equation that describes the hydrologic-hydraulic processes that may occur and allows for the evaluation of the reservoir routing coefficient (RC). Exploiting this equation, an extensive sensitivity analysis based on the use of two simple parametric indices that depend on the storage capacity (SC) of the reservoir, the discharge capacity (DC) of the spillway (with fixed-crest) and the hydrologic behavior of the basin was performed.

Graphical Abstract

1. Introduction

In river basins characterized by the presence of large artificial reservoirs, the design and management of dams and spillways has to account for a complete analysis of flood routing. The routing process is influenced by hydraulic and morphological factors, including the characteristics of the spillway structure and the conformation of the valley, and it also depends significantly on the shape and volume of the inflow flood to the reservoir.
In this context, the literature provides works belonging to two main categories: those mainly focused on design criteria for spillways and dams (e.g., [1,2,3,4,5,6]) and those having, as a unique objective, the evaluation of the flood propagation downstream of the dam (e.g., [7,8,9,10,11]). In both cases, the volume of the flood plays an important role, but relatively few works analyze the effect of double-peak flow hydrographs on the routing reservoir process using a deterministic approach. Recent literature in this field proposes stochastic approaches providing reliable theoretical models that are still far from being applied by users in real contexts due to their complexity; in particular, in order to select the spillway length in a dam, Mediero et al. [12] propose a design flood hydrograph investigating the relationship between the flood peak and hydrograph volume, using a Monte Carlo approach.
Klein et al. [13] apply a Monte Carlo simulation approach to evaluate design floods by simulating the flood characteristics. Klein et al. [14] propose bivariate probability analyses of different flood variables using copulas, in order to overcome the problem that univariate probability analysis may lead to an overestimation or underestimation of the hydrological risk.
Flores-Montoya et al. [15] develop a new methodology to generate extreme hydrograph series using an event-based model, where a spatial-temporal synthetic rainfall generator is combined with a distributed physically based rainfall-runoff event-based model. Blazkova and Beven [16] apply a continuous simulation approach for the estimation of flood frequency for a dam in the Czech Republic; the methodology was implemented within a Generalized Likelihood Uncertainty Estimation framework. Micovic et al. [17] present a stochastic simulation of floods on a cascade system of three dams, showing that the dam overtopping is more likely to be caused by a combination of a smaller flood and a system component failure than by an extreme flood on its own.
Liu et al. [18] evaluated three stochastic mathematical models for calculation of the reservoir flood regulation process, the river course flood release, and the flood risk rate under flood control, based on the theory of stochastic differential equations and features of flood control systems in the middle reach of the Huaihe River.
Regarding the routing process of a single-peak hydrograph, several authors have proposed methodologies for a rapid evaluation of the routing effect, based on a schematic representation of natural processes. Many of these are based on the use of parametric indices for the evaluation of the routing coefficient (RC)(η) of a reservoir, defined as the ratio between the downstream and the upstream flood peak discharge [19,20,21,22,23].
More recently, Miotto et al. [24] have proposed a simplified procedure for the evaluation of the RC providing the formulation of a parametric index, called SFA (synthetic flood attenuation), which is obtained by the use of the reduction curve of flood peaks and is based on three geometrical quantities such as the area of the basin, the surface of the lake and the size of the fixed-crest spillway. By assessing the descriptive capacity of SFA, they have also shown that the position of the peak compared to the duration of the flood heavily influences the routing coefficient.
Following Miotto et al. [24], it is possible to reaffirm that, in this context, the use of the reduction curve of flood peaks [25,26], which can be obtained also from a suitable synthetic hydrograph [27], is certainly appropriate. Based on this, Magilligan and Nislow [10] pointed out that the flood wave shape has a small influence on the effect of routing, which, in the case of simplified hydrographs characterized by a single peak, is influenced by the type of spillway, the total volume of the flood and the peak flood discharge.
Therefore, the problem of assessing the routing effect in the case that the inflow flood is characterized by the presence of more than one consecutive peak, which is not so rare, and, in particular, when two peaks are present and the more significant peaks are shifted towards the end of the flood event, is still open. This consideration is implicitly accounted for in approaches based on continuous hydrological simulations. In particular, in order to evaluate the routing effect, a distributed hydrological model is used by Montaldo et al. [28], which performs a sensitivity analysis with respect to the hydrological parameters of the model. Balistrocchi et al. [29] propose a continuous simulation approach with the aim of accounting for a plurality of flood events, having different return periods, taking also into account their effective temporal sequence. They also use a precipitation stochastic model, combined with a simple rainfall-runoff transformation model and a schematic representation of the routing process, in order to verify the performance of the simplified model by comparing its results with those obtained from continuous simulations.
In parallel, in the context of reservoir management, several authors have developed models that use neural networks, fuzzy logic, genetic algorithms and decision support systems in order to provide a robust and efficient way to guide the design of such complex systems [30,31,32,33,34,35,36,37,38].
Beyond numerical analyses, the effect of floods characterized by multiple consecutive peaks is discussed in a phenomenological way by Klein et al. [13] and by Negede and Horlacher [39] who propose the use of stochastic methods for the determination of flood hydrographs characterized by consecutive peaks. It should be noted, however, that this issue was already discussed by Castorani and Piccinni [40]. They provided a deterministic analysis that exploits triangular flood hydrographs with two consecutive peaks. Moreover, they introduced six parametric indices accounting for the geometry of the spillway, the shape of the reservoir, and the duration of the inflow flood, in order to assess their effect on the routing coefficient.
This kind of approach allows for the identification of a flood design, both in the simplest case of the presence of only a single peak or in the case of the occurrence of a set of peak hydrographs which are defined when trying to reproduce the natural variability of flow. In this context, the proposed work is focused on the evaluation of the reservoir routing coefficient, considering an inflow flood characterized by two consecutive peaks; for this purpose, an analytical solution in a dimensionless form of the reservoir water balance equation that describes the hydrologic-hydraulic processes for an artificial reservoir was introduced, performing an extensive sensitivity analysis based on the use of two simple parametric indices which depend on the storage capacity (SC) of the reservoir, the discharge capacity (DC) of the spillway (with a fixed crest) and the hydrologic behavior of the basin.
In this way, an original methodology to deterministically analyze how two-peak floods affect an artificial reservoir is proposed; in particular, the proposed research provides a useful tool for practical utilization by users, such as dam managers, who frequently must deal (in ordinary or extraordinary conditions) with the case of the occurrence of one or two flood consecutive peaks. For this purpose, some assumptions were introduced in the model structure where some components are evaluated on the basis of known theoretical assumptions (e.g., the maximum entropy principle) which are always valid, trying to make the model analytically tractable and at the same time easy to use for dam managers or designers; the introduction of the dimensionless form of the water balance equation makes the methodology applicable for each assigned return period.

2. Methods

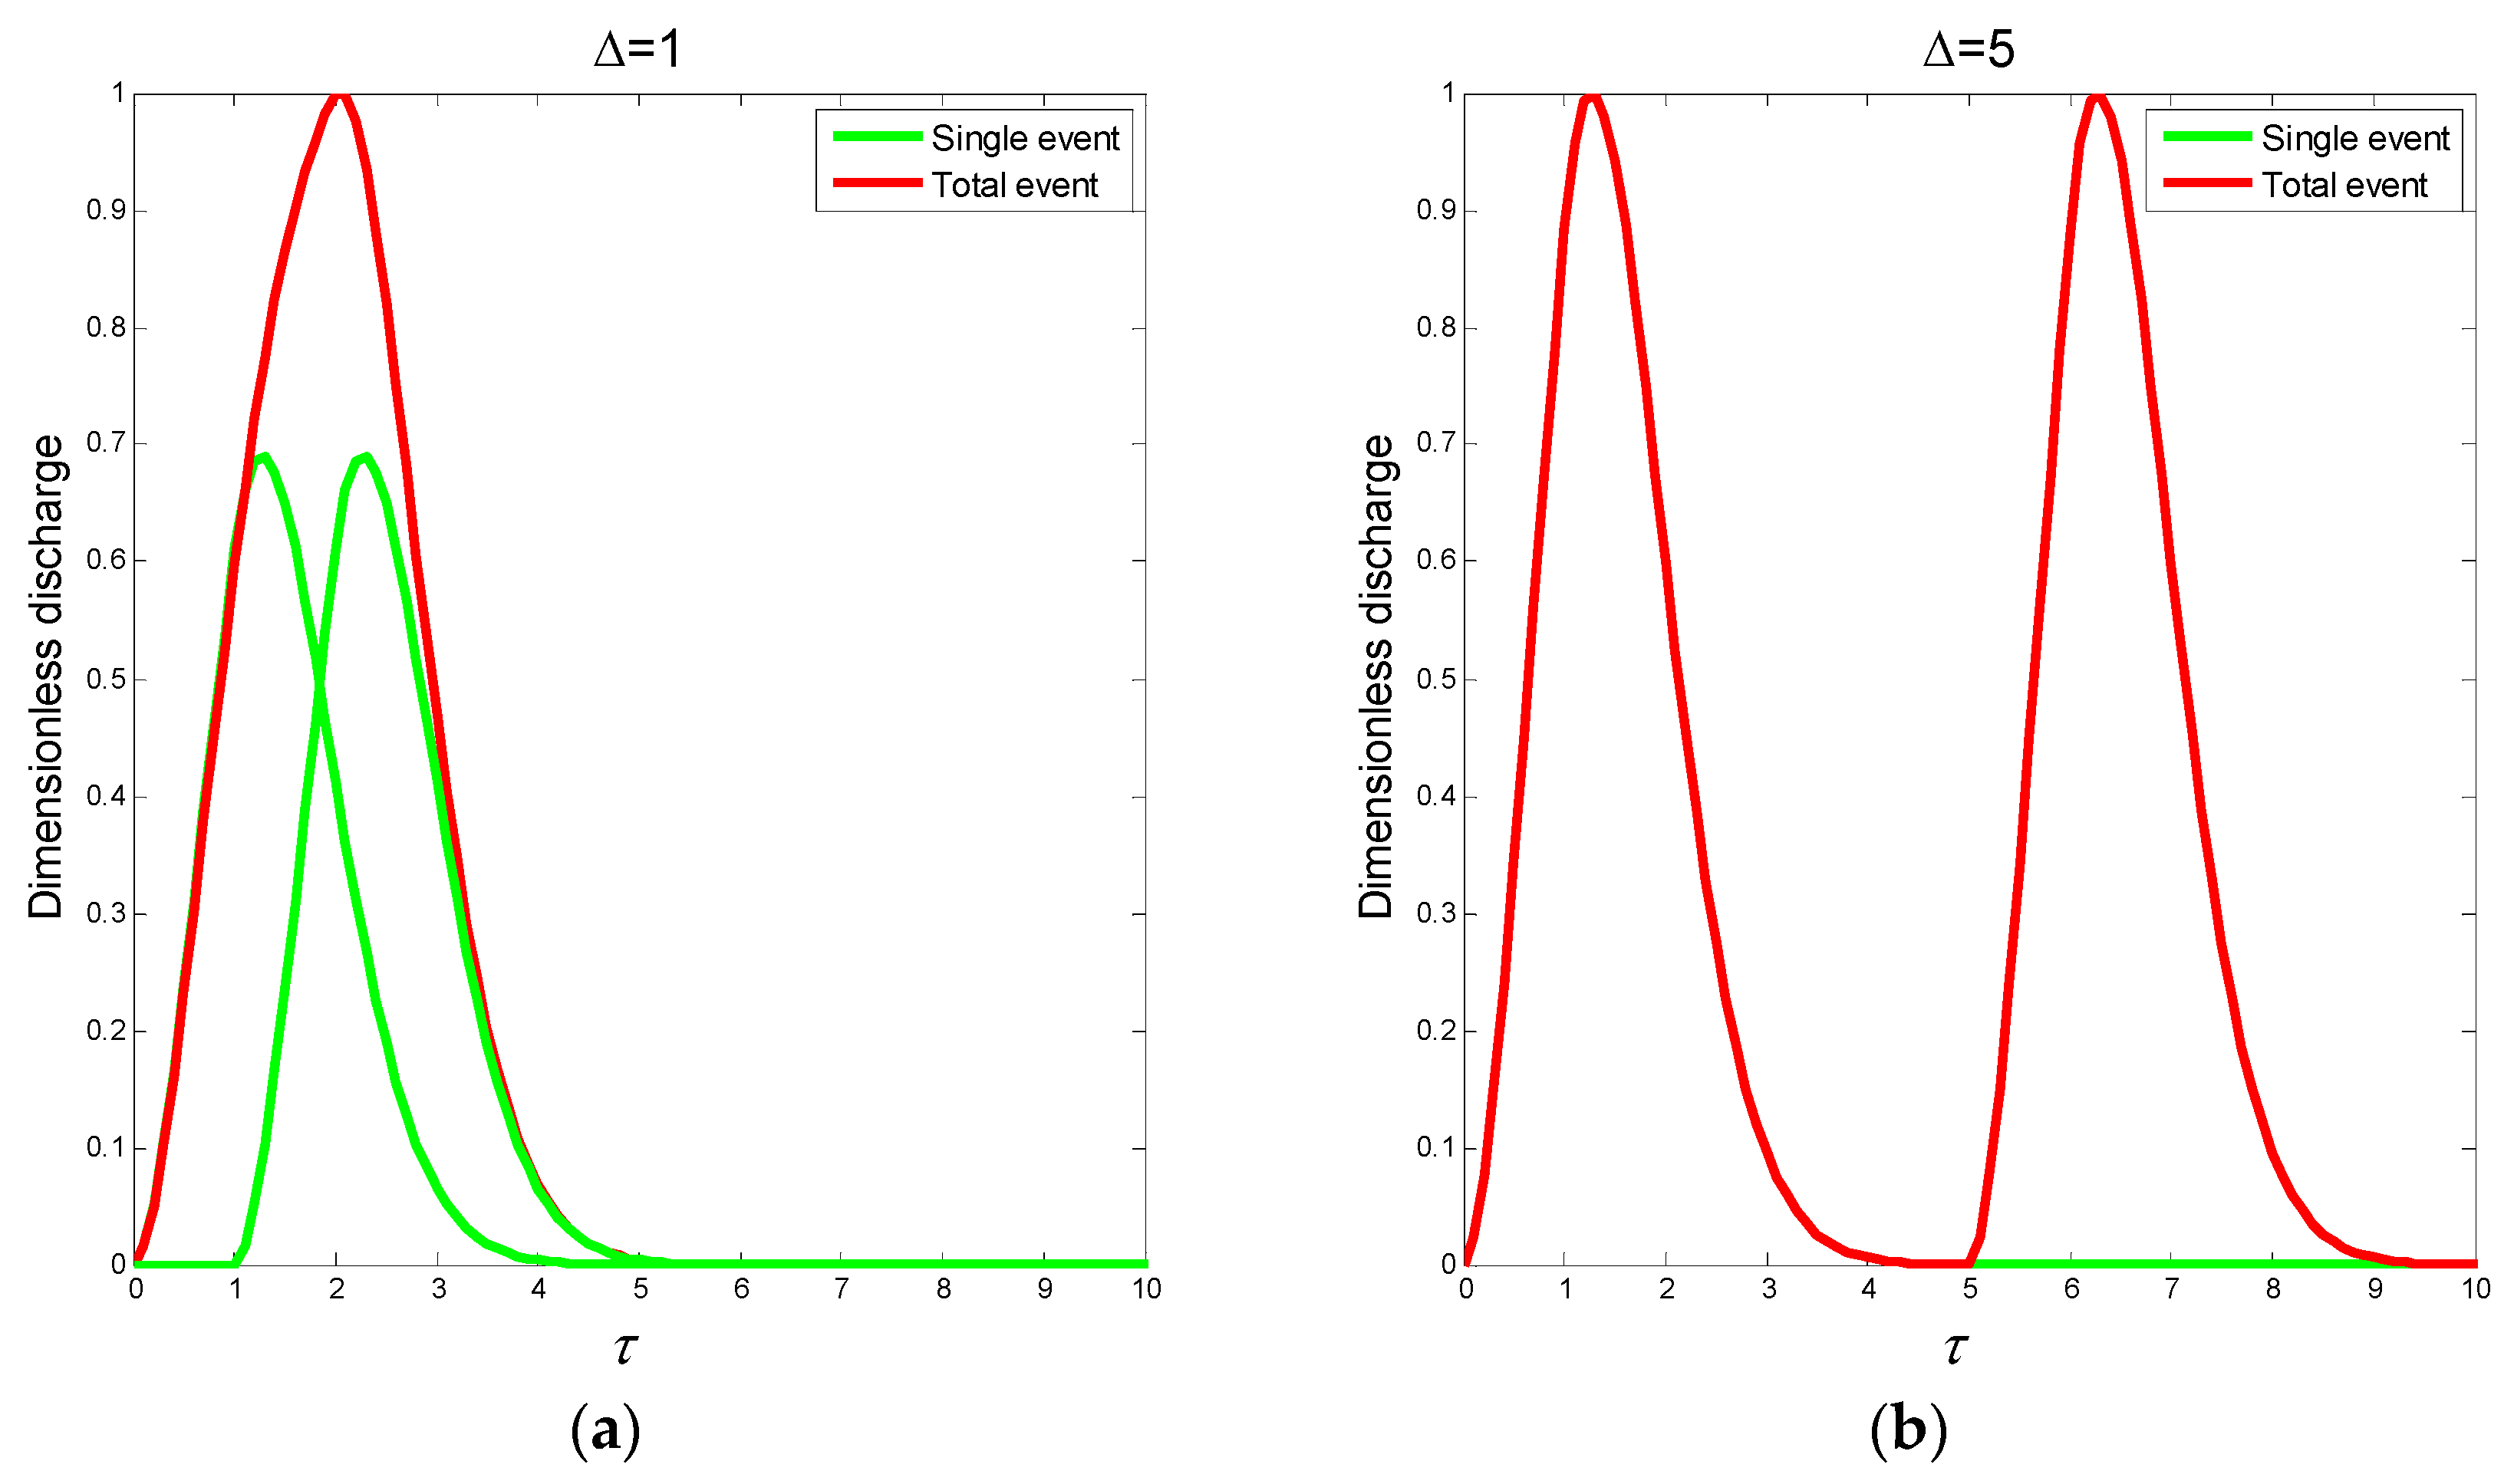
2.1. Dimensionless Double-Peak Flood

The design flood is usually defined as the most dangerous flood for a specific return period. Hence, the design flood has to account for different characteristics of the hydrograph: the peak discharge, shape and volume. In particular, the design flood should account, in the case of double peaks, for the position of the two peaks.
Once the design flood, which may include one or more peaks, is defined, it is possible to evaluate the effect of its routing by implementing the appropriate numerical analysis. In particular, the present research investigates the response of an artificial reservoir to an inflow characterized by a flood obtained from the superposition of two hydrographs, whose peaks are separated by a predetermined time interval. In this case, the present research analyzes a set of design floods obtained by varying the time shift between peaks in order to account for flood events characterized by two peaks, not independent, in which the second one is higher than the first one.
The hydraulic behavior of the reservoir spillway and the runoff formation process of the flood event upstream of the dam are described by a water balance equation, where some useful parametric indices are introduced with the aim of obtaining solutions that can be generalized.
The definition of the design flood consists of three simple steps:
(i)
analytical definition of a double-peak design flood based on the fractal instantaneous unit hydrograph (FIUH) of a river network (i.e., [41]);
(ii)
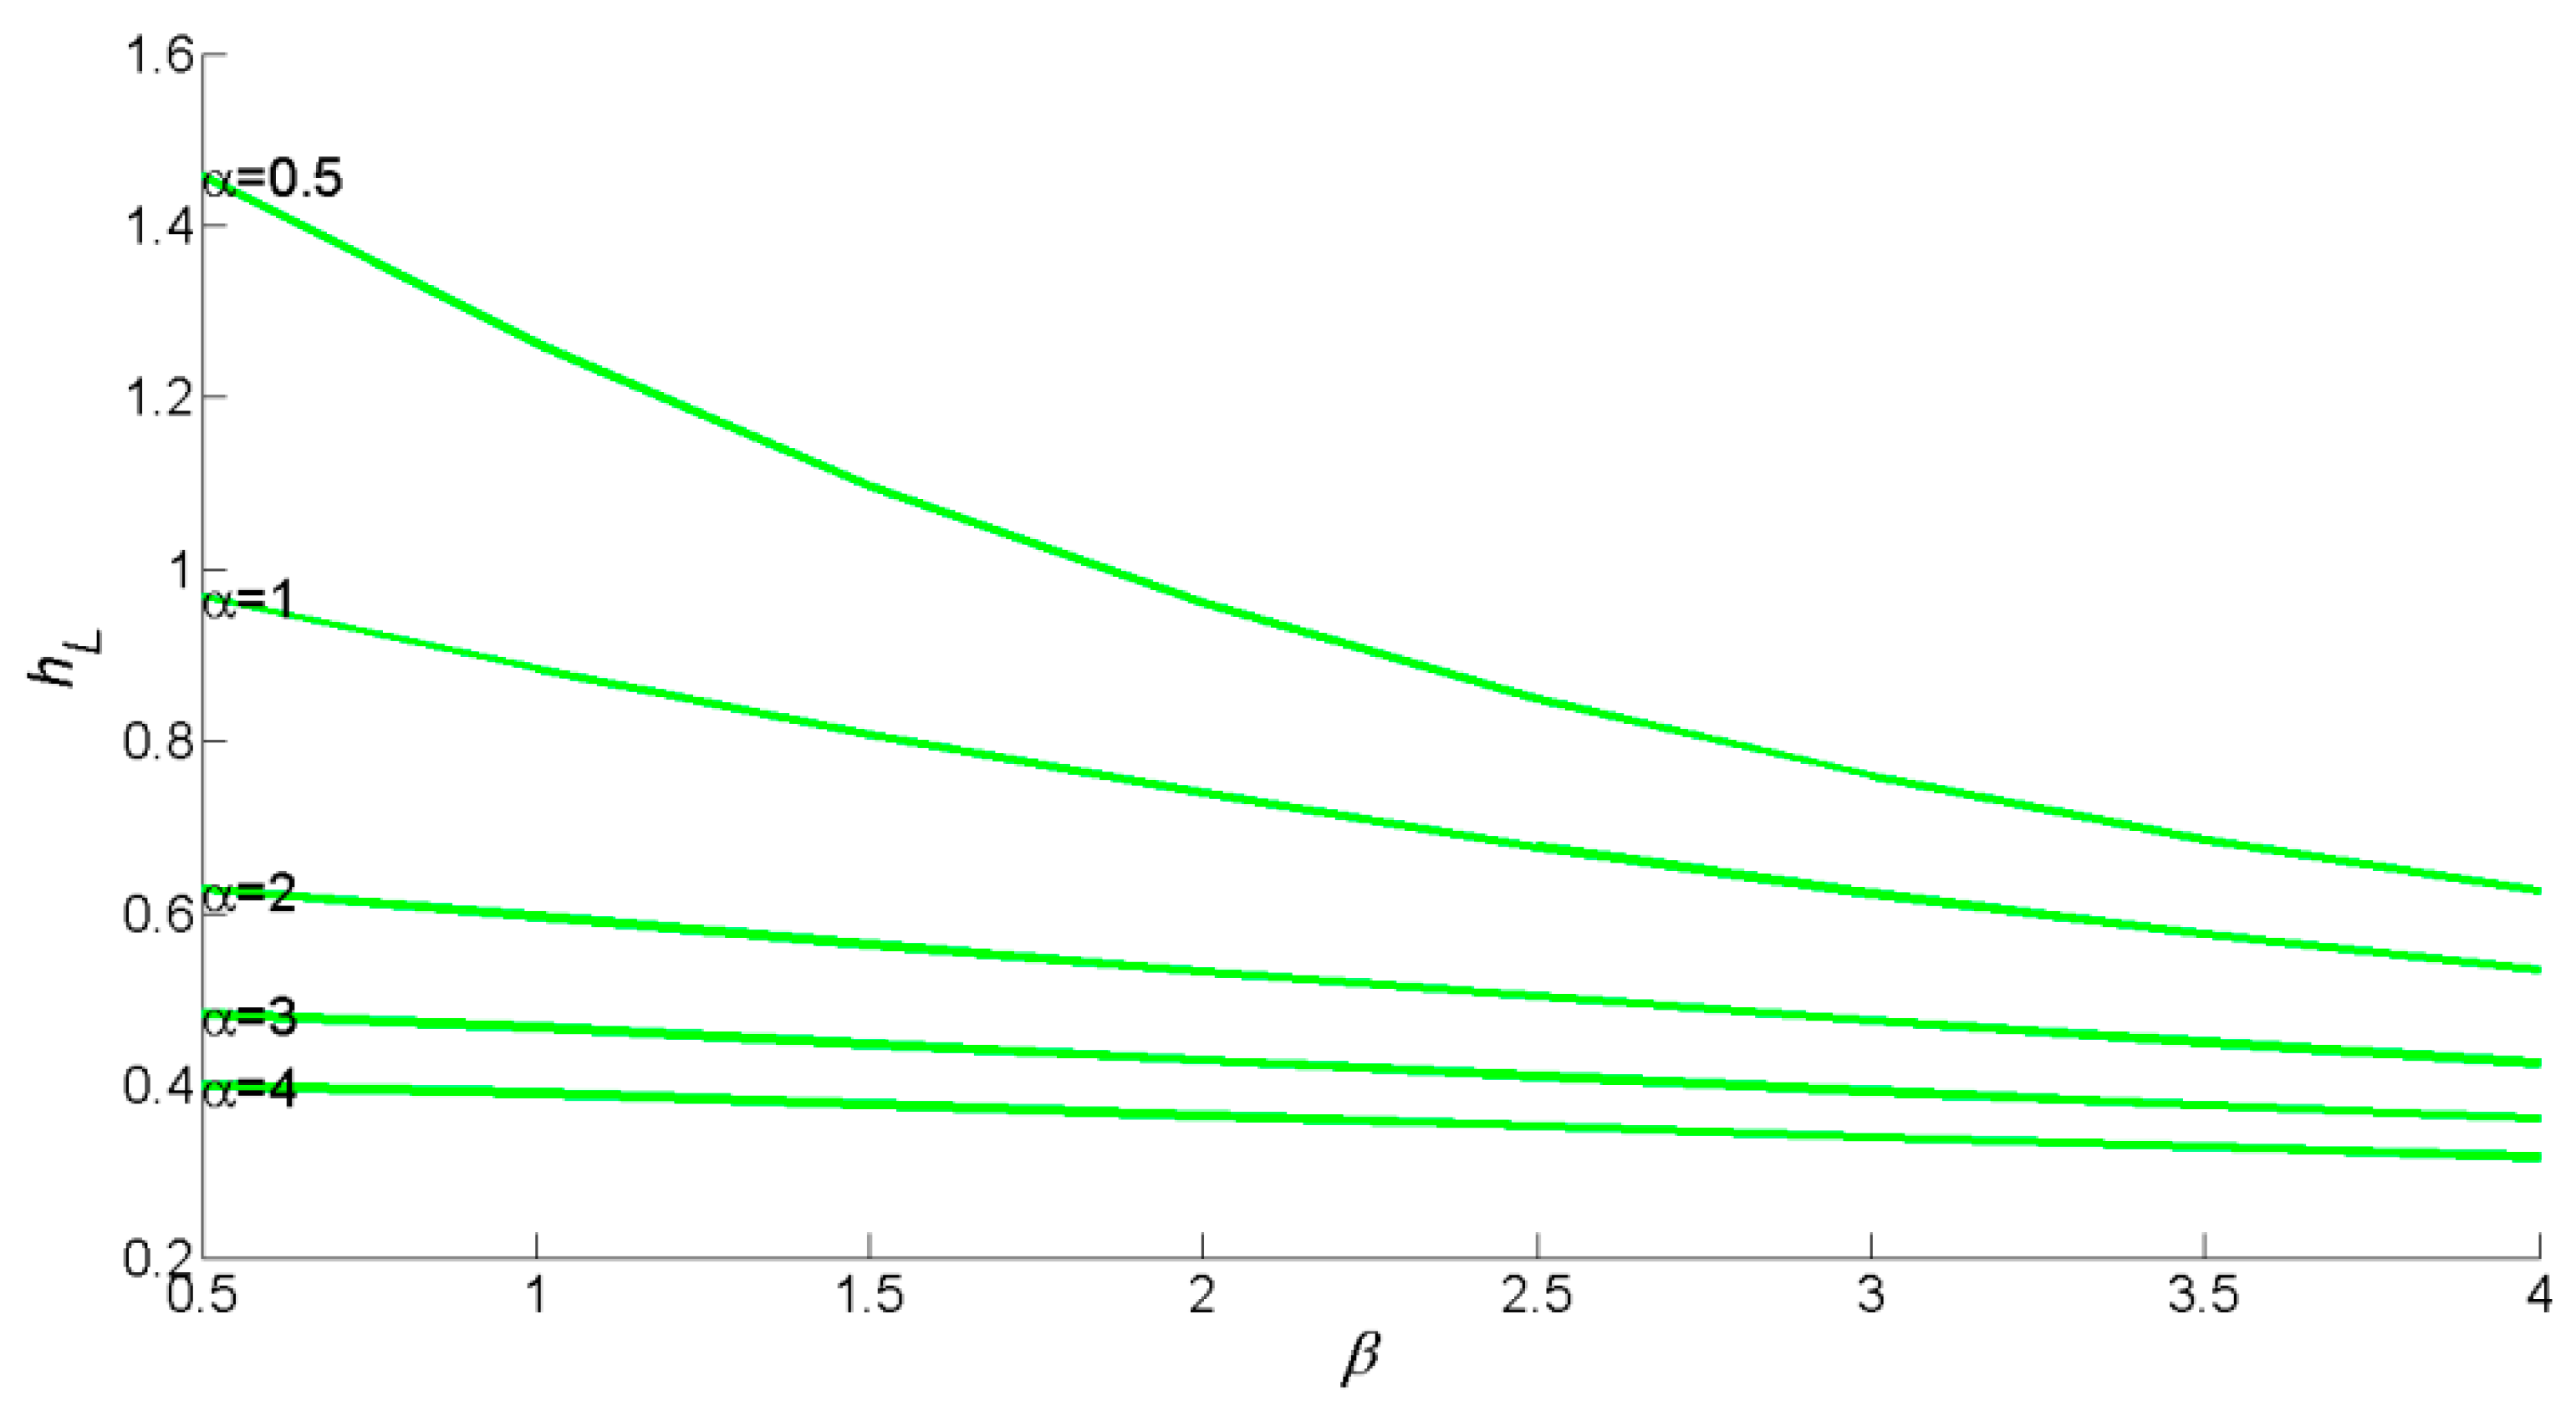
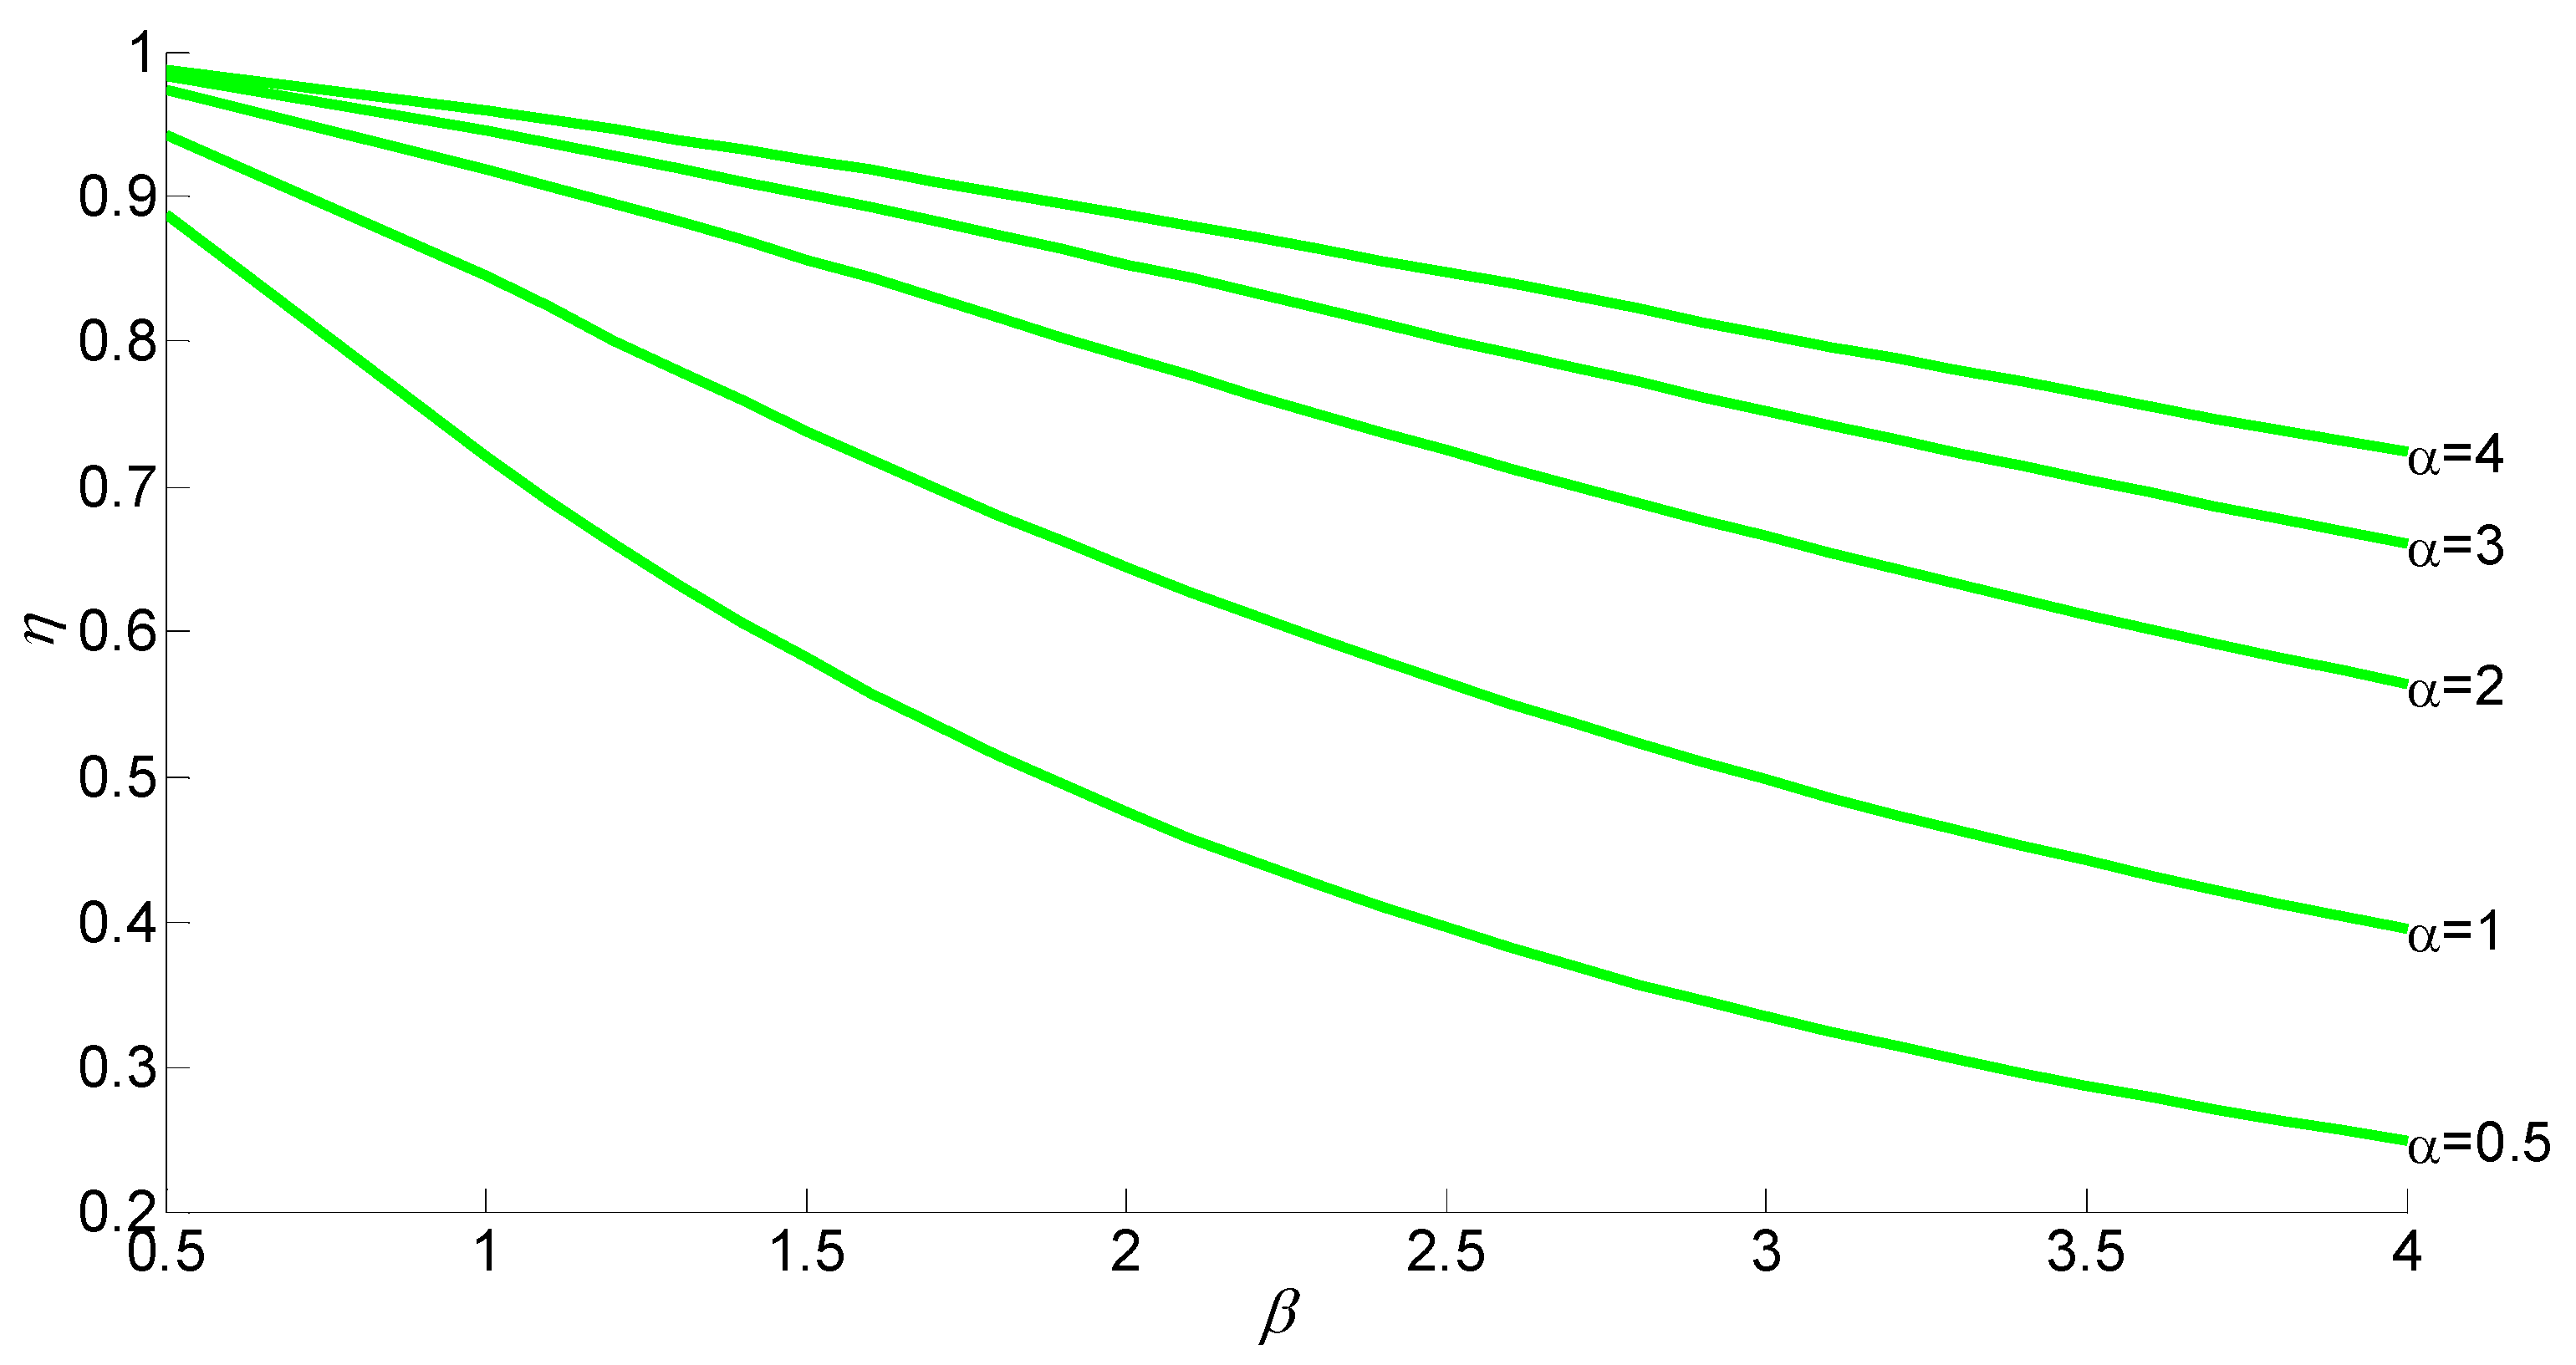
numerical solution of the differential equation that describes the dimensionless water balance of the reservoir, aimed to estimate the reservoir RC as a function of the morphological characteristics of the valley, and the DC of the spillway;
(iii)
numerical determination of the “critical” temporal distance between two consecutive peaks of the design flood aimed to find the maximum water level.
In order to provide a flood event characterized by two consecutive peaks we exploited the FIUH model, which in particular uses a Weibull distribution that has important theoretical properties: specifically, it is a maximum entropy distribution whose parameterization has been theoretically assessed by means of well-developed and accepted observations about the fractal properties of the hydrographic network [42].
The Weibull distribution provides an analytical expression easily tractable by users such as dam managers or designers; the analytical expression of this hydrograph is presented in Equation (1) and is parameterized according to the FIUH model (e.g., [41]), which introduces the shape parameter D (the fractal dimension of the hydrographic network) and the parameter k, which takes into account the basin lag-time.
f ( t ) = D k ( t k ) D 1 exp [ ( t k ) D ]   ,
where D is assumed equal to 1.75, a value that is observed with a certain regularity in natural river basins [43], while the parameter k can be estimated by assuming the first-order moment of the Weibull distribution equal to the lag-time tr of the basin, according to the following expression:
t r = k   Γ ( 1 + 1 D ) ,
where Г() is the gamma function.
The analytical solution of the convolution integral, in the case of a constant rainfall intensity with a duration equal to d, is given by the following equations [41]:
q e ( t ) = P ( d ) { 1 exp [ ( t k ) D ] } 0 t d ,
q e ( t ) = P ( d ) { exp [ ( t d k ) D ] exp [ ( t k ) D ] } t > d ,
where P(d) is the average net rainfall of an event characterized by constant intensity and a duration equal to d.
It is useful to point out that the Equations (3) and (4) provide a peak time tp, corresponding to a peak flow qe,max, which is greater than the duration of the precipitation. Assuming that the duration of the rainfall event, d, coincides with the basin lag-time tr, qe,max is then obtained by means of Equation (4) for t = tp and can be expressed by the following equation:
q e , max = P ( t r ) { exp [ ( t p t r 1 ) D Γ ( 1 + 1 D ) D ] exp [ ( t p t r ) D Γ ( 1 + 1 D ) D ] } .
The assumption that the rainfall event duration is equal to the basin lag-time tr is supported by Fiorentino et al. [44], who showed that, under different choices of the basin hydrologic response function, the critical duration approaches the lag time; the hypothesis that the time variability of the rainfall intensity can be neglected (e.g., [45,46,47,48,49]) within the critical duration is supported by the above quoted observation, considering that an event with a constant rainfall intensity, during the lag-time, is more precautionary with respect to other kinds of design hyetographs which include rainfall variability. Moreover, the context of application of the proposed model does not require the evaluation of the effects of the rainfall peak propagation as in urban contexts where the rainfall variability is more likely conditioning. Finally, this assumption makes the structure of the analytical solution simpler in order to be used by dam operator or dam designer.
Considering a linear behavior of the basin response, as assumed in the IUH theory, a double-peak design flood was obtained by summing two hydrographs characterized by the same peak discharge (qe,max) separated in time by a time interval. The resulting hydrograph, depending on the shift between the two hydrographs, may provide a single larger peak (see Figure 1) or two separate different peaks. The analytical relationship between the largest discharge of the entire flood (Qmax) and qe,max is written as:
Q max = q e , max { 1 + exp [ ( Δ f ( D ) Γ ( 1 + 1 D ) ) D ] } ,
where Δ is the ratio between the time shift of the two hydrographs and the basin lag-time tr, D is the fractal dimension of the stream network, and finally the function f(D) = 0.173D + 0.48 was obtained by numerically minimizing (using different values of D) the difference between the maximum value (Qmax) of the resulting flood hydrograph obtained using the analytical relationship in Equation (6), and that was numerically estimated using the function obtained by shifting the two hydrographs, qe(t), by a time shift equal to Δ*tr. More specifically, the function f(D) assumes a value equal to 0.78 for D = 1.75 and was obtained by using a range of values between those (ranging between 1.5 and 2) indicated in recent literature (e.g., [43,50,51,52]).
Starting from Equations (5) and (6), and assuming τ = t/tr, it is possible to write Equations (3) and (4) in dimensionless form:
q e ¯ ( τ ) = q e ( τ ) Q max = { 1 exp [ ( τ   Γ ( 1 + 1 D ) ) D ] } { exp [ ( τ p 1 ) D Γ ( 1 + 1 D ) D ] exp [ ( τ p ) D Γ ( 1 + 1 D ) D ] } { 1 + exp [ ( Δ f ( D ) Γ ( 1 + 1 D ) ) D ] } 0 τ 1 ,
q e ¯ ( τ ) = q e ( τ ) Q max = { exp [ ( ( τ 1 ) Γ ( 1 + 1 D ) ) D ] exp [ ( ( τ ) Γ ( 1 + 1 D ) ) D ] } { exp [ ( τ p 1 ) D Γ ( 1 + 1 D ) D ] exp [ ( τ p ) D Γ ( 1 + 1 D ) D ] } { 1 + exp [ ( Δ f ( D ) Γ ( 1 + 1 D ) ) D ] } τ > 1 ,
Therefore, the resulting dimensionless flood hydrograph is equal to:
Q ¯ e   ( τ ) = q e ¯ ( τ ) + q e ¯ ( τ Δ ) with max ( Q ¯ e   ( τ ) ) = 1 .
The dimensionless form of the water balance equation provides an analytical solution that is independent from the return period, being the resulting hydrograph, dependent on the shift between the two hydrographs, normalized by the largest discharge of the entire flood (Qmax = QT) directly related to the return period; this approach makes the methodology applicable for each assigned return period.

2.2. Dimensionless Reservoir Water Balance

The water balance equation of the reservoir can be written:
q e ( t ) q u ( t ) = dV ( t ) dt = V o dh ( t ) dt .
where qe(t) and qu(t) represent, respectively, the inflow and outflow discharge, V(t) is the volume stored at time t in the reservoir, h(t) is the water level at time t, evaluated with respect to the fixed-crest spillway and Vo is the SC per units of water depth which is assumed constant and equal to the value of the reservoir surface area at the fixed-crest spillway level. We assume that in the initial conditions, the reservoir surface is at the spillway crest level and the outflow discharge is qu(0) = 0.
The outflow from the reservoir is, of course, influenced by the geometry of the spillway which was assumed as a free fixed crest of length l and the discharge coefficient μ; the free fixed-crest spillway is able to release a flow rate equal to:
q u ( t ) = μ · l · h ( t ) 3 2 · 2 · g ,
where h(t) represents the water depth on the fixed-crest spillway, equal to the difference between the water level in the reservoir at time t and the maximum regulation water level of the reservoir.
Considering the hydrograph Q ¯ e   ( τ ) as the inflow, the reservoir water balance Equation (10) can be rewritten in dimensionless form as reported below:
Q ¯ e   ( τ ) d τ Q ¯ u   ( τ ) d τ β dh = 0 ,
where
Q ¯ u   ( τ ) = q u ( τ ) Q max =   α   h ( τ ) 3 2 ,
two parametric indices are introduced, α [m−3/2] and β [m−1]:
α = μ   l   2 g Q max ,   and   β = V 0 Q max   t r
where α represents the ratio between the flow rate released by a spillway of length l with a hydraulic head of 1 m and the maximum flood peak value Qmax, and β is the ratio between the volume stored in the valley per 1 m of water level and the volume of a triangular hydrograph with the peak flow equal to the maximum flood peak and a duration equal to 2tr.
Equation (12) is a differential equation that can be easily solved, allowing us to obtain the Qu(τ) and h(τ) functions as those shown, for example, in Figure 2.

3. Evaluation of the Dimensionless Design Double-Peak Flood and Discussion

The numerical solution of the dimensionless balance in Equation (12) allows us to evaluate the influence of the α, β and Δ parameters on the flood routing process. To this end, an appropriate sensitivity analysis was carried out, aimed at investigating the influence generated by each of the three parameters on the routing process, varying their values within a suitable range of real conditions.
Specifically, we considered that the parameters α and β range between 0.5 and 4 (e.g., [21,40]) where different case studies located in Italy were considered, whereas the parameter Δ ranges between 1 and 5. These values are still observable in real case studies such as the Occhito Dam (located in the Puglia Region, southern Italy) where α = 1.57 and β = 2.78, the Montecotugno Dam (located in the Basilicata Region, southern Italy) where α = 0.87 and β = 5.22, the Pertusillo Dam (located in the Basilicata Region, southern Italy) where α = 2.75 and β = 2.60, and the Liscione Dam (located in Molise, southern Italy) where α = 0.96 and β = 2.01.
Figure 3 shows the flood hydrographs, in dimensionless form, derived by assuming that the dimensionless time shift between the two peaks (Δ) is equal to 1 or to 5, respectively, with the minimum and the maximum value used. It can be noted that for Δ = 1, corresponding to two hydrographs whose peaks are separated in time by tr, the resulting flood is characterized by only one peak, while Δ = 5 produces a resulting flood without any overlap between the two single hydrographs.
The results of the sensitivity analysis are reported in Figure 4 and Figure 5. In particular, Figure 4 shows, for different fixed values of α (0.5, 1, 2, 3, 4) and β varying between 0.5 and 4, the curve representing the Δ value which maximizes the water level hL. In other words, the curves display the “critical” dimensionless time interval between consecutive peaks.
It is worth noting that the double-peak design flood for a given return period T is provided here by Equations (7) and (8), where Qmax = QT, the peak discharge of a given return period, and Δ assumes the critical value shown in Figure 4, for α = μ   l   2 g Q T and β = V 0 Q T   t r .
The curves show that for any fixed value of α, an increase of the reservoir SC (greater β) corresponds to an increase of the critical Δ, while for any fixed value of β, an increase of the DC of the spillway (greater α) provides a decrease of the critical Δ.
Figure 5 shows the maximum water level (hL) obtained for different fixed values of α and a variable β. It is worth noting that hL decreases while increasing β. This negative trend is more pronounced for smaller values of α. For a fixed value of α, a reservoir characterized by a small storage capacity generates a higher water level than one with a large storage capacity. On the other hand, for a fixed value of β, an increase of the spillway DC reduces the maximum water level.
Finally, Figure 6 shows the dependence of the reservoir routing effect on α and β. In particular, the curves report the value of η, which is the ratio between the maximum value of the spillway flow rate and the maximum peak flow rate into the lake. In this case, the reservoir routing effect η decreases for higher values of β and this negative trend is more evident for lower values of α. In fact, for a fixed value of α, a reservoir characterized by a larger storage volume (higher β) has a greater routing capacity (η decreases) with respect to a reservoir having small SC (lower β). On the other hand, for a fixed value of β, increasing the spillway DC (i.e., increasing α) leads to an increase of η and consequently to a smaller routing effect.
It is interesting to point out that the two parameters α and β are able to be used in real applications when, for example, the user (such as a dam manager or dam designer) needs to know the maximum routing elevation hL (see Figure 5) and the routing capacity η (see Figure 6); in this case, the routing effect may be evaluated using Figure 5 and Figure 6, starting from the hydrologic behavior of the basin (tr, Qmax), the SC of the reservoir (Vo) and the length (l) of the spillway (see Equation(14)). On the other hand, the performed sensitivity analysis may also be useful for dam designing, evaluating in particular the DC of the spillway α (see Figure 4), starting from the SC of the reservoir (Vo), the hydrologic behavior of the basin (tr, Qmax) and the shift between the two peaks Δ. This gives a strong contribution to applied research, allowing the realistic application of the proposed research.

4. Conclusions

The paper proposes a dimensionless parametric model that can be useful to evaluate the routing effect of an artificial reservoir, with reference to a flood event characterized by two consecutive peaks. In particular, based on a simplified representation of the hydrological conditions that may lead to a superposition of two peaks, we analyze the effects of the combination between the hydrological flow regime, the reservoir SC and the spillway’s discharge capacity.
We performed a sensitivity analysis and the results illustrated in Figure 4, Figure 5 and Figure 6 may also allow a simple estimation of the expected RC for a design flood with a given return period T, obtained by considering two consecutive peaks.
It should be noted that, unlike some of the studies previously cited, in this work the evaluation of the probability associated with the occurrence of a flood event, combined as a superposition of two flood hydrographs, has not been considered. This evaluation is, in the opinion of the writer, almost impossible and affected by non-quantified uncertainty. In fact, the probability of the occurrence of more consecutive peaks depends on the space-time rainfall structure, and also on the consequent dynamic evolution of the soil moisture state of the basin. Such a probabilistic representation should account for the joint distribution of several random variables (not independent from each other) whose behavior is still unknown even if considering their marginal distribution.
Therefore, the paper proposes a deterministic solution of the dimensionless balance equation which describes the reservoir routing process, based on a sensitivity analysis extended to a wide range of parameters that influence the reservoir water balance and providing, at the same time, the critical condition, i.e., the highest water level provided by a flood peak QT of a given return period. In this way the present research provides the most dangerous conditions that may occur in a river basin resulting from the combined effects of the hydrological behavior of the basin, the reservoir SC and the spillway discharge capacity.
The results obtained are provided in plots that show the dependence of the reservoir RC on two simple parametric indices (α and β).
This manuscript proposes an original methodology to deterministically analyze how two-peak floods affect an artificial reservoir, introducing (as a novelty with respect to recent literature) a simple analytical relationship with dimensionless parametric coefficients able to be exploited by users (such as a dam manager or dam designer) for practical utilization, in the case of the occurrence of one or two flood consecutive peaks; the proposed methodology may be easily extended to multiple-peak floods in future research.
The approach used in this research certainly deserves improvements and better insights; nevertheless, it shows the potential of a physically based representation of a complex hydrological-hydraulic system, which allows us to account, in a simple way, for multiple-peak floods, whose occurrence is still relatively poorly investigated in relation to practical design procedures.

Acknowledgments

The funds for covering the costs to publish in open access were received from the Department of Civil Engineering, Environment, Territory, Building and Chemistry (DICATECh)—Politecnico di Bari.

Conflicts of Interest

The author declares no conflict of interest.

Abbreviations

RCrouting coefficient
SCstorage capacity
DCdischarge capacity
SFAsynthetic flood attenuation

References

  1. Bagatur, T.; Onen, F. Computation of design coefficients in ogee-crested spillway structure using GEP and regression models. KSCE J. Civ. Eng. 2016, 20, 951–959. [Google Scholar] [CrossRef]
  2. Savage, B.; Johnson, M. Flow over ogee spillway: Physical and numerical model case study. J. Hydraul. Eng. 2001, 127, 640–649. [Google Scholar] [CrossRef]
  3. U.S. Army Corp of Engineers (USACE). Hydraulic Design of Spillways; EM 1110-2-1603; Department of the Army: Washington, DC, USA, 1990. [Google Scholar]
  4. Gonzalez, C.A.; Chanson, H. Hydraulic Design of Stepped Spillways and Downstream Energy Dissipators for Embankment Dams. Dam Eng. 2007, 17, 223–244. [Google Scholar]
  5. Ohtsu, I.; Yasuda, Y.; Takahashi, M. Flow Characteristics of Skimming Flows in Stepped Channels. J. Hydraul. Eng. 2004, 130, 860–869. [Google Scholar] [CrossRef] [Green Version]
  6. Johnson, M.; Savage, B. Physical and Numerical Comparison of Flow over Ogee Spillway in the Presence of Tailwater. J. Hydraul. Eng. 2006, 132, 1353–1357. [Google Scholar] [CrossRef]
  7. Graf, W.L. Downstream hydrologic and geomorphic effects of large dams on American rivers. Geomorphology 2006, 79, 336–360. [Google Scholar] [CrossRef]
  8. Cheng, C.T.; Chau, K.W. Flood control management system for reservoirs. Environ. Model. Softw. 2004, 19, 1141–1150. [Google Scholar] [CrossRef]
  9. Chang, L.C. Guiding rational reservoir flood operation using penalty-type genetic algorithm. J. Hydrol. 2008, 354, 65–74. [Google Scholar] [CrossRef]
  10. Magilligan, F.J.; Nislow, K.H. Changes in hydrologic regime by dams. Geomorphology 2005, 71, 61–78. [Google Scholar] [CrossRef]
  11. Collier, M.; Webb, R.H.; Schmidt, J.C. Dams and Rivers: Primer on the Downstream Effects of Dams; U.S. Geological Survey Circular; U.S. Geological Survey: Tucson, AZ, USA, 1996; Volume 1126, p. 94.
  12. Mediero, L.; Jiménez-Álvarez, A.; Garrote, L. Design flood hydrographs from the relationship between flood peak and volume. International Workshop. Hydrol. Earth Syst. Sci. 2010, 14, 2495–2505. [Google Scholar] [CrossRef] [Green Version]
  13. Klein, B.; Schumann, A.; Pahlow, M. Stochastic Generation of Hydrographs for the Flood Design of Dams. In Proceedings of the 3rd International Symposium on Integrated Water Resources Management, Ruhr-University Bochum, Bochum, Germany, 26–28 September 2006.
  14. Klein, B.; Pahlow, M.; Hundecha, Y.; Schumann, A. Probability Analysis of Hydrological Loads for the Design of Flood Control Systems Using Copulas. J. Hydrol. Eng. 2010, 15, 360–369. [Google Scholar] [CrossRef]
  15. Flores-Montoya, I.; Sordo-Ward, Á.; Mediero, L.; Garrote, L. Fully Stochastic Distributed Methodology for Multivariate Flood Frequency Analysis. Water 2016, 8, 225. [Google Scholar] [CrossRef]
  16. Blazkova, S.; Beven, K. Flood frequency estimation by continuous simulation of subcatchment rainfalls and discharges with the aim of improving dam safety assessment in a large basin in the Czech Republic. J. Hydrol. 2004, 292, 153–172. [Google Scholar] [CrossRef]
  17. Micovic, Z.; Hartford, D.N.; Schaefer, M.G.; Barker, B.L. A non-traditional approach to the analysis of flood hazard for dams. Stoch. Environ. Res. Risk Assess. 2016, 30, 559–581. [Google Scholar] [CrossRef]
  18. Liu, D.; Xie, B.; Li, H. Design Flood Volume of the Three Gorges Dam Project. J. Hydrol. Eng. 2011, 16, 71–80. [Google Scholar] [CrossRef]
  19. Marone, V. Calcolo di massima dell’effetto di laminazione di un serbatoio sulle piene. L’energia Elettrica 1964, 41, 693–698. (In Italian) [Google Scholar]
  20. Marone, V. Calcolo di massima di un serbatoio di laminazione. L’Energia Elettrica 1971, 48, 561–567. (In Italian) [Google Scholar]
  21. Damiani, P.; Di Santo, A. Valutazione del volume di laminazione di un’onda di piena per il dimensionamento degli scarichi di superficie. Idrotecnica 1986, 4, 231–238. (In Italian) [Google Scholar]
  22. Scarrott, R.M.J.; Reed, D.W.; Bayliss, A.C. Indexing the attenuation effect attributable to reservoirs and lakes. In Statistical Procedures for Flood Frequency Estimation; Robson, A., Reed, D., Eds.; Flood Estimation Handbook; Centre for Ecology & Hydrology: Wallingford, UK, 1999; Volume 5, pp. 19–26. [Google Scholar]
  23. Piga, E.; Saba, A.; Salis, F.; Sechi, G.M. Distribuzione probabilistica delle portate massime annue laminate da un invaso con sfioratore superficiale. In Proceedings of the XXVII Convegno di Idraulica e Costruzioni Idrauliche, Genova, Italy, 12–15 September 2000; Volume 3, pp. 85–92. (In Italian)
  24. Miotto, F.; Laio, F.; Claps, P. Metodologie speditive per la valutazione dell’effetto di laminazione dei grandi invasi. In Proceedings of the XXX Convegno di Idraulica e Costruzioni Idrauliche, Roma, Italy, 10–15 September 2006. (In Italian)
  25. Pianese, D.; Rossi, F. Curve di possibilità di laminazione delle piene. Giornale Genio Civile 1986, 4–6, 131–148. (In Italian) [Google Scholar]
  26. Fiorentino, M.; Margiotta, M.R. La valutazione dei volumi di piena e il calcolo semplificato dell’effetto di laminazione di grandi invasi. In Proceedings of the XIV Corso di Aggiornamento Sulle Tecniche per la Difesa Dall’inquinamento, Cosenza, Italy, 28–30 June 1998. (In Italian)
  27. Fiorentino, M. La valutazione dei volumi di piena nelle reti di drenaggio urbano. Idrotecnica 1985, 3, 141–152. (In Italian) [Google Scholar]
  28. Montaldo, M.; Mancini, M.; Rosso, R. Flood hydrograph attenuation induced by a reservoir system: Analysis with a distributed rainfall-runoff model. Hydrol. Process. 2004, 18, 545–563. [Google Scholar] [CrossRef]
  29. Balistrocchi, M.; Bacchi, B.; Grossi, G. Stima delle prestazioni di una vasca di laminazione: Confronto tra simulazioni continue e metodi analitico-probabilistici. In Proceedings of the XXXII Convegno Nazionale di Idraulica e Costruzioni Idrauliche, Palermo, Italy, 14–17 September 2010. (In Italian)
  30. Liu, P.; Guo, S.L.; Xiong, L.H.; Li, W.; Zhang, H.G. Deriving reservoir refill operating rules by using the proposed DPNS model. Water Resour. Manag. 2006, 20, 337–357. [Google Scholar] [CrossRef]
  31. Hsu, N.S.; Wei, C.C. A multipurpose reservoir real-time operation model for flood control during typhoon invasion. J. Hydrol. 2007, 336, 282–293. [Google Scholar] [CrossRef]
  32. Wei, C.C.; Hsu, N.S. Optimal tree-based release rules for real-time flood control operations on a multipurpose multi reservoir system. J. Hydrol. 2009, 365, 213–224. [Google Scholar] [CrossRef]
  33. Mediero, L.; Garrote, L.; Martin-Carrasco, F. A probabilistic model to support reservoir operation decisions during flash floods. J. Hydrol. Sci. 2007, 52, 523–537. [Google Scholar] [CrossRef]
  34. Karbowski, A.; Malinowski, K.; Niewiadomska–Szynkiewicz, E. A hybrid analytic/rule-based approach to reservoir system management during flood. Decis. Support Syst. 2005, 38, 599–610. [Google Scholar] [CrossRef]
  35. Karaboga, D.; Bagis, A.; Haktanir, T. Controlling spillway gates of dams by using fuzzy logic controller with optimum rule number. Appl. Soft Comput. 2008, 8, 232–238. [Google Scholar] [CrossRef]
  36. Wardlaw, R.; Sharif, M. Evaluation of genetic algorithms for optimal reservoir system operation. J. Water Resour. Plan. Manag. 1999, 125, 25–33. [Google Scholar] [CrossRef]
  37. Akter, T.; Simonovic, S.P. Modeling uncertainties in short-term reservoir operation using fuzzy sets and a genetic algorithm. Hydrol. Sci. J. 2004, 49, 1081–1097. [Google Scholar] [CrossRef]
  38. Zahraie, B.; Kerachian, R.; Malekmohammadi, B. Reservoir operation optimization using adaptive varying chromosome length genetic algorithm. Water Int. 2008, 33, 380–391. [Google Scholar] [CrossRef]
  39. Negede, A.K.; Horlacher, H.B. Approaches for Dam Overtopping Probability Evaluation. In Proceedings of the 33rd IAHR Congress: Water Engineering for a Sustainable Environment, Vancouver, BC, Canada, 9–14 August 2009.
  40. Castorani, A.; Piccinni, A.F. The influence of a runoff hydrograph in reservoir routing. In Proceedings of the Fifth Congress Asian and Pacific Regional Division of the International Association for Hydraulic Research, Seoul, Korea, 18–20 August 1986.
  41. Fiorentino, M.; Oliveto, G.; Rossi, A. Alcuni aspetti del controllo energetico ed idrologico sulla geometria delle reti e delle sezioni fluviali. Parte Prima: Controllo idrologico. In Proceedings of the XXVIII Convegno di Idraulica e Costruzioni Idrauliche, Potenza, Italy, 16–19 September 2002. (In Italian)
  42. Veneziano, D.; Iacobellis, V. Self-Similarity and Multifractality of Topographic Surfaces at Basin and Sub-Basin Scales. J. Geophys. Res. 1999, 104, 12797–12813. [Google Scholar] [CrossRef]
  43. Claps, P.; Oliveto, G. Re-examining the determination of the fractal dimension of river networks. Water Resour. Res. 1996, 32, 3123–3135. [Google Scholar] [CrossRef]
  44. Fiorentino, M.; Rossi, F.; Villani, P. Effect of the basin geomorphoclimatic characteristics on the mean annual flood reduction curve. In Proceedings of the 18th Annual Conference on Modeling and Simulation, Pittsburgh, PA, USA, 23–24 April 1987; pp. 1777–1784.
  45. Iacobellis, V.; Fiorentino, M. Derived distribution of floods based on the concept of partial area coverage with a climatic appeal. Water Resour. Res. 2000, 36, 469–482. [Google Scholar] [CrossRef]
  46. Fiorentino, M.; Gioia, A.; Iacobellis, V.; Manfreda, S. Regional analysis of runoff thresholds behavior in Southern Italy based on theoretically derived distributions. Adv. Geosci. 2011, 26, 139–144. [Google Scholar] [CrossRef] [Green Version]
  47. Gioia, A.; Iacobellis, V.; Manfreda, S.; Fiorentino, M. Influence of infiltration and soil storage capacity on the skewness of the annual maximum flood peaks in a theoretically derived distribution. Hydrol. Earth Syst. Sci. 2012, 16, 937–951. [Google Scholar] [CrossRef]
  48. Iacobellis, V.; Castorani, A.; Di Santo, A.R.; Gioia, A. Rationale for flood prediction in karst endorheic areas. J. Arid Environ. 2015, 112, 98–108. [Google Scholar] [CrossRef]
  49. Iacobellis, V.; Claps, P.; Fiorentino, M. Climatic control on the variability of flood distribution. Hydrol. Earth Syst. Sci. 2002, 6, 229–237. [Google Scholar] [CrossRef]
  50. Fac-Beneda, J. Fractal structure of the Kashubian hydrographic system. J. Hydrol. 2013, 488, 48–54. [Google Scholar] [CrossRef]
  51. De Bartolo, S.G.; Gaudio, R.; Gabriele, S. Multifractal analysis of river networks: Sandbox approach. Water Resour. Res. 2004, 40, 183–188. [Google Scholar] [CrossRef]
  52. Donadio, C.; Magdaleno, F.; Mazzarella, A.; Kondolf, G.M. Fractal Dimension of the Hydrographic Pattern of Three Large Rivers in the Mediterranean Morphoclimatic System: Geomorphologic Interpretation of Russian (USA), Ebro (Spain) and Volturno (Italy) Fluvial Geometry. Pure Appl. Geophys. 2015, 172, 1975–1984. [Google Scholar] [CrossRef]
Figure 1. Composition of the dimensionless flood hydrograph, starting from the two single flood hydrographs with a fixed time shift.
Water 08 00553 g001
Figure 2. Inflow and outflow functions of the reservoir balance equation in dimensionless form, for DC α = 4, SC β = 4 and time shift between the two peaks Δ = 1.5. In blue is reported the inflow dimensionless total discharge, in red the outflow discharge from the dam, in green the water level in the reservoir.
Water 08 00553 g002
Figure 3. Flood hydrographs considering the variable temporal distance between the flood peaks, using the spillway DC α = 4 and the SC β = 4: (a) time shift between the two peaks (Δ) equal to 1; (b) time shift between the two peaks (Δ) equal to 5.
Water 08 00553 g003
Figure 4. Trend of the “critical time interval”, Δ, which maximizes the water level, as a function of the spillway DC α and the SC β.
Water 08 00553 g004
Figure 5. Trend of the maximum routing elevation (hL) as a function of the spillway DC α and the SC β.
Water 08 00553 g005
Figure 6. Trend of the ratio between the downstream and the upstream flood peak discharge (η) as a function of α and β.
Water 08 00553 g006

