Article

Design and Hydrologic Performance of a Tile Drainage Treatment Wetland in Minnesota, USA

1
Ecological Engineering Group, Department of Bioproducts and Biosystems Engineering, University of Minnesota, 303 BAE Hall, 1390 Eckles Ave., St. Paul, Minneapolis, MN 55108, USA
2
Water Resources Science Program, University of Minnesota, 311 BAE Hall, 1390 Eckles Ave., St. Paul, Minneapolis, MN 55108, USA
3
USDA-ARS Soil and Water Management Research Unit, 439 Borlaug Hall, 1991 Upper Buford Circle, St. Paul, Minneapolis, MN 55108, USA
4
Center for Integrated Natural Resources Management (CINRAM), Department of Forest Resources, 100 Green Hall, St. Paul, Minneapolis, MN 55108, USA
5
Minnesota Department of Agriculture, 625 Robert Street North, St. Paul, Minneapolis, MN 55155, USA
6
Tetra Tech, Inc., 661 Andersen Drive, Pittsburgh, PA 15220, USA
7
Ecological Engineering Group, Department of Bioproducts and Biosystems Engineering, University of Minnesota, 203 BAE Hall, 1390 Eckles Ave., St. Paul, Minneapolis, MN 55108, USA
*
Author to whom correspondence should be addressed.
Water 2016, 8(12), 549; https://doi.org/10.3390/w8120549
Submission received: 16 September 2016 / Revised: 28 October 2016 / Accepted: 14 November 2016 / Published: 25 November 2016
(This article belongs to the Special Issue Constructed Wetlands for Water Treatment: New Developments)

Abstract

:
Treatment wetlands are increasingly needed to remove nitrate from agricultural drainage water to protect downstream waters, such as the Gulf of Mexico. This project sought to develop a new edge-of-field treatment wetland, designed to remove nitrate-nitrogen and enhance phosphorus removal by plant harvest and to monitor its effectiveness. A 0.10 ha wetland was designed and installed to treat subsurface drainage flow from farmland in southwestern Minnesota, USA, in 2013, and monitored for three years by recording flow, nitrate-nitrogen, total phosphorus (TP) and soluble orthophosphorus (OP) input to and output from the wetland. Prior to construction, a level-pool routing, mass balance approach with DRAINMOD flow inputs was used to predict nitrate removal efficiency. Nitrate load removal averaged 68% over three years, nearly matching model predictions. However, most denitrification occurred in the sub-soil of the wetland rather than in surface flow as predicted. Phosphorus removal was approximately 76% over three years, and phosphorus removed by plant uptake exceeded inflow mass in the third year. The edge-of-field design has potential as a cost-effective method to treat field outflows because agricultural landowners can adopt this treatment system with minimal loss of productive farmland. The wet-prairie vegetation and shallow depth also provide the opportunity to remove additional phosphorus via vegetative harvest.

1. Introduction

Although it is widely recognized that wetlands provide nutrient removal and water storage benefits to downstream waters [1], many of the native wetlands in the Midwestern U.S. have been drained for agriculture and development, reducing those functions in the present-day landscape. Prior to the adoption of the Wetland Conservation Act in 1992, over half of the original wetlands in southern Minnesota were drained through the installation of agricultural tile lines and surface ditches. During this same time, Minnesota’s first Conservation Reserve Enhancement Program (CREP) initiated, with over 50% of the enrolled land area (>20,000 ha) dedicated to wetland restorations in southern Minnesota. As the program evolved, 10–15 year contracts were granted rather than permanent easements, which lead to increased landowner adoption. As these contracts began to expire between 2007 and 2010, much of the land area was not renewed due to increased commodity prices. Since 2007, Minnesota has sustained the largest loss of emergent wetland area in the Midwest [2]. The reduced water holding and filtration capacity has resulted in water quality issues such that nitrate pollution in the Midwest has been implicated as a major contributor to the Gulf of Mexico hypoxia [3,4]. Recent flood events have also been connected to the reduced landscape water holding capacity resulting from the declining wetland area [5,6,7].
To remediate these changes and specifically address water quality concerns, additional restored or created wetlands are needed in the Midwestern agricultural landscape. Past studies have shown Midwestern wetlands are effective at removing nitrates, however, phosphorus removal efficiency is variable depending on whether the load is attributed to the dissolved or particulate fraction [8]. Past studies of water quality treatment wetlands indicate that large restored Midwestern wetlands are highly effective at peak flow reduction, water storage, and nitrate removal but to a lesser extent for phosphorus removal [9,10]. Nitrate-nitrogen (NO3-N) export was reduced by 85% during the primary loading period of April to June. Particulate phosphorus and sediment from inflowing field and gully erosion were effectively settled out in the wetlands, however, soluble orthophosphorus (OP) export, (reaching a maximum concentrations of 1.3 mg/L) and wind suspension of organic matter from the wetlands, resulted in no significant removal of total phosphorus (TP) and total suspended solids. Although the wetlands were a net remover of TP, high levels of soluble OP were exported out of the wetland in mid- to late-summer reaching levels of 1.3 mg/L.
Although nitrate has been the focus of Midwestern water quality treatment wetlands, phosphorus is increasingly being considered as well. Research has indicated that TP and soluble OP as a measured load may be less than 2% of the applied phosphorus, however, when compared to the amount responsible for harmful algal blooms, the losses cannot go unaddressed. Long-term phosphorus removal depends upon plant uptake and physical settling [11]. Designing a treatment wetland to enable plant harvesting is one example of how phosphorus could be permanently removed from the system to prevent re-mobilization. Native perennial species that are adapted to wet soil conditions, or along the fringe of wetlands, have the capacity to aid in removing excess phosphorus from wetlands and thus provide an opportunity for addressing phosphorus in drainage water and wetlands used to treat those waters.
While many wetlands have been restored for ecological reasons, there is a growing need to develop wetlands to specifically capture subsurface drainage flow [12]. Subsurface drainage systems short-circuit riparian buffers or grass filters increasing NO3-N loadings to surface waters and reduce the opportunity for denitrification to occur in the soil of the riparian buffer [13,14]. To address this nutrient loss, tile-drainage systems can be routed to discharge into a constructed treatment wetland for treatment prior to discharging into drainage ditches or streams. Similar to natural wetlands, constructed wetlands can provide many of the benefits of restored wetlands, including nutrient removal, flood storage, the decoupling of storm rainfall and surface runoff, and cycling of nutrients [15]. Habitat for fish and wildlife, recreation and aesthetic benefits may be provided but often to a lesser extent than natural wetlands.
Given the increasing value of farmland in the Midwest, there is a pressing need for wetland systems that are compatible with current agricultural systems to improve landowner adoption. Innovative designs, strategies, and management must be explored in order to maximize the nutrient reduction efficiency of these treatment wetlands while minimizing the construction footprint on land that would need to be taken out of agricultural production. One way to accomplish this goal is by creating edge-of-field systems. These designs include fitting wetlands into riparian zones and land adjacent to drainage ditches to minimize the land area and associated costs of easements or land purchase. Crumpton et al. [8] developed a treatment wetland design that is built in-line with public drainage ditches and was highly effective at removing nitrate. The disadvantages were high initial costs for land easements, the legal and social difficulties of modifying public ditch systems, and phosphorus removal was not considered. In 2012, a treatment wetland was proposed on private farmland in southern Minnesota to test some of the ideas discussed above.

Study Purpose

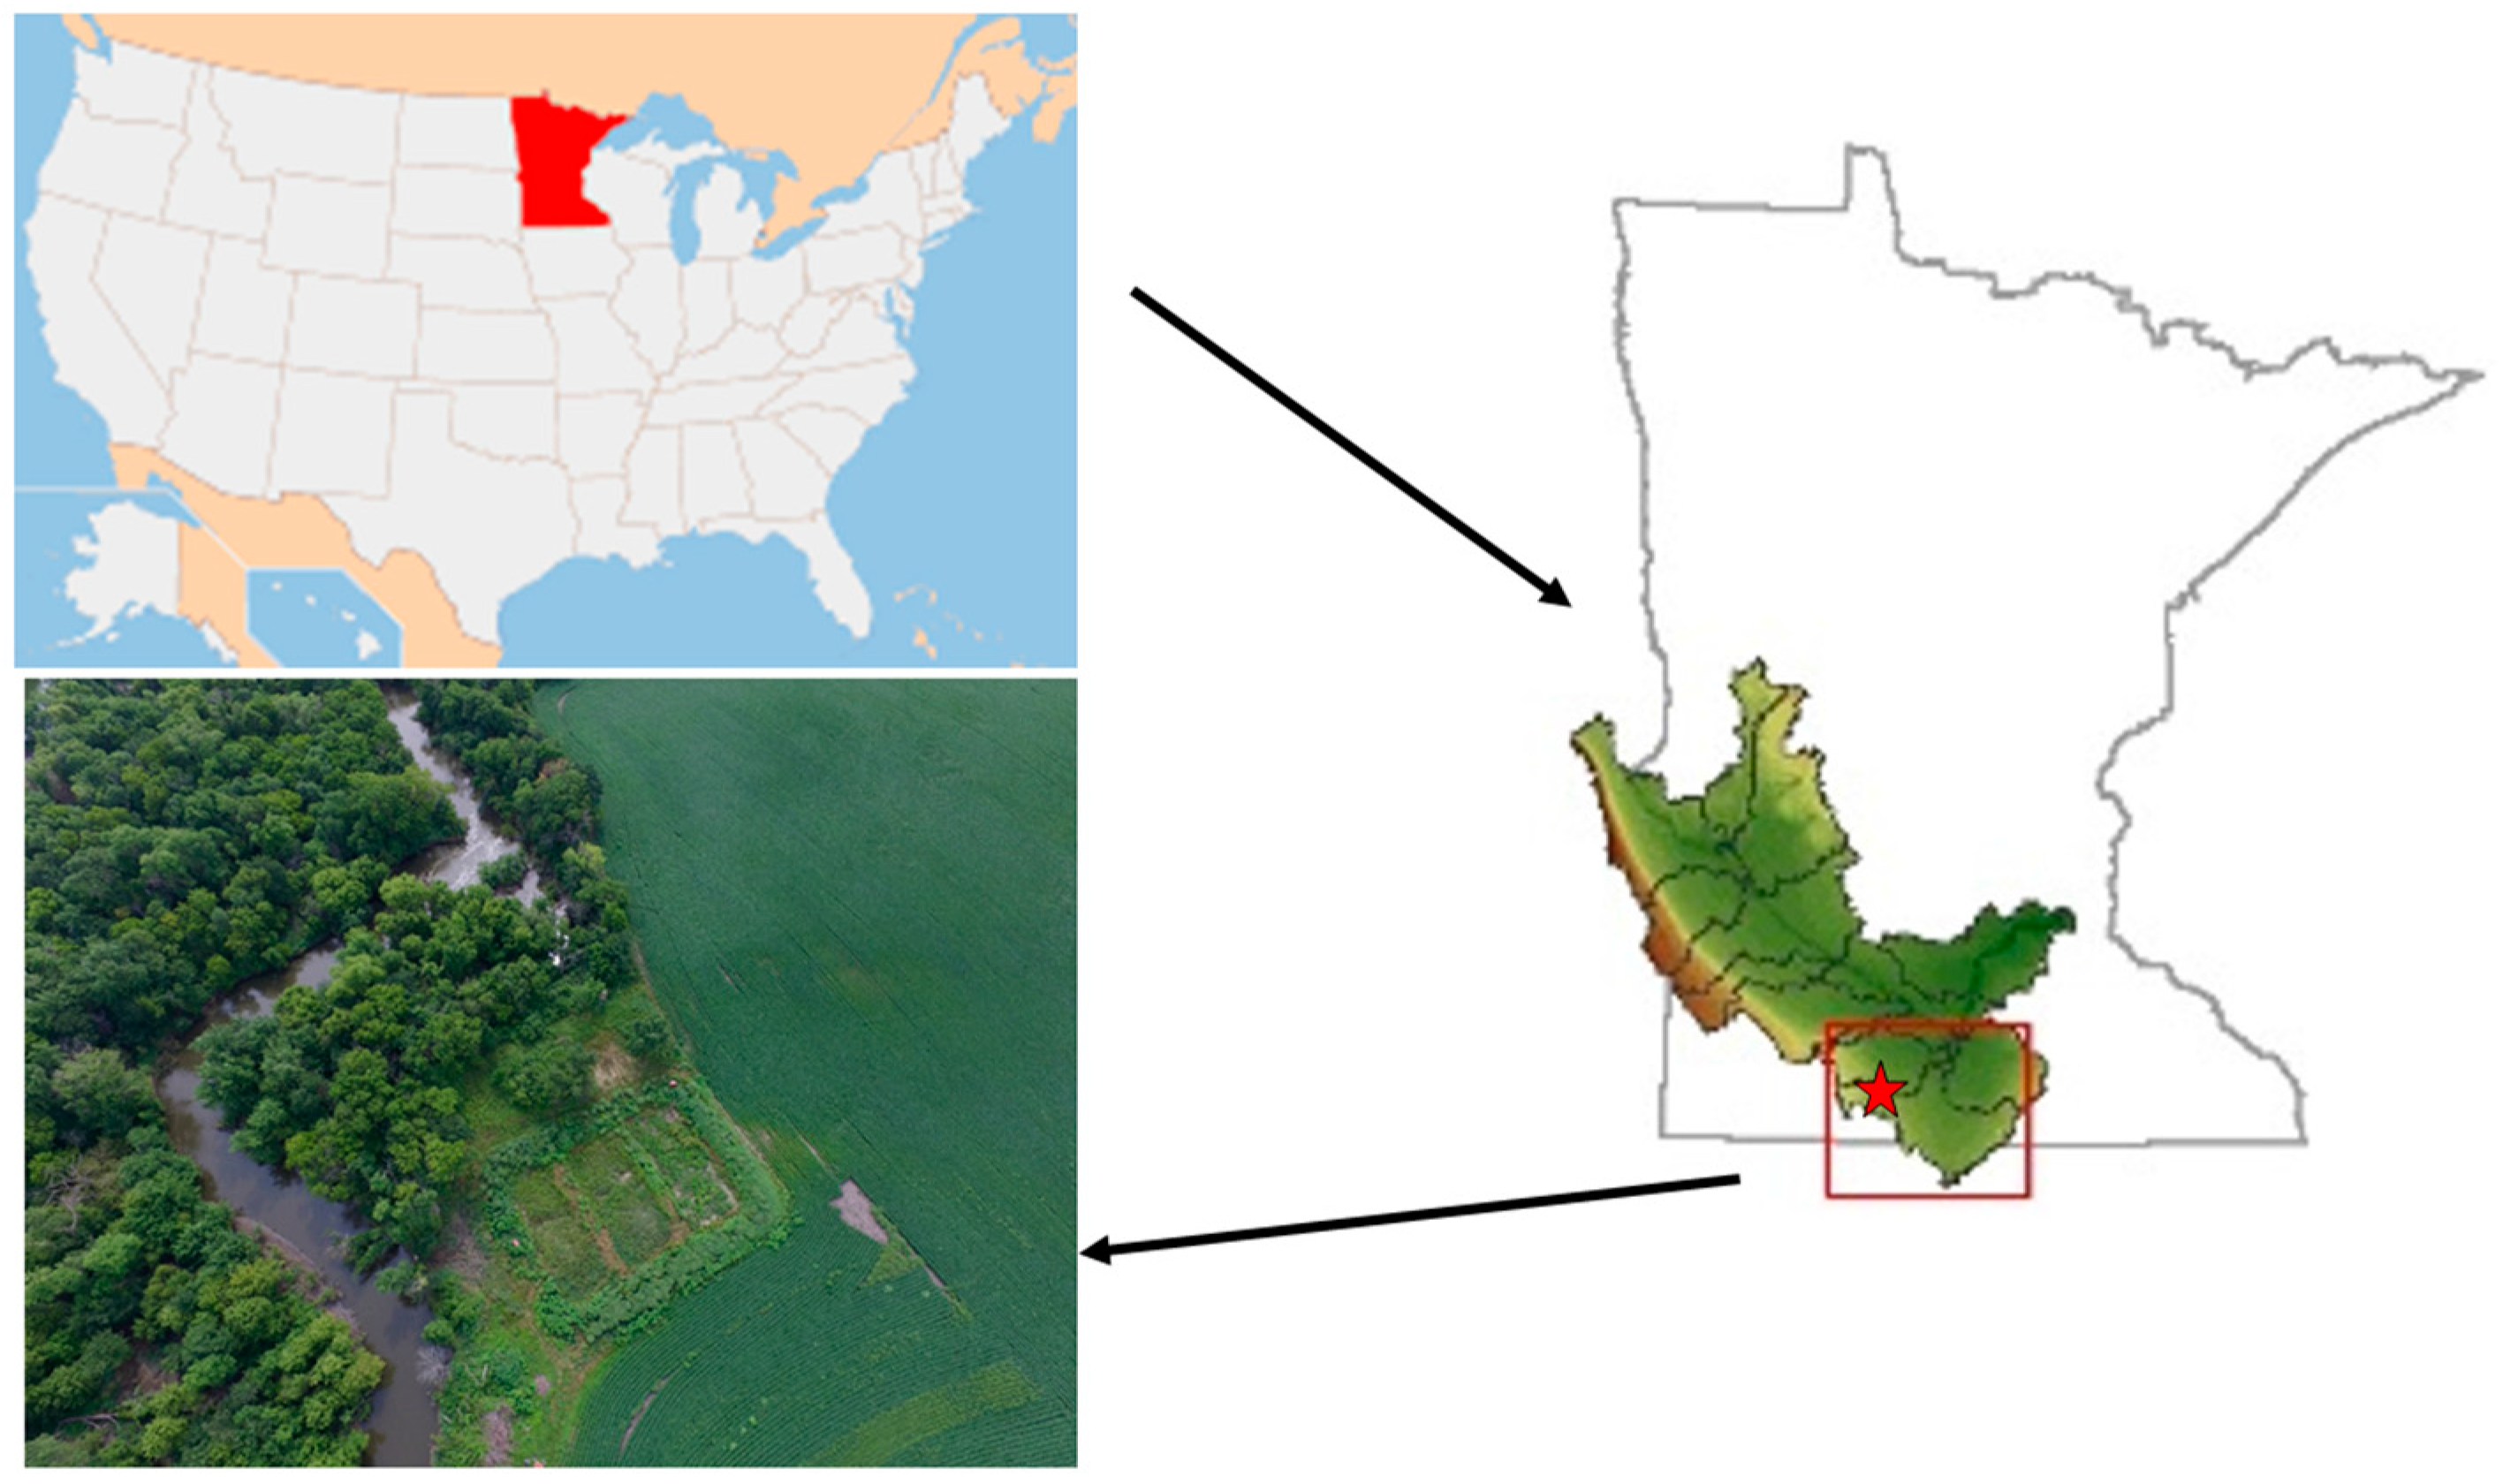
The project was developed to design, construct and test a small-scale, treatment wetland system compatible with tile-drained row crop agriculture in southern Minnesota, USA. The location was cited at the edge of an agricultural field, to minimize the land area removed from agricultural production, and to adequately receive tile water prior to creek outflow. This is referred to as “edge-of-field” treatment. The project was intended to serve as a research and demonstration site for the wetland and other innovative farm management practices on the site for landowners and government agency staff.
From a research perspective, the primary objectives were to measure the flow of water into and out of the wetland and determine the nitrogen and phosphorus removal efficiency in the treatment wetland. A secondary objective was to quantify phosphorus uptake by plants in the wetland system.

2. Materials and Methods

2.1. Study Area and Site Description

The research site is located within the Des Moines Lobe glacial till plain, which covers much of southern Minnesota and northern Iowa of the United States. These glacial till deposits are fine-textured fertile soils on a flat to gently rolling glacial till plain; when adequately drained this area becomes productive farmland. The region historically supported abundant pothole wetlands [16] as well as wet and mesic prairie. As the land was converted to agricultural uses, most of the wetlands were drained via ditches and sub-surface drainage pipes. Today the area is predominantly in corn (Zea mays L.) and soybean (Glycine max [L.] Merr.) with 80% of the Elm Creek basin in row crops.
The soil types found in the vicinity of the wetland include Clarion-Storden loam on 6%–12% slopes on adjacent uplands. Coland clay loam and Spillville loam cover much of the floodplain at the study site and along the length of Elm Creek. Coland is a hydric soil and would naturally support wetland vegetation and hydrology. It has approximately one meter of clay loam on top of a sandy layer underneath. In terms of water supply, the area receives an annual average of 81 cm/year of precipitation. The wetland itself lies within the floodplain of Elm Creek, a tributary of the Blue Earth River in the upper Mississippi basin (Figure 1). The wetland is exposed to floods from Elm Creek occasionally, calculated to be every 2–5 years. Along with surface water inputs, there is evidence of groundwater flow in sand layers underlying the heavy loams on top of the floodplain at a depth of 2–3 m.
The owner of the project site typically grows row crops in the 10.1 ha drainage area contributing to the wetland. Planning for the wetland construction began in 2012, with construction in the winter and spring of 2013. The wetland project was completed in conjunction with a new sub-surface drainage system and a bioreactor installed near the wetland for additional drainage water treatment, particularly for nitrate.

2.2. Wetland Design

The wetland was designed as a surface wetland system to capture and treat nitrogen and phosphorus in subsurface tile drainage flow from 10 ha. It was intended to be a model for small edge-of-field wetland systems that are compatible with current cropping systems by limiting the land area used. The design was based on guidance described by Kadlec and Wallace [17] and current conservation practice standards for Constructed Wetlands from the Natural Resource Conservation Service (NRCS), specifically the CP39 design guidance [18]. In addition, guidance for wetland-to-watershed ratio (1%–2% for optimal benefit) developed in Iowa was used to size the treatment wetland. Given its small size of 0.10 ha, retention time was maximized by using a sinuous path through the wetland to prevent short-circuiting of flow water. The wetland was broken up into three equal-area cells to extend the flow length and to facilitate comparisons of different plant treatments.
The wetland was designed to receive only subsurface tile drainage water to eliminate problems with sedimentation, erosion and/or flooding problems in the treatment cell area. Berms were constructed around the entire wetland to prevent inflow of surface water runoff and gully flow into the wetland.

2.3. Wetland Modeling

The flow through the wetland was modeled assuming the wetland water surface remains as a level pool, thus allowing the classical level-pool routing method to be used to route flows through the wetland. The transport of chemicals through the wetland was modeled assuming that the wetland behaves as a completely mixed reactor [19]. Since the outflow from the wetland was controlled by a weir, it was assumed that the unique stage–discharge relation represented by that weir could be used in the flow routing procedure.
The water balance of the wetland (modeled as a level pool) may be written in the following form [17]:
d V d t = Q i n + ( P E T I ) * A Q o u t
where, V = water volume stored in wetland (m3); A = surface area of wetland (m2); P = precipitation (m/day); Qin = inflow (m3/day); Qout = outflow (m3/day); Qc = runoff from surrounding area (m3/day); ET = evaporation/transpiration (m/day); R = irrigation addition (m/day); I = groundwater loss or gain to wetland (m/day).
For the completely mixed reactor assumption, the transport of a chemical (e.g., nitrate) through the wetland can be expressed by the mass balance equation,
d ( V C ) d t = Q i n C i n Q o u t C I A C k A C
where, Cin = concentration of chemical entering the wetland (mg/L); C = concentration of chemical in the wetland (mg/L); k = areal removal rate of the chemical (m/day).
Equations (1) and (2) are solved by a finite difference scheme. An essential input for the water balance equation is the relation between water stage and discharge. This was assumed to be given by the weir at the outlet of the wetland, and was assumed to be adequately represented by the equation for a rectangular weir, Equation (3). The parameter (b1 = 9.95) was determined using Equation (1). The weir width was assumed to be 2.5 m for the model and the discharge coefficient was assumed to be 3.98, a typical value for a rectangular broad crested weir. In comparison, the as-built outlet weir width placed in the constructed treatment wetland was 20 cm in width.
Q o = C E * W w b 1 ( H o H w ) 1.5
where Qo = outflow rate (m3/day); CE = weir discharge coefficient (m3/day); Ww = width of weir (m); Ho = water surface elevation at wetland outlet (m); Hw = weir crest elevation (m).
All of the parameters used to calculate wetland discharge from the water control structure and nutrient removal efficiency are listed in Table 1.
Many of the input variables for the level pool routing, mass balance model were obtained through the DRAINMOD model [20]. The others are listed in Table 1.
  • V = found with mass balance routine;
  • A = treatment surface area of individual cell at each depth;
  • P = DRAINMOD precipitation values applied to wetland cell area only;
  • Qin = Subsurface Drainage flow from DRAINMOD;
  • Qout = outflow in cell 1 is inflow to cell 2, outflow in cell 2 is inflow to cell 3;
  • Qc = 0 (surface water is directed elsewhere for this application);
  • ET = DRAINMOD values for ET applied to wetland cell area only;
  • R = 0 (no irrigation);
  • I = assuming small leakages, with unsaturated conditions beneath the wetland;
  • DP = vertical seepage from DRAINMOD applied to wetland cell area only.

2.4. Nutrient Removal Predictions

Using the level pool routing, mass balance routine to model nitrate reduction, successive nutrient removal performance of the wetland cells can be predicted. Input flow-concentrations (Q–C) were based on a value of 0.44 mg/L/ m3/day prior to wetland monitoring. This estimate was found by dividing a mean nitrate concentration of 15.3 mg/L for a study done in the Elm Creek watershed [9] by the average daily flow (~35 m3/day). The mean nitrate concentration was obtained by averaging five tile nitrate concentrations from a nearby water quality treatment wetland and one grab sample from the study site. The kinetic reaction rate coefficient was set based on the median annual value determined in a compilation study that utilized total nitrogen data from 141 wetlands. The median annual rate constant was 12.6 m/year, making the daily rate constant ~0.04 m/day [16].

2.4.1. Data Collection to Support Construction Design

Soil borings were advanced to get detailed data on stratigraphy and particle size data for soils down to a depth of 1.8 m. A temporary monitoring well was installed to obtain depth to water table information. Flood frequency estimates of the floodplain where the wetland is located were calculated using local stream gauge information, cross-sectional surveys and regional regression equations specific to Minnesota.

2.4.2. Vegetation: Seed Mix Selection and Plant Harvesting

A unique component of this project was the use of plant harvest to maximize phosphorus removal. Three vegetative treatments were seeded in the wetland along with an oat cover crop. Vegetative treatments included a low diversity wet prairie mix (12 species; Table 2), a medium diversity wet prairie mix (20 species), and a high diversity wet prairie mix (32 species), which were seeded into Cells 1, 2, and 3, respectively. Following wetland construction, a firm seedbed was prepared in each wetland cell and seed mixes were broadcast by hand and raked lightly into the soil. Heavy precipitation from 21 June through 23 June 2013 resulted in flash flooding, which at its peak rose above the interior berms. The flooding washed much of the seed out of the first wetland cell. Cell 1 was reseeded in early August with a 23 species native mixture (Table 2). In fall 2013 and spring 2014, counts of plant populations and visual estimates of ground cover were conducted to assess stand establishment and stand vigor. Percent vegetative cover by functional group was visually estimated using six cover classes in two randomly selected 0.25-m2 quadrats in each plot. The cover class midpoints of each observation were then averaged. Plants were also classified as to their wetness tolerance using the categories, FAC = facultative, FACW = facultative wetland, FACU = facultative upland, NA = not applicable, OBL = obligate.

2.4.3. Project Planning and Implementation

After the conceptual design was developed, a grading plan was created and the project was sent out for contractor bids in the fall of 2012. The contractor did all grading, earth moving and erosion control on the berms in spring 2013. A water inlet was constructed and armored with riprap to prevent scouring. Agri-Drain brand water control structures that utilize movable plastic slats for setting water elevation were installed in between each of the cells and at the wetland outlet.
Connection of the subsurface drainage pipe that required re-routing into the wetland was problematic due to the deep depth of the subsurface drain outlet as it descended the gradual valley slope towards Elm Creek. Additionally, frozen ground followed by wet conditions and unforeseen difficulties with excavating the deep sub-surface drainage pipe going down the hill delayed connecting the drainage flow to the wetland until late May 2013. At this point hydrologic monitoring began.

2.5. Wetland Monitoring and Nutrient Removal Assessment

The components of the water budget were calculated using multiple methods. Inputs for the wetland were tile discharge at the inlet and rainfall. Water exchange via overland flow into and out of the wetland through the outer berms was considered negligible. Groundwater discharge was not observed within the wetlands based on well data.

2.5.1. Rainfall Measurement

Rainfall was measured using a HOBO® tipping bucket rain gauge each year, a Davis Vantage Pro2 weather station tipping bucket rain gauge the second year, and a Teledyne ISCO 674 tipping bucket rain gauge the third year. The precipitation was multiplied by the 0.9-acre catchment area of each cell in the wetland to determine the total volume in each cell. Potential evapotranspiration (PET) was calculated using the Hamon PET equation [22,23] using temperatures collected from an EasyLog USB temperature logger and the HOBO rain gauge.

2.5.2. Water Volume

Inflow from tile drainage and outflow to the creek were measured using Teledyne ISCO 2150 and 4150 area velocity probes and modules in 2013 and 2014. In the second year, a Solinst brand pressure transducer, referred to as a Levelogger, was placed behind the flat weirs in the outflow Agridrain control structure. It was paired with a barometric pressure logger (Solinst brand barologger) to compensate the Levelogger with barometric pressure. By 2015, both the inflow and outflow were being measured by placing V-notch weirs in Agridrain control structures with Solinst Leveloggers measuring the height of water flowing over the weirs. Leveloggers were placed in the Agridrain control structures between the cells in the second year as well, and the flat boards in these structures were replaced by V-notch weirs in the third year.
When flat boards were used with Leveloggers, the following equations were used to calculate flow [24] as shown in Equations (4) and (5):
Q = 0.020 ( L 0.437 H ) H 1.48   i f   H 0.44 L
Q = 0.027 L H 1.2   i f   H 0.44 L
where, Q = flow rate (L/s); L = width of the gate (cm); H = flow depth above the gate (cm). After a V-notch weir was installed in the Agridrain control structures in 2015, the following equation was used to calculate flow:
Q = 0.9833 x 2.0801
Q is the flow rate (expressed in cubic feet/second and converted to cubic meters/day), and x is the height of water above the apex of the V-notch weir (feet). Infiltration of water into the soil was calculated algebraically once the other variables in the water budget were determined. From 23 March to 5 June 2014, tile drain inflow into the wetland was estimated using precipitation to runoff ratios in the region [10] due to equipment failure. An assumption was made, based on regional discharge data that 30% of rainfall infiltrated and flowed from the watershed through tile drainage from 23 March through 5 June 2014. Rainfall captured at the site was used to estimate tile flow from the 10.1 ha watershed into the wetland.

2.5.3. Nutrient Reduction

Grab samples were taken from the inlet and outlet of the wetland throughout the three years. Samples were analyzed for nitrate/nitrite-N, TP, and soluble OP at the Minnesota Valley Testing Laboratory (MVTL) in New Ulm, MN. Some samples were also analyzed using a Hach Nitratax sc, Ultraviolet Nitrate sensor, for nitrate/nitrite-N. Nutrient loads infiltrating into the soil were estimated by multiplying the concentrations in each cell by the infiltrated volume calculated above. In 2015, reductions in the shallow, subsurface flow were estimated using shallow wells and piezometers drilled throughout the wetland. The level in each well was measured throughout each year to determine the direction of subsurface flow. Furthermore, nutrient samples were submitted to MVTL from each well and piezometer. Water samples were also taken for stable isotopes of Oxygen and Hydrogen (18O and 2H) analysis. The following equation was used to calculate the contribution of groundwater in each sample:
%   GW Contribution = ( δ Rmix δ SW δ GW δ SW ) × 100
δRmix is the isotope ratio of the sample where surface water and ground water are known to be mixing, δSW is the isotope ratio of the surface water sample, and δGW is the isotope ratio of the ground water. This analysis allowed for an estimate of the percent groundwater and percent surface water within the samples taken from the wells. Two piezometers sampled groundwater before it entered the wetland while the other wells and piezometers contained what would be a mixture of groundwater and infiltrated wetland surface water. The following equations were used to calculate nutrient reductions:
Total   volume   flowing   past   wells = SW   volume   infiltrating % SW   contribution
GW   volume   flowing   past   wells = ( Total   volume   flowing   past ) ( SW   volume   infiltrating )
GW   nutrient   load = ( GW   volume   flowing   past   wells ) × ( [ Nutrient ]   at   GW   well )
% Reduction = 100 [ Nutrient ] × Total   volume   flowing   past GW   load + SW   infiltration   load × 100

3. Results

3.1. Wetland Construction, Design, and Goal Attainment

The wetland was installed almost consistent with the design dimensions (Figure 2), however, root channel cracks from frost-heave in the high clay content subsoil and potentially, grading of sand into the wetland area, increased the rate of infiltration into the sub-surface. The wetland did contain all inflows from the tile drainage network from 2013 to 2015, never over-topping the 1.8 m-high berms (Figure 3 shows the modeled stage-discharge relationship for the wetland). The wetland was flooded by overbank flow from Elm Creek each year, with several large floods occurring in June each year.
Wetland seed mixes were established with limited above-ground growth the first year (2013). By fall 2013, total ground cover was near 100%, but was dominated by weed species in each wetland cell. Weed cover ranged from 65% to 74% in all wetland cells, with the remainder being mostly seeded forbs. In Cell 1, ground cover of seeded species increased each year, from 31% in 2013, to 80% in 2014, and 81% in 2015. Likewise, in Cell 2, ground cover increased from 46% in 2013 to 87% in 2014, and 92% in 2015. Ground cover in Cell 3 showed a similar pattern, with 26% cover in 2013, 71% in 2014, and 98% in 2015. Weed cover declined each year, corresponding with increasing vigor and ground coverage of seeded species through time. Over years two–three, plant coverage became dominated by native FAC and FACW species including Andropogon gerardii, Panicum virgatum and Spartina pectinata in Cells 2 and 3. By 2015, the most abundant species in Cell 1 was FACW species Helenium autumnale. Aboveground plant biomass increased each year of the study, from 0.6 Mg·ha−1 in 2013 to 2.9 Mg·ha−1 in 2014, and 4.7 Mg·ha−1 in 2015.

3.2. Modeling Results

The level-pool routing and mass balance model with hydrologic inputs form DRAINMOD predicted drainage inflow to the wetland occurred 315 days, or 86% percent of the modeled time period (i.e., 1 year). Inflow was not constant but fluctuated rapidly with the occurrence of storm events in the watershed (Figure 4). The greatest volume of flow (54% of annual flow) was predicted to occur between the months of March to May with a rise in the fall during October and November. The total predicted inflow volume was 12,800 m3/year.
The wetland modeling results show attenuation of peak flow and delay of outflow moving through the three-cell system (Figure 5). Peak flow from the wetland was predicted to be reduced from 166 m3/day to 71 m3/day and delayed by 30 days for water exiting the wetland system.
Nitrate removal was predicted to be the most efficient in the months of July and August and least effective in the spring months from March to May (Figure 6). On an annual basis, nitrate removal by the wetland was predicted to be 67%. The nitrate load into the wetland was predicted to be strongly correlated with the volume of water entering the wetland as can be seen by comparing Figure 5 and Figure 6.

3.3. Hydrologic Monitoring Results

3.3.1. Inflow Data (Tile Flow and Rainfall)

In 2014, the wetland began flowing consistently on 27 April, and snow melt was observed in the wetland on 21 March 2014. In 2015, the wetland received some flow at the end of April, but it did not consistently flow until 14 May. The majority of flow into the wetland occurred as subsurface tile flow between the months of April to June with flow greatly reduced in late summer fall (Figure 7). There was more rain before the end of June 2015 than in the previous two years during that time. However, there was less total flow in 2015 during that time.
Flow into the wetland was highly variable and would cease part way through the growing season. In total, the tile drainage volume discharging into the wetland ranged from 5666 to 12,732 m3/year, averaging 8546 (Table 3). Flow began in the wetland following snow melt and ended in the fall. There was no flow into the wetland during the winter, and flow ceased in July in two of the three summers until a large rain event would occur toward the end of the growing season.
Flow into the wetland occurred 334 days over the three years of study or 30.5% of the monitoring period (Table 4). Of those days, the entire wetland was inundated on 13% of the days when water was flowing into the wetland. This means that the wetland was filled only 44 days in 3 years or 4% of the time. Cell 1, however, was filled 133 days over the 3 years or 40% of the days in which water flowed into the wetland.
According to data from the University of Minnesota Climatology Working Group, the wetland experienced wetter than average conditions between April and June in 2013 and April and May of 2014 (Table 5 and Table 6). June 2014 had greater than average rainfall. In 2015, April and June rainfall returned to average with a wet May 2015. The year 2015 had the most rainfall between March and November, but it had the least volume of flow into the wetland of the three years (Table 6).

3.3.2. Hydrologic Regime and Discharge Data

The three wetland cells varied in their duration of inundation and saturation. Cell 1 contained water as long as the inlet was flowing, however, cells 2 and 3 would receive overflow from Cell 1 only during the spring following a series of multiple rain events or following large, single rain events. In 2013, only 17% of the water in the wetland flowed through the entire wetland and discharged into Elm Creek, with 22% in 2014. The majority of water infiltrated into the subsurface flow at a depth of 1 to 2 m below the ground surface (Figure 8).
Calculations of water loss from the wetland via evapotranspiration (ET) are listed in Table 7. The Hamon, Thornthwaite and Jensen–Haise equations for potential ET gave monthly average values ranging from 1.07 to 3.03 mm/day. Using the water level drawdown, transpiration via wetland plants was estimated to average 2.8 mm/day for 2015. Evaporation was limited by the small number of days that the wetland was inundated, with standing water occurring for 4%–12% of the monitoring period (Table 7). Calculated transpiration using the drawdown method was usually similar to PET estimates, although for brief periods during the growing season when the water table was below ground surface, transpiration was higher than PET ranging up to 5.5 mm/day. Since water was not present in the wetland for long time periods, the actual transpiration would have been less than PET, as expected.

3.3.3. Nutrient Removal Data

Nitrate removal over the three years of the study averaged approximately 68% of the load that entered the wetland through tile drainage. Percent reduction ranged from 60% to 93% in the three years including both surface and subsurface removals combined. More nitrate was removed through subsurface reductions than surface reductions due to the high volume of water that infiltrated into the soil. The nitrate load into the wetland was correlated with the volume of water entering the wetland with most loading occurring in the months of April to June.
Phosphorus removal was approximately 76% over the three-year monitoring period. Most phosphorus was removed by plant uptake since most of the phosphorus was in dissolved form traveling through the tiles. No direct surface flow from upstream farmland was received, thus minimizing the amount of sediment and particulate phosphorus often associated with it.

3.4. Comparison of Predicted vs. Observed Results

The duration and magnitude of tile inflow was less than predicted by the level pooling routing and DRAINMOD model. Total inflow was found to be 67% of that predicted, while the frequency of inflow was 35% of that predicted (Table 8). Nutrient removal percentages were almost identical to those predicted cumulatively from 2013 to 2015. Despite the differences in removal processes, the observed wetland removal rates were comparable to those modeled due to the high sub-surface flow nitrate removal rates.

4. Discussion

4.1. Wetland Construction, Implementation Issues and Lessons Learned

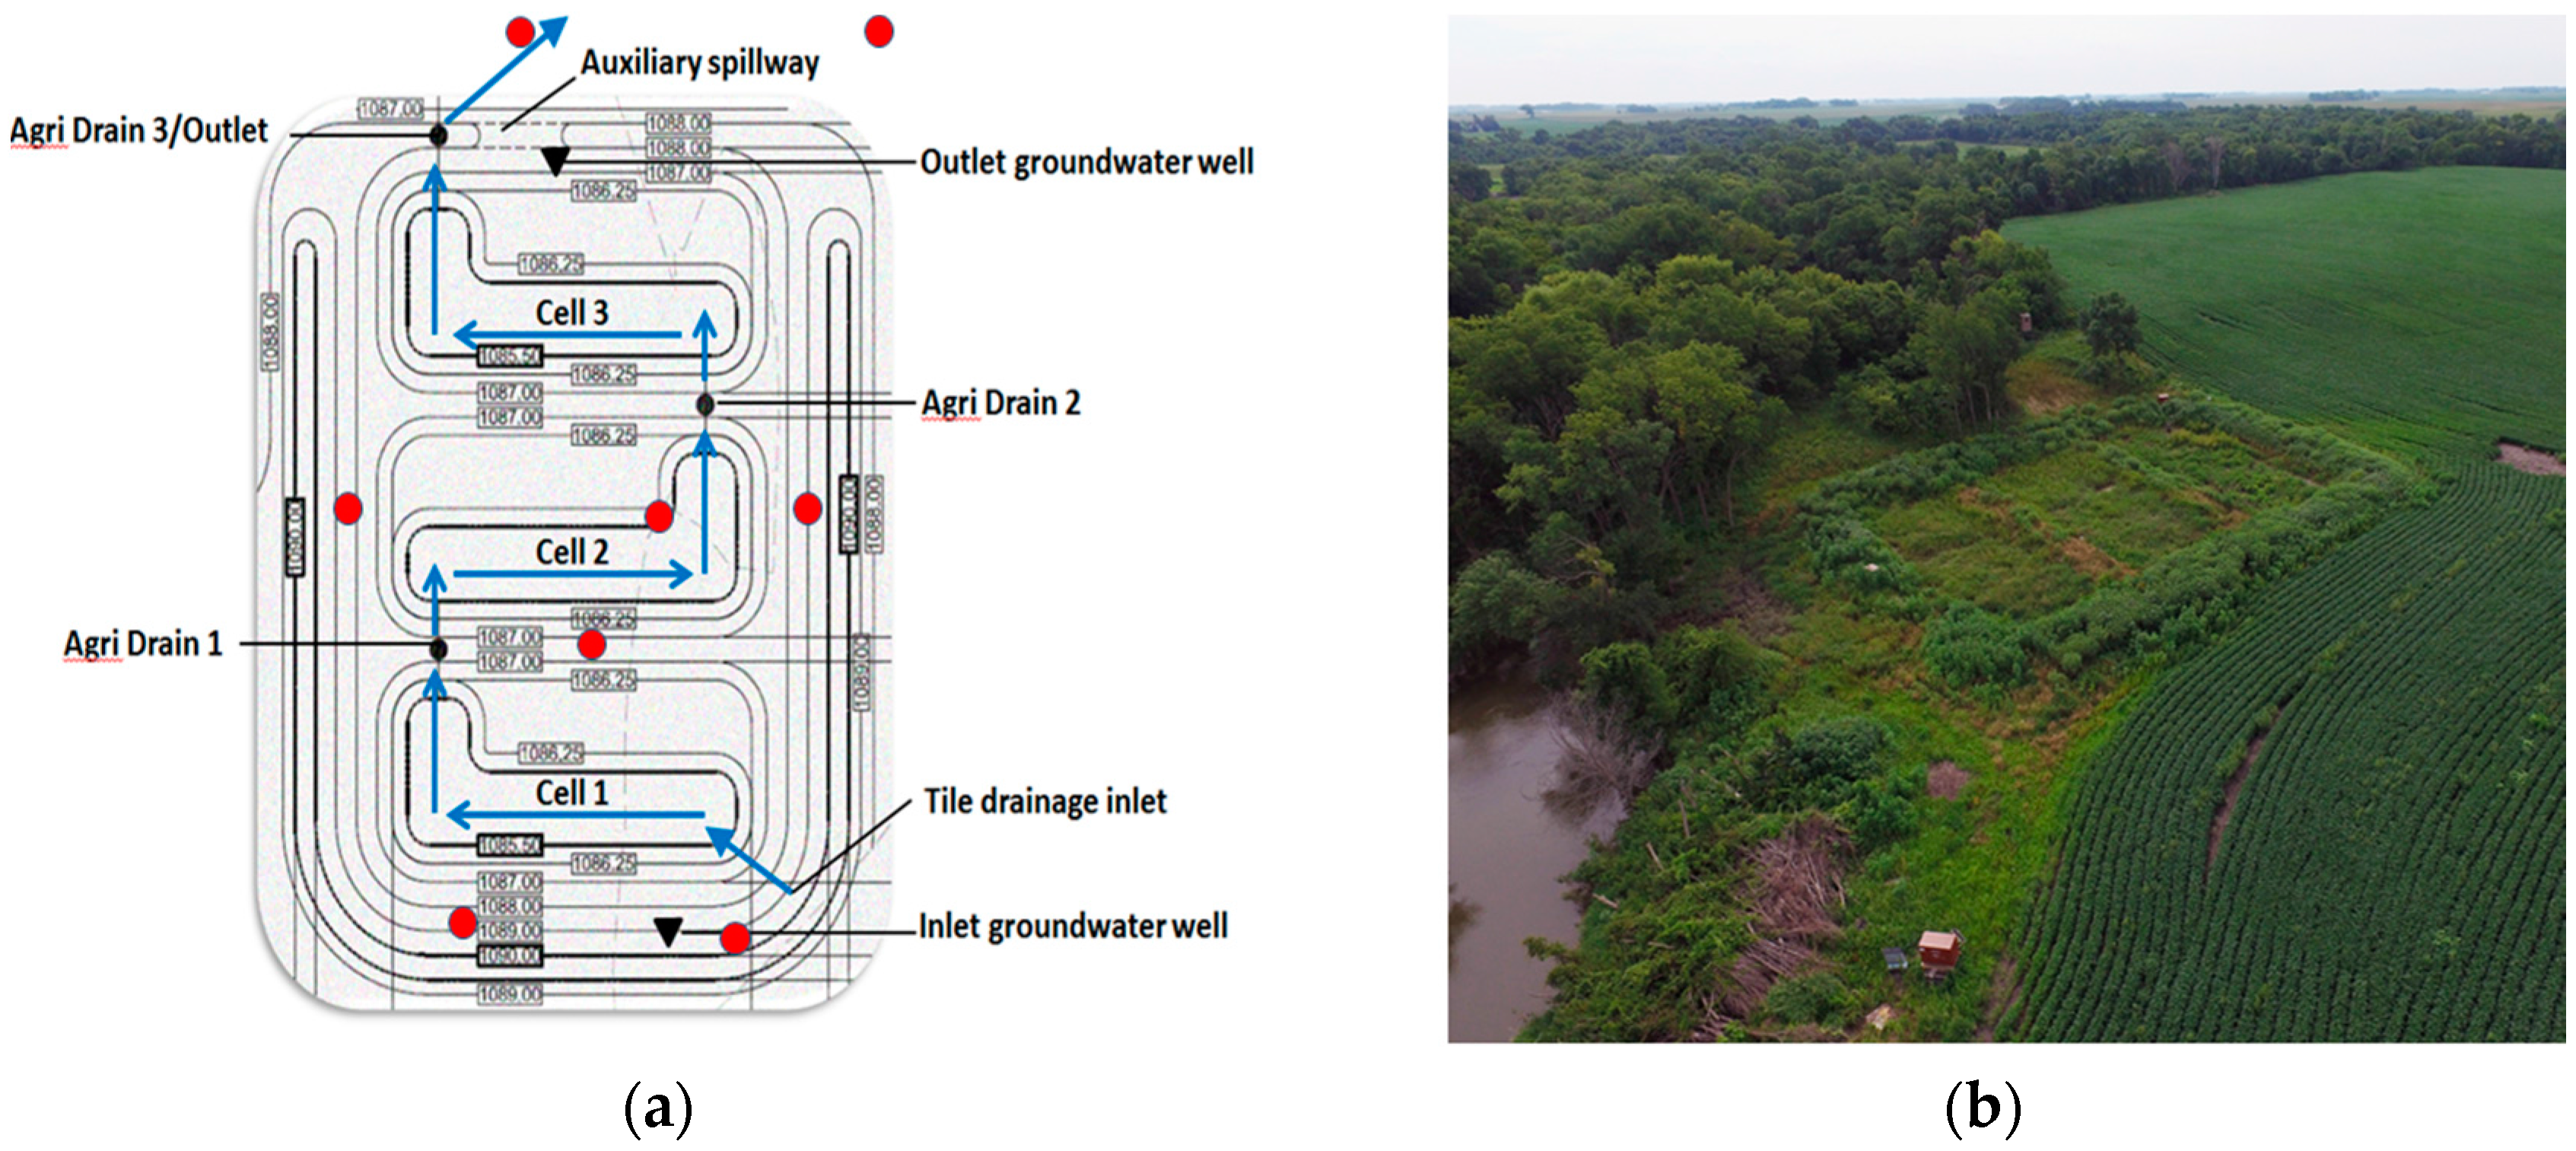
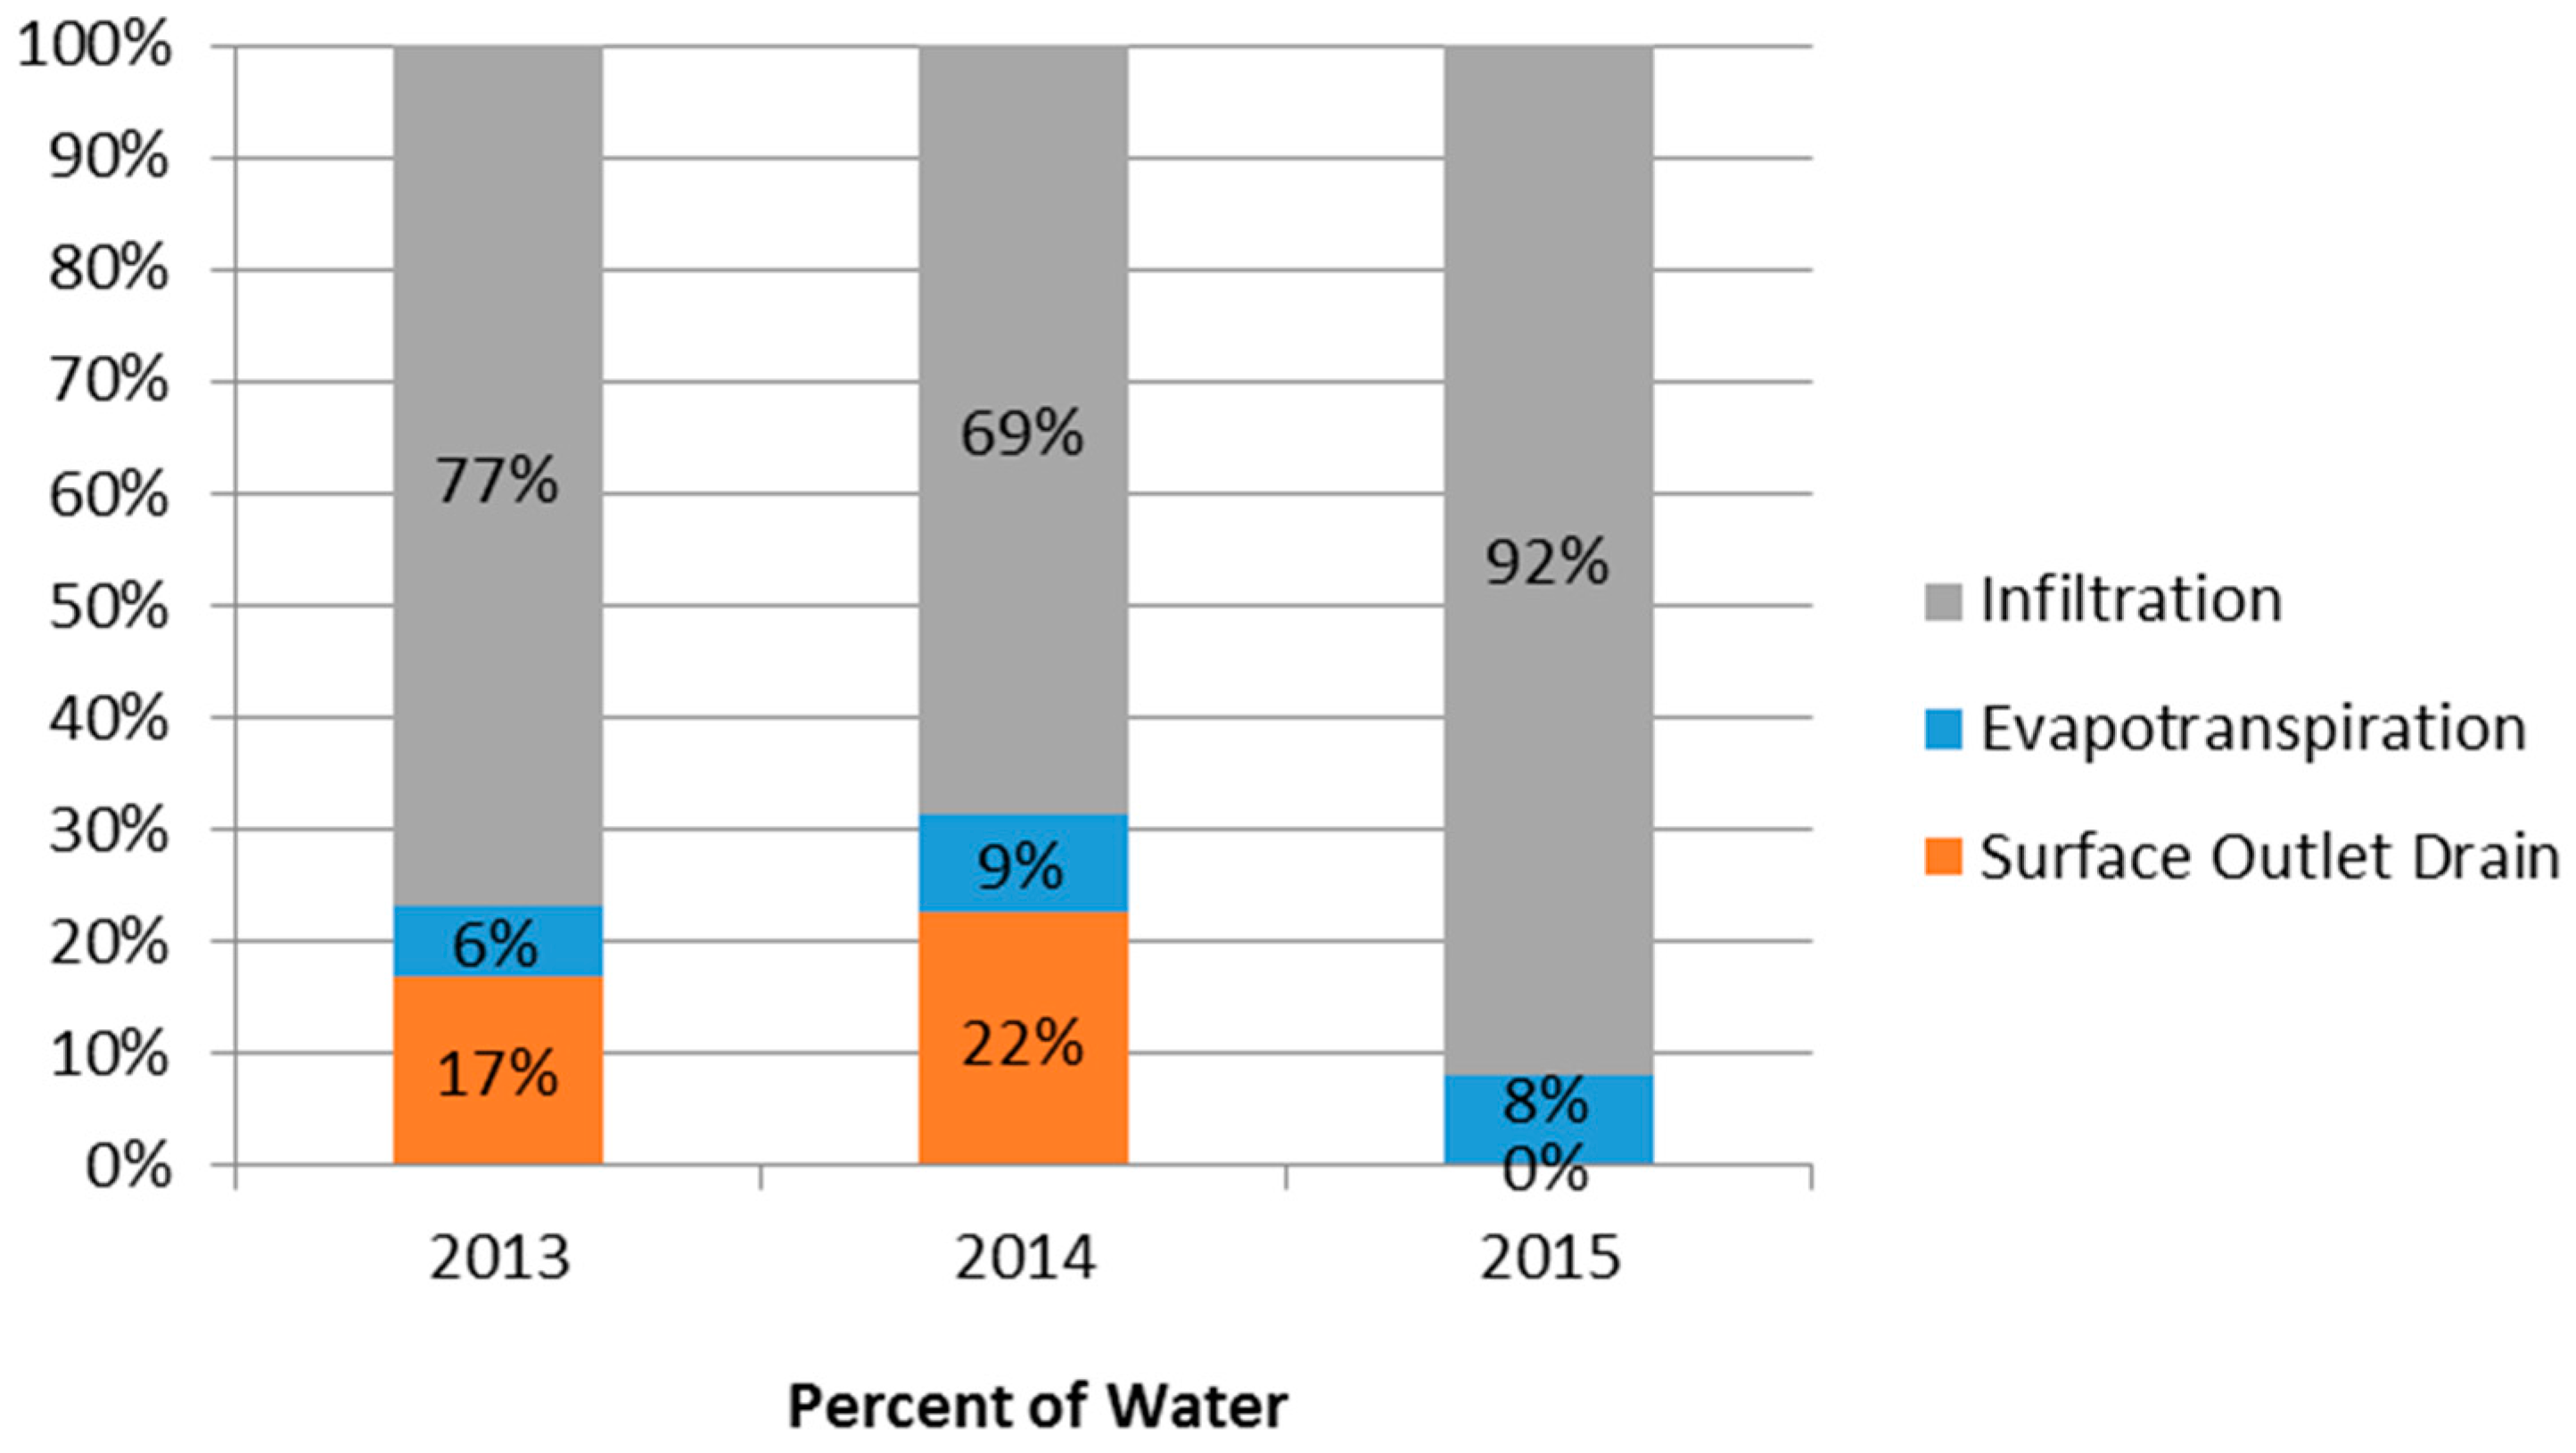
The wetland design functioned as intended in terms of storing the total volume of water discharging from the farmland drainage system. The meandering flow path also prolonged water residence time by extending the flow length through the wetland and by infiltration and subsequent subsurface flow towards the outlet. Much more infiltration occurred than anticipated given the high clay content subsoil, presumably due to soil cracks, macropores and sand lenses. Consequently, residence time was extended by moving water into the ground where it slowly infiltrates, in the range of days to weeks rather than hours. Nitrate removal rates were therefore higher in the sub-surface flow than in surface flow.
The vegetation was slow to establish with very little vegetative cover the first year but covered the entire basin by year two (2014). Most of the vegetation cover consisted of native wet prairie species that were facultative (FAC) or facultative wetland (FACW) species with a few obligates, reflecting the relatively short duration of flooding.

4.2. Modeled vs. Observed Results

4.2.1. Inflow Amounts and Peak

The volume of tile drainage inflow was about 50% less than predicted by the model overall to the intermittent nature of the tile flow (Table 4). This could be explained partly by the lack of late summer and winter flow in the wetland as the model predicted. Also, in 2015, a cover crop, cereal rye (Secale cereale) planted in the drainage area reduced inflow greatly from April until the end of May.
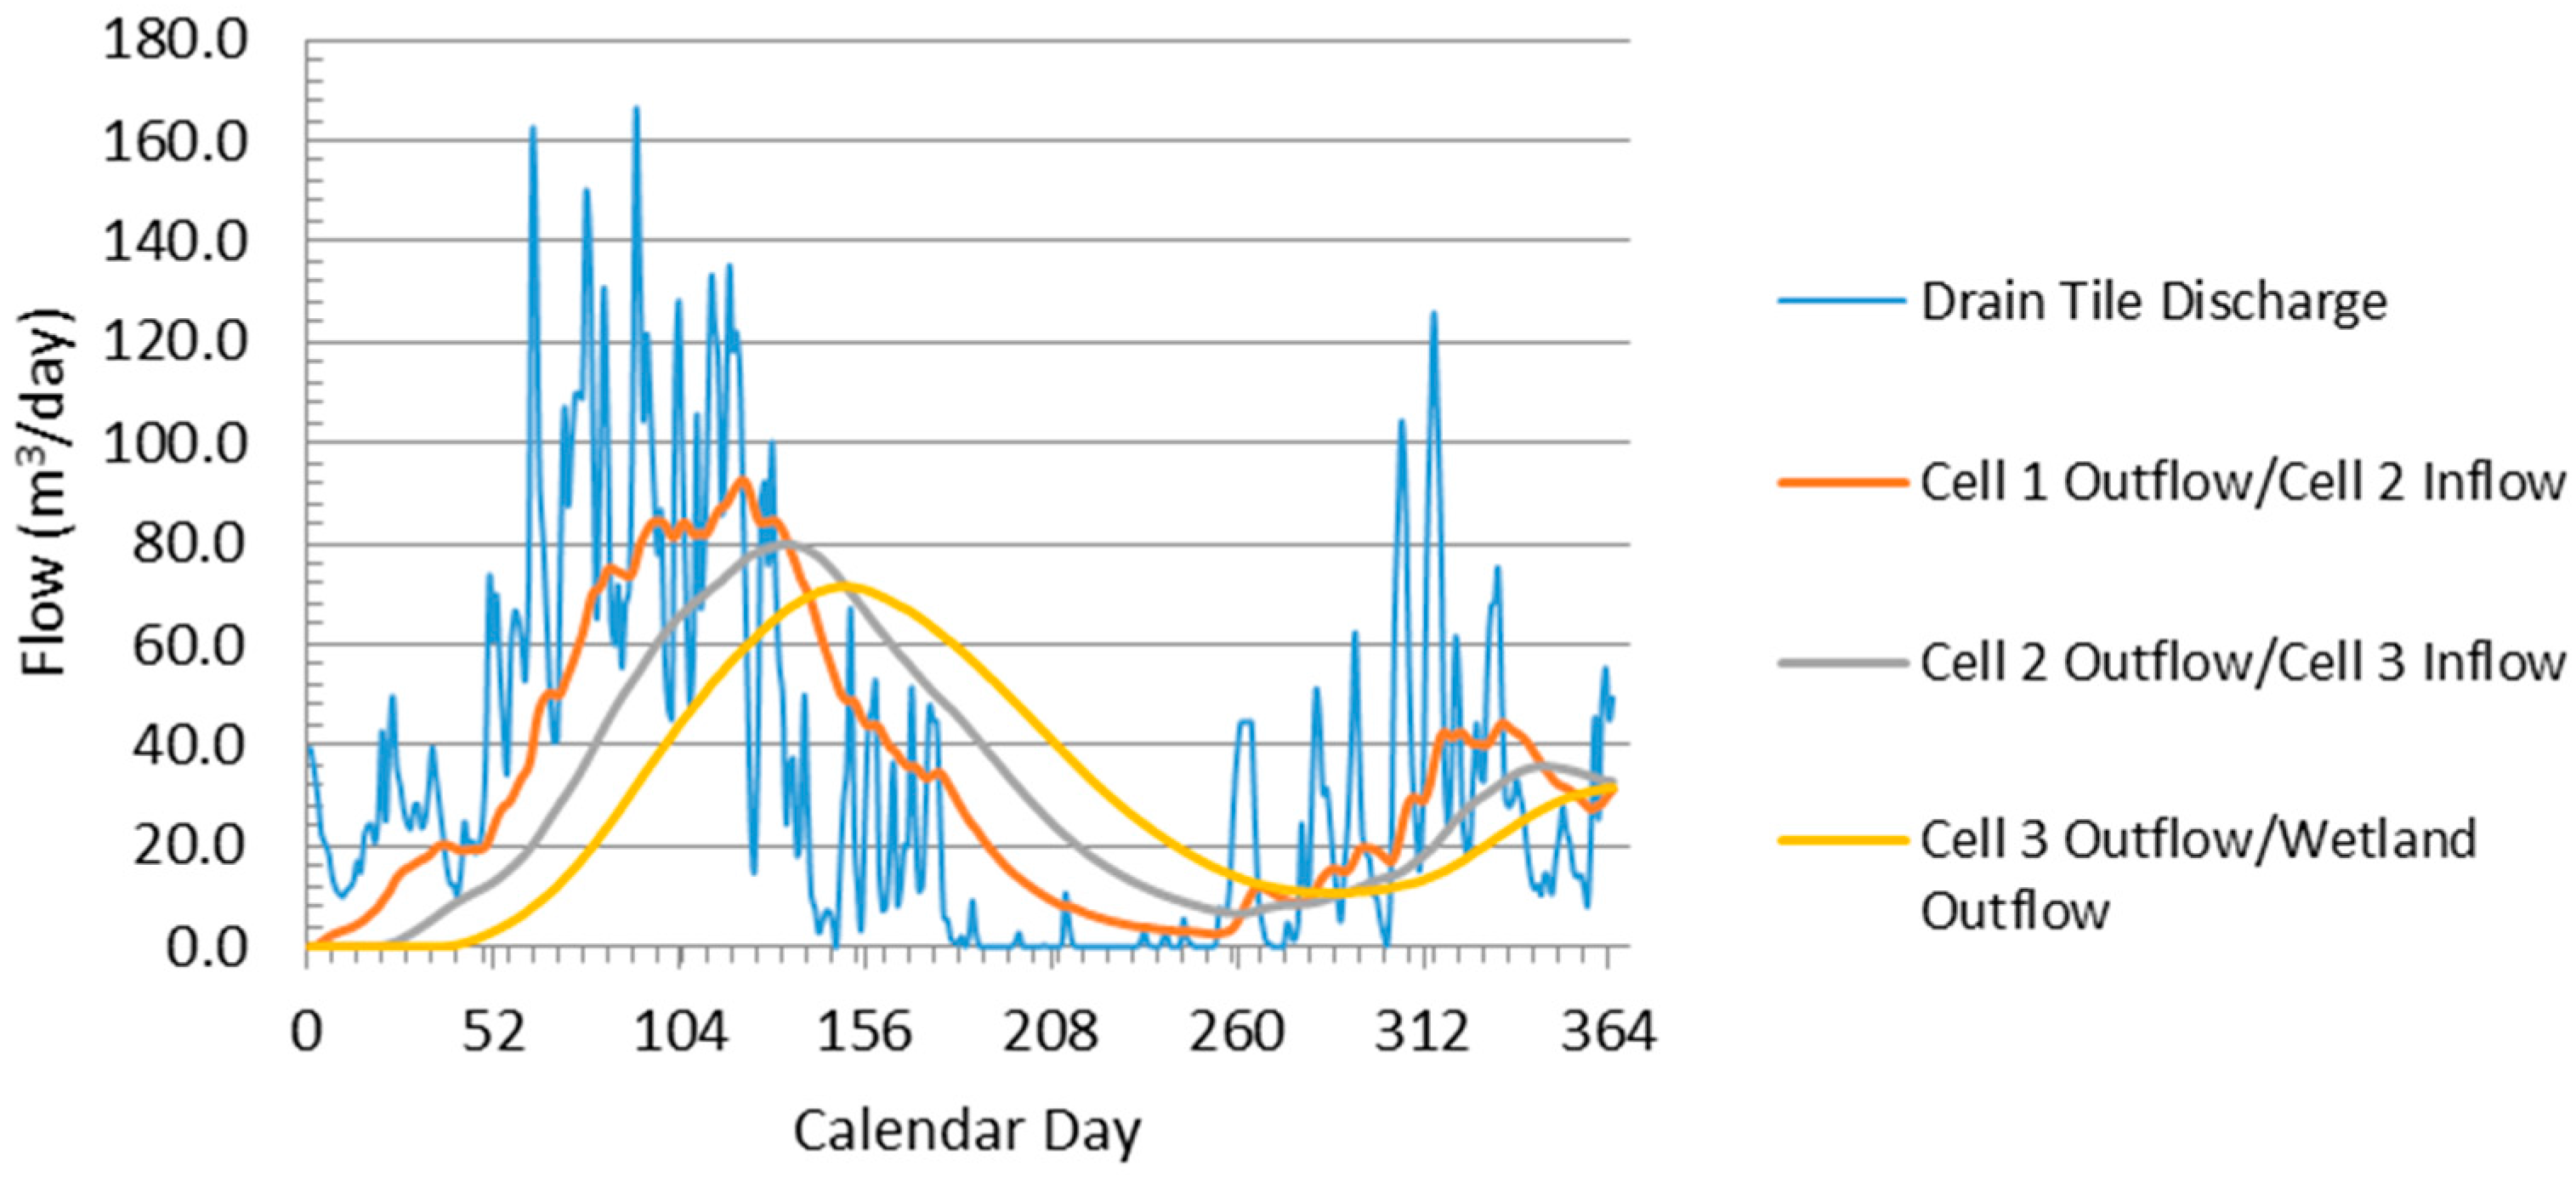
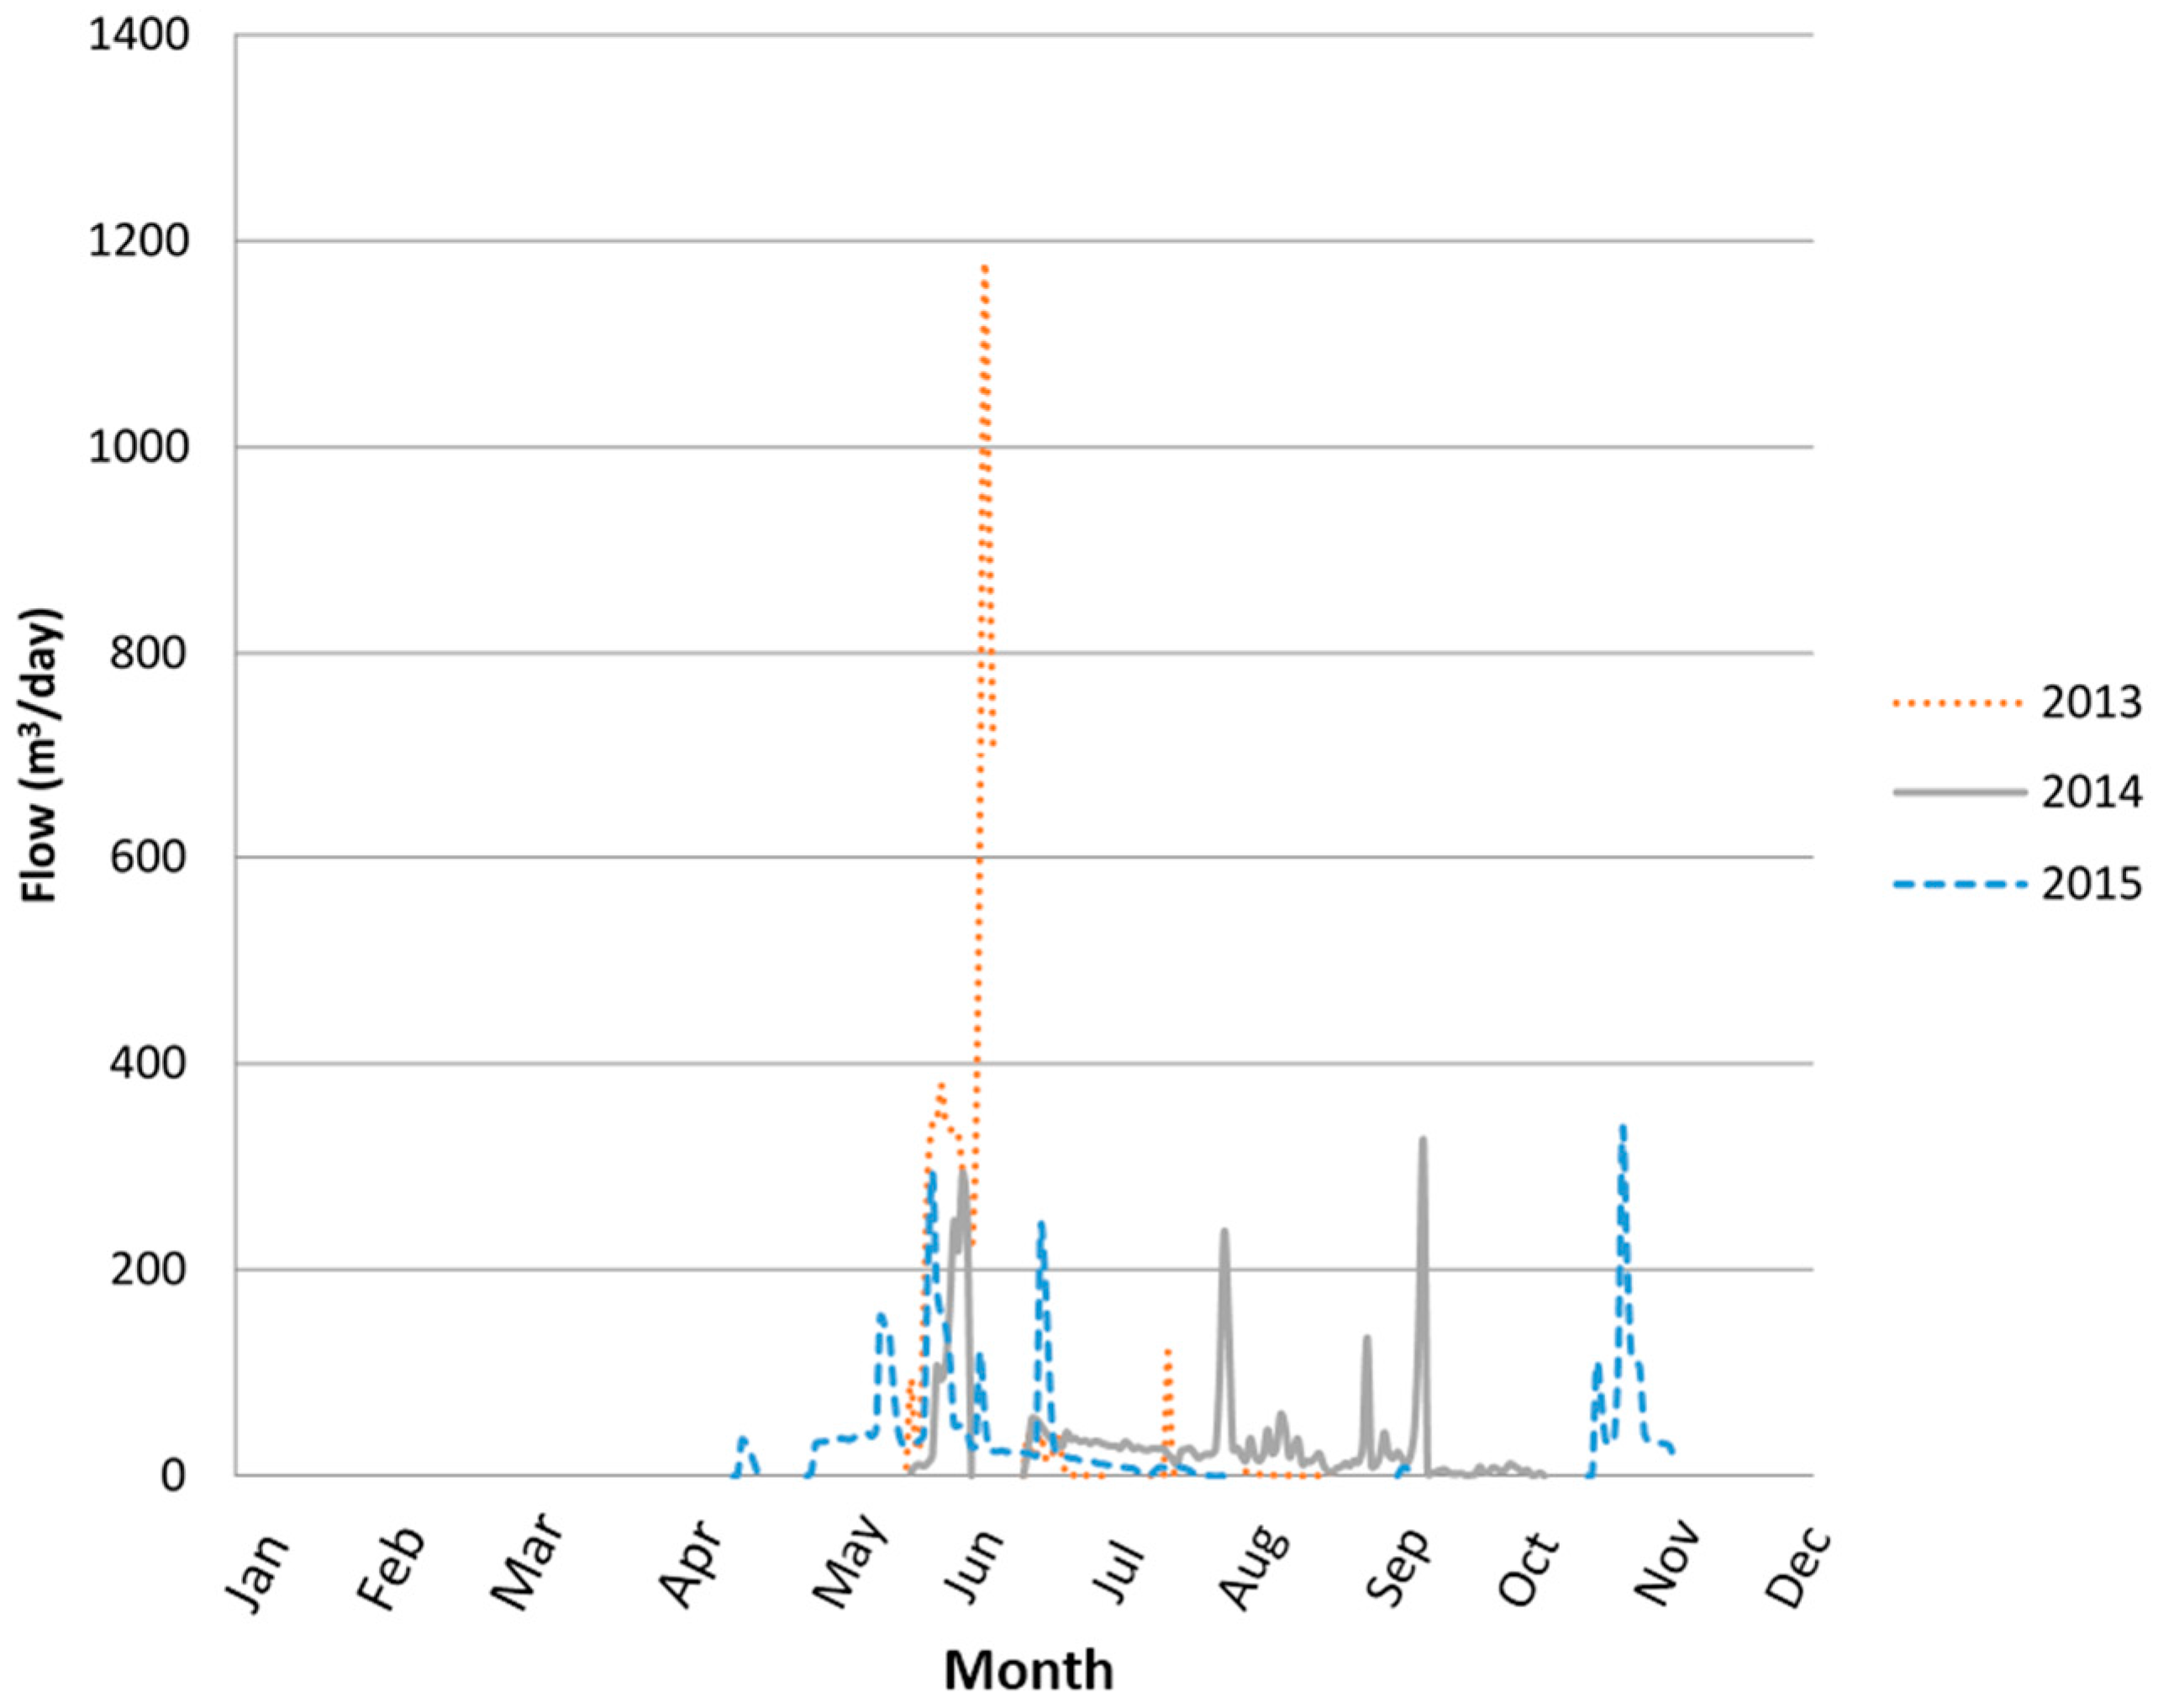
In contrast to flow volume, the peak was much greater than predicted. A daily maximum volume of seven times that predicted by the models was observed with 1172 m3/day compared to 166 m3/day predicted. This is, in part, due to the fact that Drainmod uses daily flow averages as the input and may not simulate extreme precipitation events as accurately. The peak daily flow observed in June 2013 followed an extremely wet precipitation period where the three preceding months exceed normal precipitation by over 10 cm.

4.2.2. Duration and Timing of Flows

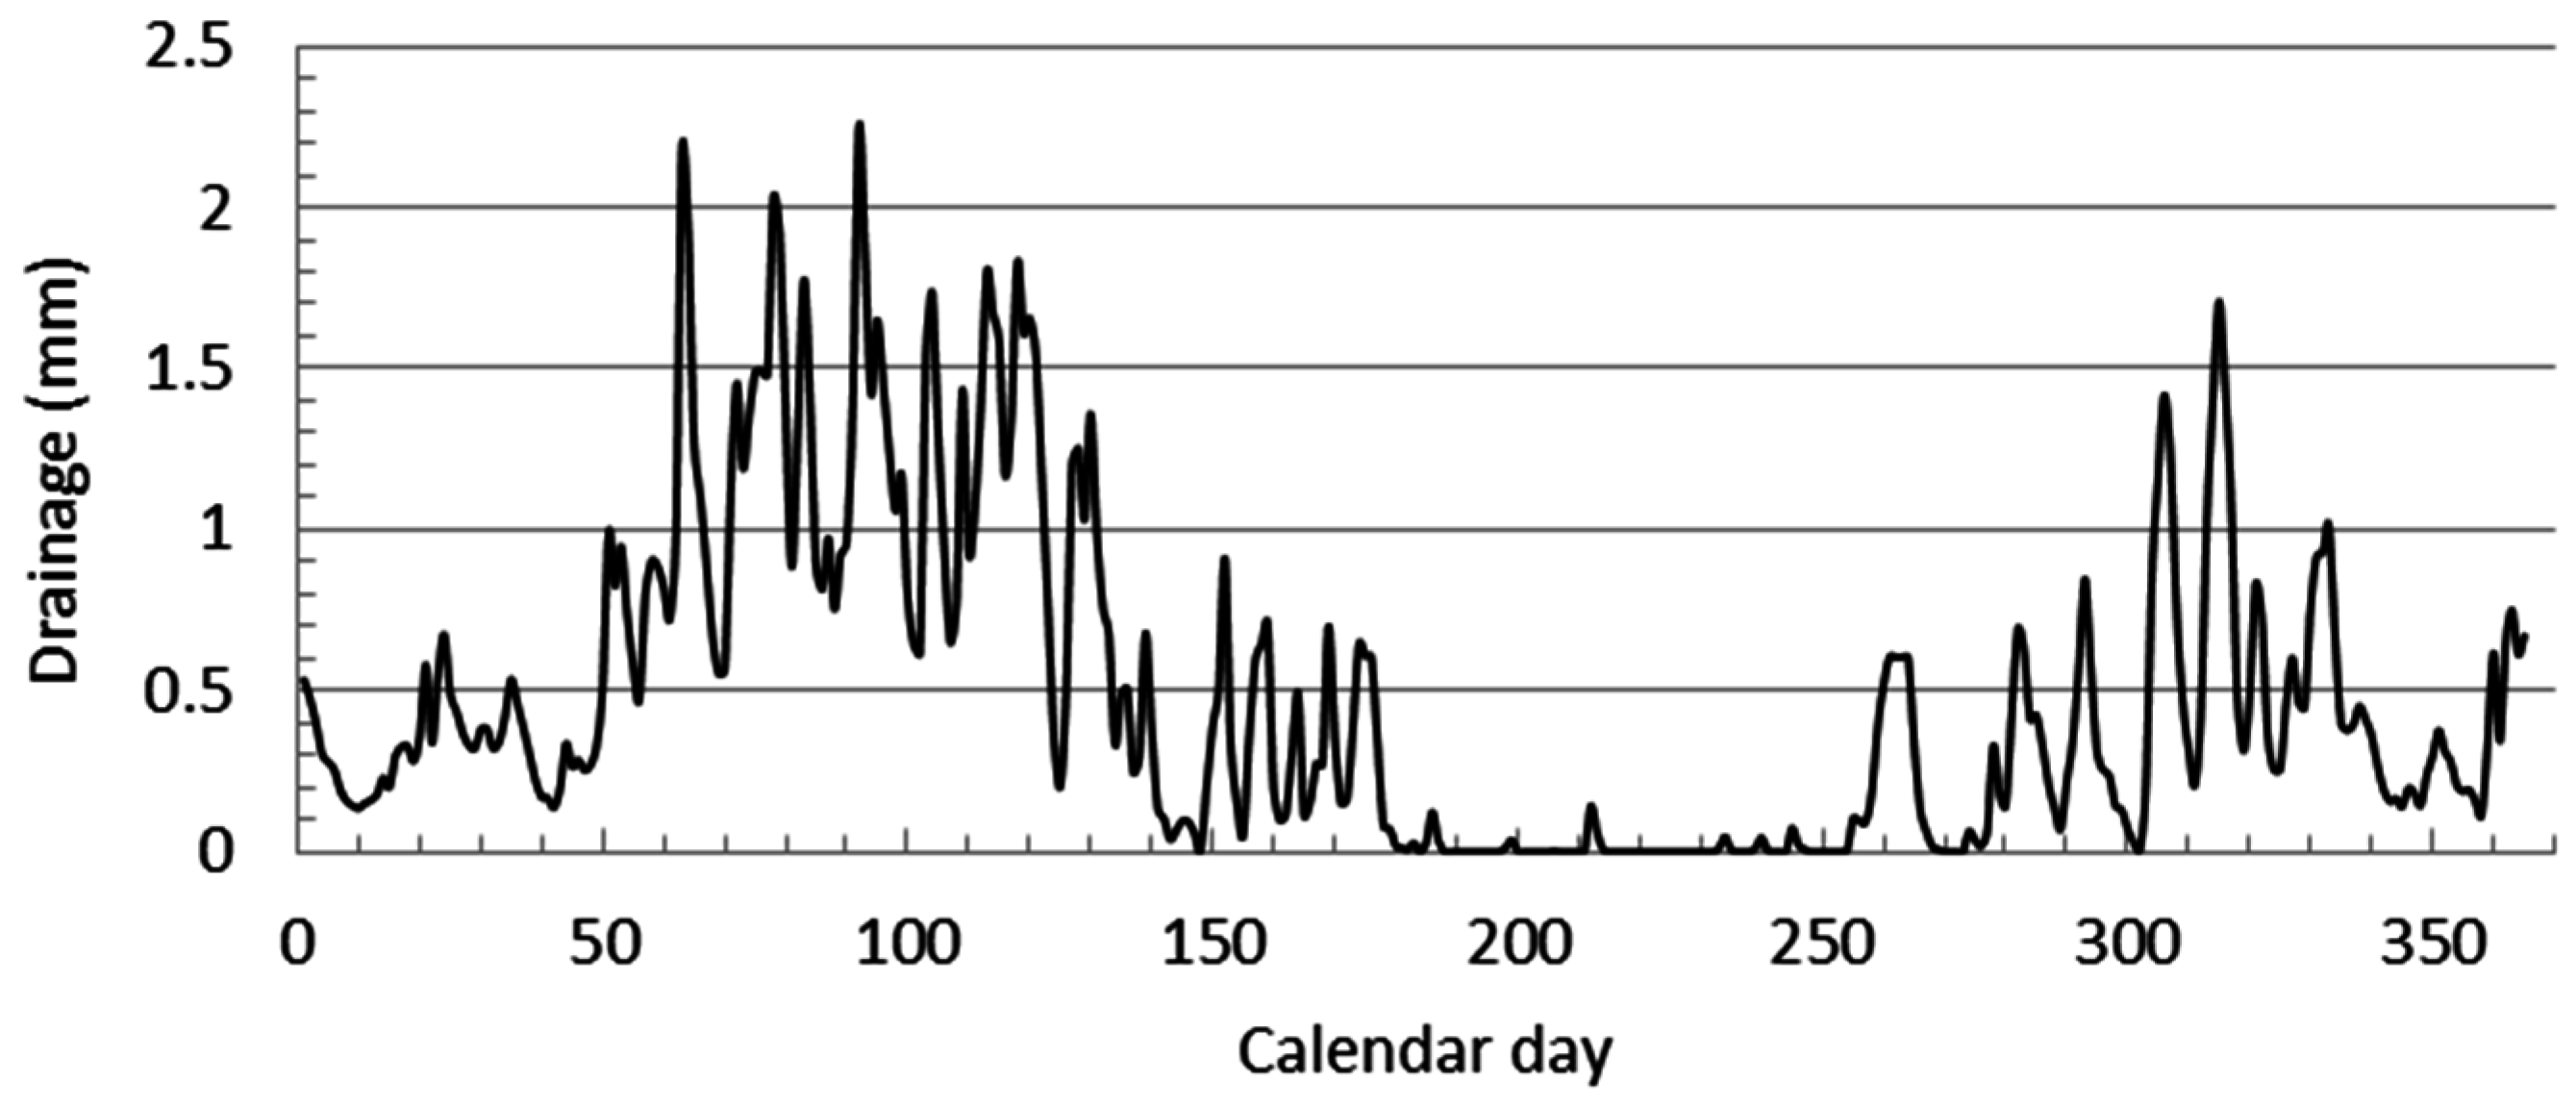
The number of days with tile inflow was 33% of that predicted by the model. The timing of flows differed in that the model predicted flow throughout the year, except much of July and August, while the monitoring data showed that inflow occurred primarily from March to June with no winter flow. The period of late summer and fall had little or no inflow all three years due to crop transpiration in the watershed that significantly reduced tile flow. Less rainfall in the late summer months also contributed to falling water levels during that time period.

4.2.3. Flow Path in Wetland: Subsurface vs. Surface

Modeling assumed there would be prolonged surface ponding of water while monitoring data showed that most of the water infiltrated within hours to days of storm events. The predominance of subsurface flow increased the residence time from hours to days or weeks. This was possible given the relatively small size of the contributing drainage area of 10 ha. Larger drainage basins would tend to create surface flow-dominated systems.

4.3. Nutrient Removal Effectiveness and Issues

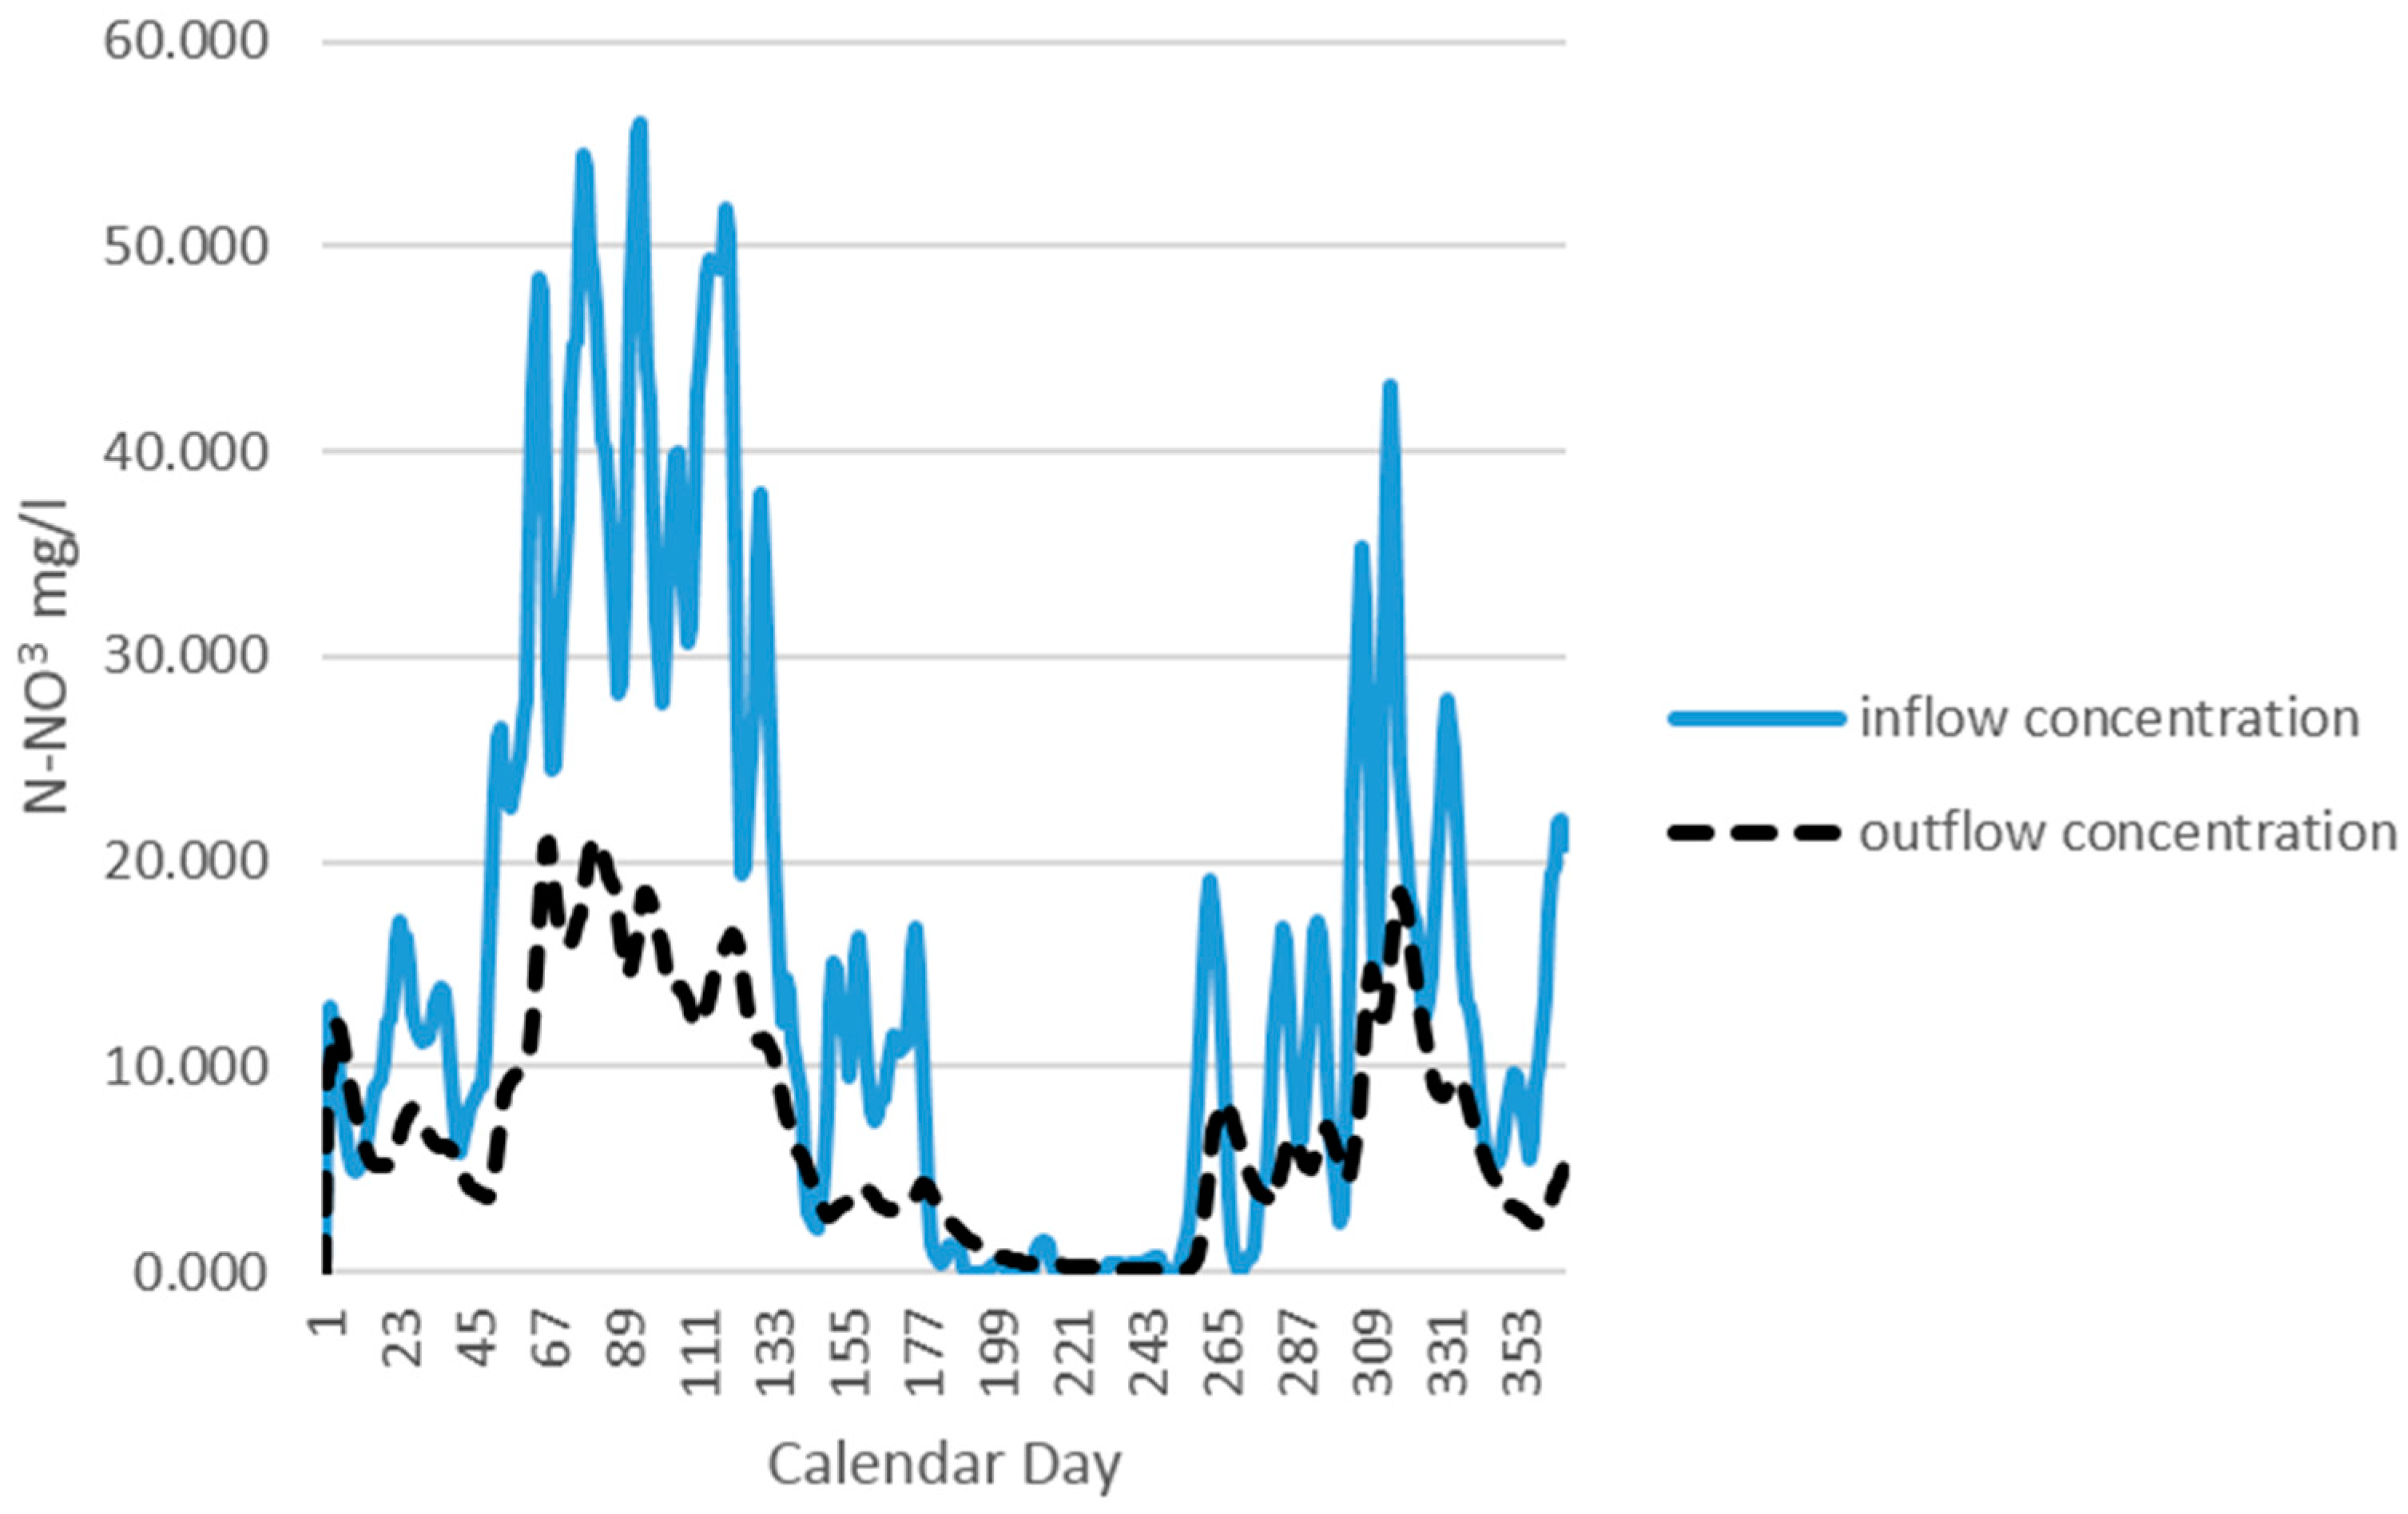
Given the greater peak flows and shorter ponding period, surface water residence time was apparently much shorter than that predicted by the model, resulting in lower nitrate removal rates.
However, the lower inflow volume led to greater percentage nitrate removal in the subsurface flow. Intermittent flow leading to temporary soil drying may have reduced denitrifying bacteria activity. The mineral soils that were not high in organic matter may have limited bacterial activity as well as compaction by grading during construction.
Nitrate removal was approximately equal to the predicted rate. Given that a much greater inflow volume of water and total load of nitrate was predicted by the model, the wetland was actually less efficient than predicted in terms of the total load removed. Although not the focus of this paper, phosphorus removal was also very high due to plant uptake and harvest as described in the project report [25]. Phosphorus removal exceeded inflow from the tile drain in the third year indicating that the vegetation was extracting soil phosphorus and lowering residual levels.

4.4. Vegetation

The wetland vegetation that developed was a wet prairie plant community composition with primarily facultative to facultative wet grasses and forbs. In addition to providing enhanced evapotranspiration rates in 2014 and 2015, vegetation helped establish a source of organic carbon for denitrifying bacteria to utilize for reduction processes [26]. Vegetation establishment could have, in theory, been improved by water level drawdown in the wetland to promote growth in year 1. With surface water flooding from Elm Creek occurring June 2013, water level management was not possible, delaying full plant establishment until 2014–2015. When establishing future treatment wetland systems, if it is possible, vegetation establishment should be encouraged prior to diverting water into the wetland.

4.5. Cost and Landowner Adoption Issues

Construction cost was approximately $25,000/ha, which was comparable (on a per unit area of wetland installed) to other treatment wetlands. A three-cell design would be discouraged, which would significantly reduce this cost. The entire project area was only 0.2 ha; therefore, the land purchase or easement cost was greatly reduced. This could lead to a greater adoption rate, especially in states such as Minnesota with statutory buffer requirements. The design provided an edge-of-field construction location, adjacent or within standard buffer placement, to encourage landowner adoption by reducing the land area taken out of production. The cooperating farmer-landowner involved in this project, like other producers, was concerned about the reduction of production farmland that would be required for the construction of the treatment wetland. These smaller designs could be cited in low production areas or areas already requiring buffer adoption, making them an actionable practice for implementation by willing producers.
Some studies have shown that farmer-landowners are less willing to adopt innovative new management practices [27]. To address this barrier, field trips and walking demonstration tours were hosted onsite to promote the practice to regional landowners and agency staff. Although landowner surveys were not conducted, feedback obtained from meetings suggest that small, edge-of-field wetlands are more likely to be adopted than large wetlands that use up substantial amounts of farmland. Looking for areas on farms that are not in production and using them for establishing wetlands should improve adoption.

4.6. Future Research Needs

Typically restored or constructed wetlands in this region have lower removal rates for dissolved phosphorus than sediment, particulate phosphorus and nitrate [28]. There is a strong need to develop wetlands and other water-retention best management practices (BMPs) that are able to more effectively control eutrophication in downstream rivers and lakes that are especially sensitive to dissolved phosphorus.
The effects and combinations of practices placed in series from upstream to downstream are not well documented. In order to achieve nutrient reduction goals in Midwestern farmland, multiple BMPs in series will need to be utilized. In particular, practices that can reduce or store water are needed to reduce total loads. At the study site discussed in this paper, the use of cover crops in fall 2014 to spring 2015 greatly reduced flow into the treatment wetland, improving its performance. Combinations of in-field and edge-of-field practices show great promise for nutrient load reduction but have been little-studied to date.

5. Conclusions

A novel design for treating subsurface tile flow was developed for the region that is compatible with Midwestern tile-drained farm systems. While the wetland was effective at removing nitrate, the hydrologic inputs, hydraulics and flow-pathways were slightly different than predicted, particularly the inputs and pathways for subsurface drainage. The lessons learned from this project regarding wetland design, vegetation establishment, and the effects of hydrologic regime on nutrient removal performance will be useful in the development of regional watershed scale management and implementation plans.
Adoption of treatment wetlands and similar nutrient removal and water storage BMPs will be needed to achieve regional and state water quality goals, with the ultimate objective of reducing the input contribution to the Gulf of Mexico. Development of practical BMP designs to increase farmer-landowner adoption will encourage progress toward achieving the broader, national nutrient reduction goals [1].

Acknowledgments

Funding was provided by the Minnesota Department of Agriculture through the Clean Water Legacy Fund. Ashley Brenke, Dustin Benes and Richard Perrine of Martin SWCD provided assistance in water quality data collection. The Darwin Roberts family allowed the University of Minnesota to do research on their land for four years and continuing through 2018. Rural Advantage and University of Minnesota Extension helped coordinate public field trips to the site for public education. Numerous undergraduate and graduate students helped to collect soil and water data. Derek Lash of EOR, Inc. developed the grading plan for construction. The map of the Minnesota River basin in Figure 1 was used with permission of the Water Resources Center at Minnesota State University-Mankato. Finally, Scott Matteson of the Minnesota Department of Agriculture provided technical monitoring assistance.

Author Contributions

Christian Lenhart led the synthesis of the project data, writing of this paper, wetland construction management, and the hydrologic monitoring design at the project start. Brad Gordon led data collection and analysis in 2014–2015 and wrote portions of the paper. Josh Gamble led plant data collection and analysis as a graduate student in 2014–2015 and wrote portions of the paper. Dean Current was lead principal investigator on the project and was responsible for overall management of the project. Nikol Ross was a graduate student on the project who helped with installation of monitoring equipment and data collection in 2013–2014. Lydia Herring did DRAINMOD and associated analysis and assisted in preliminary design as a graduate student in 2012. John Nieber developed the hydrologic model used to design the wetland and predict inflow and nutrient removal efficiency. Heidi Peterson acted as project manager for the MDA and contributed to literature review and editing.

Conflicts of Interest

Staffs from the funding sponsor, Minnesota Department of Agriculture, contributed to the project by upgrading monitoring systems in 2015 and doing literature review and editing of the manuscript in 2016.

Abbreviations

The following abbreviations are used in this manuscript:
MPCAMinnesota Pollution Control Agency
MDAMinnesota Department of Agriculture
MVTLMinnesota Valley Testing Laboratory
NRCSNational Resource Conservation Service
SWCDSoil and Water Conservation District
UMNUniversity of Minnesota
ETevapotranspiration
PETpotential evapotranspiration

References

  1. Mitsch, W.; Day, J. Restoration of wetlands in the Mississippi–Ohio–Missouri (MOM) River Basin: Experience and needed research. Ecol. Eng. 2006, 26, 55–69. [Google Scholar] [CrossRef]
  2. Dahl, T.E. Status and Trends of Prairie Wetlands in the United States 1997 to 2009; U.S. Department of the Interior, Fish and Wildlife Service, Ecological Services: Washington, DC, USA, 2014.
  3. Rabalais, N.; Turner, R.; Justić, D.; Dortch, Q. Nutrient changes in the Mississippi River and system responses on the adjacent continental shelf. Estuaries 1996, 19, 386–407. [Google Scholar] [CrossRef]
  4. Goolsby, D.; Battaglin, W. Nitrogen in the Mississippi Basin-Estimating Sources and Predicting Flux to the Gulf of Mexico; USGS Fact Sheet; USGS: Reston, VA, USA, 2000.
  5. Burkhart, M. The hydrologic footprint of annual crops. In A Watershed Year: Anatomy of the Iowa Floods of 2008; Mutel, C.F., Ed.; University of Iowa Press: Iowa City, IA, USA, 2010. [Google Scholar]
  6. Javaheri, A.; Babbar-Sebens, M. On comparison of peak flow reductions, flood inundation maps, and velocity maps in evaluating effects of restored wetlands on channel flooding. Ecol. Eng. 2014, 73, 132–145. [Google Scholar] [CrossRef]
  7. Walters, K.M.; Babbar-Sebens, M. Using climate change scenarios to evaluate future effectiveness of potential wetlands in mitigating high flows in a Midwestern U.S. watershed. Ecol. Eng. 2016, 89, 80–102. [Google Scholar] [CrossRef]
  8. Crumpton, W.; Kovacic, D.A.; Hey, D.L.; Kostel, J.A. Potential of restored and constructed wetlands to reduce nutrient export from agricultural watersheds in the corn belt. In Final Report: Gulf Hypoxia and Local Water Quality Concerns Workshop; American Society of Agricultural and Biological Engineers: St. Joseph, MI, USA, 2008; pp. 29–42. [Google Scholar] [CrossRef]
  9. Lenhart, C. The Influence of Watershed Hydrology and Stream Geomorphology on Turbidity, Sediment and Nutrients in Tributaries of the Blue Earth River, Minnesota, USA. Ph.D. Thesis, University of Minnesota-Twin Cities, Minneapolis, MN, USA, 2008. [Google Scholar]
  10. Fransen, G. Hydrologic, Nutrient, and Sediment Responses of Restored Perennial Vegetation/Wetland Complexes in Southern Minnesota. Master’s Thesis, University of Minnesota-Twin Cities, Minneapolis, MN, USA, 2012. [Google Scholar]
  11. Kovacic, D.A.; David, M.B.; Gentry, L.E.; Starks, K.M.; Cooke, R.A. Effectiveness of constructed wetlands in reducing nitrogen and phosphorus export from agricultural tile drainage. J. Environ. Qual. 2000, 29, 1262–1274. [Google Scholar] [CrossRef]
  12. Randall, G.W.; Mulla, D.J. Nitrate Nitrogen in Surface Waters as Influenced by Climatic Conditions and Agricultural Practices. J. Environ. Qual. 2001, 30, 337–344. [Google Scholar] [CrossRef] [PubMed]
  13. Mirek, S. Effect of Nitrogen Fertilizer Management and Seasonality of Tile Flow on Nitrate-Nitrogen Leaching through Tile Drains. Master’s Thesis, University of Illinois at Urbana-Champaign, Urbana, IL, USA, 2001. [Google Scholar]
  14. Kellman, L. A study of tile drain nitrate-δ15N values as a tool for assessing nitrate sources in an agricultural region. Nutr. Cycl. Agroecosyst. 2005, 71, 131–137. [Google Scholar] [CrossRef]
  15. Perciasepe, R. National Strategy for the Development of Regional Nutrient Criteria; EPA 822-R-98-002; United States Office of Water: Washington, DC, USA, 1998.
  16. Galatowitsch, S.; Van der Valk, A. Restoring Prairie Wetlands: An Ecological Approach; Iowa State University Press: Ames, IA, USA, 1994. [Google Scholar]
  17. Kadlec, R.H.; Wallace, S.D. Treatment Wetlands, 2nd ed.; CRC Press: Boca Raton, FL, USA, 2009. [Google Scholar]
  18. USDA-Natural Resource Conservation Service (NRCS). CP39 FWP Constructed Wetland. In FSA Handbook, Agricultural Resource Conservation Program for State and County Offices, Short Reference; 2-CRP, Revision 5; Farm Service Agency, U.S. Department of Agriculture: Washington, DC, USA, 2010; Exhibit 11; pp. 235–241. [Google Scholar]
  19. Reed, S.; Crites, R.; Middlebrooks, E. Natural Systems for Waste Management and Treatment; McGraw-Hill, Inc.: New York, NY, USA, 1995. [Google Scholar]
  20. Skaggs, R.; Breve, M.; Gilliam, J. Hydrologic and water quality impacts of agricultural drainage. Crit. Rev. Environ. Sci. Technol. 1994, 24, 1–32. [Google Scholar] [CrossRef]
  21. Civil Engineering Portal. Weirs [Internet]. Available online: http://www.engineeringcivil.com/weirs.html (accessed on 1 April 2012).
  22. Federer, C.A.; Vörösmarty, C.; Fekete, B. Intercomparison of Methods for Calculating Potential Evaporation in Regional and Global Water Balance Models. Water Resour. Res. 1996, 32, 2315–2321. [Google Scholar] [CrossRef]
  23. Lu, J.; Sun, G.; McNulty, S.; Amatya, D. A comparison of six potential evapotranspiration methods for regional use in the southeastern United States. J. Am. Water Resour. Assoc. 2005, 41, 621–633. [Google Scholar] [CrossRef]
  24. Chun, J.; Cooke, R. Technical note: Calibrating Agridrain water level control structures using generalized weir and orifice equations. Appl. Eng. Agric. 2008, 24, 595–602. [Google Scholar] [CrossRef]
  25. Current, D.; Lenhart, C.F.; Gordon, B.; Gamble, J.; Ross, N. On-Farm Evaluation of Treatment Methods for Excess Nutrients in Agricultural Subsurface Tile Drainage; Minnesota Department of Agriculture: St. Paul, MN, USA, 2016. [Google Scholar]
  26. Reed, S.; Brown, D. Subsurface flow wetlands—A performance evaluation. Water Environ. Res. 1995, 67, 244–248. [Google Scholar] [CrossRef]
  27. Nassauer, J.I.; Dowdell, J.A.; Wang, Z.; McKahn, D.; Chilcott, B.; Kling, C.L.; Secchi, S. Iowa farmers’ responses to transformative scenarios for Corn Belt agriculture. J. Soil Water Conserv. 2011, 66, 18A–24A. [Google Scholar] [CrossRef]
  28. Miller, T.P.; Peterson, J.R.; Lenhart, C.F.; Nomura, Y. The Agricultural BMP Handbook for Minnesota; Minnesota Department of Agriculture: St. Paul, MN, USA, 2012. [Google Scholar]
Figure 1. Project location showing, upper left: location of Minnesota within the United States, right: location of the Minnesota River basin and treatment wetland site within Minnesota, and lower left showing location of the wetland in relationship to farmland and Elm Creek. Lower left photo by David Hansen.
Water 08 00549 g001
Figure 2. (a) Schematic of treatment wetland design; (b) Right: aerial view of treatment wetlands in July 2016. Subsurface tile flow from farmland located uphill drains into the wetland system and meanders through the three cells prior to discharging in the upper left corner to Elm Creek, shown in lower left of the right image. Photo by David Hansen.
Water 08 00549 g002
Figure 3. Modeled stage–discharge relationship for the treatment wetland. The wetland’s maximum stage is 1.5 m, which is set by the berm height.
Water 08 00549 g003
Figure 4. Predicted drainage flow in mm over the watershed per day over the model simulation period.
Water 08 00549 g004
Figure 5. Predicted drainage inflow vs. pool outflow showing from each of the three cells within the treatment wetland.
Water 08 00549 g005
Figure 6. Modeled nitrate removal predictions. The inflowing concentration is shown in blue with the outflow as the black dashed line. Removal efficiency was predicted to be greatest during calendar days 180 to 250 (July and August) and least during calendar days 40–180 (months of February to May).
Water 08 00549 g006
Figure 7. Daily tile flow volumes into the wetland in 2013–2015. Data are missing during the flood periods of 2013 and 2014 due to removal of equipment to avoid damage.
Water 08 00549 g007
Figure 8. Outflow distribution of all water that entered the wetland each year. The total water volume includes direct precipitation over the wetland.
Water 08 00549 g008
Table 1. Level-pool routing, mass balance routine input parameters and descriptors *.
ParameterSymbolValueUnits
Head incrementdh0.1m
Q = b1 × h1.5b19.95 **1
Weir cresthc0.25m
Wetland porositypor0.71
Time stepdt1days
Wetland length (per cell)L36.6m
Wetland width (per cell)W9.14m
Wetland side slopesSS31
Concentration–discharge (Q–C) relation 0.44mg/L/m3/day
Kinetic reactionk0.04m/day
# cells 11
Wetland area per cell 334.45m2
Total wetland area 1012m2
Notes: * Assuming no bank loss; ** Value of 9.95 obtained from table of weir equations [21].
Table 2. List of plant species planted in the treatment wetland in 2013. High, medium, and low diversity seed mixtures are indicated along with a 23-species mixture for reseeding. Wetland code refers to the wetness tolerance of plant species.
Scientific NameCommon NameWetland CodeLowMediumHighReseed
Andropogon gerardiiBig BluestemFAC xxx
Bromus ciliatusFringed BromeFACW xx
Calamagrostis canadensisBlue Joint GrassOBL xx
Elymus canadensisCanada Wild RyeFACUxxxx
Glyceria grandisReed Manna GrassOBL xx
Glyceria striataFowl Manna GrassOBL x
Panicum virgatumSwitchgrassFACxxxx
Poa palustrisFowl BluegrassFACWxxxx
Sorghastrum nutansIndiangrassFACU xx
Spartina pectinataPrairie Cord GrassFACW xxx
Carex pellitaBroad-leaved Woolly SedgeOBL xxx
Carex stipataAwlfruit sedgeOBL x
Carex strictaTussock SedgeOBL xx
Carex vulpinoideaBrown Fox SedgeFACWxxxx
Scirpus atrovirensGreen BulrushOBLxxx
Scirpus cyperinusWoolgrassOBLxxx
Anemone canadensisCanada AnemoneFACW xx
Asclepias incarnataSwamp MilkweedOBLxxxx
Bidens frondosaBeggar’s tickFACW x
Desmodium canadenseShowy Tick TrefoilFACUxxx
Eupatorium maculatumJoe Pye WeedOBLxxxx
Eupatorium perfoliatumBonesetOBL x
Helenium autumnaleSneezeweedFACW xxx
Helianthus grosseserratusSawtooth SunflowerFACWxxx
Liatris pycnostachyaPrairie BlazingstarFAC xx
Lobelia siphiliticaGreat Blue LobeliaOBL x
Mimulus ringensMonkey FlowerOBL xx
Physostegia virginianaObedient plantFACW x
Pycnanthemum virginianumMountain MintFACW x
Rudbeckia laciniataWild golden glowFACW x
Symphyotrichum novae-angliaeNew England asterFACW x
Symphyotrichum puniceusSwamp AsterOBLxxx
Symphyotrichum umbellatusFlat-topped AsterFACW xx
Verbena hastataBlue VervainFACWxxxx
Vernonia fasciculataCommon IronweedFACW xx
Veronicastrum virginicumCulver’s RootFAC x
Zizia aureaGolden AlexandersFAC xx
Avena sativaOat (as cover crop)NAxxx
Notes: FAC = facultative; FACW = facultative wetland; OBL = obligate; FACU = facultative upland; NA = not applicable.
Table 3. Volume of water flowing into the wetland from tile drainage each year of the study. The flow period is also listed by start and end dates each year.
YearTile Drain Inflow Volume (m3)Starting Date of FlowApproximate Last Date of Flow
2013 *7240 (5239–9240 **)5 June11 September
201412,732 (9215–16,277 **)27 April30 October
20155666 (5575–5669 **)28 April1 December
Notes: * Measurements began in late May of 2013, therefore early spring flow events are not included in the 2013 estimate; ** Range of values calculated based on instrument accuracies and uncertainty in inflow estimates when calculating from rainfall in 2014 rather than instrument measurements.
Table 4. Approximate number of days of inundation observed in each wetland cell. This was defined as the number of days water was covering the entire cell and reached the control structure leading out of the cell.
Flow StatisticYearTotal for Monitoring Period
201320142015
Flow into wetland5418298334
Inundation Cell 1288817133
Inundation Cell 21943769
Inundation Cell 31331044
Flow out of wetland1327040
Table 5. Cumulative rainfall amounts during the monitoring period from spring thaw to late fall during the years 2013–2015. Measurements of rainfall began after the ground thawed (April) and ended when equipment was removed and temperatures were consistently below freezing, (usually November).
YearRainfall (cm)Direct Rainfall into Wetland Volume and Range (m3)
201346.65512.1 (506.9–517.2)
201446.53510.7 (505.6–515.8)
201560.15660.1 (653–667)
Table 6. Monthly rainfall totals during the years 2013–2015 with comparison to the Normal (30 year average) for Granada, Minnesota.
Month2013 (cm)2014 (cm)2015 (cm)Granada Normal (1981–2010) (cm)
January0.911.731.371.96
February2.822.031.241.78
March4.952.901.174.39
April12.455.235.977.87
May11.7611.3312.809.40
June13.7415.608.2311.46
July4.041.7510.3110.97
August7.987.269.6810.29
September2.012.906.917.98
October7.192.463.945.97
November1.242.596.304.24
December1.702.314.932.82
Total Annual Precipitation70.7958.0972.8579.12
Table 7. Average potential evapotranspiration and transpiration per day during the monitoring period. Water level drawdown was estimated for a time period when water was in the shallow root zone (upper 1 m) with no ponding.
YearHamon PET (mm/Day)Thornthwaite PET (mm/Day)Jensen–Haise PET (mm/Day)Transpiration: from Water Level Drawdown (mm/Day)
20132.352.84NANo data
20143.013.031.07No data
20152.802.73NA2.80
Table 8. Summary comparison of predicted and observed results for hydrologic and water quality performance of treatment wetland.
VariableUnitsPredictedObserved% Observed/Predicted
Total annual inflowm3/year12,8008546 *67%
Peak daily inflowm3/day1661172700%
Frequency of inflow to wetland# of days in year315111 *35%
Duration of wetland inundation% of days per year with ponded water in wetland**4%–12% ***N/A
% nitrate removal% (of total mass removal)67%68%101%
% phosphorus removal% (of total mass removal)n/a ****76%N/A
Notes: * Average over 3 years; ** duration of ponding was not predicted by the model; *** represents the range of duration across the three wetland cells; the highest values were in the first cell with decreasing inundation moving downstream to the outlet; **** phosphorus removal was not modeled since the version of DRAINMOD we used does not have that capacity.

