
Lake Evaporation in a Hyper-Arid Environment, Northwest of China—Measurement and Estimation


Abstract
:1. Introduction
2. Materials and Methods
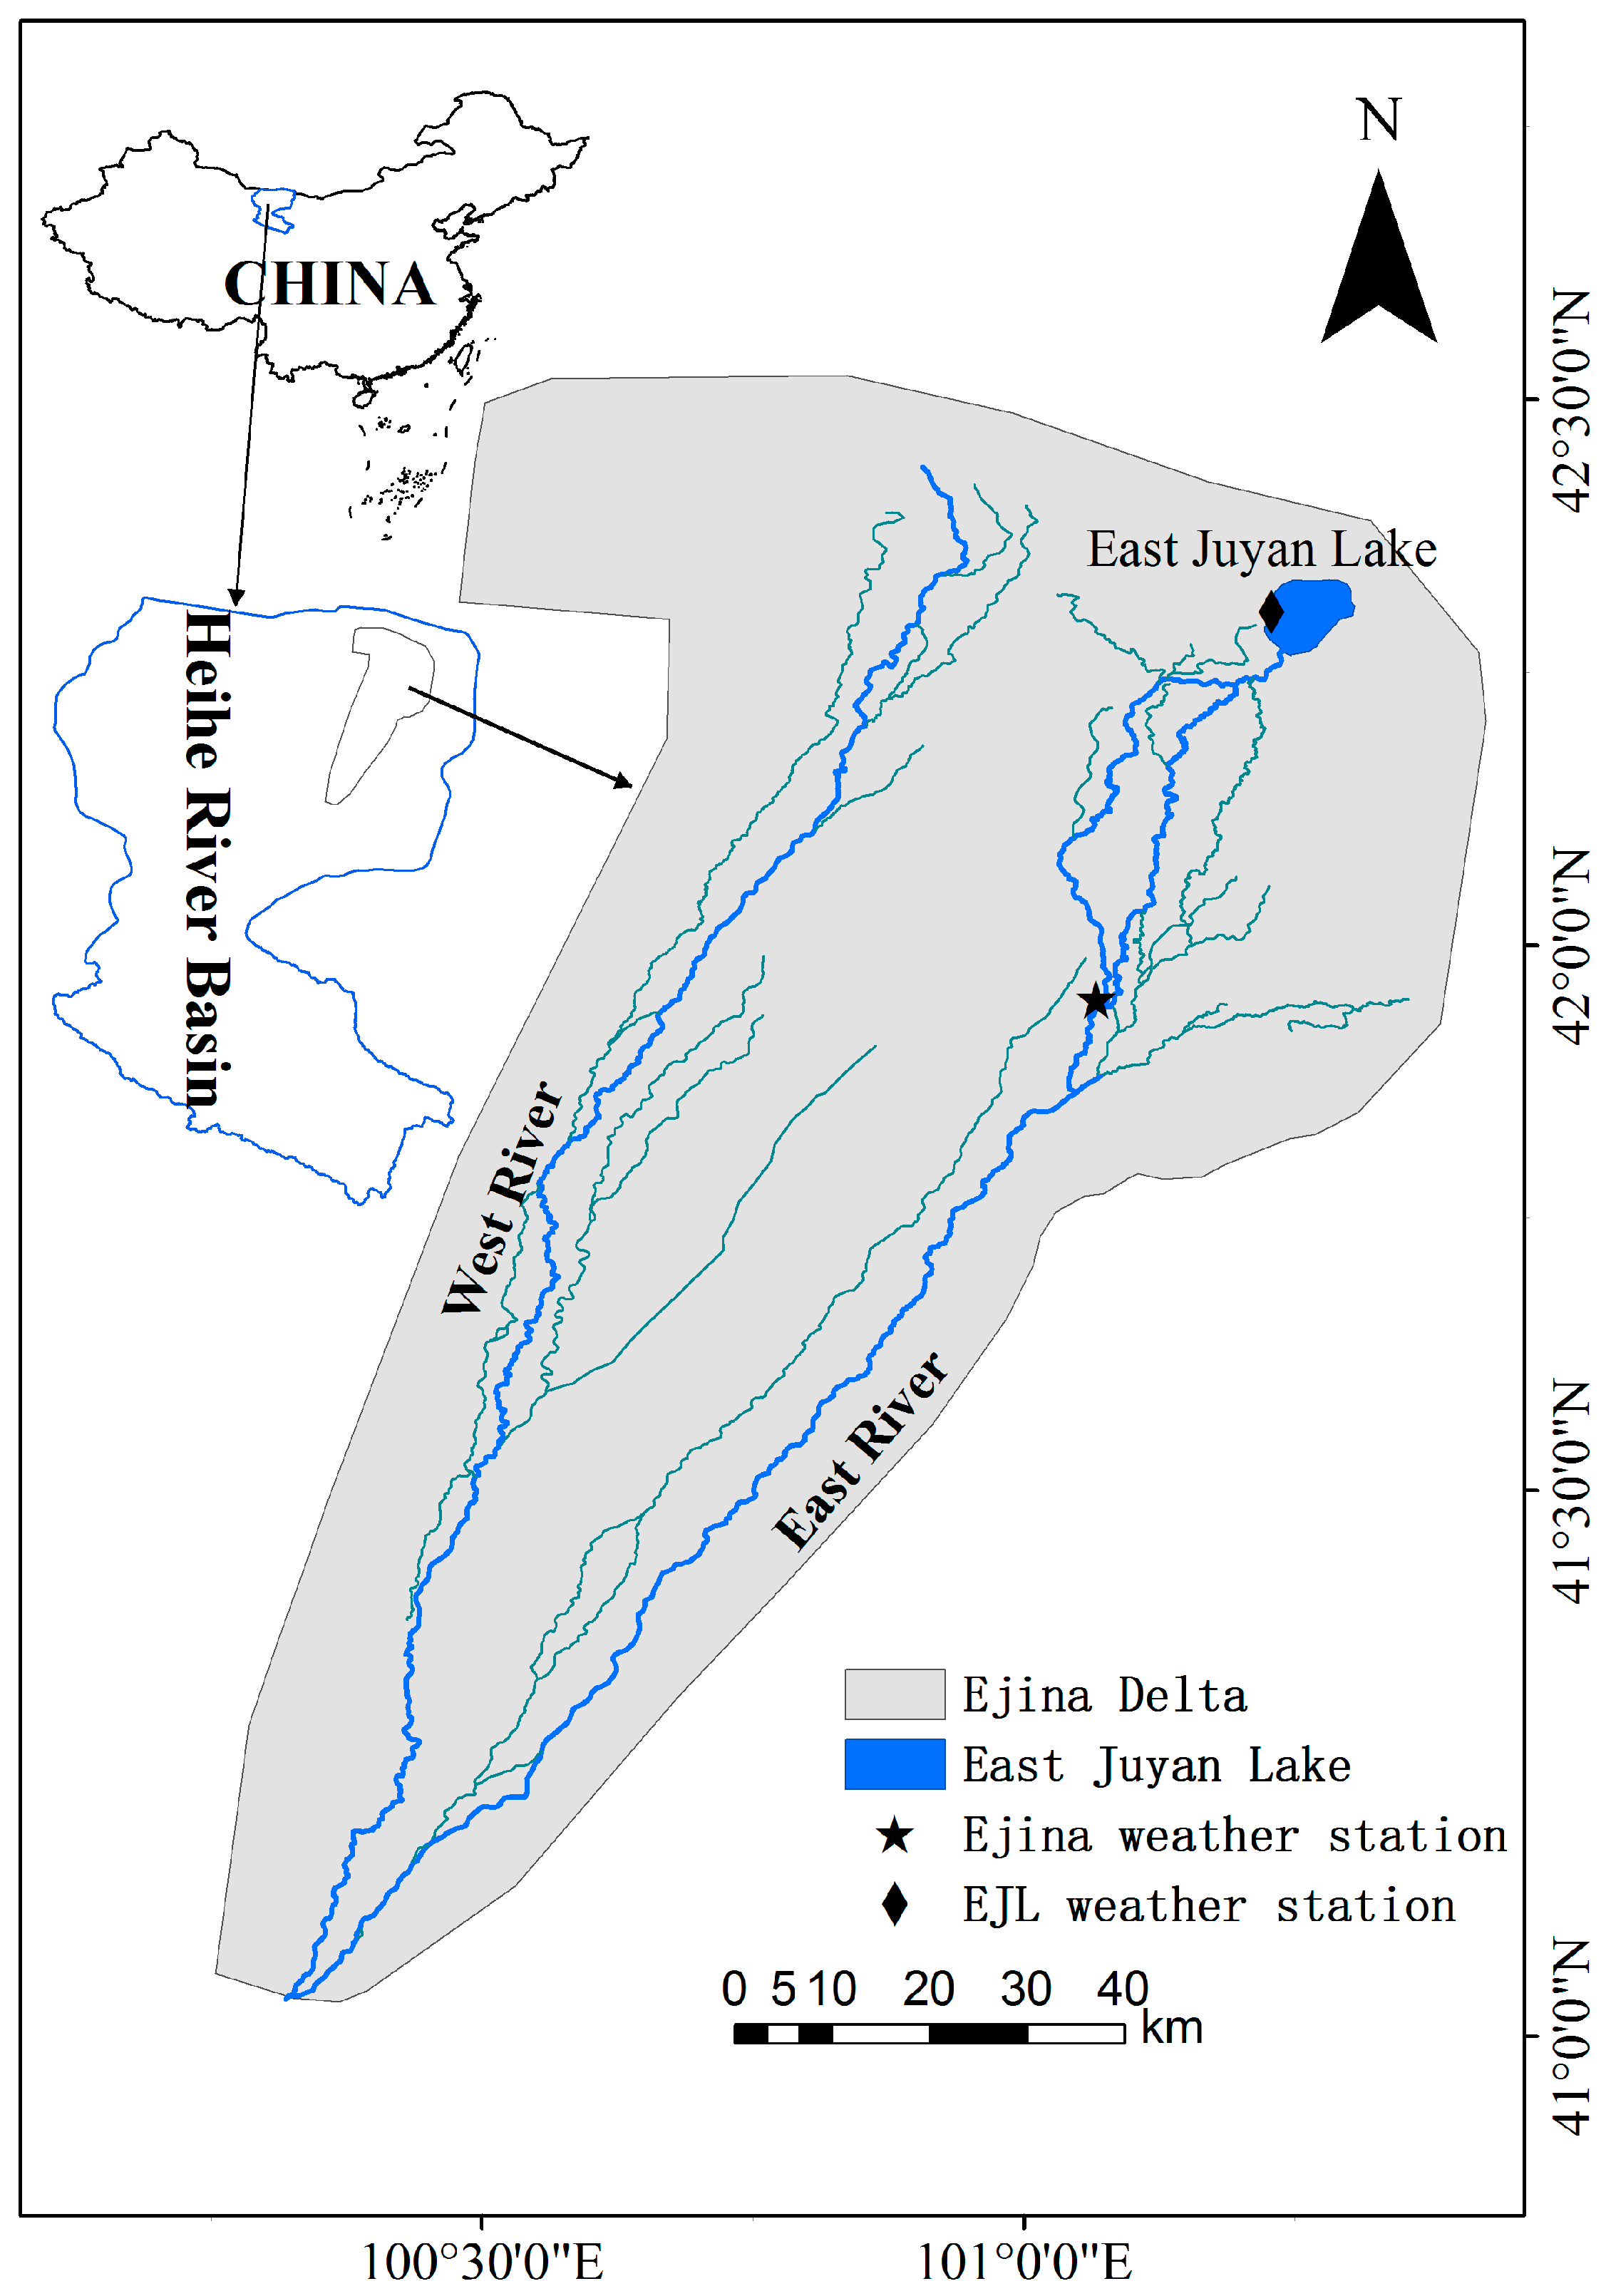
2.1. Study Area
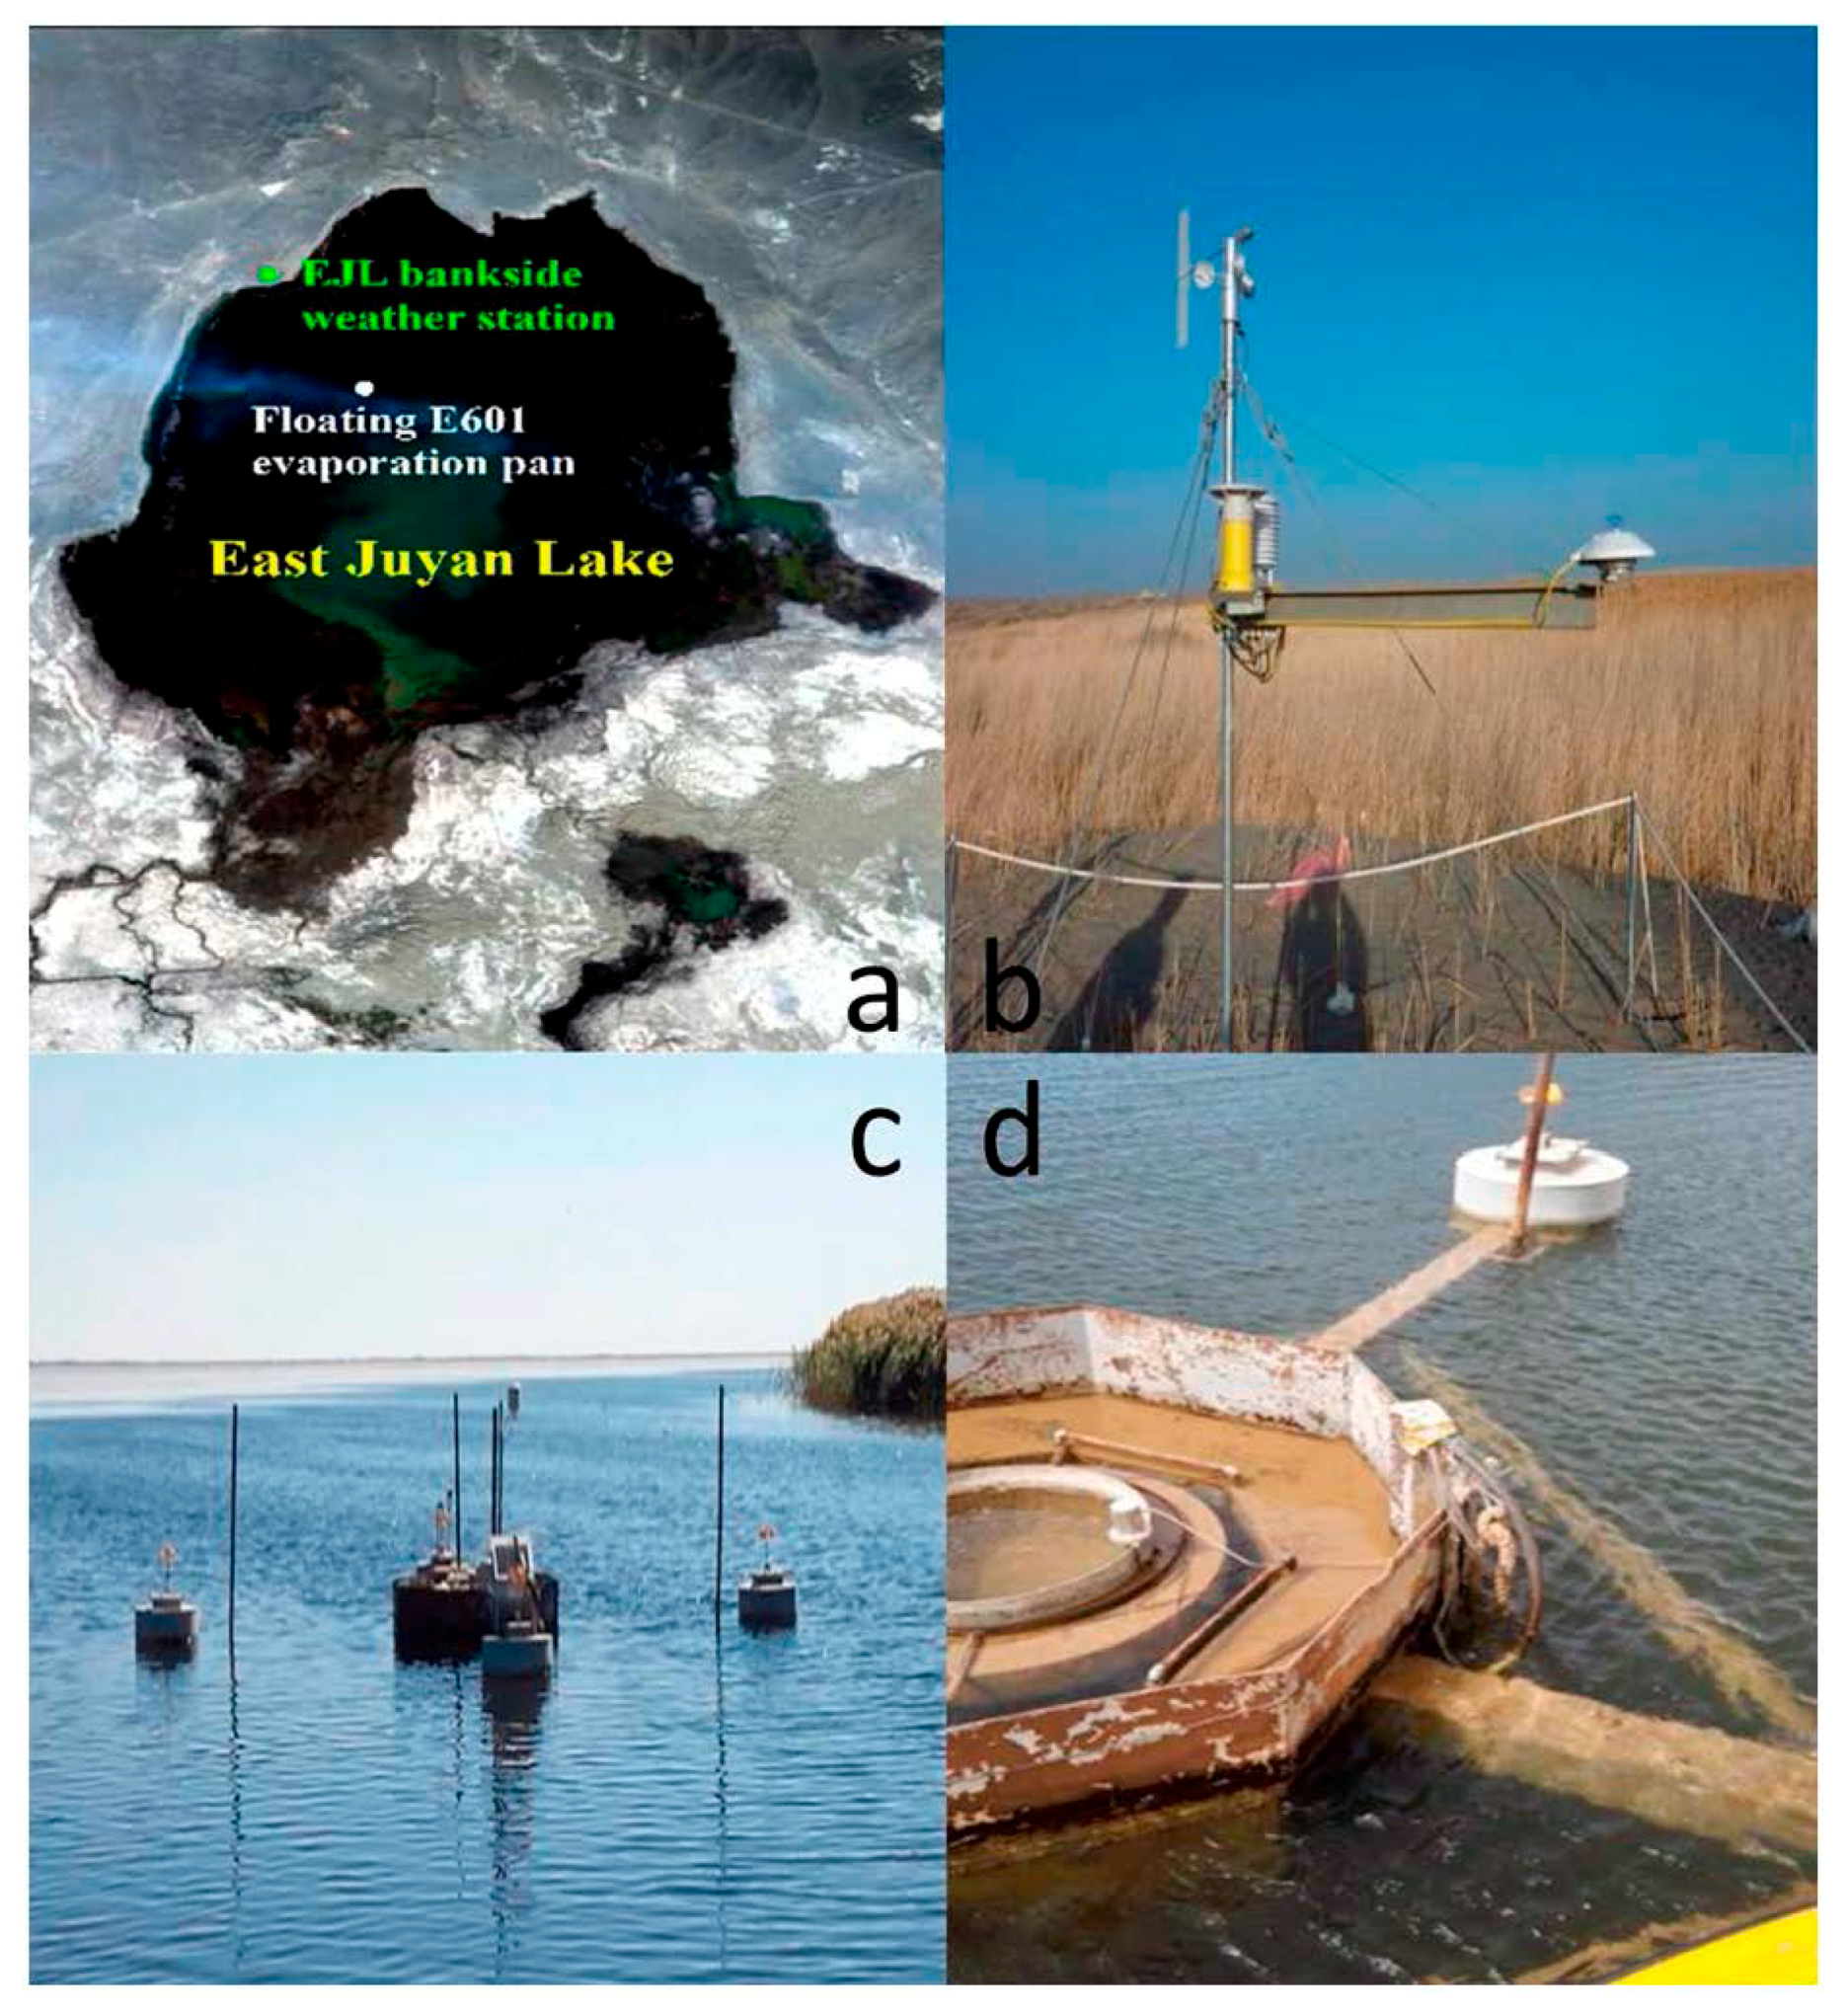
2.2. Material
2.2.1. Data Sources
2.2.2. Data Quality Control
2.3. Method
2.3.1. Brief Description of the E601 Pan
2.3.2. Derivation of the Model
2.3.3. Inter-Comparisons of Evaporation Models
3. Results
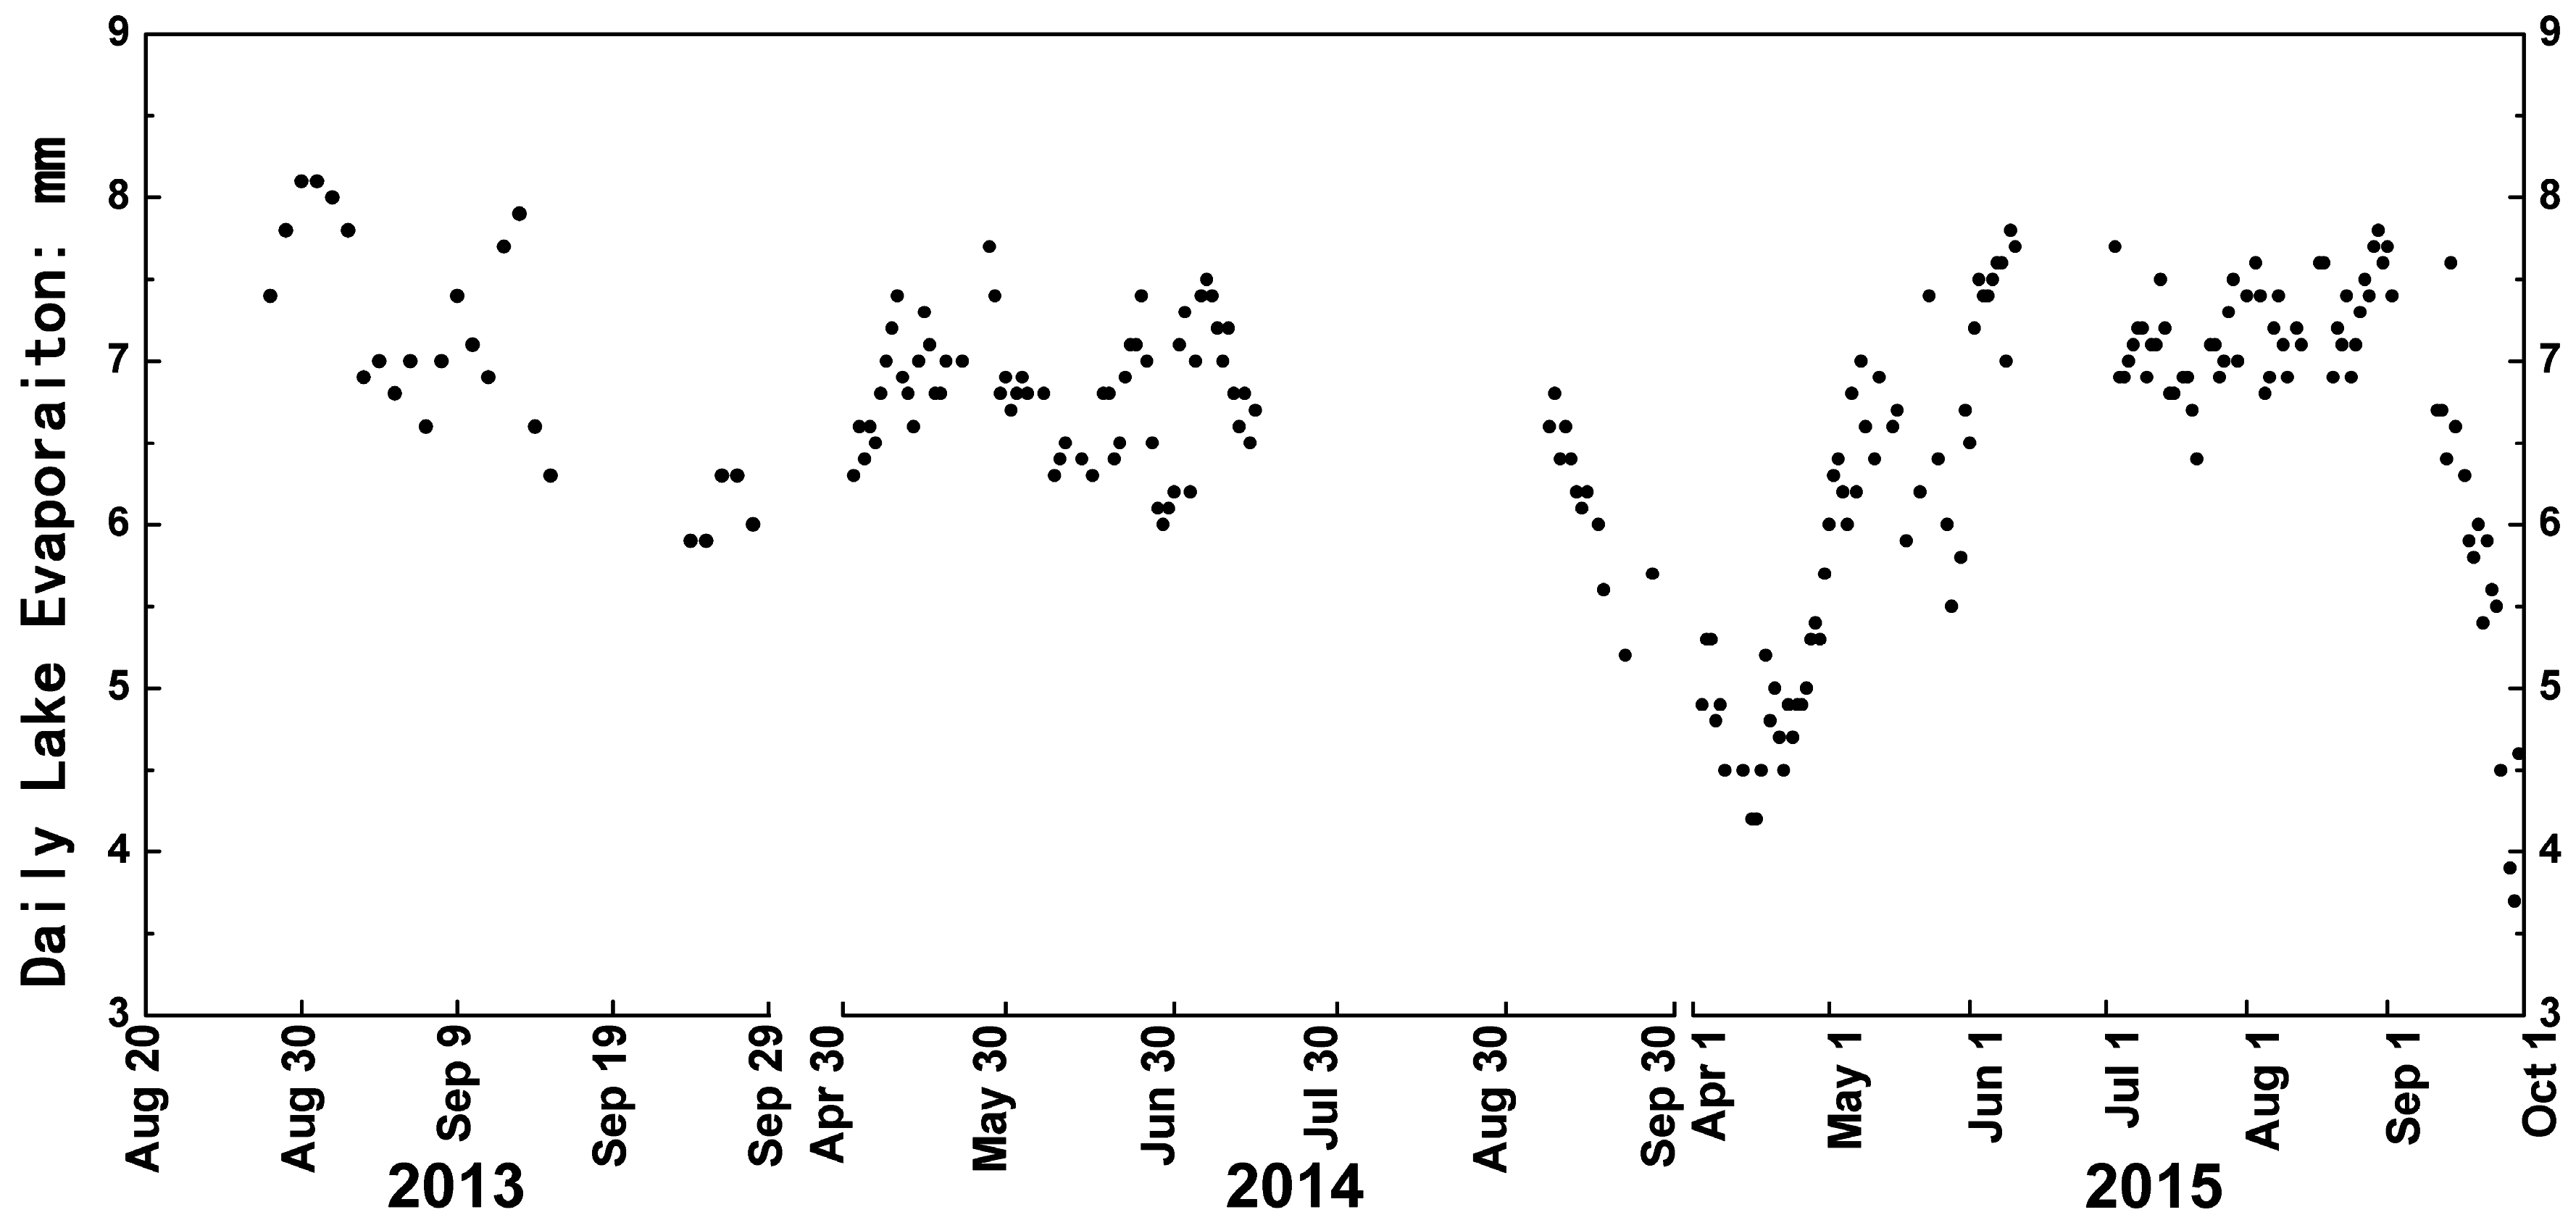
3.1. Time Series of East Juyan Lake’s Daily Evaporation
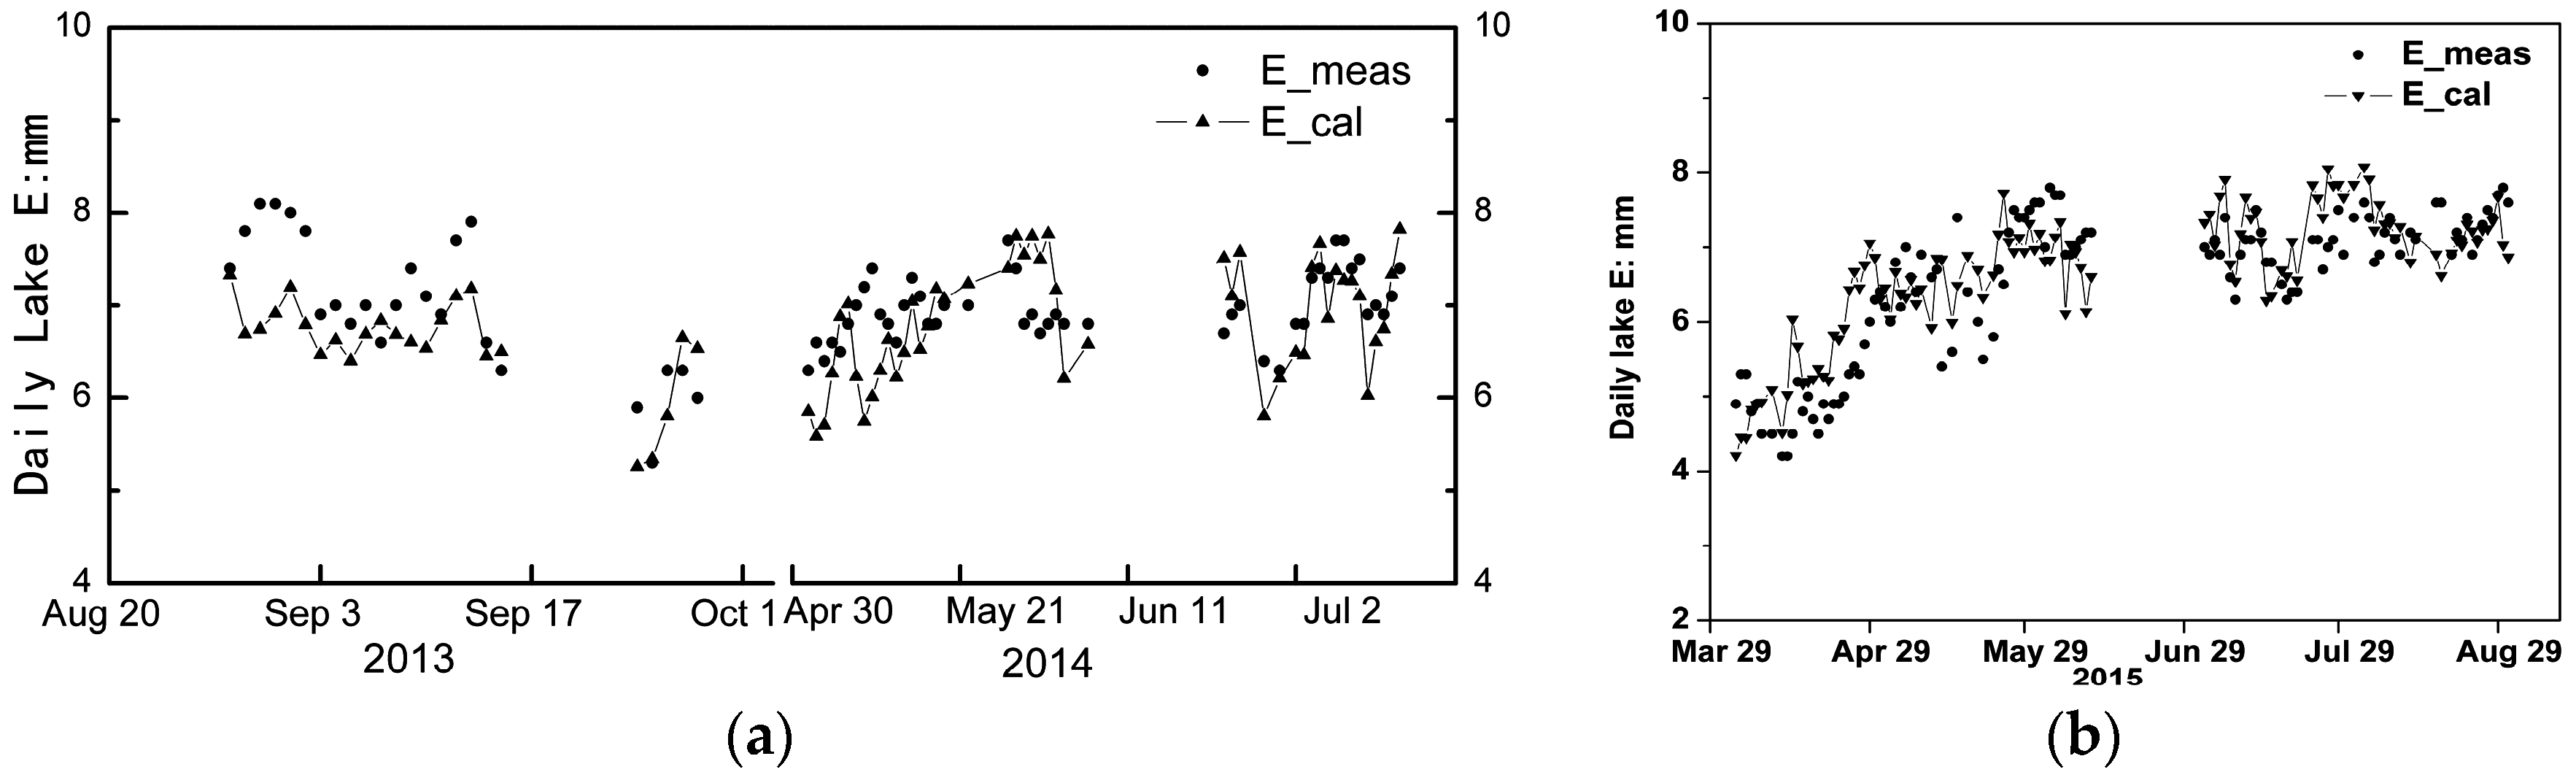
3.2. Daily Evaporation Model for EJL
3.2.1. Parameterization and Validation of the Proposed Model
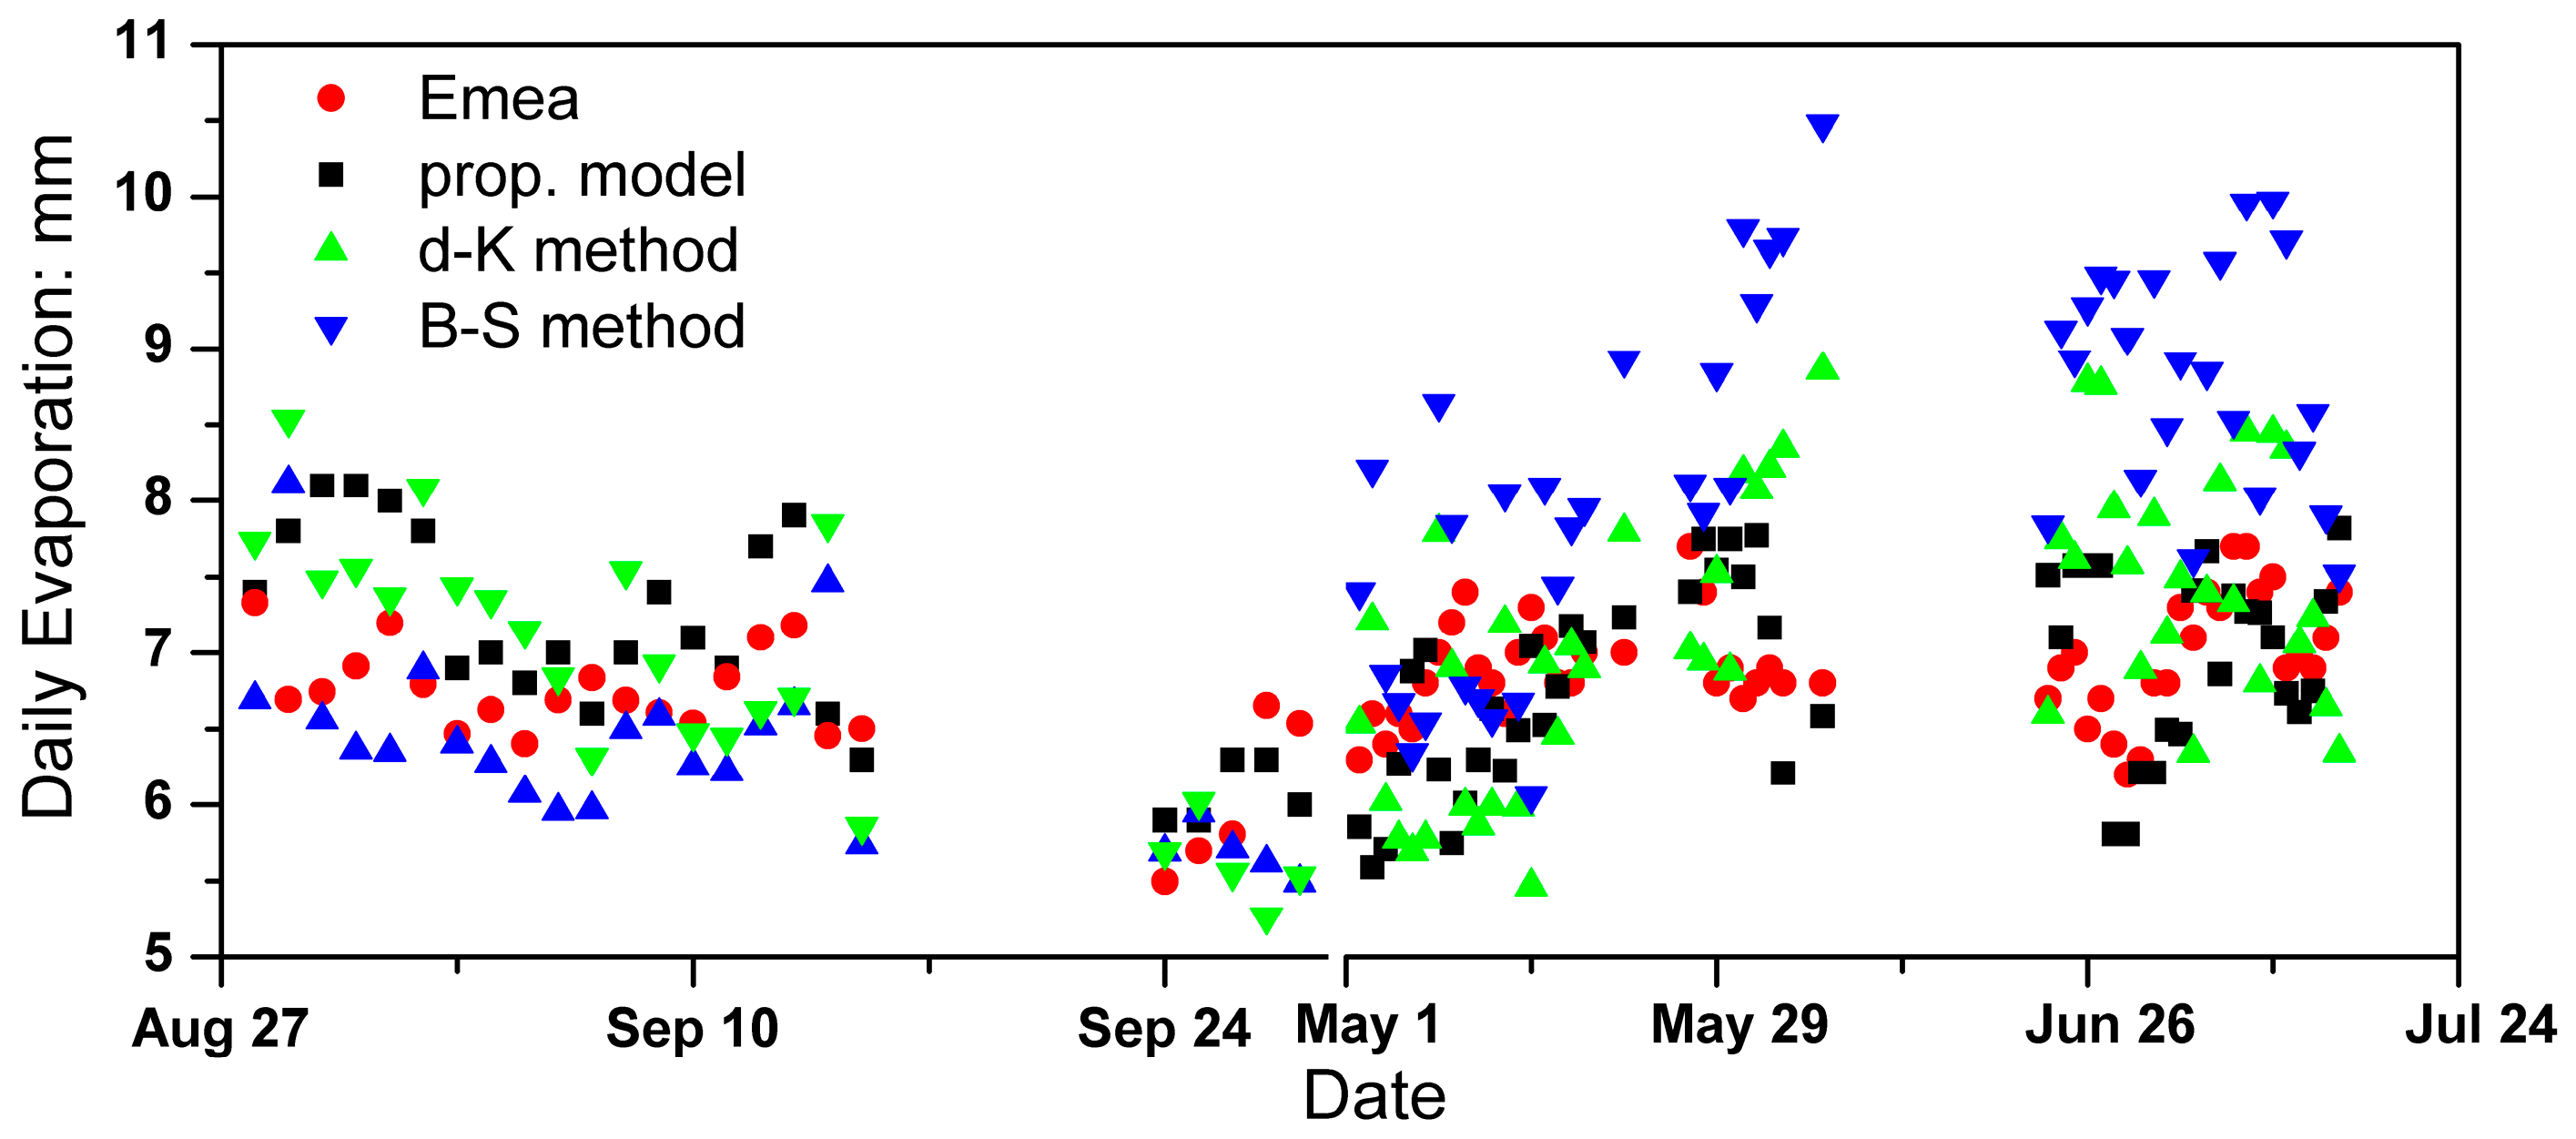
3.2.2. Inter-Comparison of Evaporation Methods
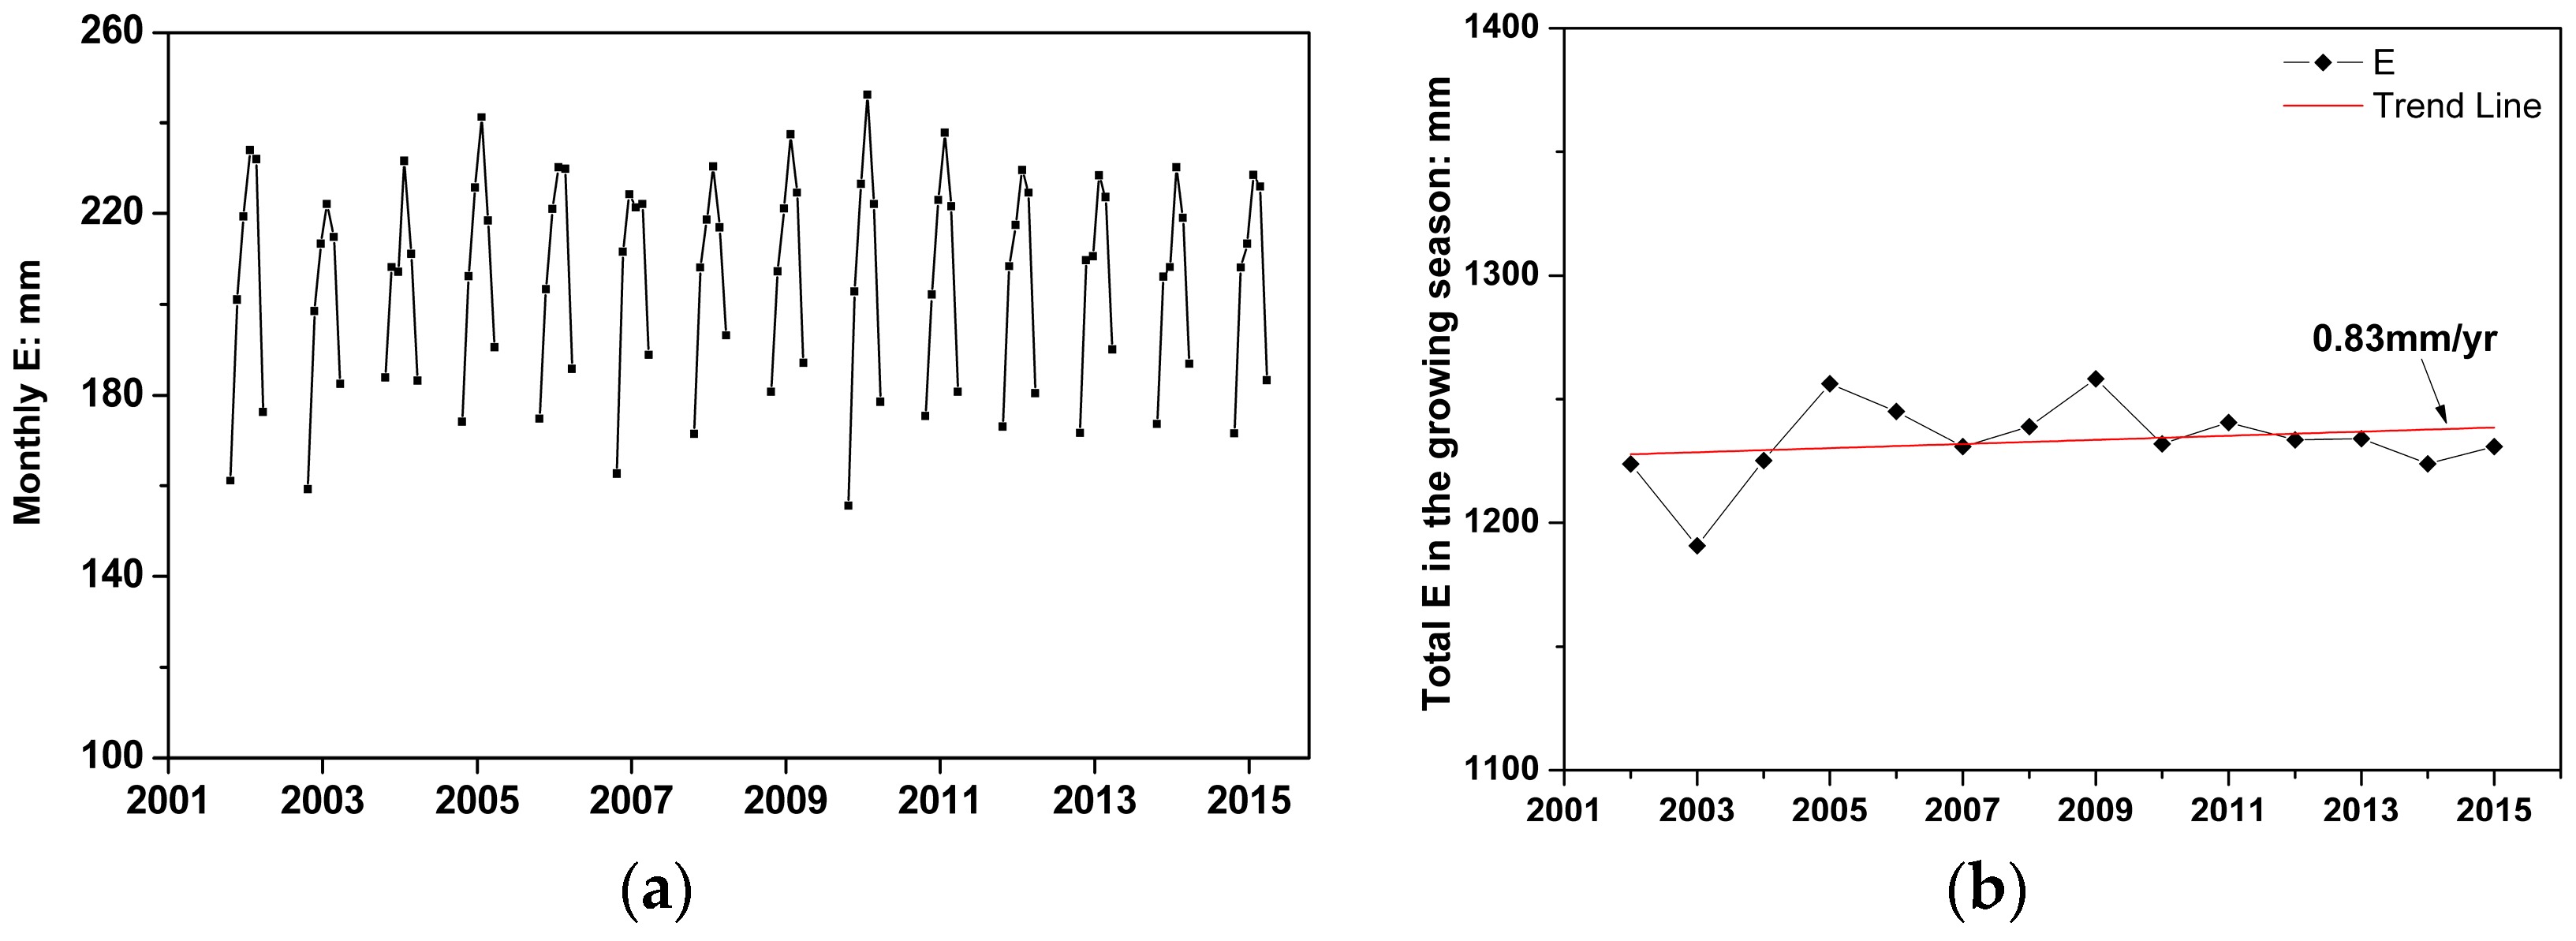
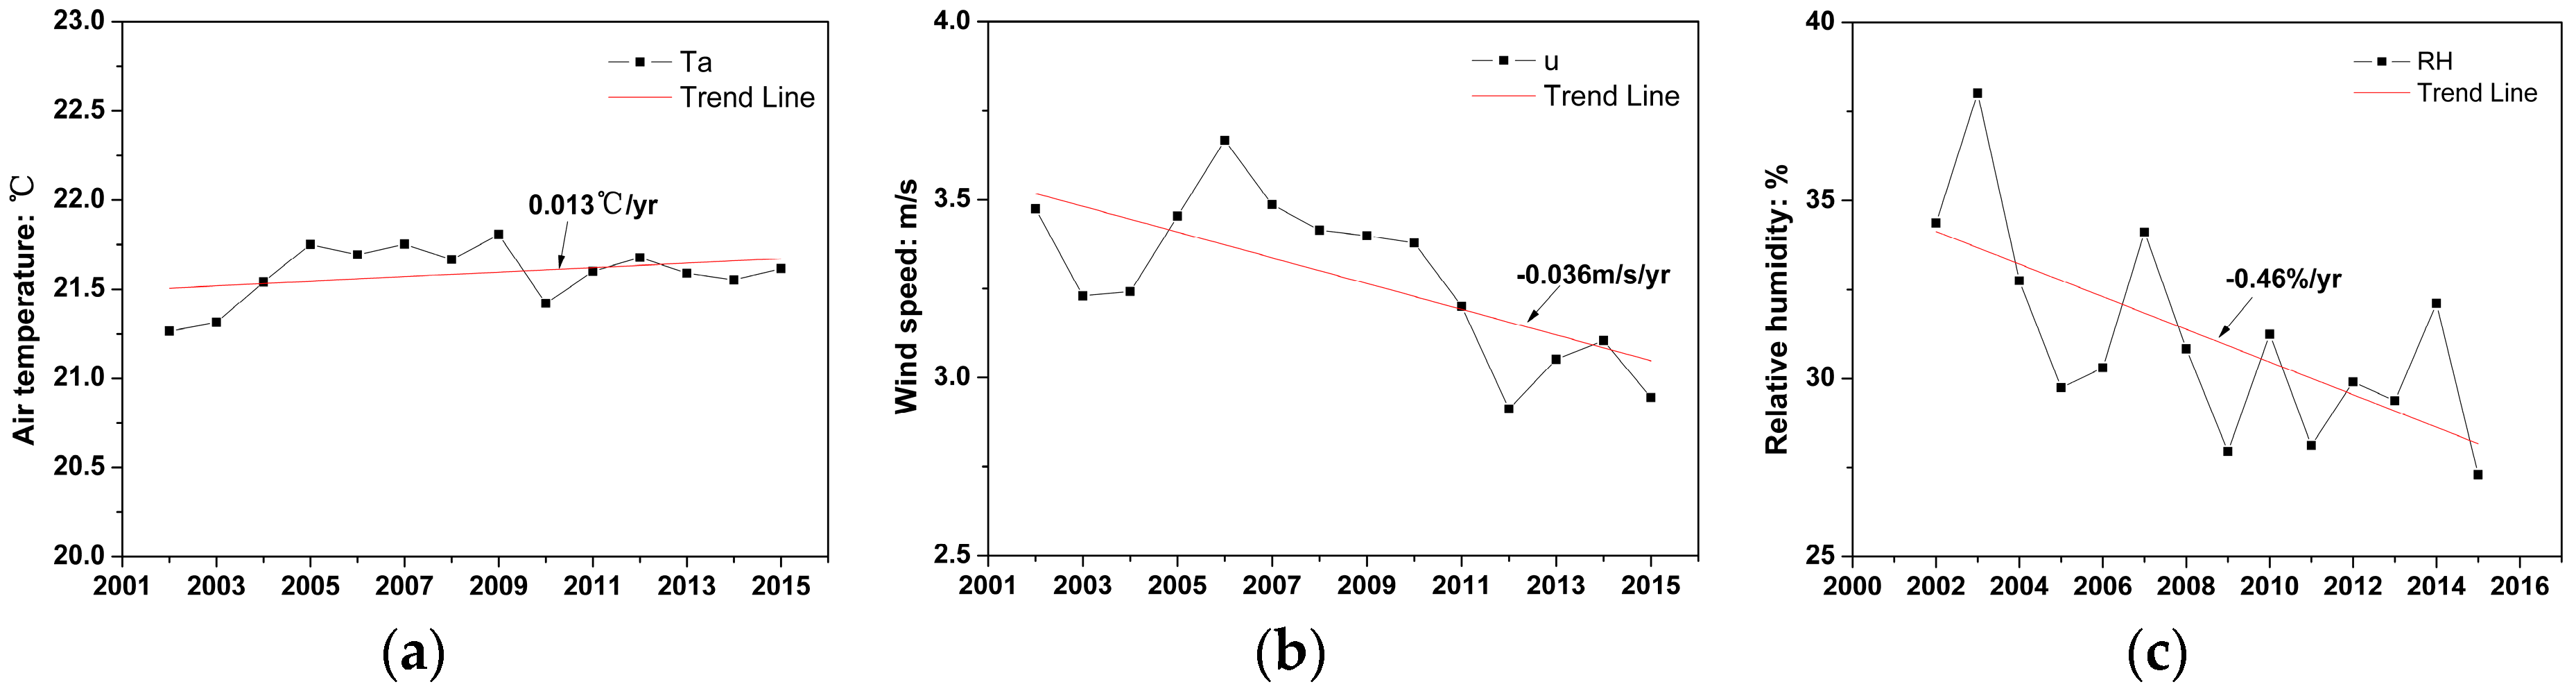
3.3. Estimation of EJL’s Evaporation during 2002–2015
4. Discussion
4.1. Floating Pan Evaporation’s Representativeness and Reliability
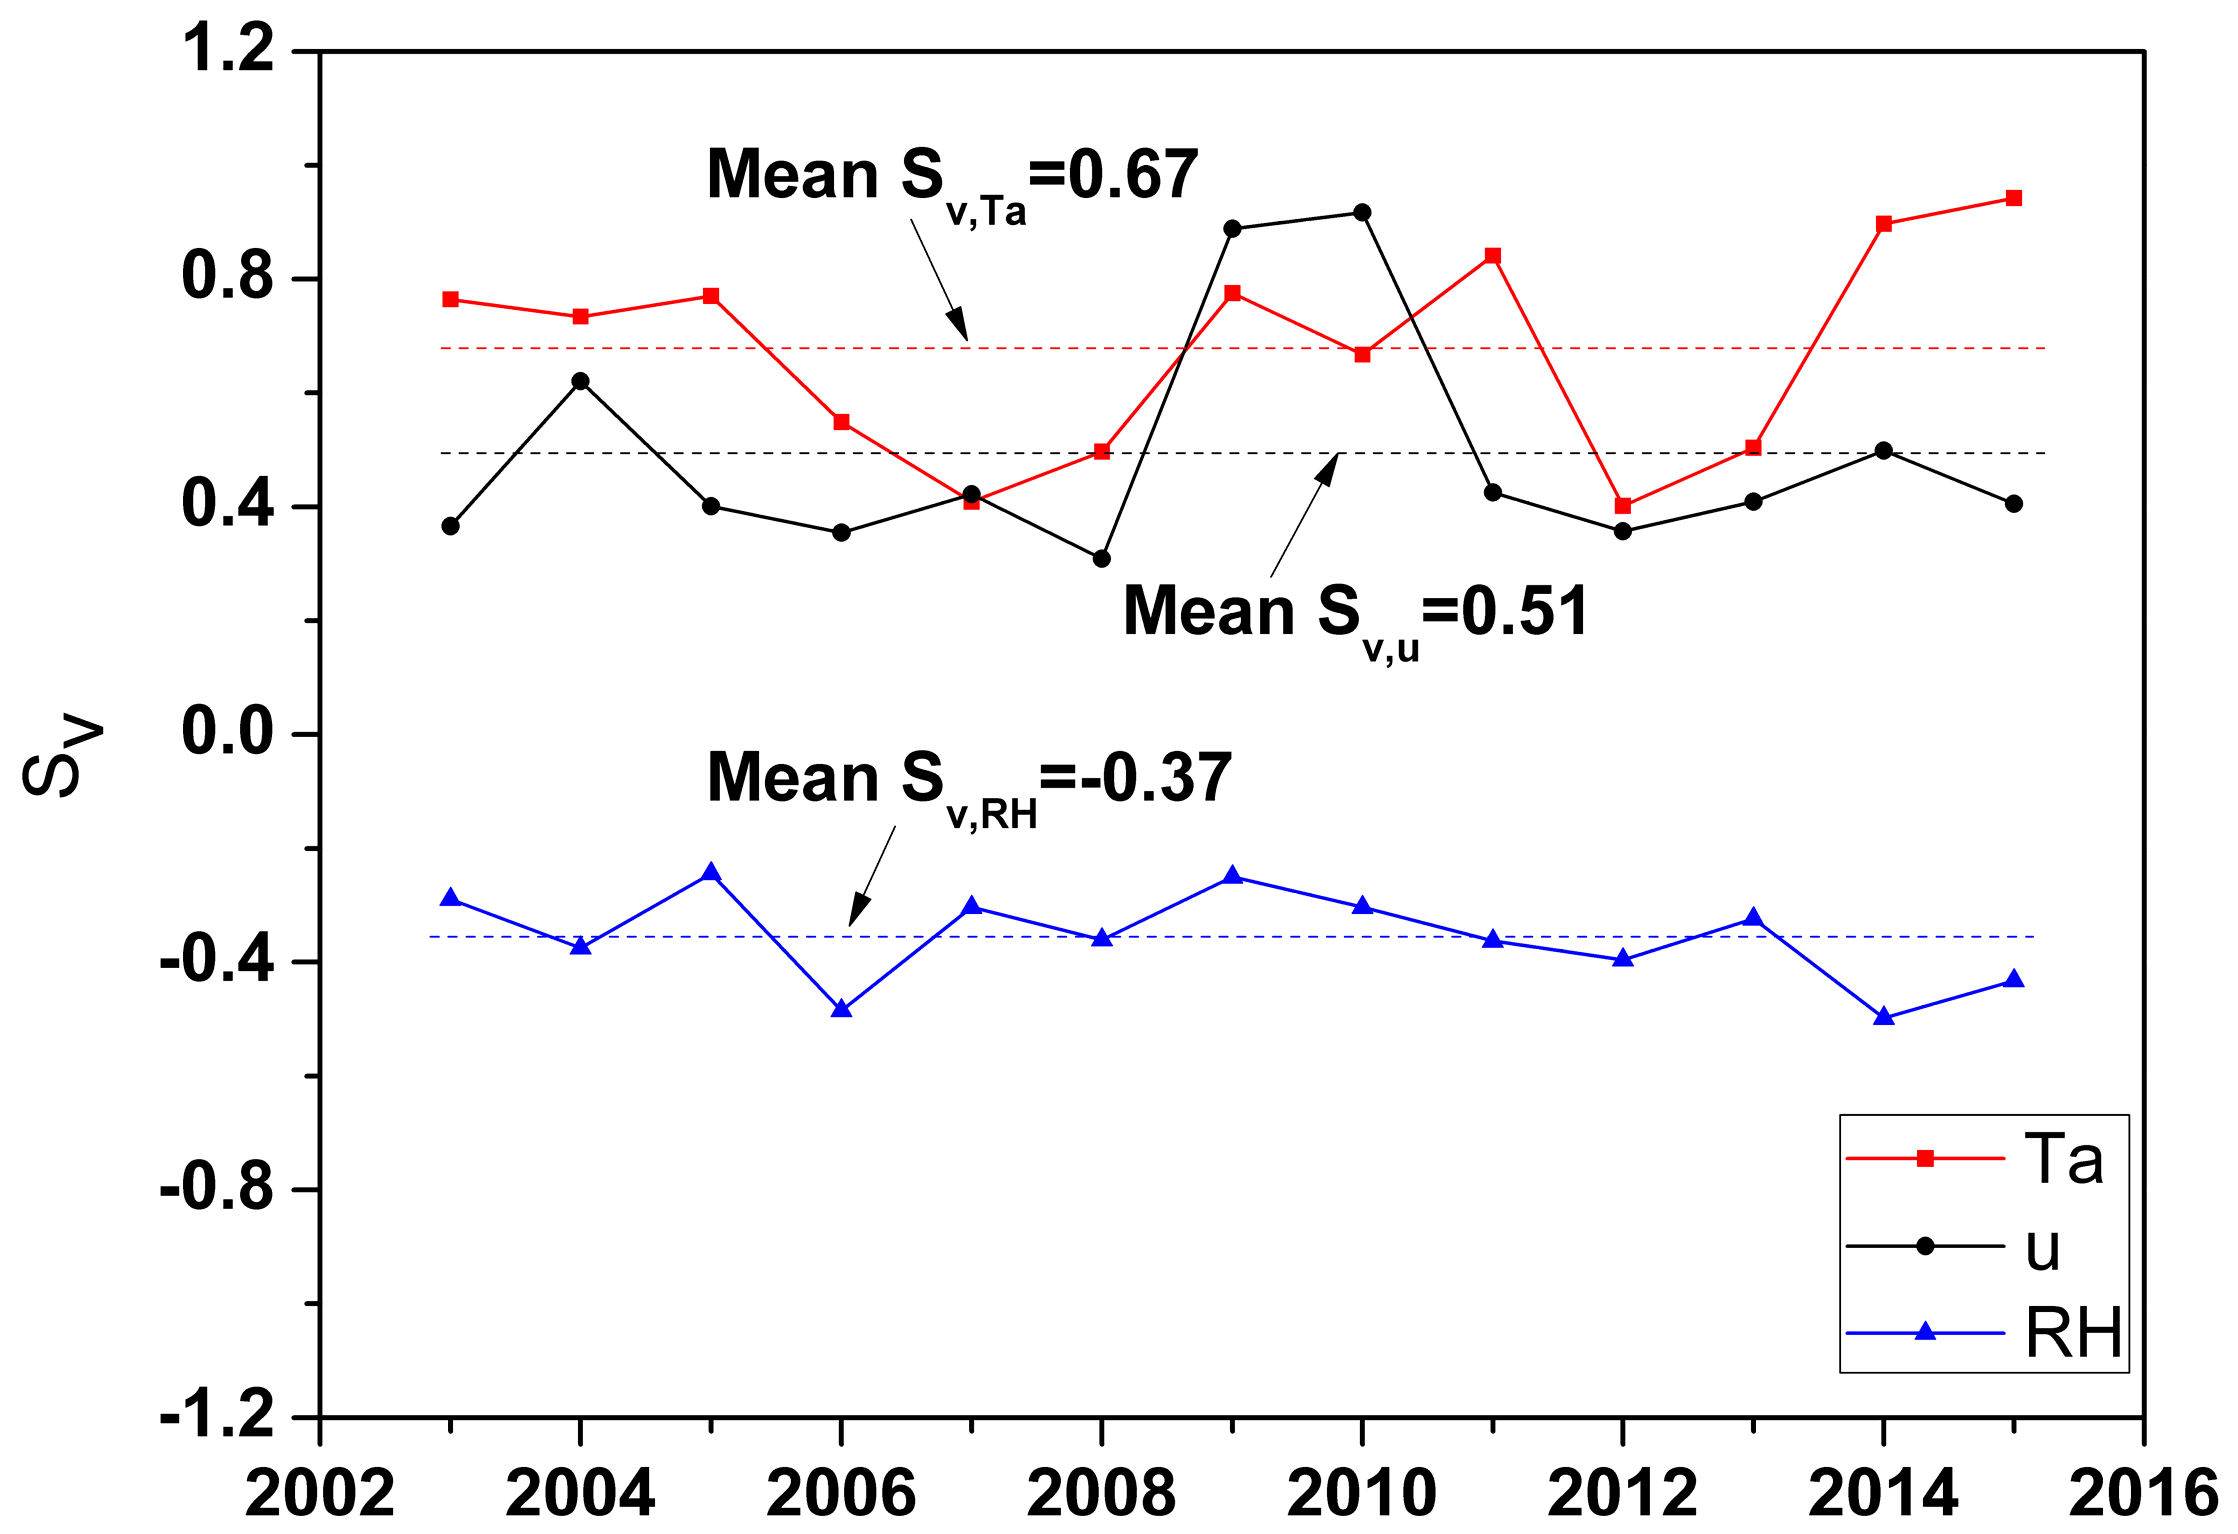
4.2. Model Sensitivity and Reliability
4.3. Complementary Relationship Theory’s Adaptability in the Hyper-Arid Region
5. Conclusions
Acknowledgments
Author Contributions
Conflicts of Interest
References
- Betts, A.K.; Ball, J.H.; Beljaars, A.C.M.; Miller, M.J.; Viterbo, P.A. The land surface-atmosphere interaction: A review based on observational and global modeling perspectives. J. Geophys. Res. Atmos. 1996, 101, 7209–7225. [Google Scholar] [CrossRef]
- Schlesinger, W.H.; Jasechko, S. Transpiration in the global water cycle. Agric. For. Meteorol. 2014, 189–190, 115–117. [Google Scholar] [CrossRef]
- Assouline, S.; Tyler, S.W.; Tanny, J.; Cohen, S.; Bou-Zeid, E.; Parlange, M.B.; Katul, G.G. Evaporation from three water bodies of different sizes and climates: Measurements and scaling analysis. Adv. Water Resour. 2008, 31, 160–172. [Google Scholar] [CrossRef]
- Sturrock, A.M.; Winter, T.C.; Rosenberry, D.O. Energy budget evaporation from Williams Lake: A closed lake in north central minnesota. Water Resour. Res. 1992, 28, 1605–1617. [Google Scholar] [CrossRef]
- Jasechko, S.; Sharp, Z.D.; Gibson, J.J.; Birks, S.J.; Yi, Y.; Fawcett, P.J. Terrestrial water fluxes dominated by transpiration. Nature 2013, 496, 347–350. [Google Scholar] [CrossRef] [PubMed]
- Winter, T.C.; Woo, M.-K. Hydrology of lakes and wetlands. In Surface Water Hydrology; Geological Society of America: Boulder, CO, USA, 1990; pp. 159–187. [Google Scholar]
- Vercauteren, N.; Bou-Zeid, E.; Huwald, H.; Parlange, M.B.; Brutsaert, W. Estimation of wet surface evaporation from sensible heat flux measurements. Water Resour. Res. 2009, 45, 735–742. [Google Scholar] [CrossRef]
- Brutsaert, W. Evaporation into the Atmosphere; Springer: Dordrecht, The Netherlands, 1982; pp. 3393–3398. [Google Scholar]
- McMahon, T.A.; Peel, M.C.; Lowe, L.; Srikanthan, R.; McVicar, T.R. Estimating actual, potential, reference crop and pan evaporation using standard meteorological data: A pragmatic synthesis. Hydrol. Earth Syst. Sci. 2013, 17, 1331–1363. [Google Scholar] [CrossRef]
- Abtew, W.; Melesse, A. Evaporation and Evapotranspiration: Measurements and Estimations; Abtew, W., Melesse, A., Eds.; Springer: Berlin, Germany, 2013. [Google Scholar]
- Yang, X.; Ma, N.; Dong, J.; Zhu, B.; Xu, B.; Ma, Z.; Liu, J. Recharge to the Inter-Dune Lakes and holocene climatic changes in the Badain Jaran Desert, western China. Quat. Res. 2010, 73, 10–19. [Google Scholar] [CrossRef]
- Si, J.; Feng, Q.; Yu, T.; Zhao, C. Inland river terminal lake preservation: Determining basin scale and the ecological water requirement. Environ. Earth Sci. 2015, 73, 3327–3334. [Google Scholar] [CrossRef]
- Liao, J.; Wang, T.; Xue, X. Lake’s evaporation in the Ejin basin since transfering water from the Heihe River. J. Desert Res. 2015, 35, 228–232, (In Chinese with English Abstract). [Google Scholar]
- Shuttleworth, W.J.; Maidment, D.R. Evaporation. In Handbook of Hydrology; Maidment, D.R., Ed.; McGraw-Hill: New York, NY, USA, 1992; Chapter 504; pp. 505–572. [Google Scholar]
- Lowe, L.D.; Webb, J.A.; Nathan, R.J.; Etchells, T.; Malano, H.M. Evaporation from water supply reservoirs: An assessment of uncertainty. J. Hydrol. 2009, 376, 261–274. [Google Scholar] [CrossRef]
- McJannet, D.L.; Cook, F.J.; Burn, S. Comparison of techniques for estimating evaporation from an irrigation water storage. Water Resour. Res. 2013, 49, 1415–1428. [Google Scholar] [CrossRef]
- Winter, T.C. Uncertainties in estimating the water balance of lakes. JAWRA J. Am. Water Resour. Assoc. 1981, 17, 82–115. [Google Scholar] [CrossRef]
- Zhao, L.; Xia, J.; Xu, C.-Y.; Wang, Z.; Sobkowiak, L.; Long, C. Evapotranspiration estimation methods in hydrological models. J. Geogr. Sci. 2013, 23, 359–369. [Google Scholar] [CrossRef]
- Zhao, X.; Liu, Y. Lake fluctuation effectively regulates wetland evapotranspiration: A case study of the largest Freshwater Lake in China. Water 2014, 6, 2482–2500. [Google Scholar] [CrossRef]
- Neuwirth, F. Experiences with Evaporation Pans at a Shallow Steppe-Lake in Austria. In Proceedings of the International Symposium on the Hydrology of Lakes, Helsinki, Finland, 23–27 July 1973; pp. 290–297.
- Speranskaya, N.A. Changes in some elements of the water cycle in the easternmost part of the Baltic Sea Drainage Basin between 1945 and 2010. Oceanologia 2011, 53, 279–292. [Google Scholar] [CrossRef]
- Lim, W.H.; Roderick, M.L.; Hobbins, M.T.; Wong, S.C.; Farquhar, G.D. The energy balance of a US Class A evaporation pan. Agric. For. Meteorol. 2013, 182, 314–331. [Google Scholar] [CrossRef]
- Gangopadhyaya, M. Measurement and Estimation of Evaporation and Evapotranspiration; Report of a Working Group on evaporation Measurement of the Commission for Instruments and Methods of Observation; W.M.O.: Geneva, Switzerland, 1966. [Google Scholar]
- Shuttleworth, W.J. Evapotranspiration measurement methods. Southwest Hydrol. 2008, 7, 22–23. [Google Scholar]
- Hrvol’, J.; Horecká, V. Actual Evapotranspiration, Potential Evapotranspirationand Evaporation from the ggi-3000 At Selected Stations of Slovakia. Available online: http://www.cbks.cz/sbornikStrecno06/prispevky/PosterI._clanky/P1-5.pdf (accessed on 8 November 2016).
- Riley, J.J. The heat balance of class a evaporation pan. Water Resour. Res. 1966, 2, 223–226. [Google Scholar] [CrossRef]
- Jacobs, A.; Heusinkveld, B.; Lucassen, D. Temperature variation in a class a evaporation pan. J. Hydrol. 1998, 206, 75–83. [Google Scholar] [CrossRef]
- Masoner, J.R.; Stannard, D.I.; Christenson, S.C. Differences in evaporation between a floating pan and class a pan on land. JAWRA J. Am. Water Resour. Assoc. 2008, 44, 552–561. [Google Scholar] [CrossRef]
- Fu, G.; Liu, C.; Chen, S.; Hong, J. Investigating the conversion coefficients for free water surface evaporation of different evaporation pans. Hydrol. Process. 2004, 18, 2247–2262. [Google Scholar] [CrossRef]
- Li, Z.; Chen, Y.; Shen, Y.; Liu, Y.; Zhang, S. Analysis of changing pan evaporation in the arid region of northwest China (EI). Water Resour. Res. 2013, 49, 2205–2212. [Google Scholar] [CrossRef]
- Abtew, W.; Obeysekera, J.; Iricanin, N. Pan evaporation and potential evapotranspiration trends in south Florida. Hydrol. Process. 2011, 25, 958–969. [Google Scholar] [CrossRef]
- Chen, D.; Gao, G.; Xu, C.-Y.; Guo, J.; Ren, G. Comparison of the thornthwaite method and pan data with the standard Penman-Monteith estimates of reference evapotranspiration in China. Clim. Res. 2005, 28, 123–132. [Google Scholar] [CrossRef]
- Shen, Y.; Liu, C.; Liu, M.; Yan, Z.; Tian, C. Change in pan evaporation over the past 50 years in the arid region of China. Hydrol. Process. 2010, 24, 225–231. [Google Scholar] [CrossRef]
- Xu, C.Y.; Gong, L.; Jiang, T.; Chen, D.; Singh, V.P. Analysis of spatial distribution and temporal trend of reference evapotranspiration and pan evaporation in Changjiang (Yangtze River) catchment. J. Hydrol. 2006, 327, 81–93. [Google Scholar] [CrossRef]
- Li, S.; Wang, Q.; Li, L. Interdecadal variations of pan-evaporation at the southern and northern slopes of the Tianshan Mountains, China. J. Arid Land 2016, 8, 832–845. [Google Scholar] [CrossRef]
- Fu, G.; Charles, S.P.; Yu, J. A critical overview of pan evaporation trends over the last 50 years. Clim. Chang. 2009, 97, 193–214. [Google Scholar] [CrossRef]
- Nordbo, A.; Launiainen, S.; Mammarella, I.; Leppäranta, M.; Huotari, J.; Ojala, A.; Vesala, T. Long-term energy flux measurements and energy balance over a small boreal lake using eddy covariance technique. J. Geophys. Res. Atmos. 2011, 116, 3–25. [Google Scholar] [CrossRef]
- Blanken, P.D.; Rouse, W.R.; Culf, A.D.; Chris, S.; Dale, B.L.; Jasper, J.N.; Bob, K.; Schertzer, W.M.; Philip, M.; Diana, V. Eddy covariance measurements of evaporation from great Slave Lake, Northwest Territories, Canada. Water Resour. Res. 2000, 36, 1069–1077. [Google Scholar] [CrossRef]
- Tanny, J.; Cohen, S.; Assouline, S.; Lange, F.; Grava, A.; Berger, D.; Teltch, B.; Parlange, M.B. Evaporation from a small water reservoir: Direct measurements and estimates. J. Hydrol. 2010, 351, 218–229. [Google Scholar] [CrossRef]
- Liu, H.; Feng, J.; Sun, J.; Wang, L.; Xu, A. Eddy covariance measurements of water vapor and CO2 fluxes above the Erhai Lake. Sci. China Earth Sci. 2015, 58, 317–328. [Google Scholar] [CrossRef]
- Ma, N.; Szilagyi, J.; Niu, G.Y.; Zhang, Y.; Zhang, T.; Wang, B.; Wu, Y. Evaporation variability of Nam Co Lake in the Tibetan Plateau and its role in recent rapid lake expansion. J. Hydrol. 2016, 537, 27–35. [Google Scholar] [CrossRef]
- Ning, M.; Zhang, Y.; Xu, C.Y.; Jozsef, S. Modeling actual evapotranspiration with routine meteorological variables in the data-scarce region of the Tibetan Plateau: Comparisons and implications. J. Geophys. Res. Biogeosci. 2015, 120, 1638–1657. [Google Scholar]
- Liu, H.; Zhang, Y.; Liu, S.; Jiang, H.; Sheng, L.; Williams, Q.L. Eddy covariance measurements of surface energy budget and evaporation in a cool season over southern open water in Mississippi. J. Geophys. Res. 1993, 114, 83–84. [Google Scholar] [CrossRef]
- Li, Z.; Lyu, S.; Ao, Y.; Wen, L.; Zhao, L.; Wang, S. Long-term energy flux and radiation balance observations over Lake Ngoring, Tibetan Plateau. Atmos. Res. 2015, 155, 13–25. [Google Scholar] [CrossRef]
- Dalton, J. Experimental essays on evaporation. Manch. Lit. Philos. Soc. 1802, 5, 536–602. [Google Scholar]
- Bowen, I.S. The ratio of heat losses by conduction and by evaporation from any water surface. Phys. Rev. 1926, 27, 779–787. [Google Scholar] [CrossRef]
- Penman, H.L. Natural evaporation from open water, hare soil and grass. Proc. R. Soc. Lond. 1948, 193, 120–145. [Google Scholar] [CrossRef]
- Priestley, C.; Taylor, R. On the assessment of surface heat flux and evaporation using large-scale parameters. Mon. Weather Rev. 1972, 100, 81–92. [Google Scholar] [CrossRef]
- Shuttleworth, W.J. Evaporation Models in the Global Water Budget; Springer: Dordrecht, The Netherlands, 1983; pp. 147–171. [Google Scholar]
- Brutsaert, W.; Parlange, M.B. Hydrologic cycle explains the evaporation paradox. Nature 1998, 396. [Google Scholar] [CrossRef]
- Szilagyi, J.; Jozsa, J. New findings about the complementary relationship-based evaporation estimation methods. J. Hydrol. 2008, 354, 171–186. [Google Scholar] [CrossRef]
- Kahler, D.M.; Brutsaert, W. Complementary relationship between daily evaporation in the environment and pan evaporation. Water Resour. Res. 2006, 42, 648–648. [Google Scholar] [CrossRef]
- Shilo, E.; Ziv, B.; Shamir, E.; Rimmer, A. Evaporation from Lake Kinneret, Israel, during hot summer days. J. Hydrol. 2015, 528, 264–275. [Google Scholar] [CrossRef]
- Singh, R.; Senay, G. Comparison of four different energy balance models for estimating evapotranspiration in the midwestern United States. Water 2016, 8, 9. [Google Scholar] [CrossRef]
- Winter, T.C.; Rosenberry, D.O.; Sturrock, A.M. Evaluation of 11 equations for determining evaporation for a small lake in the north central United States. Water Resour. Res. 1995, 31, 983–993. [Google Scholar] [CrossRef]
- Rosenberry, D.O.; Winter, T.C.; Buso, D.C.; Likens, G.E. Comparison of 15 evaporation methods applied to a small mountain lake in the northeastern USA. J. Hydrol. 2007, 340, 149–166. [Google Scholar] [CrossRef]
- Masoner, J.R.; Stannard, D.I. A comparison of methods for estimating open-water evaporation in small wetlands. Wetlands 2010, 30, 513–524. [Google Scholar] [CrossRef]
- Mcgloin, R.; Mcgowan, H.; Mcjannet, D.; Burn, S. Modelling sub-daily latent heat fluxes from a small reservoir. J. Hydrol. 2014, 519, 2301–2311. [Google Scholar] [CrossRef]
- Valiantzas, J.D. Simplified versions for the penman evaporation equation using routine weather data. J. Hydrol. 2006, 331, 690–702. [Google Scholar] [CrossRef]
- Granger, R.J.; Hedstrom, N. Modelling hourly rates of evaporation from small lakes. Hydrol. Earth Syst. Sci. 2011, 15, 267–277. [Google Scholar] [CrossRef]
- Nash, D.J.; Middleton, N.; Thomas, D. World Atlas of Desertification; United Nations Environment Programme: London, UK, 1997. [Google Scholar]
- Xie, Q. Regional Hydrogeological Survey Report of the People’s Republic of China (1:200,000): Ejina k-47-[24][R]; Water Conservancy Department of Inner Mongolia: Hohhot City, China, 1980. (In Chinese)
- Wang, P.; Zhang, Y.; Yu, J.; Fu, G.; Fei, A. Vegetation dynamics induced by groundwater fluctuations in the lower Heihe River Basin, northwestern China. J. Plant Ecol. 2011, 4, 77–90. [Google Scholar] [CrossRef]
- Wang, P.; Yu, J.; Pozdniakov, S.P.; Grinevsky, S.O.; Liu, C. Shallow groundwater dynamics and its driving forces in extremely arid areas: A case study of the lower Heihe River in northwestern China. Hydrol. Process. 2014, 28, 1539–1553. [Google Scholar] [CrossRef]
- Xi, H.; Feng, Q.; Si, J.; Chang, Z.; Cao, S. Impacts of river recharge on groundwater level and hydrochemistry in the lower reaches of Heihe River Watershed, northwestern China. Hydrogeol. J. 2009, 18, 791–801. [Google Scholar] [CrossRef]
- Liu, X.; Yichi, Z.; Du, C.; Yu, J. The current land use situation and characteristics of temporal and spatial distribution of its evapotranspiration in Ejina delta. South-to-North Water Transf. Water Sci. Technol. 2015, 4, 609–613, (In Chinese with English Abstract). [Google Scholar]
- Jiang, X.; Liu, C. The influence of water regulation on vegetation in the lower Heihe River. J. Geogr. Sci. 2010, 20, 701–711. [Google Scholar] [CrossRef]
- Zhang, Y.; Yu, J.; Wang, P.; Fu, G. Vegetation responses to integrated water management in the Ejina Basin, northwest China. Hydrol. Process. 2011, 25, 3448–3461. [Google Scholar] [CrossRef]
- Guo, Q.; Qi, F.; Li, J. Environmental changes after ecological water conveyance in the lower reaches of Heihe River, northwest China. Environ. Geol. 2009, 58, 1387–1396. [Google Scholar] [CrossRef]
- Qi, S.; Luo, F. Environmental degradation problems in the Heihe River Basin, northwest China. Water Environ. J. 2007, 21, 142–148. [Google Scholar] [CrossRef]
- World Meteorological Organization (WMO). Instruments and Methods of Observation: Measurement of Evaporation; WMO-No. 8; WMO: Geneva, Switzerland, 2010; Chapter 10. [Google Scholar]
- Singh, V.P.; Xu, C.Y. Evaluation and generalization of 13 mass-transfer equations for determining free water evaporation. Hydrol. Process. 1997, 11, 311–323. [Google Scholar] [CrossRef]
- Jensen, M.E.; Burman, R.D.; Allen, R.G. Evapotranspiration and Irrigation Water Requirements: A Manual; American Society of Civil Engineers: New York, NY, USA, 2015. [Google Scholar]
- Allen, R.G.; Pereira, L.S.; Raes, D.; Smith, M. Crop Evapotranspiration—Guidelines for Computing Crop Water Requirements—FAO Irrigation and Drainage Paper 56; FAO: Rome, Italy, 1998. [Google Scholar]
- De Bruin, H.; Keijman, J. The priestley-taylor evaporation model applied to a large, shallow lake in The Netherlands. J. Appl. Meteorol. 1979, 18, 898–903. [Google Scholar] [CrossRef]
- Brutsaert, W.; Stricker, H. An advection-aridity approach to estimate actual regional evapotranspiration. Water Resour. Res. 1979, 15, 443–450. [Google Scholar] [CrossRef]
- Hu, S.; Tian, C.; Song, Y.; Chen, B.; Wang, F. Conversion coefficient of water surface evaporation in Tarim River Basin. J. Desert Res. 2005, 25, 649–651, (Chinese with English Abstract). [Google Scholar]
- Lee, K.H.; Cho, H.Y. Simple method for estimating pan coefficients: Conversion of pan evaporation to reference evapotranspiration. J. Irrig. Drain. Eng. 2012, 138, 98–103. [Google Scholar] [CrossRef]
- Trajkovic, S.; Kolakovic, S. Comparison of simplified pan-based equations for estimating reference evapotranspiration. J. Irrig. Drain. Eng. 2010, 136, 137–140. [Google Scholar] [CrossRef]
- Elsawwaf, M.; Willems, P.; Pagano, A.; Berlamont, J. Evaporation estimates from Nasser Lake, Egypt, based on three floating station data and bowen ratio energy budget. Theor. Appl. Climatol. 2009, 100, 439–465. [Google Scholar] [CrossRef]
- Sumner, D.M.; Jacobs, J.M. Utility of Penman–Monteith, Priestley–Taylor, reference evapotranspiration, and pan evaporation methods to estimate pasture evapotranspiration. J. Hydrol. 2005, 308, 81–104. [Google Scholar] [CrossRef]
- Li, Z.; Li, Z.; Xu, Z.; Zhou, X. Temporal variations of reference evapotranspiration in Heihe River Basin of China. Hydrol. Res. 2013, 44, 904–916. [Google Scholar] [CrossRef]
- Du, C.; Yu, J.; Wang, P.; Zhang, Y. Reference evapotranspiration changes: Sensitivities to and contributions of meteorological factors in the Heihe River Basin of Northwestern China (1961–2014). Adv. Meteorol. 2016, 2016, 4143580. [Google Scholar] [CrossRef]
- Elsawwaf, M.; Willems, P.; Feyen, J. Assessment of the sensitivity and prediction uncertainty of evaporation models applied to Nasser Lake, Egypt. J. Hydrol. 2010, 395, 11–22. [Google Scholar] [CrossRef]
- Wang, W.; Xiao, W.; Cao, C.; Gao, Z.; Hu, Z.; Liu, S.; Shen, S.; Wang, L.; Xiao, Q.; Xu, J. Temporal and spatial variations in radiation and energy balance across a large freshwater lake in China. J. Hydrol. 2014, 511, 811–824. [Google Scholar] [CrossRef]
- Gong, L.; Xu, C.Y.; Chen, D.; Halldin, S.; Chen, Y.D. Sensitivity of the Penman–Monteith reference evapotranspiration to key climatic variables in the Changjiang (Yangtze River) basin. J. Hydrol. 2006, 329, 620–629. [Google Scholar] [CrossRef]
- Beven, K. A sensitivity analysis of the penman-monteith actual evapotranspiration estimates. J. Hydrol. 1979, 44, 169–190. [Google Scholar] [CrossRef]
- Roderick, M.L.; Farquhar, G.D. The cause of decreased pan evaporation over the past 50 years. Science 2002, 298, 1410–1411. [Google Scholar] [PubMed]
- Ohmura, A.; Wild, M. Is the hydrological cycle accelerating? Science 2002, 298, 1345–1346. [Google Scholar] [CrossRef] [PubMed]
- Mcvicar, T.R.; Roderick, M.L.; Donohue, R.J.; Li, L.T.; Niel, T.G.V.; Thomas, A.; Grieser, J.; Jhajharia, D.; Himri, Y.; Mahowald, N.M. Global review and synthesis of trends in observed terrestrial near-surface wind speeds: Implications for evaporation. J. Hydrol. 2012, 416–417, 182–205. [Google Scholar] [CrossRef]
- Hobbins, M.T.; Ramírez, J.A.; Brown, T.C. Trends in pan evaporation and actual evapotranspiration across the conterminous U.S.: Paradoxical or complementary? Geophys. Res. Lett. 2004, 31, 405–407. [Google Scholar] [CrossRef]
- Burn, D.H.; Hesch, N.M. Trends in evaporation for the Canadian Prairies. J. Hydrol. 2007, 336, 61–73. [Google Scholar] [CrossRef]
- Blanco-Macías, F.; Valdez-Cepeda, R.D.; Magallanes-Quintanar, R. Pan evaporation analysis in central Mxico: Trends, self-affinity and important frequencies. Int. J. Phys. Sci. 2011, 6, 540–549. [Google Scholar]
- Salarijazi, M. Assessment of pan evaporation changes in south western Iran. Afr. J. Agric. Res. 2013, 8, 1449–1456. [Google Scholar]
- Tebakari, T.; Yoshitani, J.; Suvanpimol, C. Time-space trend analysis in pan evaporation over kingdom of Thailand. J. Hydrol. Eng. 2005, 10, 205–215. [Google Scholar] [CrossRef]
- Jhajharia, D.; Kumar, R.; Singh, V.P.; Choudhary, R.R. Searching evidence for the existence of evaporation paradox in arid environments of northwest India. Glob. Nest J. 2014, 16, 1–9. [Google Scholar]
- Liu, X.; Luo, Y.; Zhang, D.; Zhang, M.; Liu, C. Recent changes in pan-evaporation dynamics in China. Geophys. Res. Lett. 2011, 38, 142–154. [Google Scholar] [CrossRef]
- Wang, Z.; Yu, J.; Denghua, A. Effects of climatic variables on pan evaporation in Ejina delta in the recent 50 years. South-to-North. Water Transf. Water Sci. Technol. 2013, 3, 1–5, (In Chinese with English Abstract). [Google Scholar]
- Liu, M.; Shen, Y.; Zeng, Y.; Liu, C. Trend in pan evaporation and its attribution over the past 50 years in China. J. Geogr. Sci. 2010, 20, 557–568. [Google Scholar] [CrossRef]
- Semiz, G.D.; Akşit, C.; Akşit, C. Water quality, surface area, evaporation and precipitation of Lake Burdur. J. Food Agric. Environ. 2013, 11, 751–753. [Google Scholar]
- Verburg, P.; Hecky, R.E. Wind patterns, evaporation, and related physical variables in Lake Tanganyika, East Africa. J. Gt. Lakes Res. 2003, 29, 48–61. [Google Scholar] [CrossRef]


| Study | Physical and Climate Settings/Site | Method/Highlights | Key Results |
|---|---|---|---|
| Sturrock et al. (1992) | Williams Lake in Minnesota, USA; 0.36 km2; mean depth of 5.2 m; within the continental climate of North America. | Energy budget method; land and raft weather stations are used; each energy budget component is measured or calculated. | 1. Seasonal evaporation rate varied from 2.19 mm/day to 2.82 mm/day. 2. Energy budget values of evaporation varied from +13% to −11% of mass transfer values. 3. Large differences exist in the magnitudes of energy budget components, with solar radiation being the greatest and advection the smallest. |
| Winter et al. (1995) | Williams Lake in Minnesota, USA. | 11 lake evaporation methods are evaluated; Data are obtained on a raft, bankside and a station 60 km away. | 1. Modified DeBruin-Keijman, Priestley-Taylor and Penman equation estimated monthly evaporation that agreed most closely with energy budget values. 2. Input data measured near the lake is essential to apply these methods, and if only distant data are available, Jensen-Haise and Makkink methods are preferable. |
| Valiantzas (2006) | A weather station called Patrai in Greece. | Penman equation; Approximation of the equation’s components enables easy estimation of evaporation with basic data. | 1. Penman equation is simplified for routine hydrologic applications and a more simplified version without wind speed is given and tested. 2. The new open water evaporation formulas were adapted for calculating reference crop ET. |
| Rosenberry et al. (2007) | Mirror Lake in New Hampshire, USA; 0.15 km2; annual precipitation and evaporation is 1220 and 490 mm. | 15 evaporation methods are applied; BREB method is chosen as the standard; In situ measured data are used. | 1. Priestley-Taylor, deBruin-Keijman and Penman method values compared most favorably with BREB’s (within 20% difference). 2. Methods may be unduly sensitive to wind speed, when wind speed is neither substantially larger nor smaller. 3. Temperature-only methods compared remarkably well with BREB values. 4. Results of this research also serve well in other lakes with a similar physical and climatic setting. |
| Masoner et al. (2008) | In a wetland at the U.S. Geological Survey Norman Landfill Research Site in Oklahoma, USA; an area of 8800 m2. | In situ measurement; Monthly evaporation data from Class A pan and floating pan are used. | 1. Floating pan can better simulate actual physical conditions on the water surface than evaporation pan on land. 2. Floating pan to land pan ratios varied in different months, ranging from 0.69 to 0.87. |
| Vercauteren et al. (2009) | Lake Geneva (LG) in Switzerland; 582 km2; wind speed was smaller than 10 m/s and waves rarely exceeded 20 cm. | Bowen ratio; sensible heat (H) and basic synoptic data are used; Eddy covariance method is used. | 1. A new method to estimate wet surface evaporation using easily obtained data was proposed based on Bowen ratio equation, avoiding the term of G in the energy budget that is hard to measure on wet surfaces. 2. Validation by eddy covariance values indicated excellent accuracy when applied to LG. |
| Granger and Hedstrom (2011) | Three lakes with fetch distances ranging from 150 m to 11,000 m in Canada. | Direct measurement of eddy covariance method; wind speed, air temperature and humidity data are measured on the lake. | 1. Wind speed is the most significant factor governing lake evaporation, followed by land-water contrast of temperature and vapor pressure, while net radiation bears no relationship with lake evaporation in short time periods. 2. Relationships were developed between the hourly rates of lake evaporation and the following significant variables and parameters, and a versatile model for estimating hourly lake evaporation rate is proposed with good accuracy. |
| McGloin et al. (2014) | A reservoir in southeast Queensland, Australia; 0.17 km2; seasonal subtropical climate. | Floating weather station; hourly latent flux measured by eddy covariance; Mass transfer method; the hydrodynamics model-DYRESM. | 1. Various modelling methods were used to estimate hourly latent heat fluxes and the theoretical mass transfer model performed the best, the Granger and Hedstrom the worst. 2. Estimates by the DYRESM model tended to be greater than measured values. 3. Improvements can be made to the traditional mass transfer and DYRESM models for many applications, including modelling the effects small lakes have on regional weather. |
| Shilo et al. (2015) | Lake Kinneret in northern Israel; 168.7 km2; annual evaporation of 1400 mm. | Aerodynamic method and energy balance method; Synoptic factors are measured at the station located near the center of the lake. | 1. The primary factors determining lake evaporation are solar radiation, near surface air and water temperatures, relative humidity, wind speed and near surface atmospheric stability. 2. Lake evaporation during exceptionally hot summer days was lower than normal when wind speed was much lower. 3. The weakening of the permanent synoptic Etesian winds and the descent of the marine inversion to a height of the topographic ridge are responsible for the reduction of the Mediterranean Sea Breeze and evaporation. |
| Ma et al. (2016) | Nam Co Lake in the Tibetan Plateau; closed, semi-brackish lake; 2013 km2; a semi-arid sub-frigid monsoon climate. | The China Meteorological Forcing Dataset was used; E601 pan evaporation data was used to compare with CRLE model estimations without wind speed data. | 1. The complementary relationship lake evaporation (CRLE) model behaved well in Nam Co Lake without wind speed input, but implicitly considered the wind effect via vapor transfer coefficient. 2. From 1979 to 2012, the mean annual evaporation of Nam Co Lake is 635 mm, and the annual evaporation of Nam Co Lake expressed a very slight decreasing trend. 3. Evaporation decreasing was responsible for 4% of recent rapid Nam Co Lake expansion. |
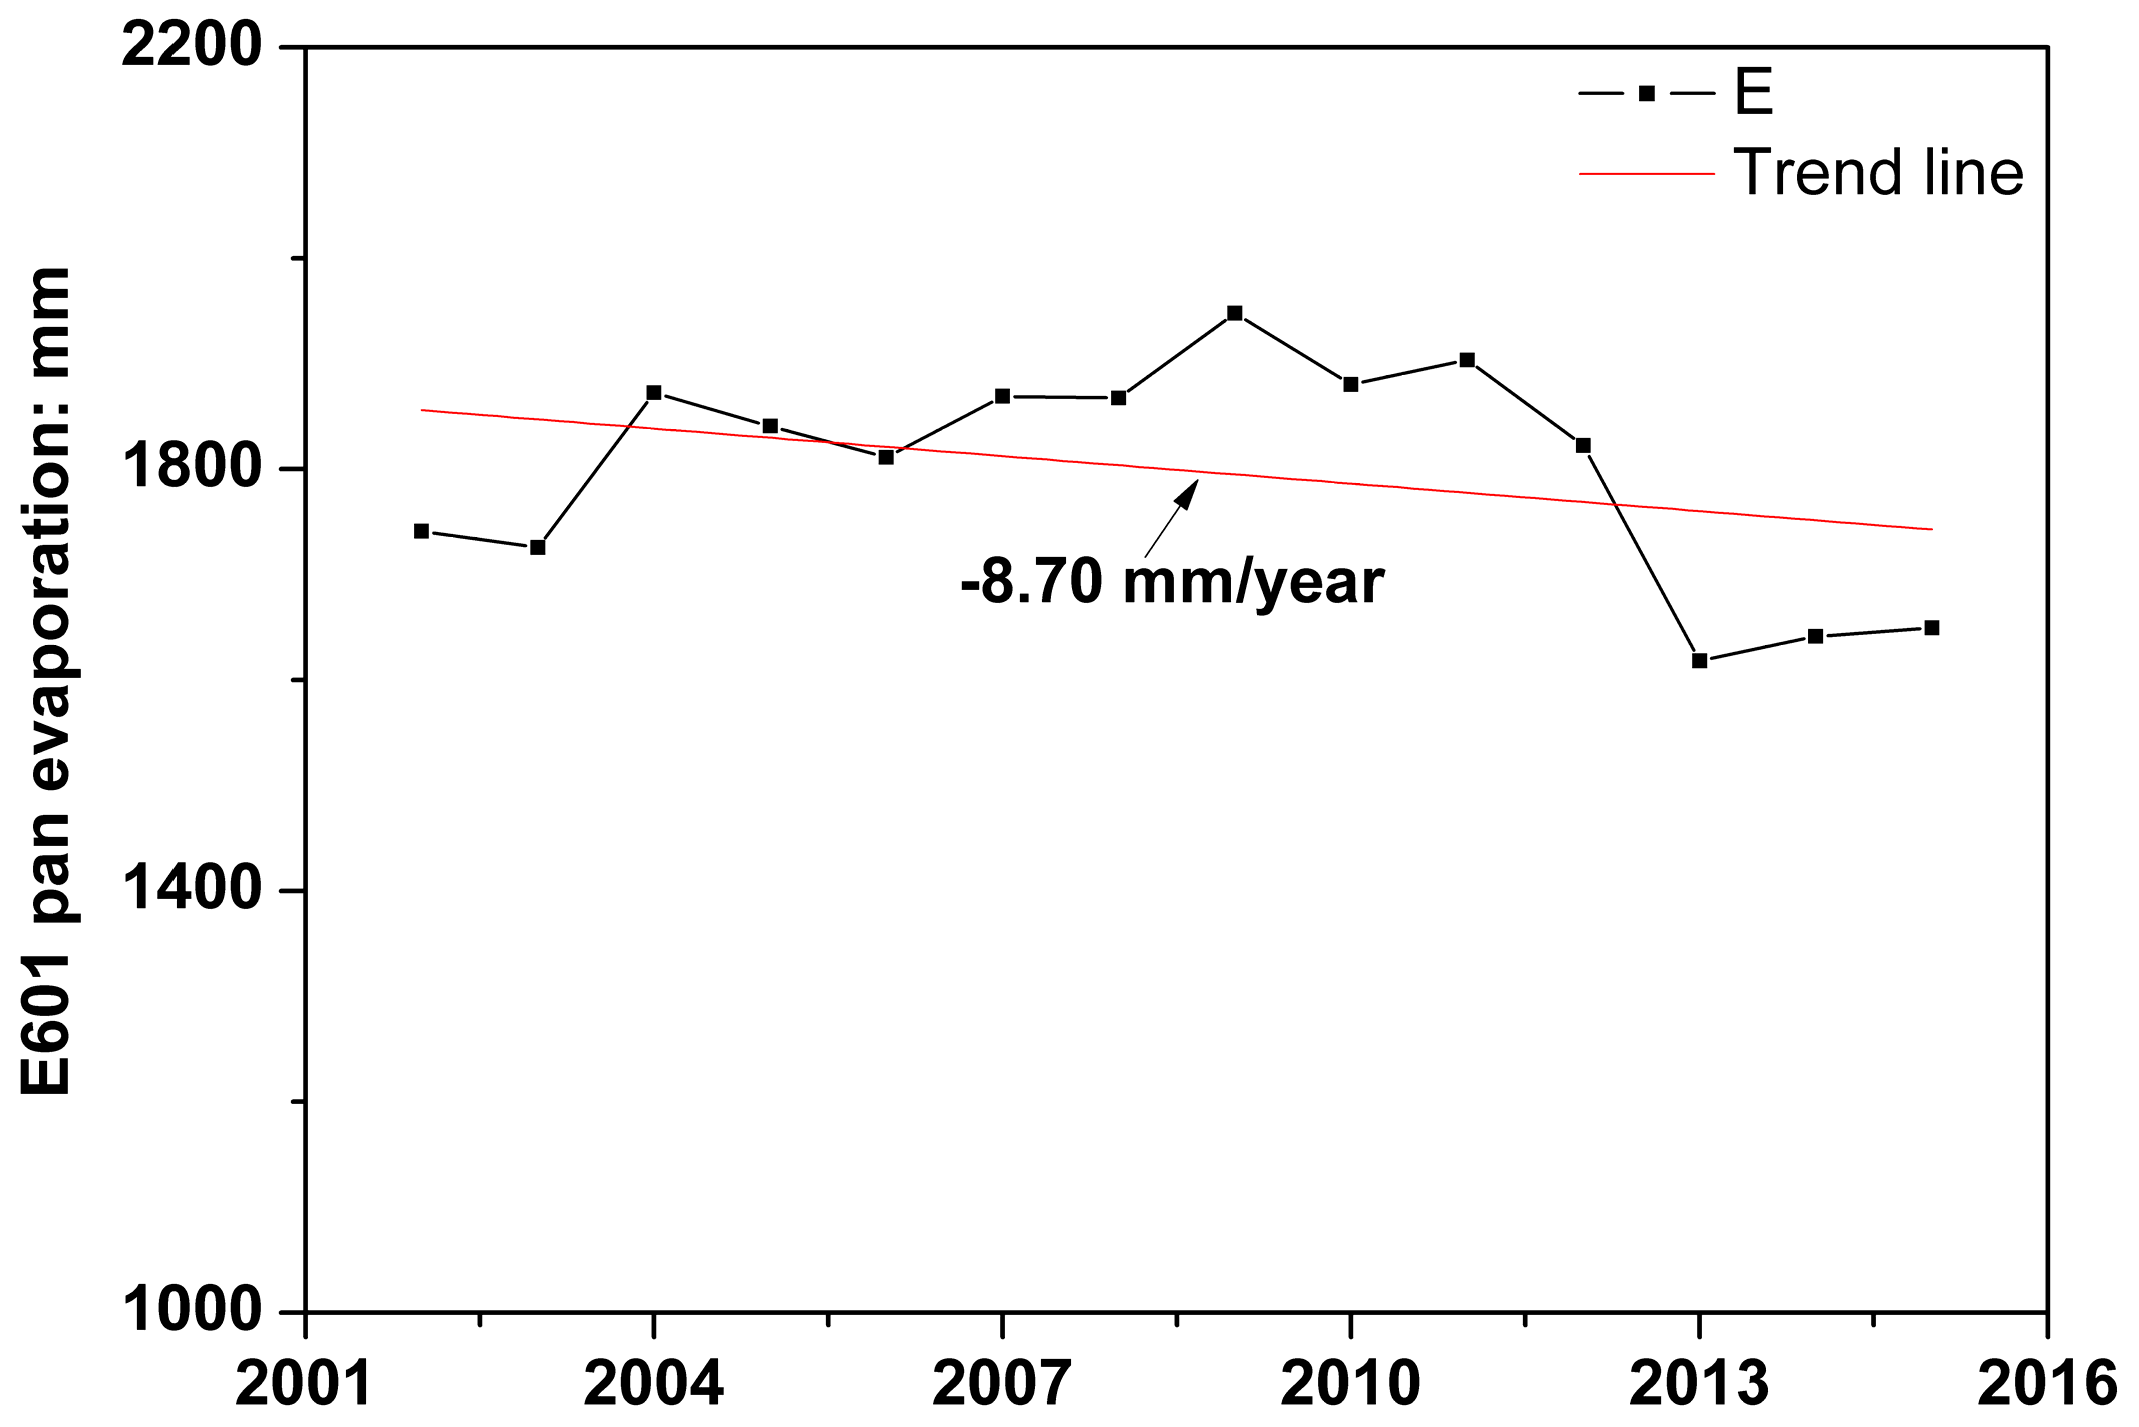
| Liu et al. (2016) | East Juyan Lake, northwestern China; 40 km2; in the hyper-arid region with ET0 > 1400 mm and annual P of 36.6 mm. | Floating E601 pan; bankside weather station; a semi-empirical daily lake evaporation model is proposed. | 1. Total lake evaporation during the growing season was 1183.3 mm according to the floating evaporation pan on EJL, with the max, min and mean daily E of 8.1, 3.7 and 6.5 mm, respectively. 2. A new daily lake evaporation model, derived from Dalton model, was proposed with simple inputs (Ta, u and RH) but moderate modeling accuracy. 3. The lower Heihe River’s ET0 represented by annual open water evaporation was 1471.3 mm. 4. Trend analysis of estimated evaporation proved evaporation paradox’s existence in this hyper-arid region and validated the complementary relationship theory’s adaptability. |
| Method | Reference | Equation | Developed for |
|---|---|---|---|
| deBruin-Keijman | [75] | Daily evaporation | |
| Brutsaert-Stricker | [76] |
| Year | April | May | June | July | August | September |
|---|---|---|---|---|---|---|
| 2013 | \ | \ | \ | \ | \ | 189.0 |
| 2014 | \ | 208.7 | 201 | 216.7 | 219.6 | 180.2 |
| 2015 | 149.9 | 204.9 | 209.4 | 217.6 | 224.2 | 177.7 |
| Index | R2 | MAE (mm) | RMSE (mm) | MRE | Estimation Quality | |||
|---|---|---|---|---|---|---|---|---|
| Within ±5% | Within ±10% | Within ±20% | Within ±30% | |||||
| Cal.-Daily E | 0.84 | 0.52 | 0.63 | 8.6% | 40% | 73% | 92% | 99% |
| Val.-Daily E | 0.80 | 0.56 | 0.69 | 9.5% | 44% | 72% | 88% | 96% |
| Val.-Monthly E | 0.94 | 6.10 | 8.10 | 3.0% | 78% | 100% | / | / |
| Method | R2 | MAE (mm) | RMSE (mm) | MRE |
|---|---|---|---|---|
| Proposed model | 0.84 | 0.52 | 0.63 | 8.6% |
| deBruin-Keijman | 0.62 | 0.81 | 0.96 | 10.9% |
| Brutsaert-Stricker | 0.55 | 1.20 | 1.51 | 17.7% |
| Synoptic Factors | Correlativity | R2 |
|---|---|---|
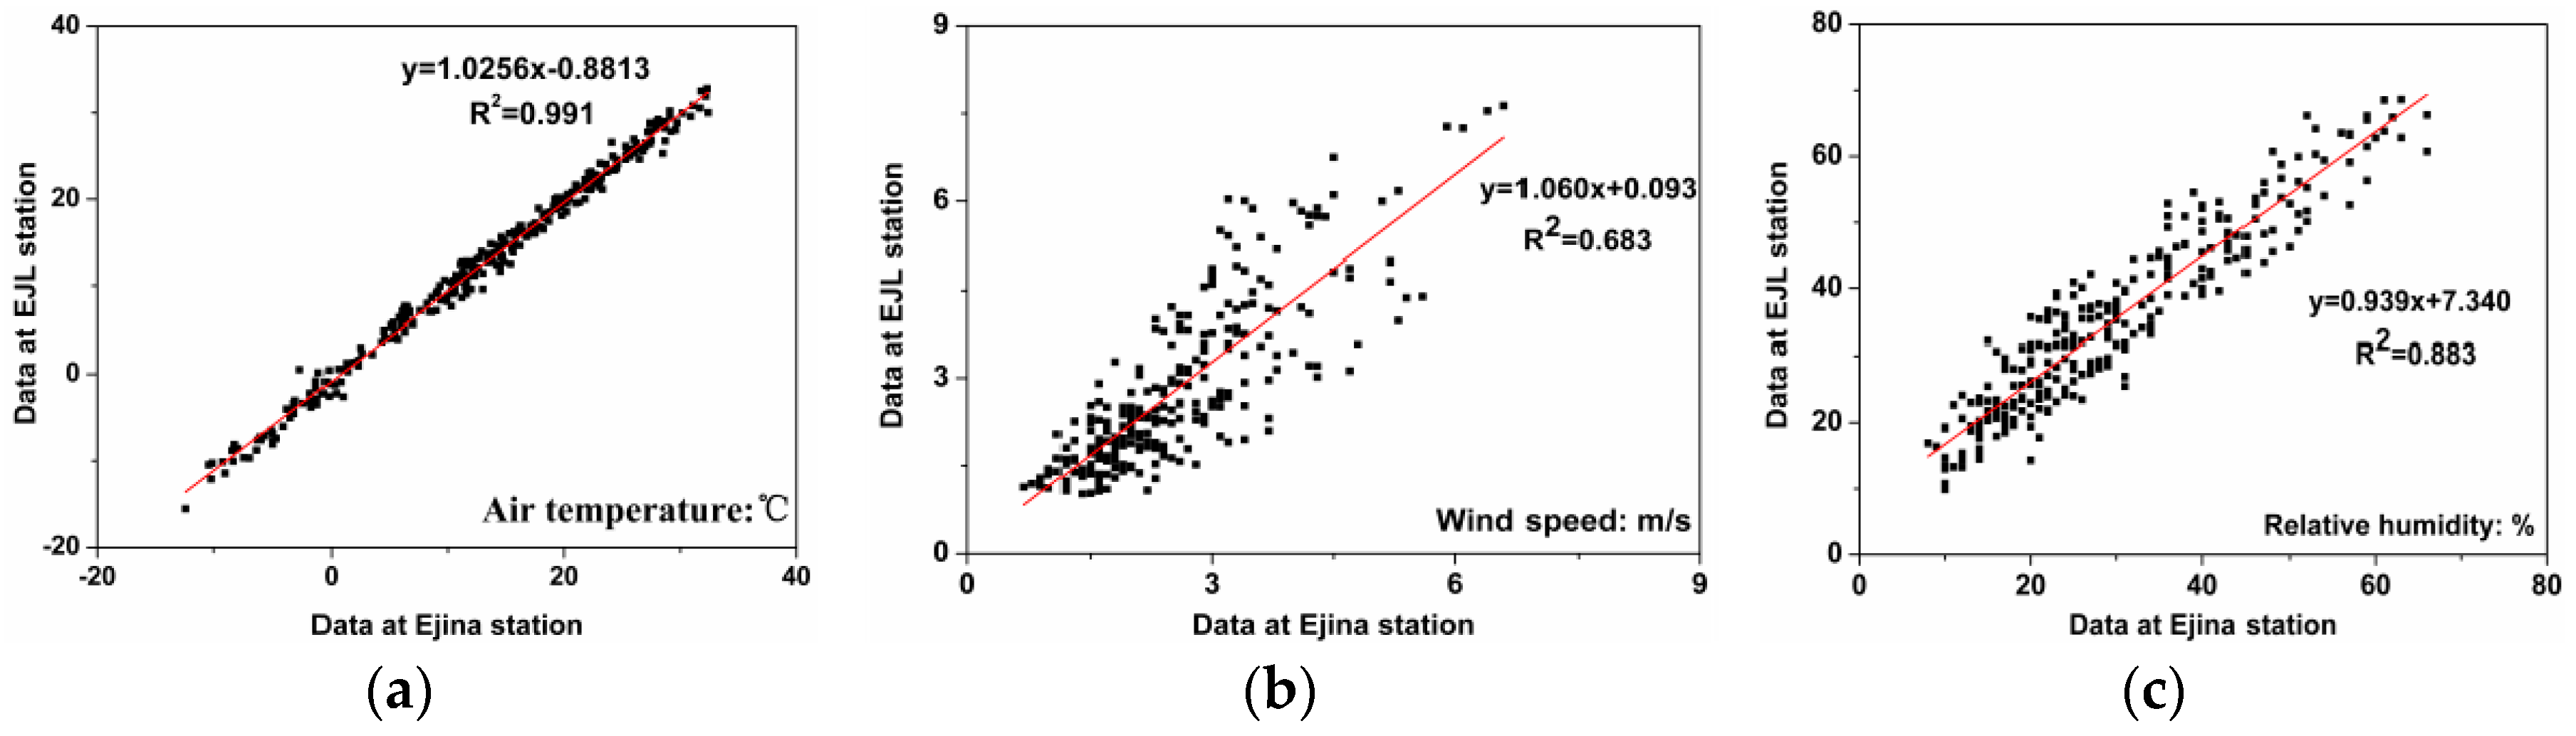
| Air temperature | Y = 1.0256X − 0.8813 | 0.991 |
| Wind speed | Y = 1.060X + 0.093 | 0.683 |
| Relative humidity | Y = 0.939X + 7.340 | 0.883 |
© 2016 by the authors; licensee MDPI, Basel, Switzerland. This article is an open access article distributed under the terms and conditions of the Creative Commons Attribution (CC-BY) license (http://creativecommons.org/licenses/by/4.0/).
Share and Cite
Liu, X.; Yu, J.; Wang, P.; Zhang, Y.; Du, C. Lake Evaporation in a Hyper-Arid Environment, Northwest of China—Measurement and Estimation. Water 2016, 8, 527. https://doi.org/10.3390/w8110527
Liu X, Yu J, Wang P, Zhang Y, Du C. Lake Evaporation in a Hyper-Arid Environment, Northwest of China—Measurement and Estimation. Water. 2016; 8(11):527. https://doi.org/10.3390/w8110527
Chicago/Turabian StyleLiu, Xiao, Jingjie Yu, Ping Wang, Yichi Zhang, and Chaoyang Du. 2016. "Lake Evaporation in a Hyper-Arid Environment, Northwest of China—Measurement and Estimation" Water 8, no. 11: 527. https://doi.org/10.3390/w8110527
APA StyleLiu, X., Yu, J., Wang, P., Zhang, Y., & Du, C. (2016). Lake Evaporation in a Hyper-Arid Environment, Northwest of China—Measurement and Estimation. Water, 8(11), 527. https://doi.org/10.3390/w8110527