1. Introduction
The relentless migration of people from rural to urban areas and increase in development activities are making considerable pressure on water management systems, and especially on the management of emergencies and disasters. In view of the threats of climate change, natural disasters such as floods are likely to strengthen this trend in the coming years [
1,
2,
3].
Correspondingly, flooding in urban areas has become a growing priority for city managers and disaster risk prevention agencies, and those communities that are situated in the coastal zone are further threatened by storm surges and rising sea levels [
4]. Flood prediction, prevention, and mitigation are essential. Structural measures play important roles, which should primarily focus on the protection of human health and safety, valuable goods and property. In this regard, many researchers and practitioners are placing their efforts on multi-objective optimization techniques for evaluation and comparison of different measures [
5,
6,
7,
8]. In many situations, effective mitigation of flood hazards requires a change of paradigm from structural defensive actions against floods to understanding and modeling different causes of flood risk [
9,
10,
11] and correspondingly developing a range of structural and non-structural measures that can minimize that risk.
In addition to the more traditional structural measures, flood warning systems have been widely developed and applied [
12,
13,
14,
15,
16,
17]. However, the establishment of an operational flood warning system is often demanding and expensive task (e.g., establishment of a real-time monitoring network), and effective real-time simulation of floods poses a great challenge [
18,
19,
20,
21,
22]. Therefore, it is of the utmost importance to provide timely and sufficiently accurate real-time flood information to decision makers and the public. A flood warning system produces information every few hours to one day by coupling models and observations with rainfall forecasts [
23]. This approach is sufficient for urgent responses at the flooding stage. Another strategy is to produce Flood Inundation Maps (FIMs). The main purpose of FIMs is depict the potential depth and extent of flooded zones in relation to scenarios of the possible initiation of floods coupled with their consequences in the light of different control and mitigation actions. Such maps have been widely researched and used [
24,
25,
26,
27,
28]. Although FIMs may have a certain degree of uncertainty due to data collection and modeling technologies applied [
29], such maps offer valuable means to enhance our understanding of local flood risks. FIMs can provide such information that is required by municipal authorities to more effectively inform citizens and adopt appropriate flood management strategies in advance. The warning time provided by a FIM is usually three days or longer, which is sufficient enough to evacuate citizens within areas suffering high flooding potentials or take preventive actions. In some instances, such maps are used for flood insurance purposes [
30,
31].
In developing flood maps it is necessary to generate scenarios of the possible initiation of floods and evaluate their consequences in the light of different flood mitigation strategies. With numerical models, it is possible to explore the generation and propagation of floods around urban features such as road or pavement curbs which can play a significant role in diverting the shallow flows through urban areas. Numerous hydraulic models have been developed and applied for this purpose [
18,
32,
33,
34,
35]. However, head losses owing to flow over or round such features are difficult to accommodate and a significant body of literature suggests that great care and caution should be applied in data processing and modeling techniques [
36,
37,
38,
39,
40,
41,
42,
43].
Data collection plays an important role for constructing a FIM. The lack of adequate flood observations during flooding events represents a great challenge in producing reliable flood models [
44]. Development of a FIM needs geographical and hydrological data as well as historical records, operating rules of sluices and reservoirs and reports of regulation projects, as shown in
Table 1.
Countries such as USA, Japan, UK, Germany, Bangladesh and the Netherlands have developed their own flood inundation map libraries which are used for different purposes [
20,
24,
32,
45,
46,
47,
48]. The first generation of FIMs was developed in Taiwan in 1999. The coarse DEM (200 × 200 m) was used and the sewer system was not included in the simulation. In 2007, the second generation FIMs were produced. The model simulations included sewer system and storm surge influences. The DEM resolution of 40 × 40 m was used. The present work describes the development of the third generation of FIMs in Taiwan. The DEM resolution of 5 × 5 m is used and numerous hydraulic structures (e.g., sewer and drainage systems, detention basin, and pumping stations) are included in the numerical models. The influence from storm surge and wave overtopping is particularly addressed in the numerical modeling work. Correspondingly, due to the complexity of the system and the local conditions a large number of scenarios was modeled. The present paper describes the development of this third generation of FIMs, and discusses the causes of flooding in the coastal city of Tainan.
2. The Study Area
Taiwan is located in a subtropical zone in one of the main typhoon tracks. The average annual precipitation in Taiwan is 2500 mm, reaching 3000 to 5000 mm in mountainous regions. Most of the precipitation is concentrated in the typhoon and monsoon season during the summer. Taiwan has experienced more than 350 typhoons and one thousand rainfall events in the past 100 years. The maximum hourly precipitation reached 300 mm, and the maximum one-day precipitation reached 1748 mm, which is 93.4% of the world record [
49]. The Water Resources Agency (WRA) of Taiwan reported that approximately 3000 buildings are damaged by floods annually, with an associated loss of approximately 400 million USD, which is approximately 4.6 times more than the loss caused by fire damage in Taiwan. In addition to extreme precipitation during typhoons, the river characteristics and topography of Taiwan are important factors that lead to flooding. The rivers in Taiwan are short and have steep slopes that exceed 1/100 in upstream reaches and 1/200–1/500 in downstream reaches. Concentrated rainfall in short and steep river basins generates rapid flow increases and flow peaks.
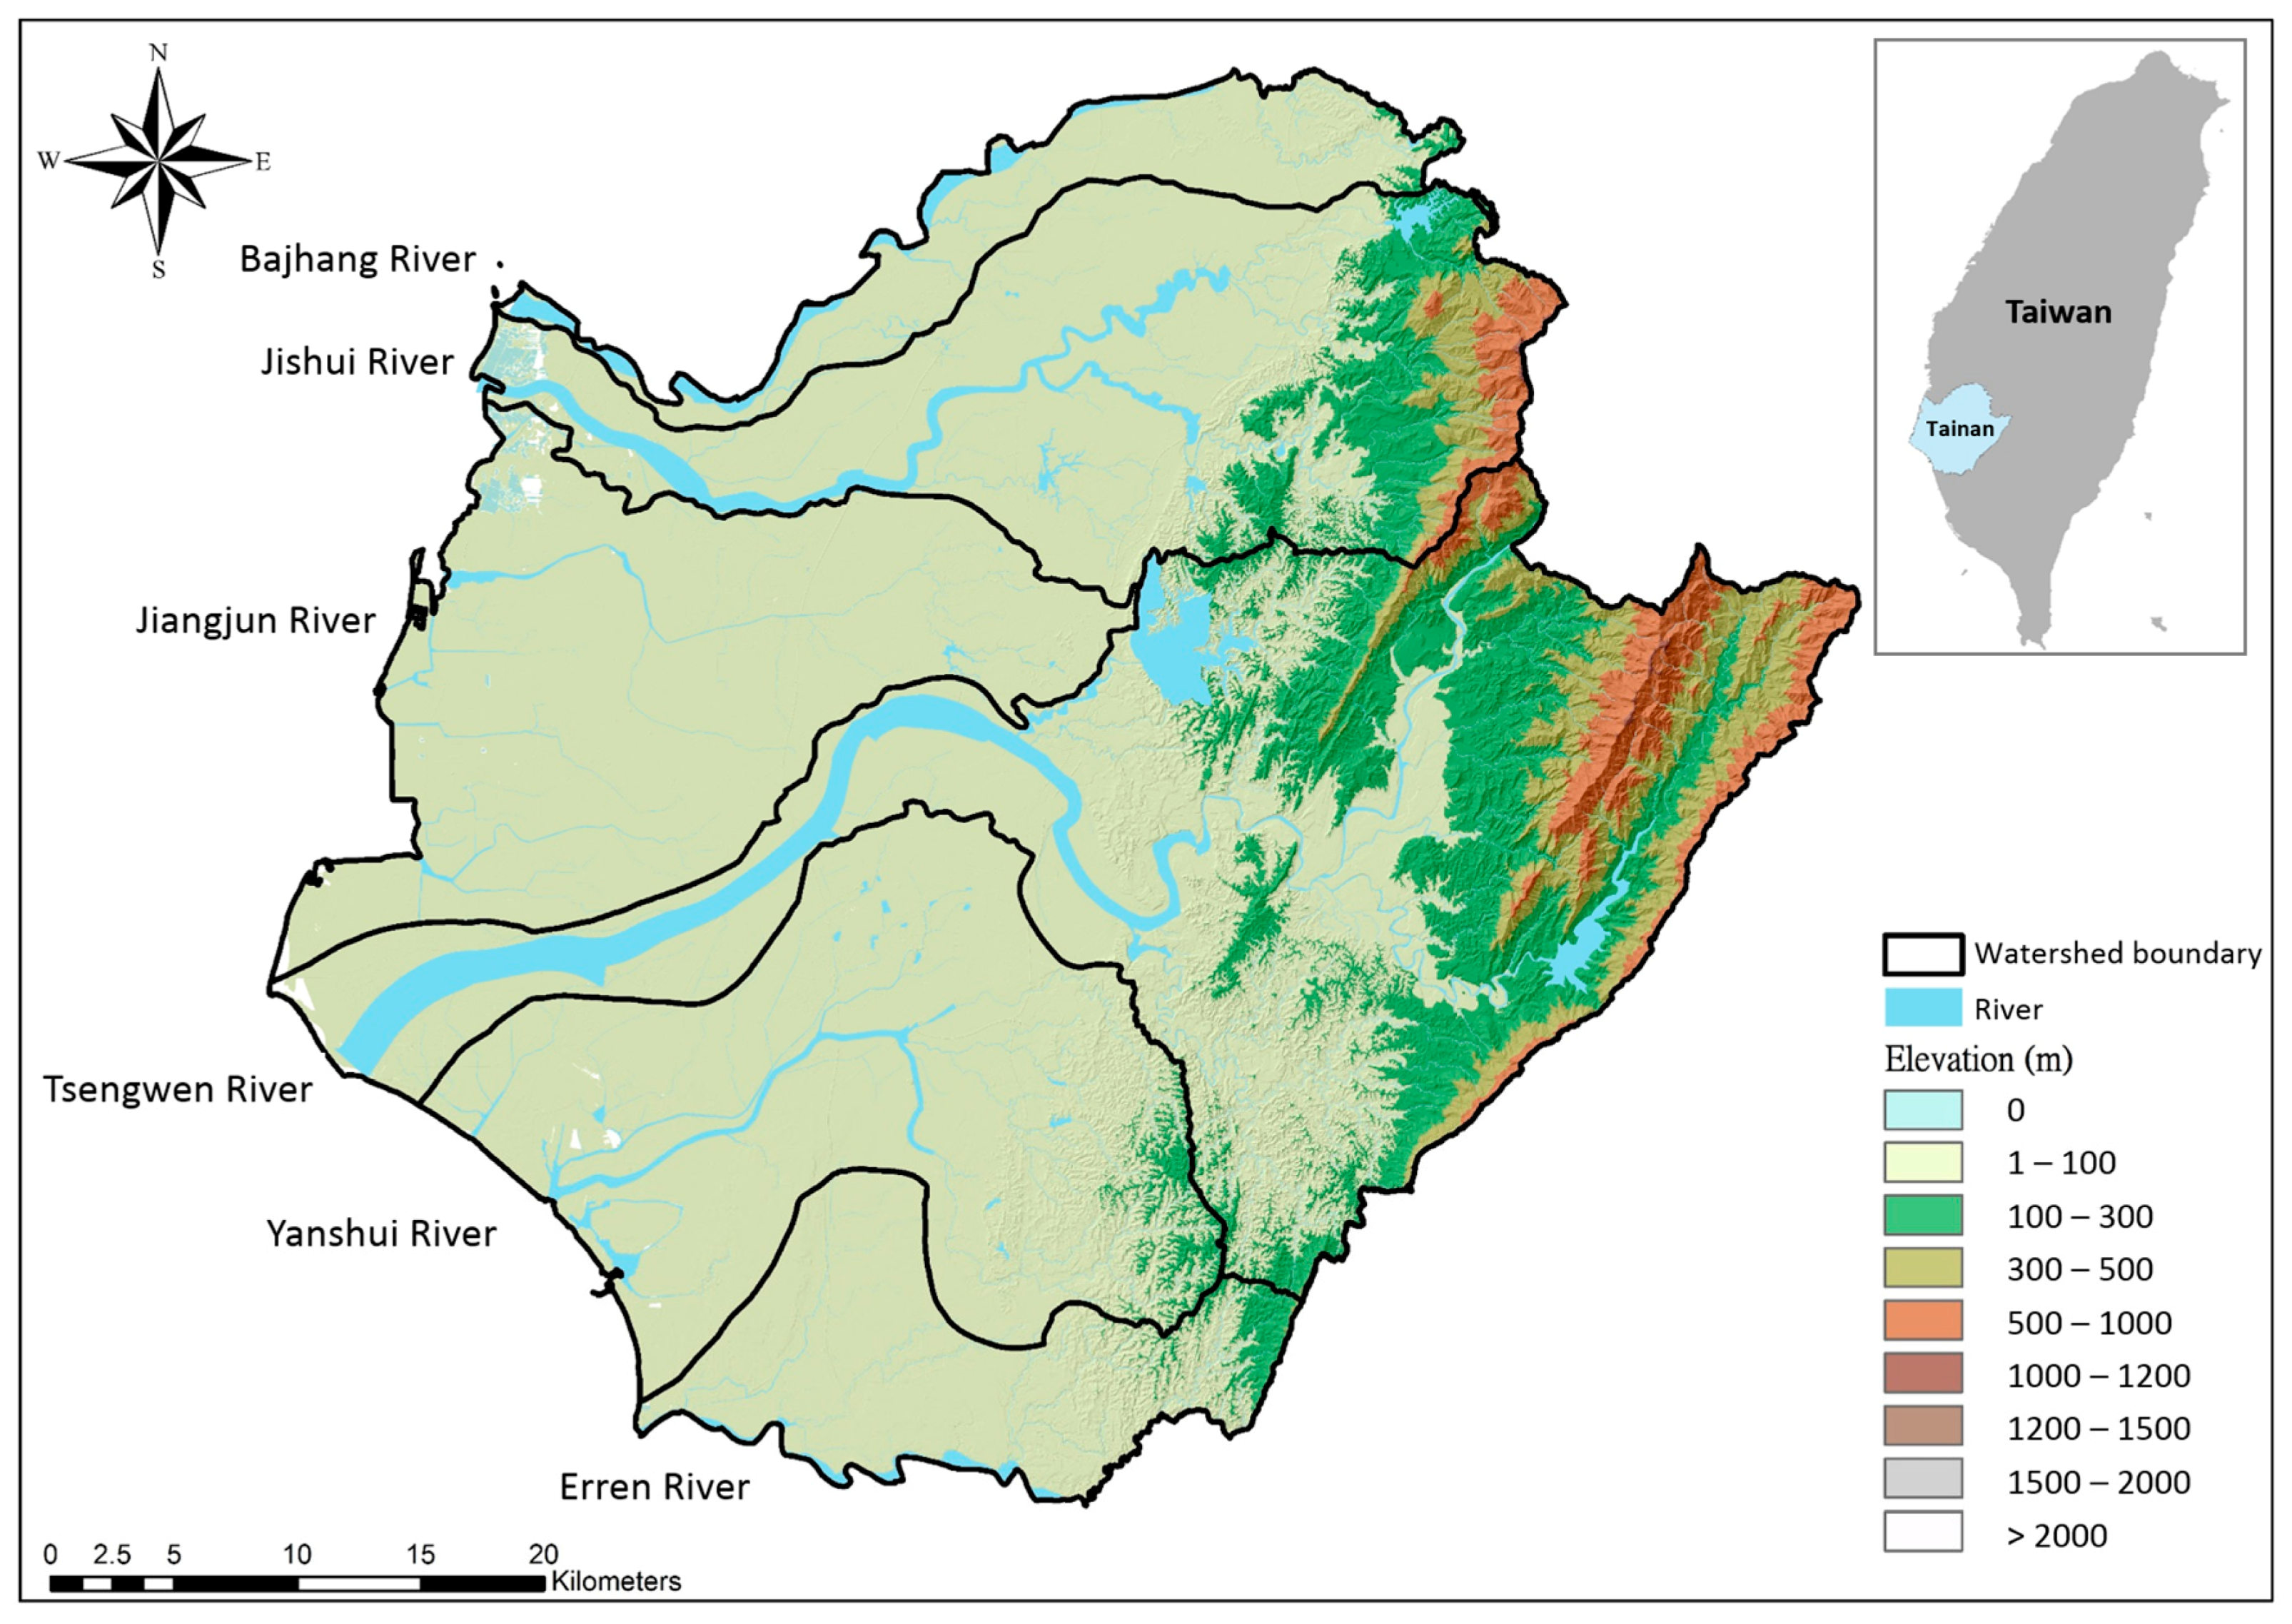
Tainan is the oldest city located in southwestern Taiwan. It is bordered by the Taiwan Strait to the west, as shown in
Figure 1. In 2016, Tainan City had a population of 1.9 million in its 37 districts. The total area of Tainan is 2200 km
2, with an average population density of 860 residents/km
2. More than 80% of the population lives in a 495 km
2 urban area (23% of the city) located in southwestern Tainan near the coast. The population density in the Tainan urban area is 4500 residents/km
2.
Six rivers run through Tainan: the Bajhang River, Jishui River, Jiangjun River, Tsengwen River, Yanshui River and Erren River (from north to south). Midwestern Tainan is an alluvial plain of the Yanshui River and Tsengwen River, with a few hills and mountains distributed in the east. The only river that runs through the urban area of Tainan is the Yanshui River, with a length of 41.3 km and a watershed area of 340 km
2, as shown in
Table 2. The coastline of Tainan City is 63.7 km.
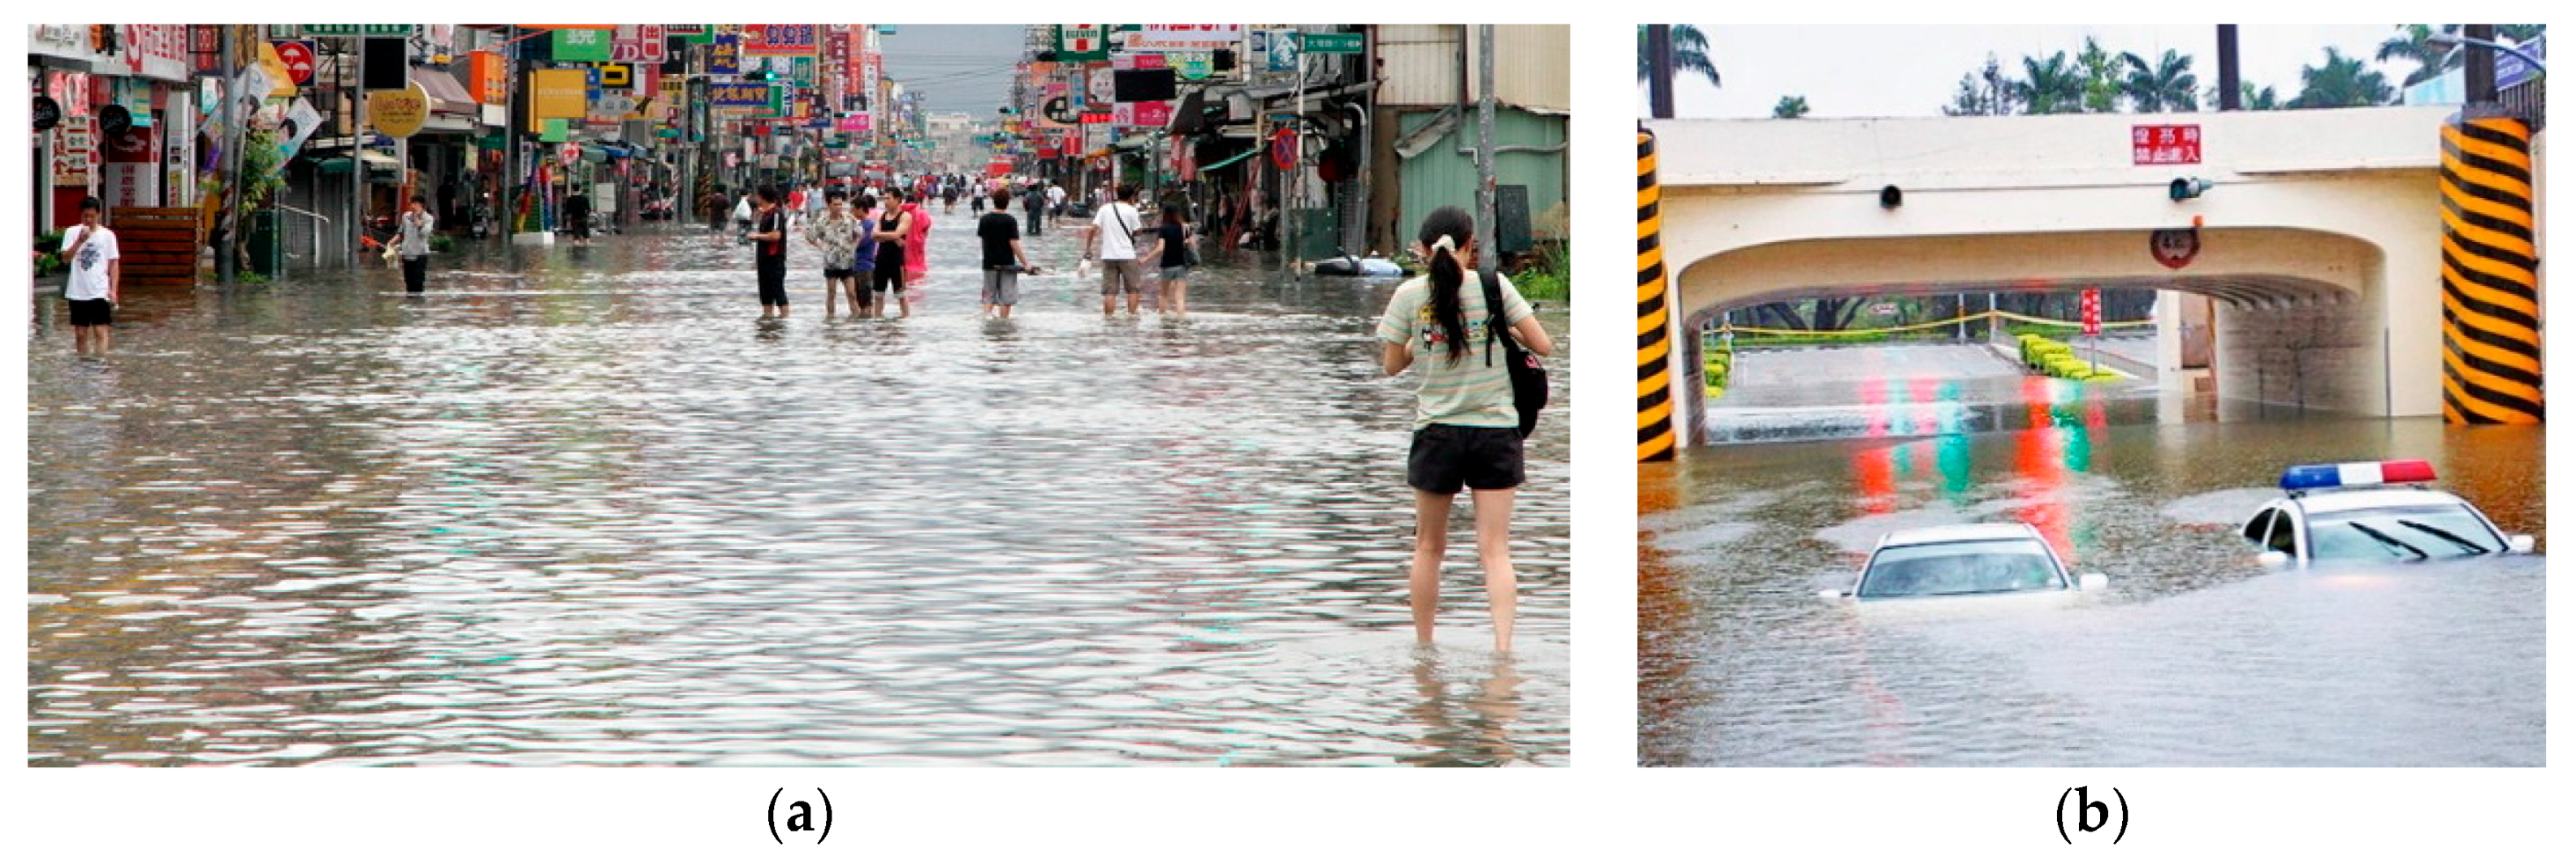
Tainan has frequently flooded in the past, see
Figure 2. The floods that occurred in Tainan City were generally induced by multiple factors, including rainfall which exceeds the drainage system capacity, a poor condition of the drainage system, flood defense failure, rising sea level due to high tides and/or storm surges, and urbanization. According to historical records, several typhoons, such as Morakot in 2009 and Kongrey in 2013, have hit Taiwan. These typhoons were accompanied by abundant rainfall that caused serious damage, especially in Tainan. More than 300 projects have been implemented in Tainan City to prevent flooding over the past 10 years, but these projects have not solved the problem. Tainan City is selected as the study area not only because of its significant urban development but also because rainfall is the dominant factor that influences flooding.
A real-time flood warning system is particularly needed for Tainan to enable more effective and immediate responses. However, real-time model simulations are computationally demanding and time consuming and as such they make the use of numerical models difficult for practical real-time application. In this regard, the pre-produced flood inundation maps offer the possibility of overcoming issues that are associated with the use of numerical models in real-time flood forecasting and decision-making.
3. Development of Flood Inundation Maps
3.1. Methodology
In the present work, one-dimensional (1D) hydraulic flow model was used to simulate flows in drainage channels. This model was then coupled with the two-dimensional (2D) model to simulate flows along the floodplain. Physically-based computational model SOBEK which was developed by Deltares (
https://www.deltares.nl/en/) was used in the present work. SOBEK has been successfully applied in various flood forecasting, drainage system optimization, irrigation system control, sewer overflow design, river morphology, salt intrusion and surface water quality studies [
44,
50,
51,
52,
53,
54].
SOBEK is a coupled 1D-2D hydrodynamic model. The 1D St. Venant equations are solved for a series of cross-sections of the main channel and the overbank perpendicular to the main channel. The water level is spatially interpolated in the 1D computational grid points and imported into the 2D flood model based on a finite difference, staggered grid solution. The flow is modeled by solving the continuity equation and the momentum equations in the
x- and
y-directions as follows:
where
y is the depth of the channel from the reference level,
x is the longitudinal distance along the channel,
t is time,
h is the water head elevation from the reference level,
u is the flow velocity in the
x-direction,
v is the flow velocity in the
y-direction, and
n is the Manning coefficient.
Carrivick [
49] used a SOBEK 2D hydrodynamic model to reconstruct the characteristics of high-magnitude outburst floods in the proglacial area of Kverkfjöll, Iceland, in anastomosing networks of simultaneously inundated channels. The country-wide SOBEK 1D hydrodynamic model (abbreviated LSM) was developed to model the surface water distribution as part of the Delta model, which is a set of models used to analyze the decisions related to the long-term fresh water supply and flood risk management in the Netherlands [
51,
52]. Linde et al. [
55] used the SOBEK model to simulate low-probability flood peak events in the Rhine basin. Vanderkimpen et al. [
50] compared the flood modeling using MIKE FLOOD with SOBEK. However the SOBEK model has been improved in recent years. Wei et al. [
54] employed the SOBEK channel flow (CF) module and the rainfall-runoff (RR) module in river channel simulations to estimate river flow risks under climate change in the Tsengwen River basin, Tainan, Taiwan. Wu et al. [
53] integrated the SOBEK model for flood simulations, a landslide model, and a coastal model to assess disaster impacts comprehensively according to extreme rainfall scenarios under climate change.
The first step for constructing a FIM is the data collection. This study entirely collected hydrological and geomorphologic data as well as all necessary records and regulation reports in Tainan City. Upon the instantiation of the model, the next step involved hydrologic analyses, such as a frequency analysis, and establishing of rainfall patterns that can be used as inputs into the flood modeling work. Hydrologic analyses were conducted for river level, discharge and storm surge estimation. The flood model was calibrated by adjusting model parameters to match historical flood events. The model was then validated to determine the accuracy of flood simulation in relation to independent flood events. The last step in the development of FIMs was simulation of flood extents and flood depths using the calibrated and validated model.
3.2. Data Used
For construction of the FIM for Tainan City, large amounts of different kinds of data were collected. They are shown below.
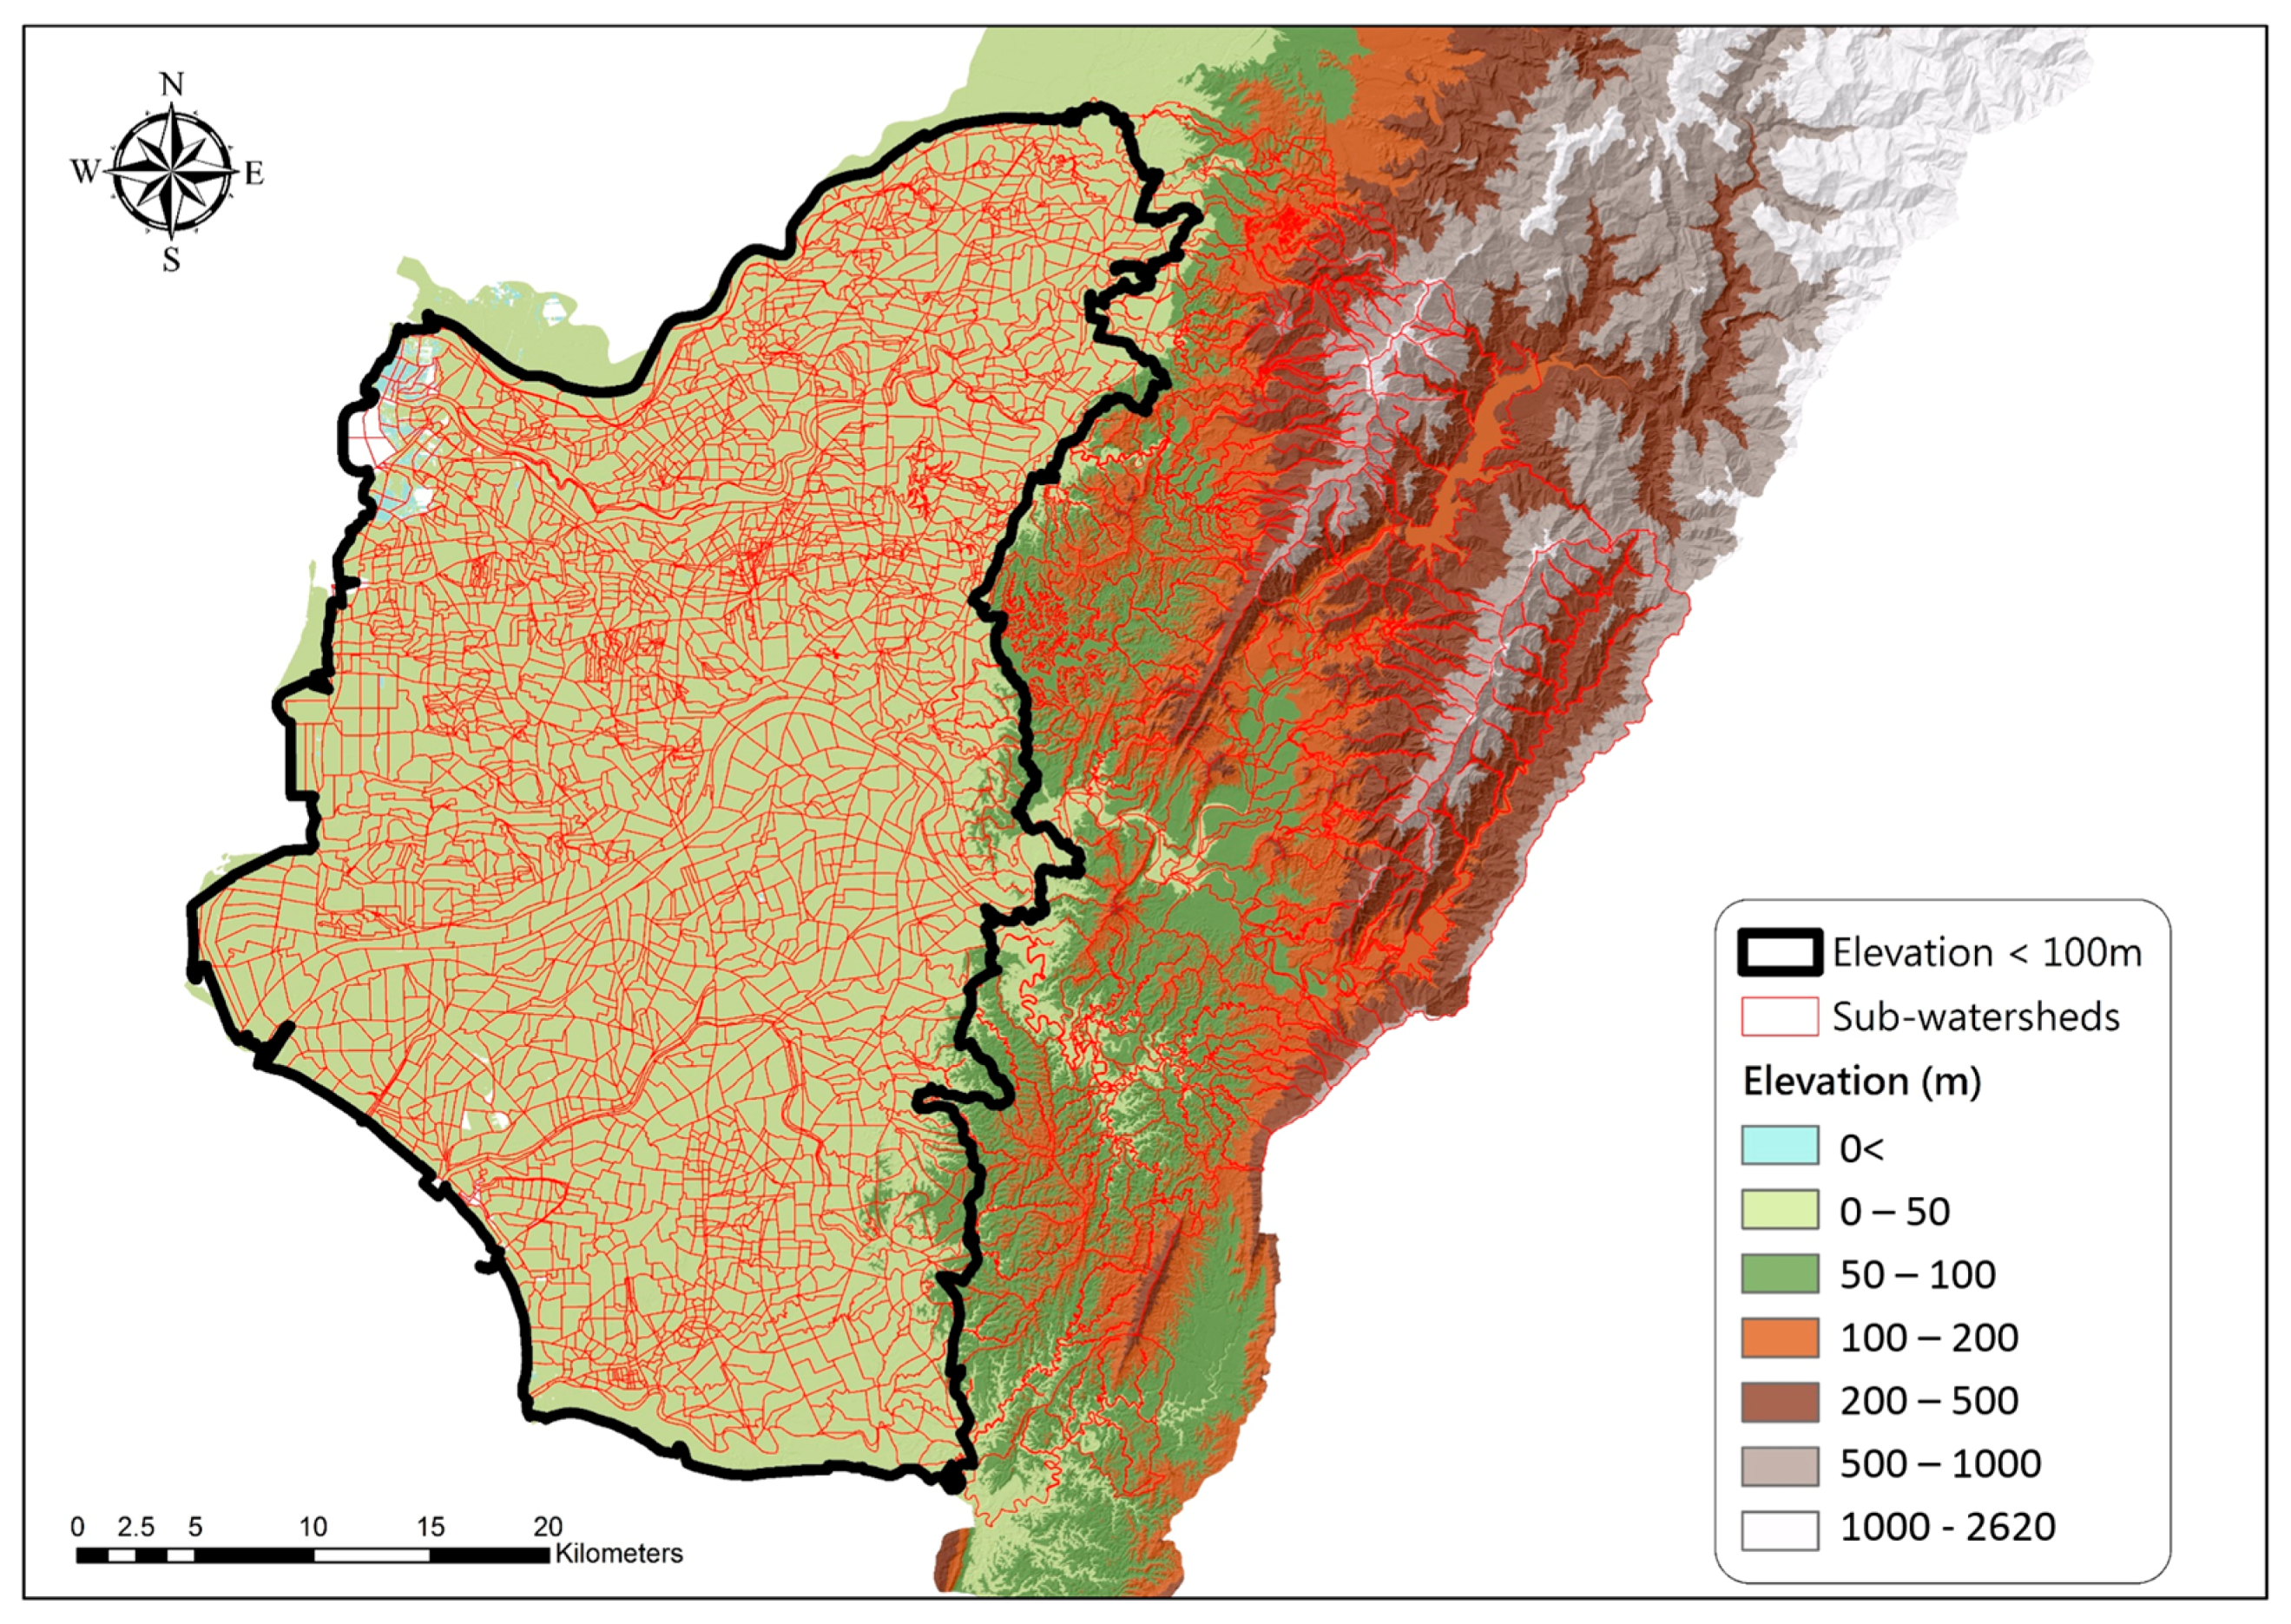
3.2.1. Digital Elevation Model (DEM)
Gridded arrays of elevations with 40 × 40 m spatial resolutions in hillside fields and mountainous areas (elevation > 100 m) and with 5 × 5 m resolutions in low-lying areas (elevation < 100 m) were collected. The DEM used in this study is generated by Light Detection and Ranging (LiDAR) with 10–15 cm accuracy in height, provided by Ministry of Interior of Taiwan. The DEM-based topography of Tainan City is also shown in
Figure 1.
3.2.2. River Cross-Sectional Shape
Cross-sectional shape varies with position in the river and discharge. The elevation variations in the cross sections of six rivers in Tainan were collected. The interval of the cross-sectional shape data is 300 m in non-urban areas and 20 m in urban areas.
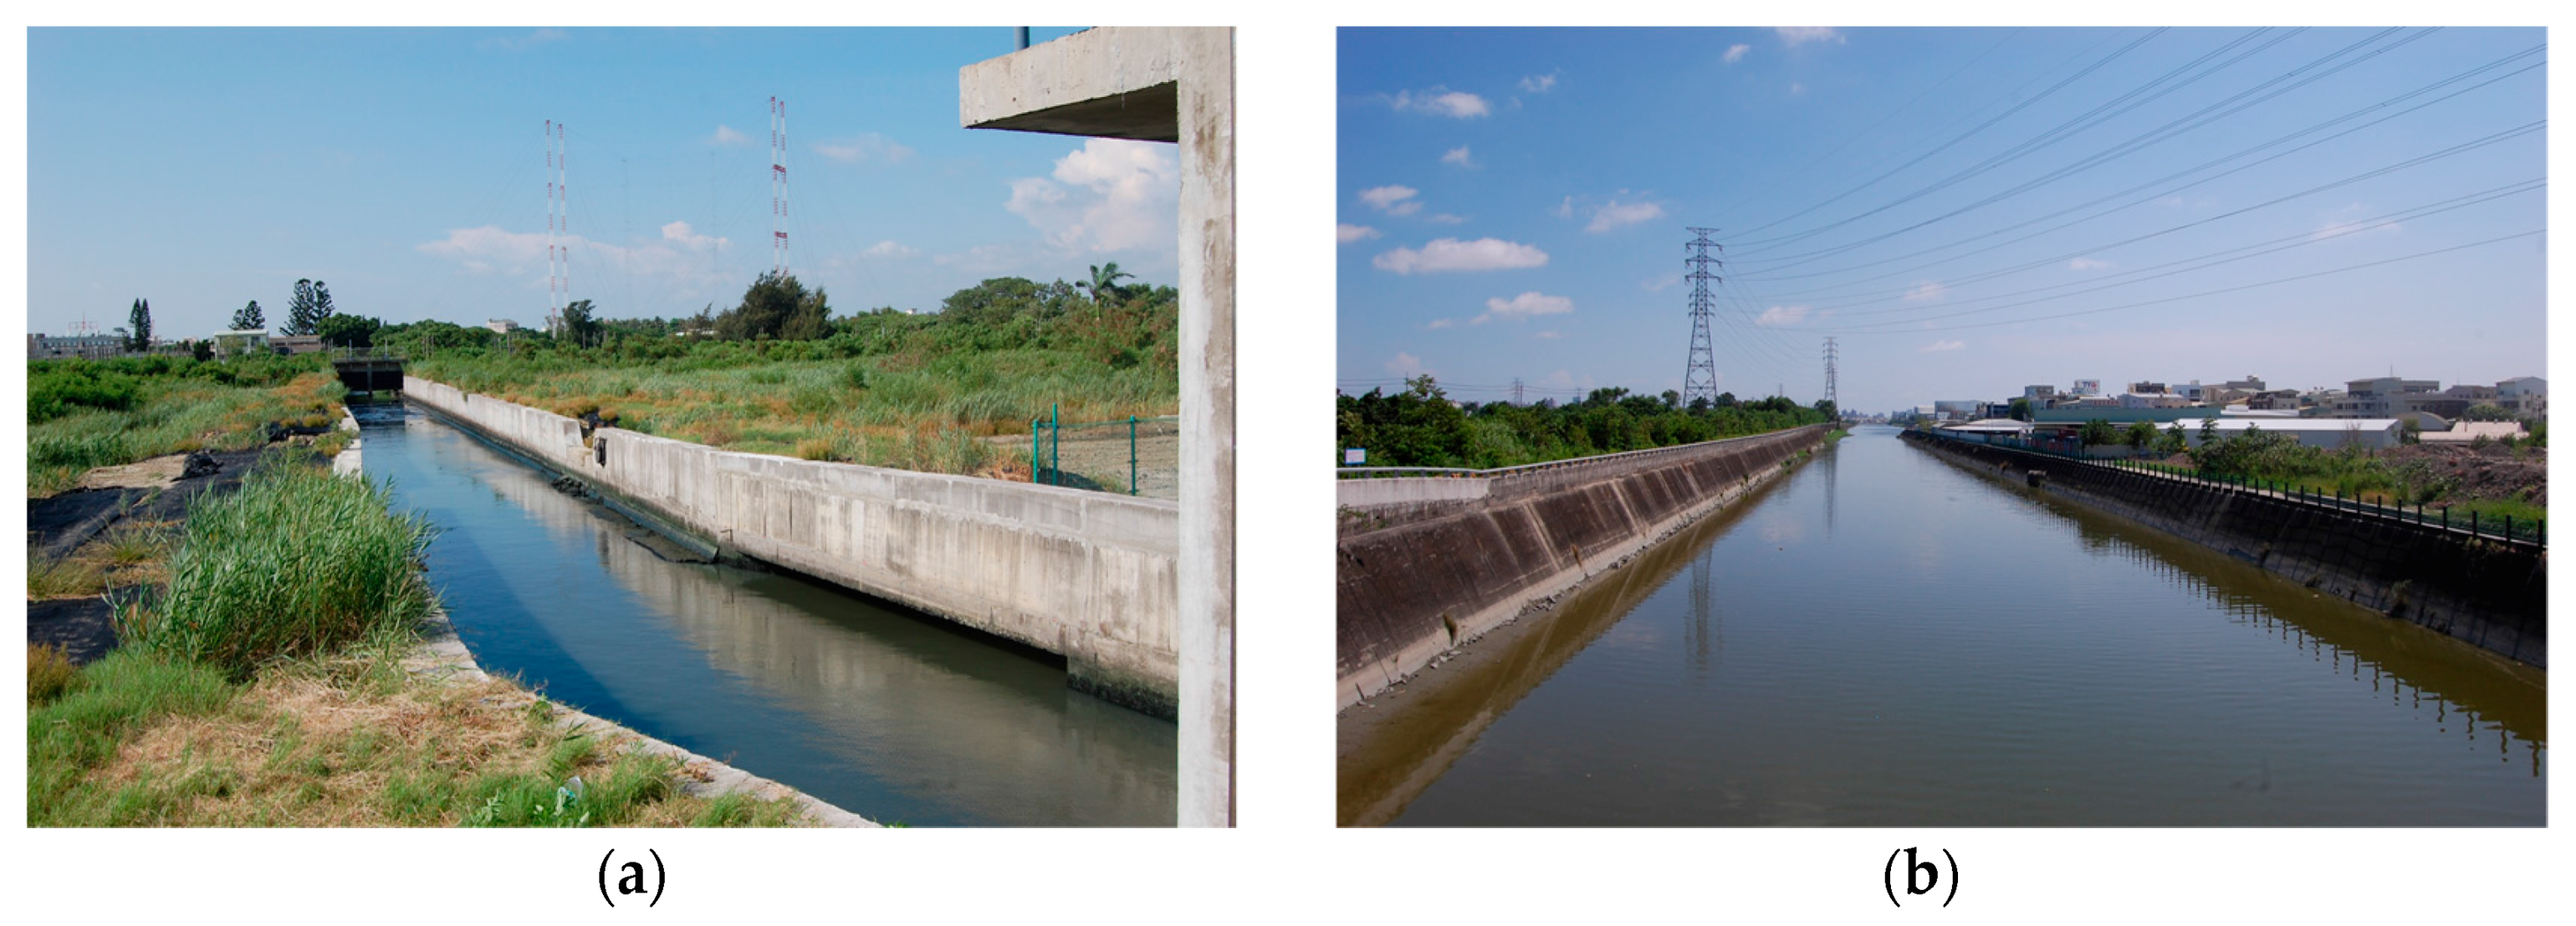
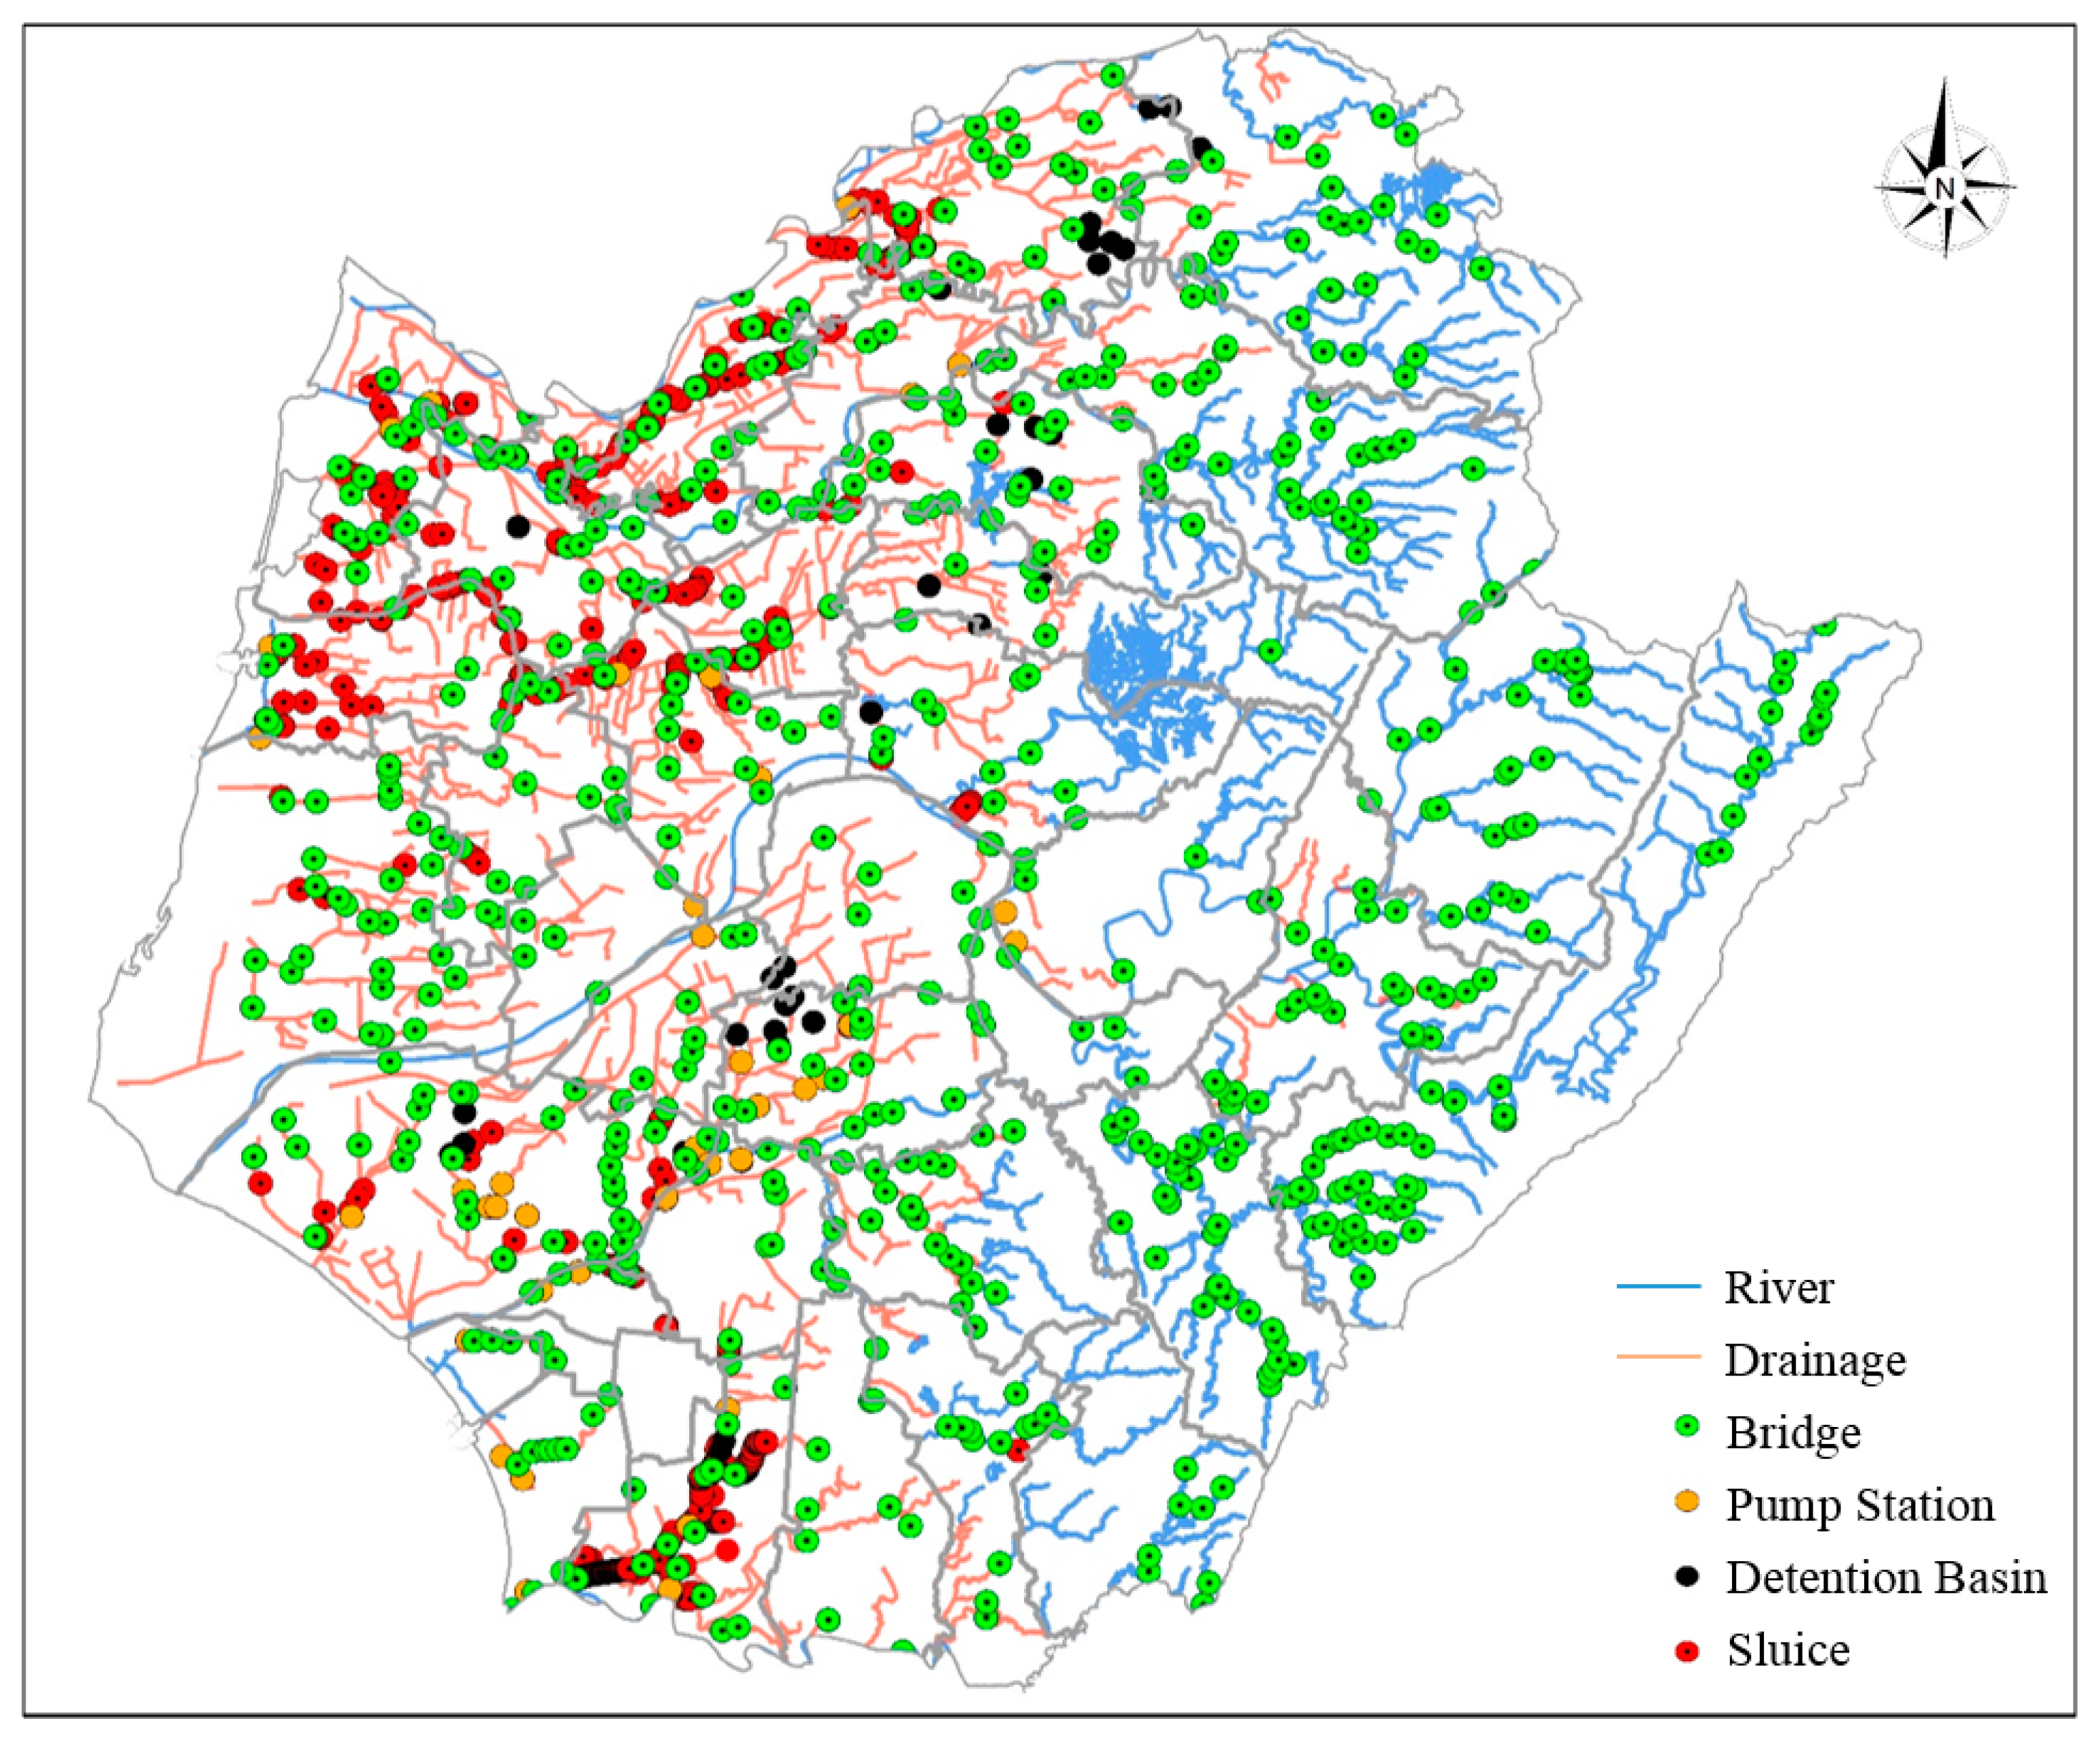
3.2.3. Regional Drainage System (Open Channel)
Open-channel rainwater drains are extremely common in the low-lying countryside of Tainan City, as shown in
Figure 3 and
Figure 4. The drain is a type of sewer system. The regional drainage system generally consists of a secondary drainage system with a network of small drains attached. The small drains transport rainwater to a primary drainage system composed of main drains that serve large areas. The main drains are connected to rivers. There are 662 rainwater drains, as shown in
Figure 4. Generally, the design return period for a drain is 25 years. The shapes and elevations of drain cross-sections were collected for the development of FIMs.
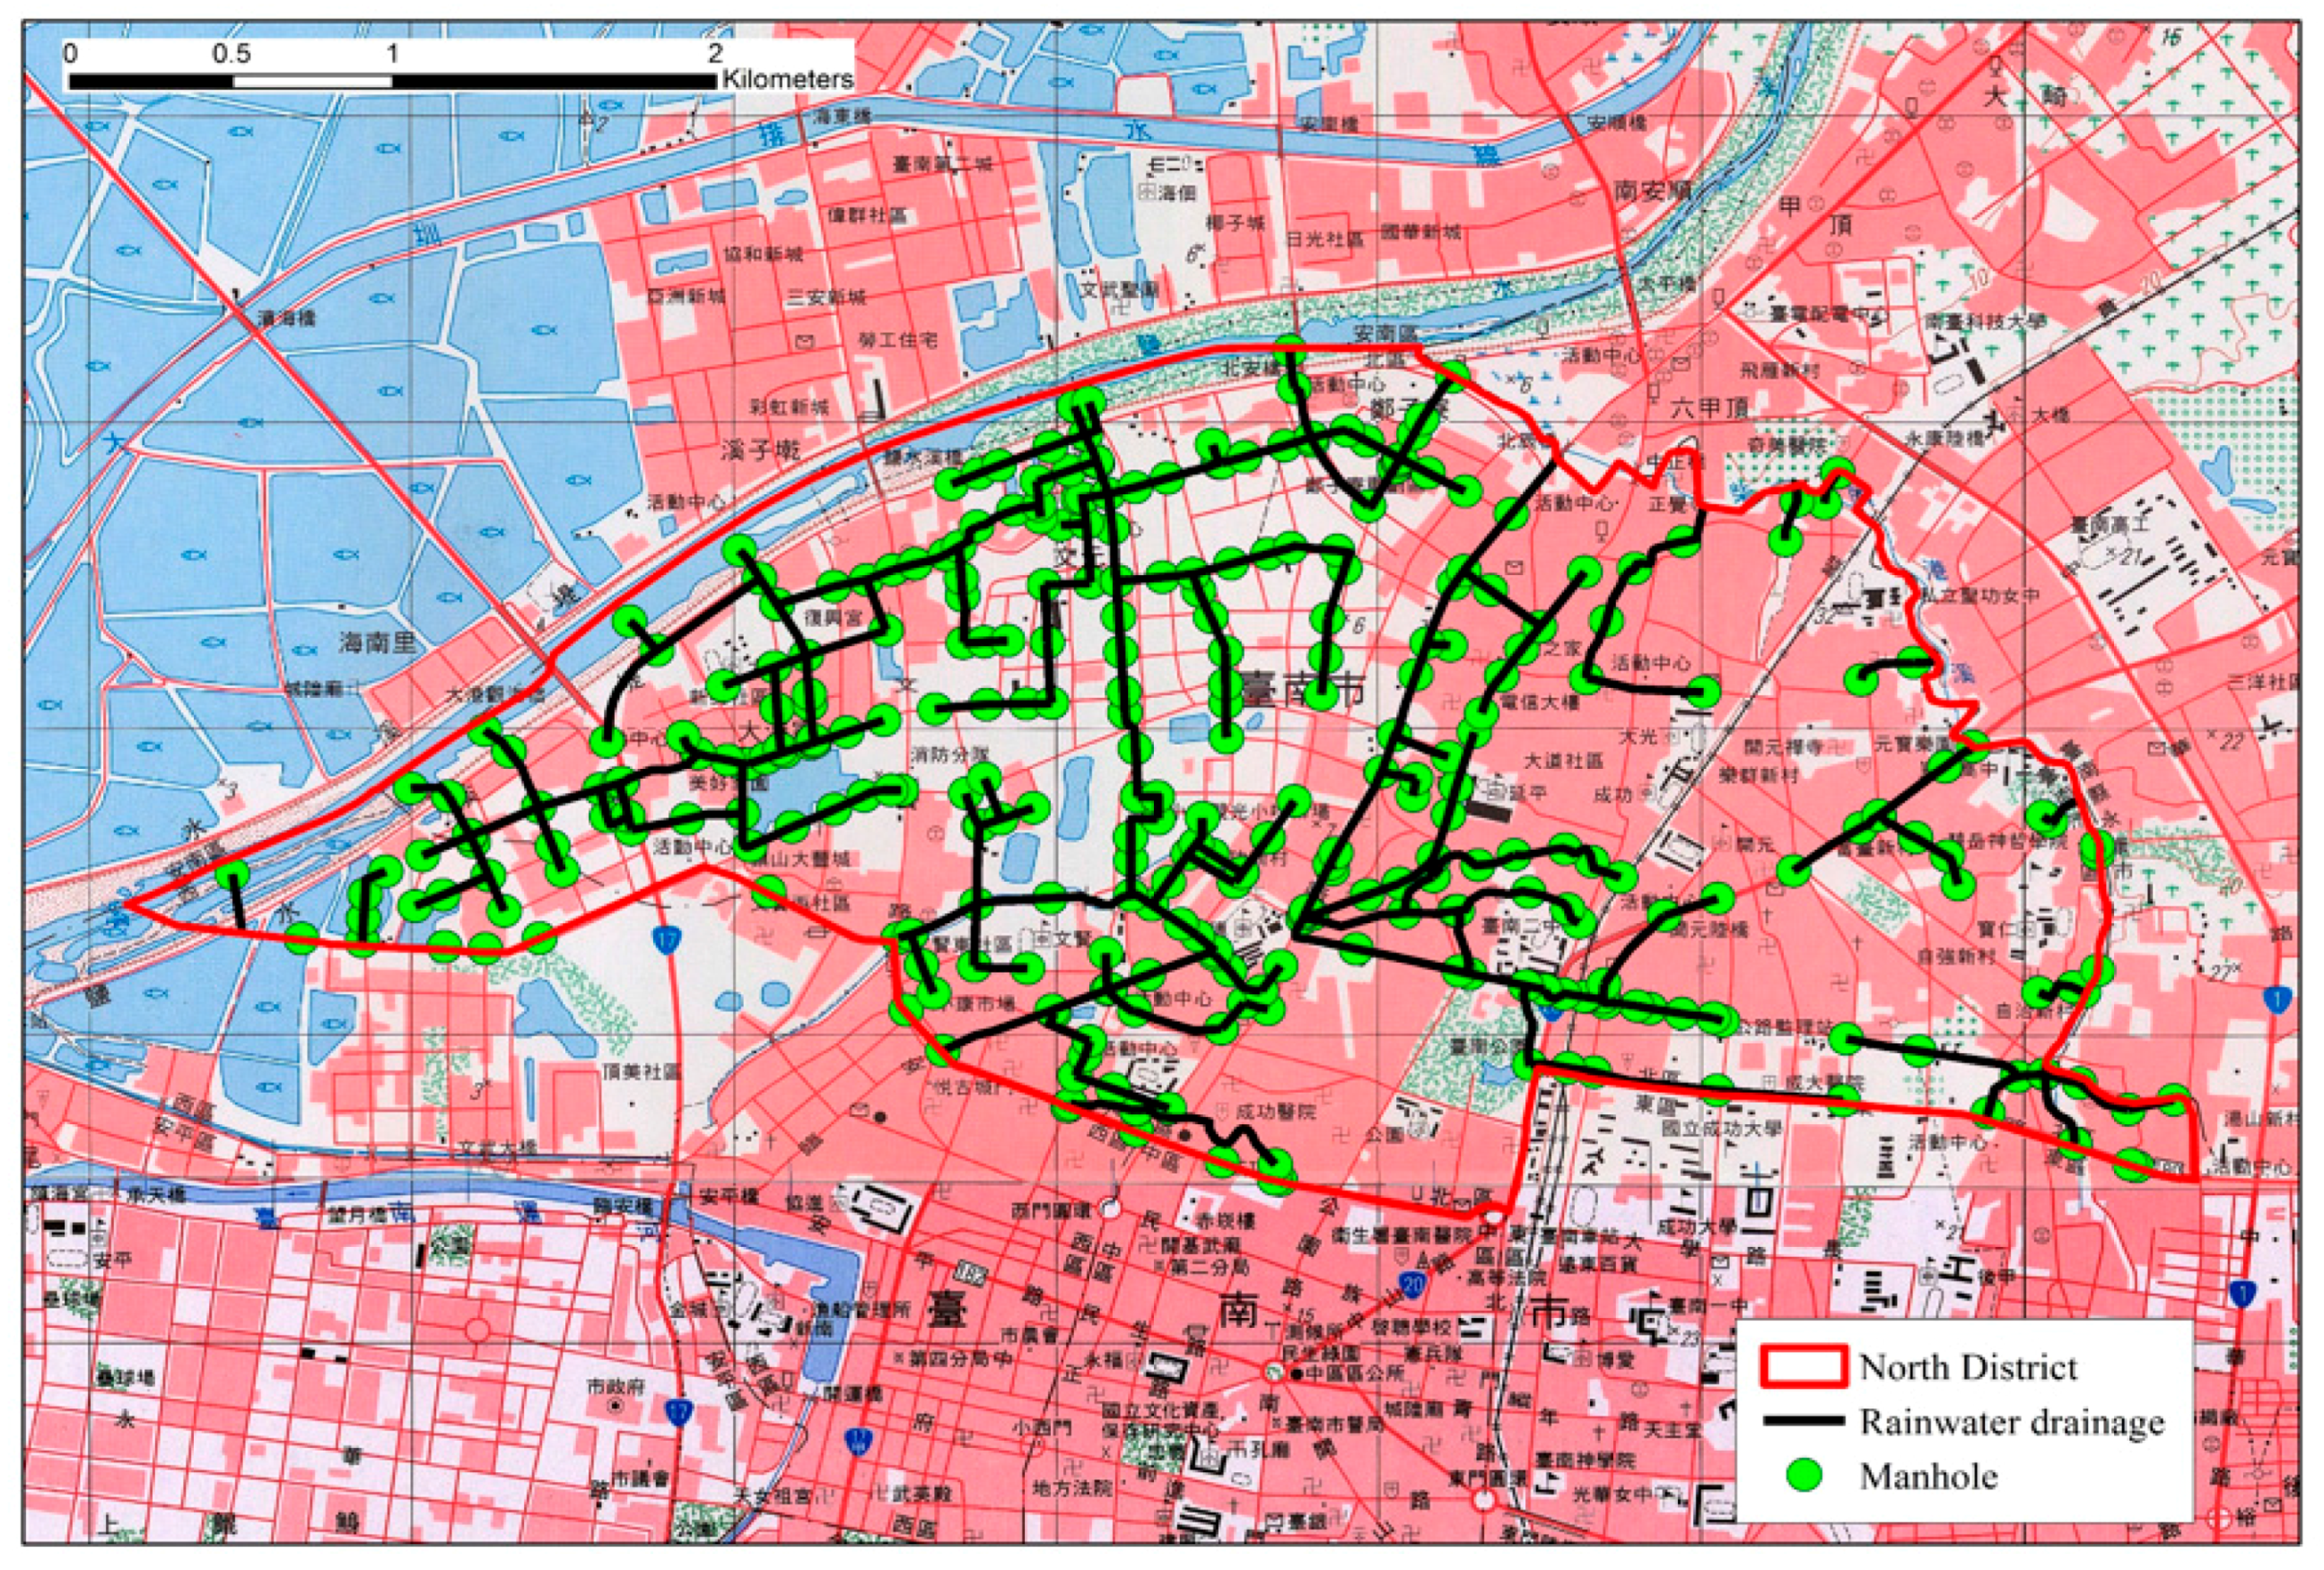
3.2.4. Rainwater Sewer (Underground)
The rainwater sewer (i.e., drainage) system is comprised of a large underground pipe network. It collects and transports rainwater runoff to rivers. Manholes are installed wherever there is a change of gradient or alignment. The completion rate of the rainwater sewer system in Taiwan is higher than 60%, and the network is mainly located in urban areas (
Figure 5). The design return period for a sewer system in Taiwan is approximately 2–5 years according to the development conditions of the area, and the time of concentration of the system ranges from 30 min to 2 h [
56]. The locations, lengths, shapes and elevations of sewers were collected. There are 4335 underground sewer pipes and 8345 manholes in Tainan City.
3.2.5. Satellite and Aerial Images
Satellite images from Formosa-II taken by optical sensor (resolution 2.0 m) and aerial orthoimages taken by LIDAR (resolution 0.25 m) with a scale of 1:5000 were used to divide or adjust the sub-watersheds, which were defined according to rainwater drainage or sewer systems. This study collected more than 400 images in Tainan City.
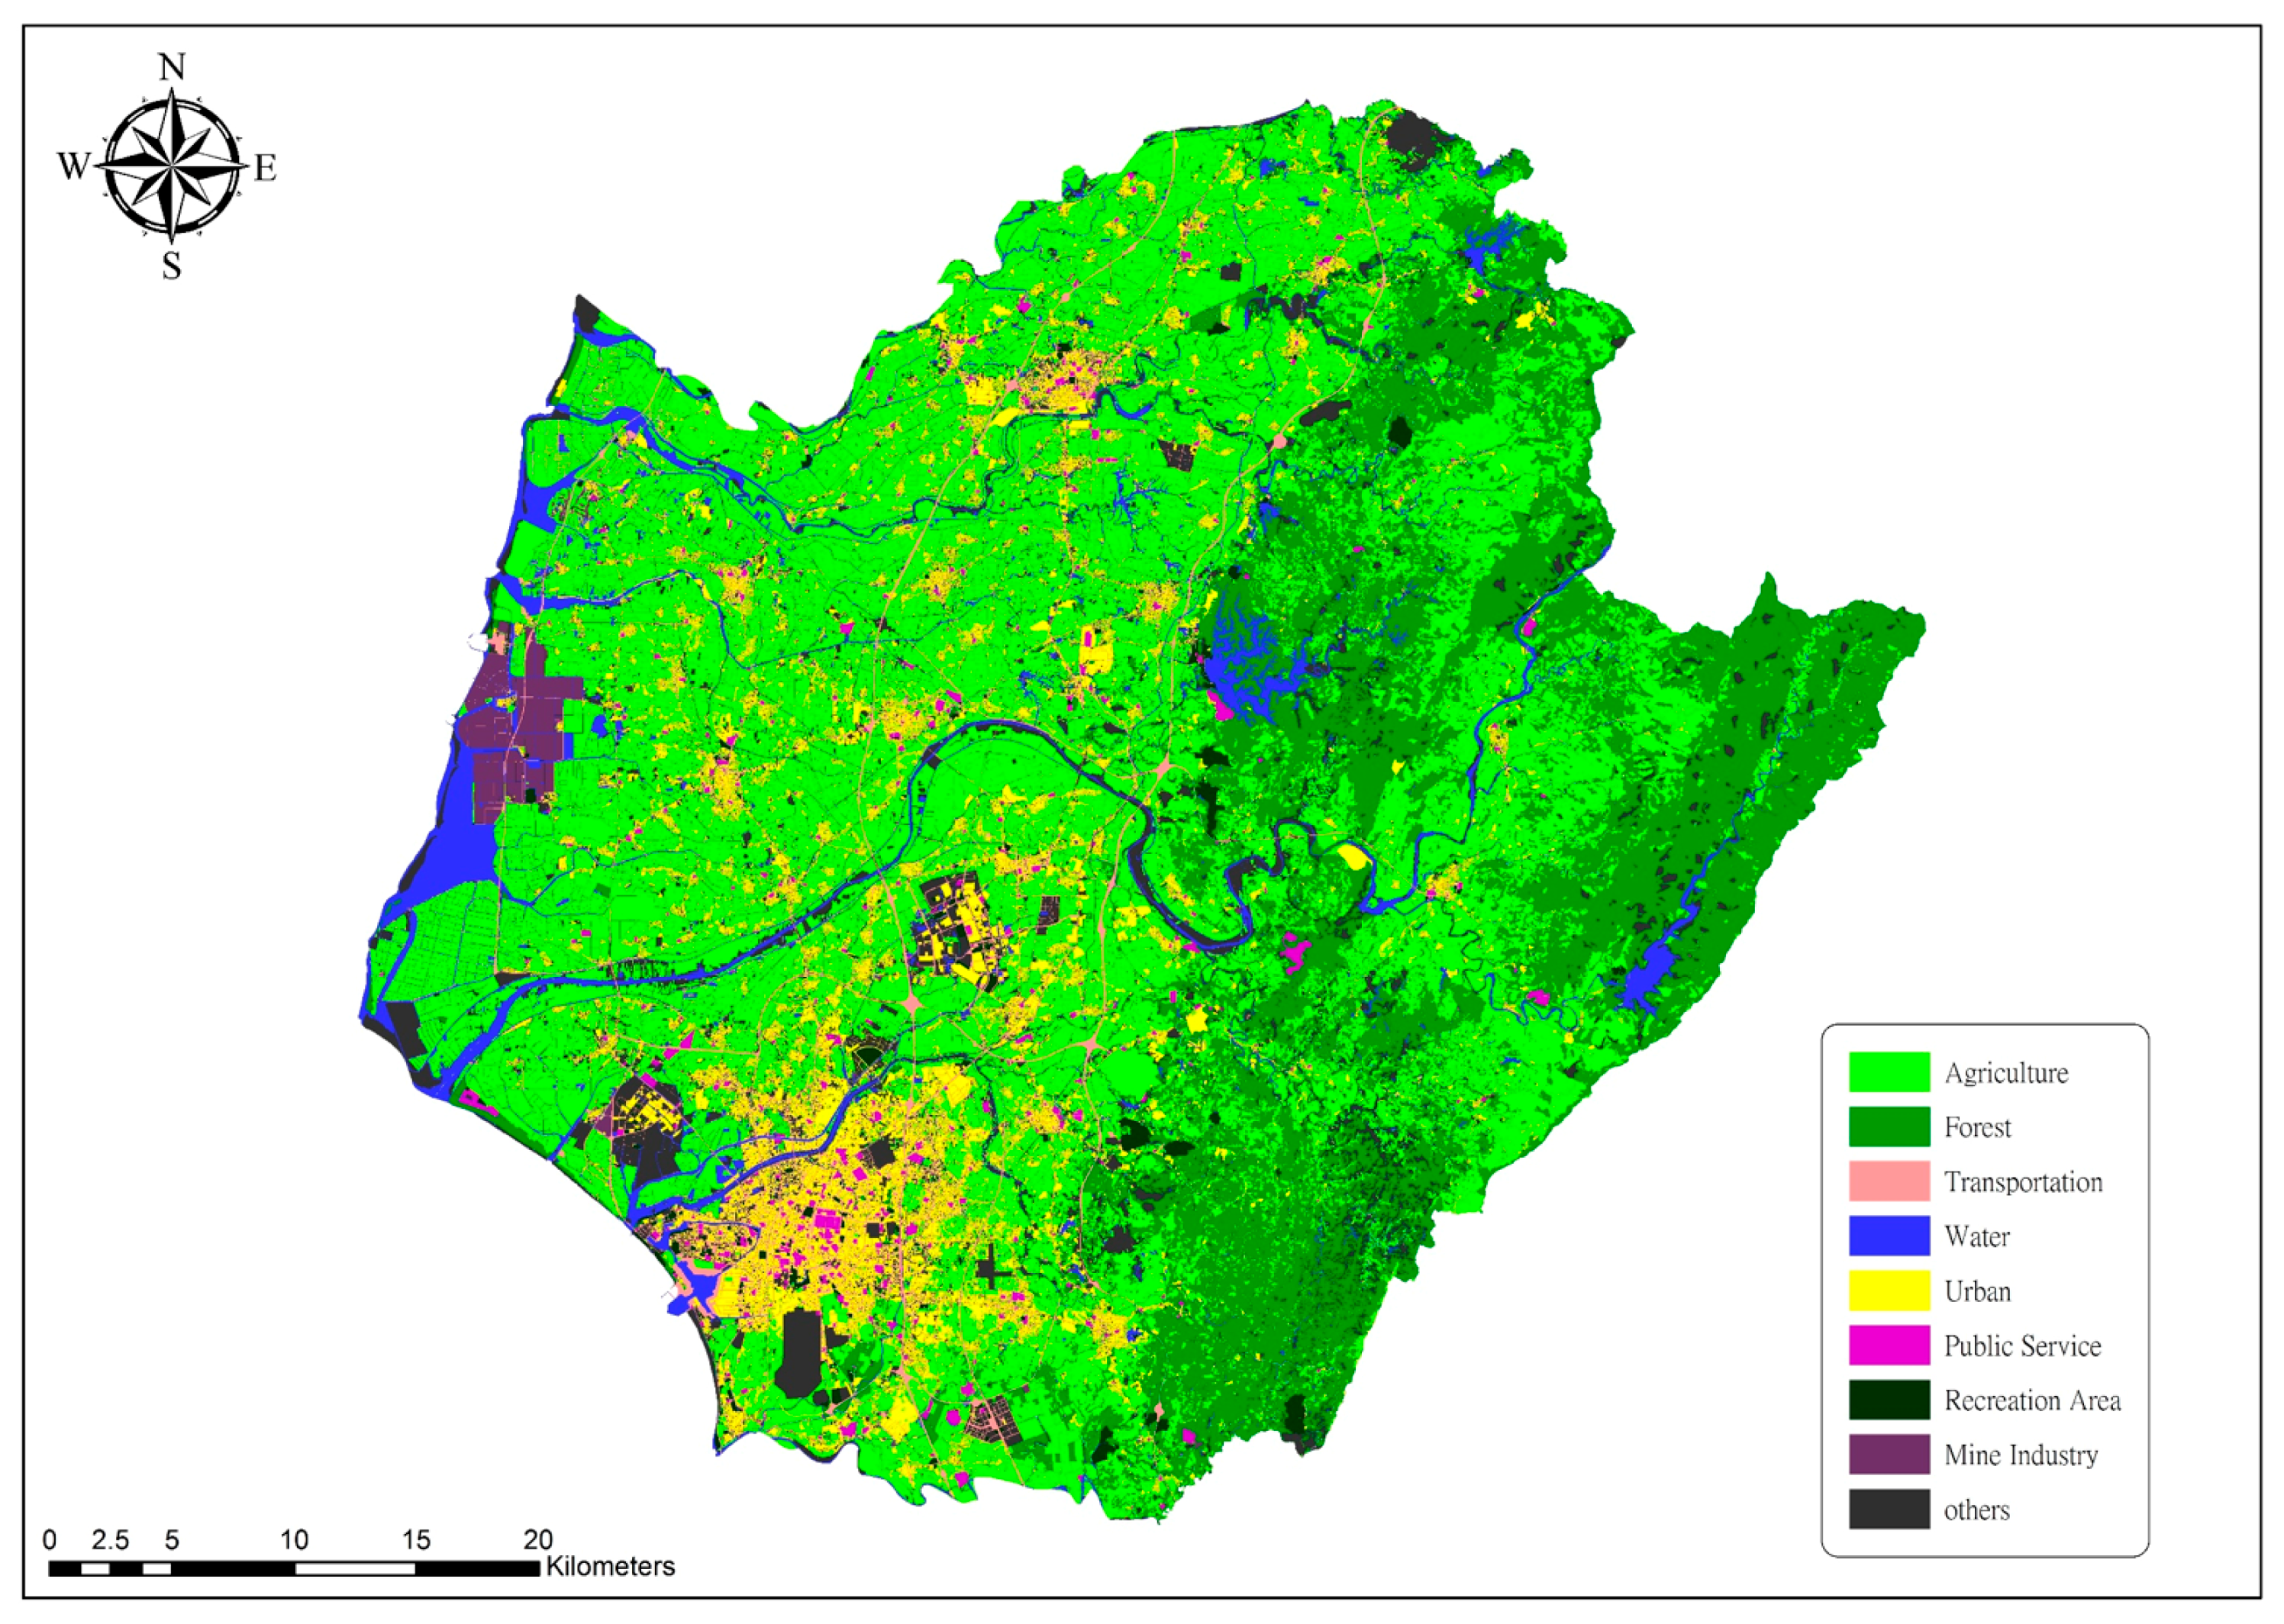
3.2.6. Land Use
Land use conditions shown in
Figure 6 were collected to identify the land roughness and derive the flow behavior. In Tainan City, more than 45% of the land is used for agriculture. Only 35% of Tainan City comprises villages or urban areas.
3.2.7. Hydraulic Structures and Instruments
Hydraulic structures such as sluice gates, dykes, reservoirs and detention basins, and hydraulic instruments such as pumping stations are also included in the flood model. Bridges that cross rivers were also included. For the purposes of the present study, the data concerning hydraulic structures and instruments in Tainan City were also collected. The data items include elevations of 81 river dykes, 1206 sluice gates, 955 bridges, 38 ponds and detention basins, 13 reservoirs and 380 pumping stations (fix and mobile), including fixed and mobile pump machines. The amount of hydraulic structures and instruments in six rivers is shown in
Table 3.
3.2.8. Rainfall Records
The locations, elevations, record lengths and data contents from 99 rainfall stations were collected in Tainan City and the nearby cities of Chiayi and Kaohsiung. The present study used 37 stations that have recorded hourly rainfall for more than 20 years.
3.2.9. River Water Level and Discharge
Hourly data from 45 river level stations and 12 river discharge stations were collected. The river level and discharge data are mainly used for calibration of the 1D hydrodynamic model.
3.2.10. Seaside Data
Hourly sea level data from 3 tidal stations along the Tainan coast were collected. Tidal data are used for a storm surge analysis and as the downstream boundary of the river in the 1D hydrodynamic simulation. In addition, data were collected from a marine data buoy located at a depth of 20 m and 1 km off the Tainan coast. Wave data (height, period, and direction) and 200 m resolution bathymetry data are used for the run-up analysis together, especially during the typhoon period.
3.2.11. Historical Flood Events
Data from historical flood events, including flood depths and flood extents, over the past 10 years were collected for model calibration and validation purposes. These data mostly come from the reports from local villages and local stakeholders.
3.3. Simulation and Verification
3.3.1. Rainfall Analysis
River runoff is the driver of flood simulations, and it is assumed to be mainly generated by precipitation. The occurrence and quantity of runoff are dependent on the characteristics of the rainfall event, i.e., the intensity, duration and distribution. The objective of the rainfall analysis was to obtain the amount of rainfall for the corresponding duration, the return periods and the hyetographs for each station.
Annual maximum rainfall depths for durations of 6, 12, 24 and 48 h were obtained using historic hourly data from 37 rainfall stations in Tainan with records of longer than 20 years. Six statistical distributions, including Normal, Log-Normal, Extreme Value Type I, Person Type III and Log-Person Type III, were used to fit the rainfall data. Two goodness-of-fit tests (Chi-square and Kolmogorov–Smirnov tests) are used to evaluate the best fitting model. The rainfall depths for recurrence intervals of 2, 5, 10, 25, 50, 100, 200 and 500 years are derived for the corresponding durations.
Table 4 shows the results for the Tainan rainfall station (Station No. 467410). The results of the frequency analysis were used to develop the relationship between rainfall intensity (or depth), duration, and frequency (or return period) at all sites and to create IDF (Intensity–Duration–Frequency) curves which used to estimate rainfall intensity according to assumed duration and return period. Horner’s equation is used to fit the IDF curves in this study.
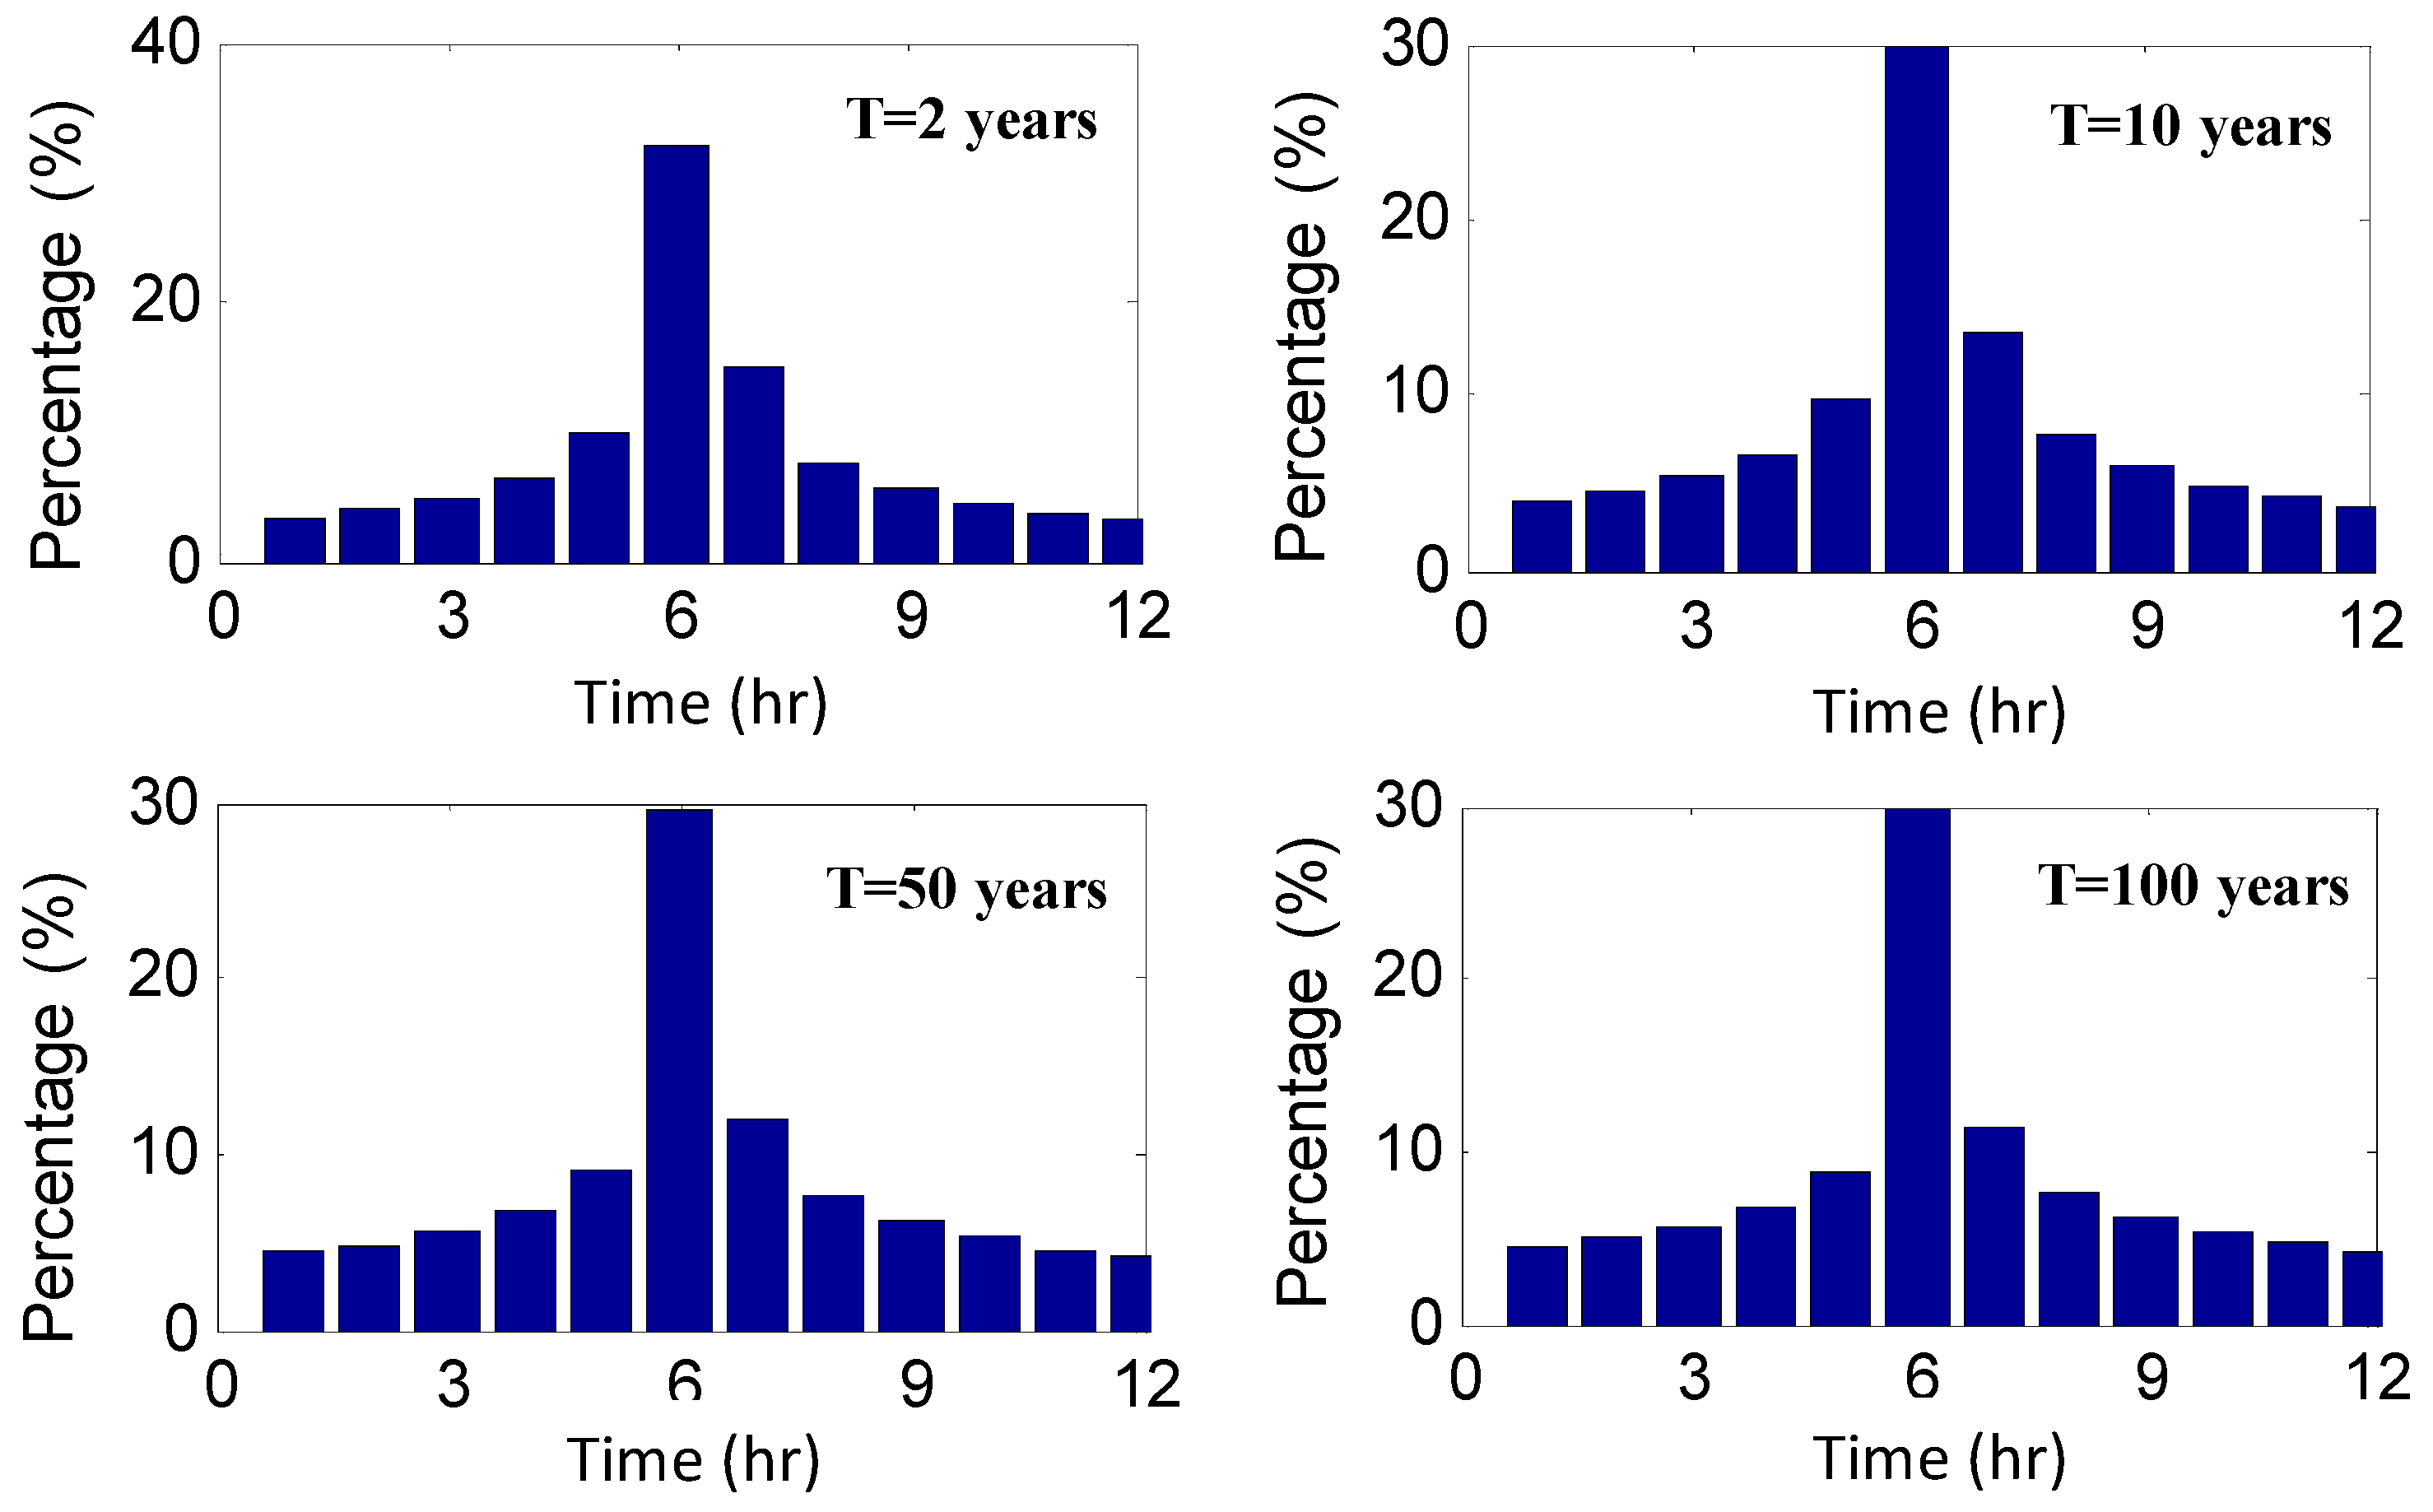
A design hyetograph is then required to obtain the temporal distribution of runoff according to total rainfall depth. Kimura et al. (2014) [
57] incorporated a modified ranking method to create a design hyetograph. In this study, the alternating block model [
58] was used to derive duration-specific and return period-specific hyetographs from IDF curves.
Figure 7 shows the designed storm hyetograph at Tainan Station for 2-, 10-, 50- and 100-year return periods and a 12-h duration.
3.3.2. Storm Surge Analysis
A storm surge is usually characterized as an abnormal rise in water level generated by a storm, over and above the predicted astronomical tide. The total water level is the superimposition of the tide, storm surge and wave run-up. The water level rises when a typhoon approaches, especially since the waves are large enough to generate significant run-up. When the total water level is higher than the sea dyke elevation, overtopping occurs. In this study, the High Water of Ordinary Spring Tide (HWOST) is used as the base tide height. The maximum storm surges derived from 105 typhoons from 1980 to 2013 are obtained by numerical simulation using the MIKE 21 program. The same distributions and goodness-of-fit used in the frequency analysis were employed to test the best fitting model of storm surge. The heights of storm surge on the Tainan coast were estimated for return periods of 2, 5, 10, 25, 50, 100, 200 and 500 years, as shown in
Table 4.
3.3.3. Model Setup
In the present work, modules of R-R (Rainfall–Runoff), 1DFLOW (Rural and Urban) and 2D Overland Flow in SOBEK Advanced Version 2.13.002 were used. The work used R-R in areas with elevations higher than 100 m, which are defined as highland areas. Runoff routing to downstream areas (elevation < 100 m) was performed using 1DFLOW. When the runoff rates exceed the capacity of the river channel, the 2D Overland Flow module takes over computations and simulates the propagation along the floodplain.
The DEM with resolution of 40 × 40 m was used for uniform land use areas, and a 10 × 10 m DEM was used for multi-use areas in highland parts. Additionally, a 5 × 5 m DEM was used to construct the computational grids in urban areas.
The parameters of the SCS Runoff Curve Number Method were set in the R-R modules for each watershed. The cross-sectional shapes of rivers, regional drainage systems and properties of sewers and hydrologic structures described in
Section 3.3 were used as inputs into the hydraulic model.
Simulations were carried out separately in each watershed due to computational limitations. There are numerous regional drainage channels in Tainan City, in addition to underground sewer systems. Geomorphologically, these different elements can also be considered as river systems. A drainage basin receives runoff for a specific topographic region. The basins vary in size from a few km
2 to several hundreds of km
2. ArcGIS software was used to divide the drainage basins based on the DEM characteristics. The drainage basins were corrected according to satellite and aerial images when the auto-division results were biased.
Figure 8 shows the watershed partitions (or delineations) in Tainan City.
3.3.4. Calibration and Validation
Records from historical flood events were used to calibrate and validate the model. The two indicators used to assess the model performance based on the agreement between the model-simulated flood extent and observations are the Probability of Detection (POD) and Scale of Accuracy (SA) indicators:
where
A0 is the simulation flood extent,
Af is the historical flood extent, and
Ac is the overlap between simulated and recorded flood extents. The optimal simulation performance is achieved when both POD and SA approach 100%. The denominator of SA presents the incorrect simulation is considered in the indicator that can be estimated by 100%-SA. Flood simulation is asked by Water Resources Agency of Taiwan to have POD and SA values higher than 60%. To correct the flooded depth, the bias associated with simulated and observed peak flood depths should be lower than 0.2 m.
Four historical flood events caused by typhoons were used for model calibration, and two additional events (one typhoon and one rainstorm) were used for model validation. Manning’s roughness coefficient was the calibration parameter in the model calibration work. This was done via the trial-and-error procedure. The values of Manning coefficients are found to be 0.025 for sewer systems and between 0.027 and 0.032 for drainage systems. The model calibration results shows that the POD is higher than 70% (maximum 88.1% for Typhoon Fanapi flood simulation) and the SA is higher than 60%, see
Table 5.
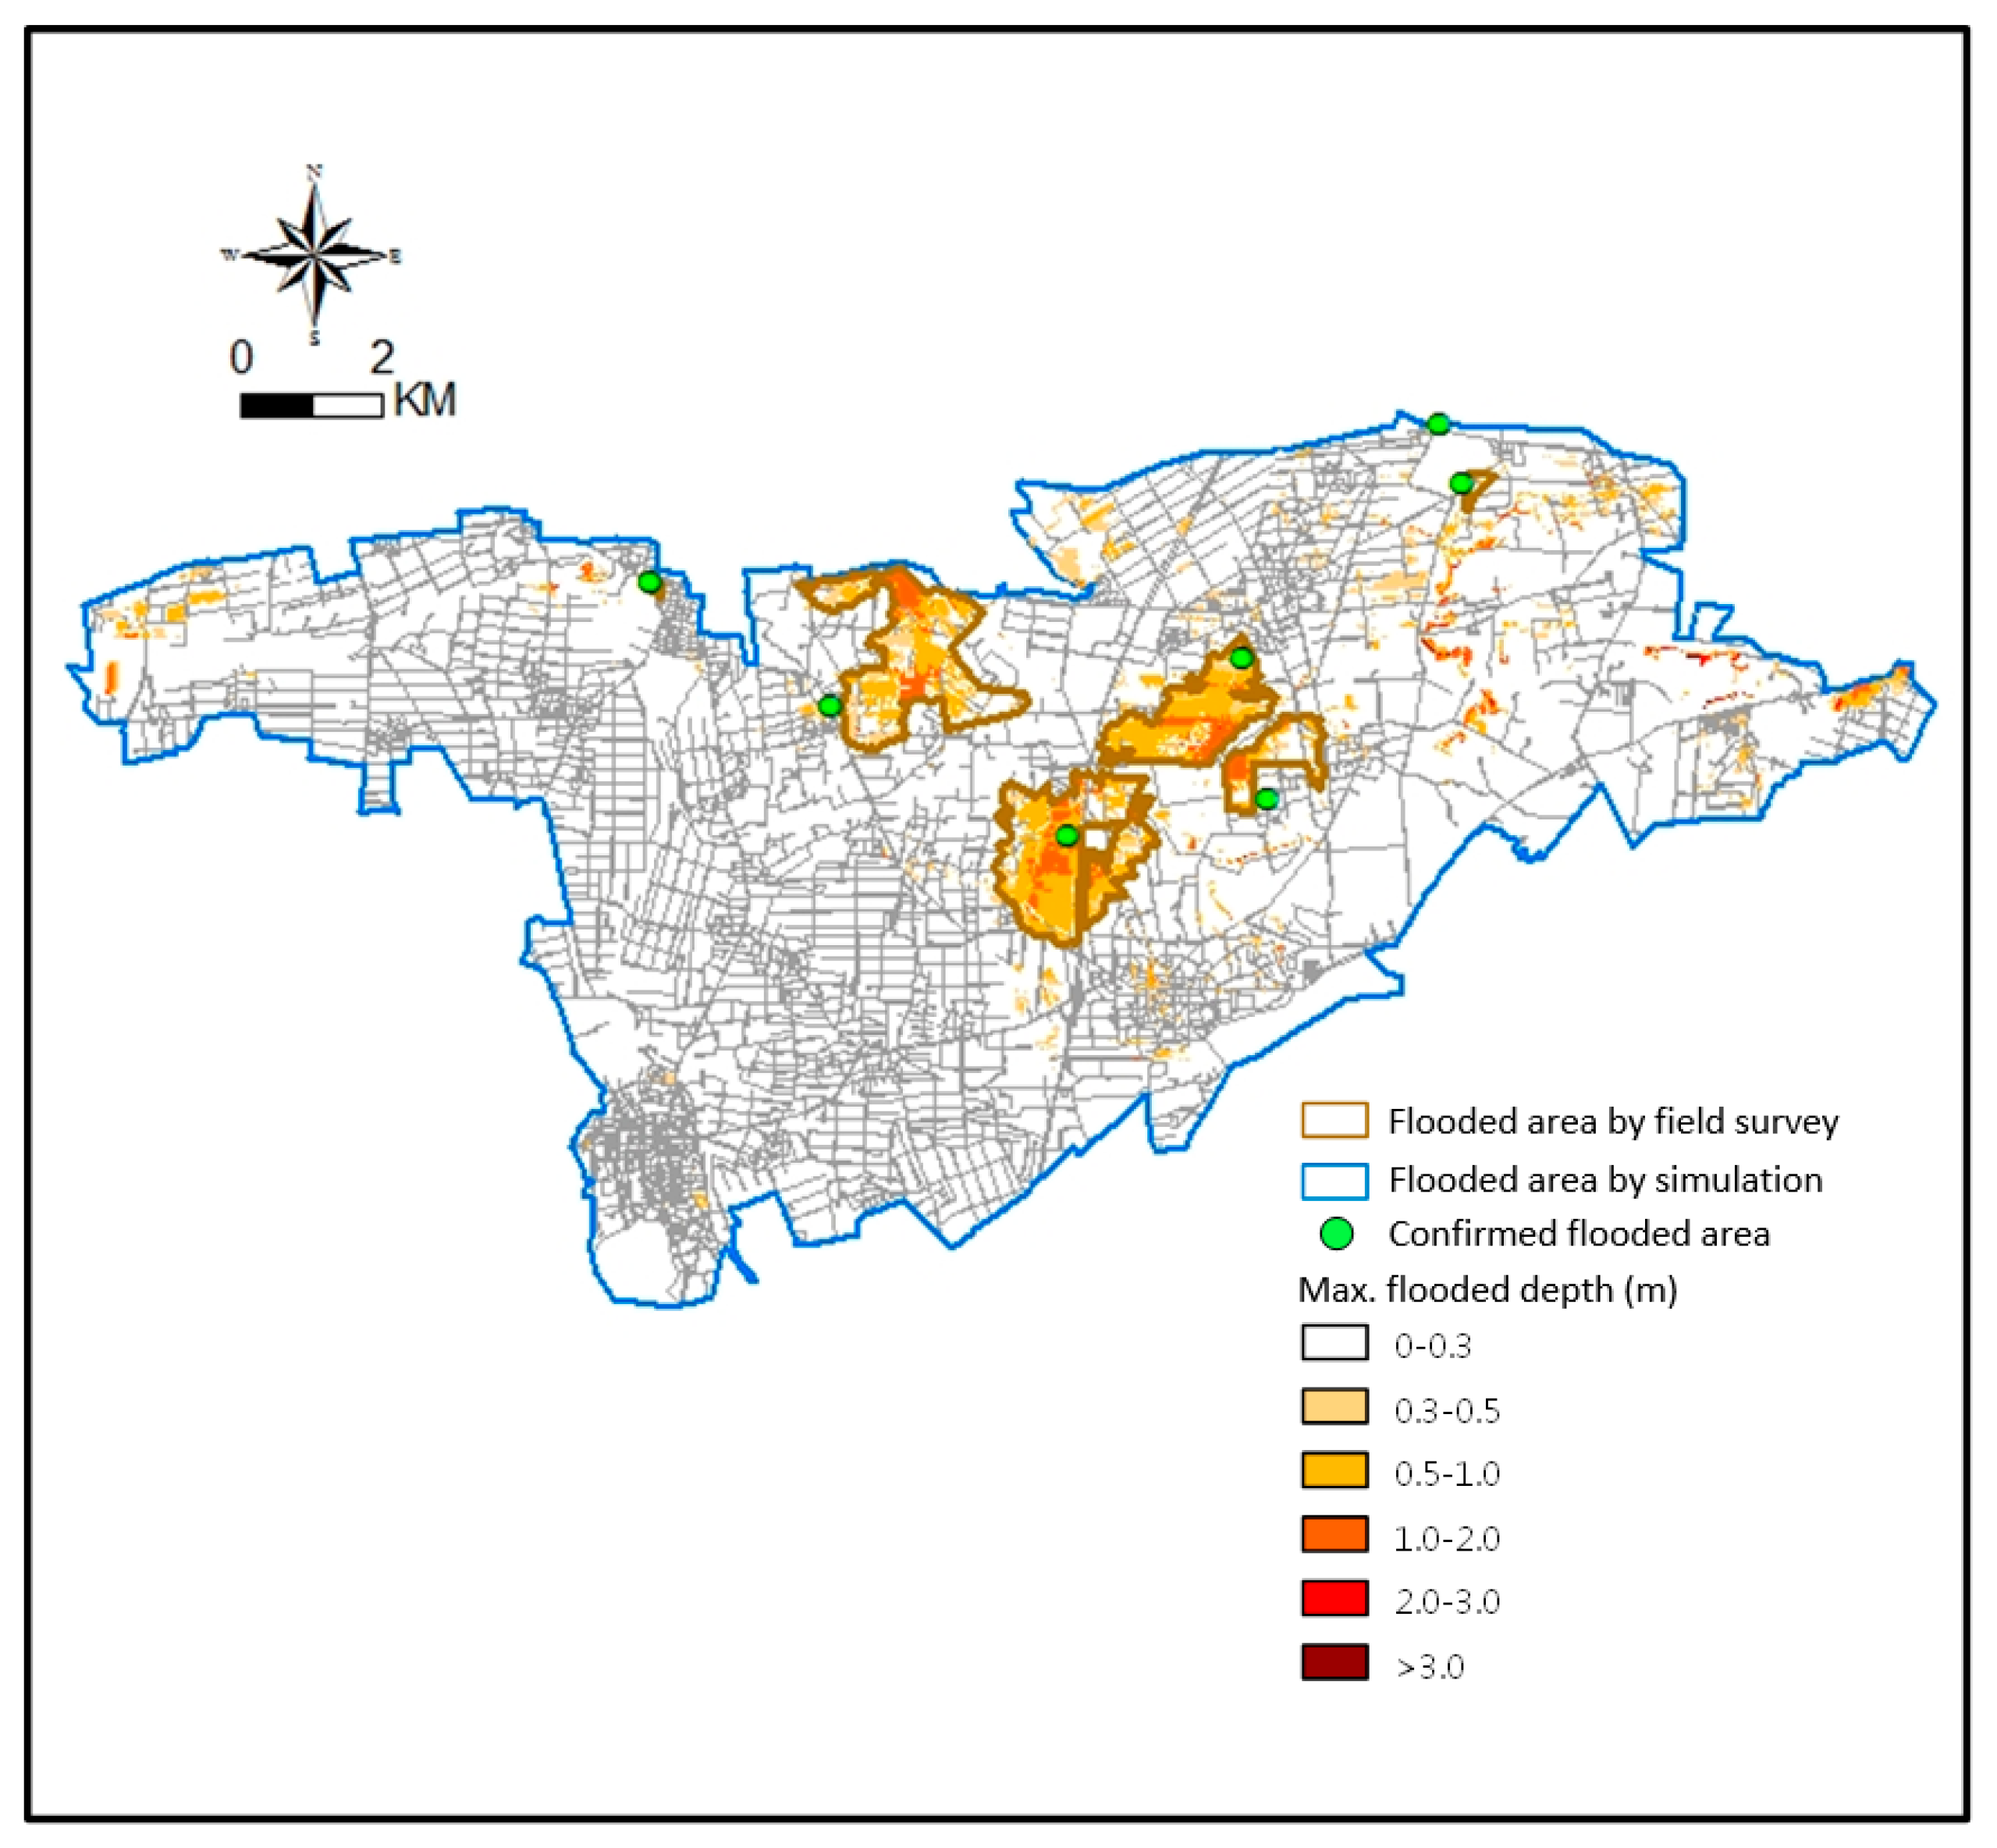
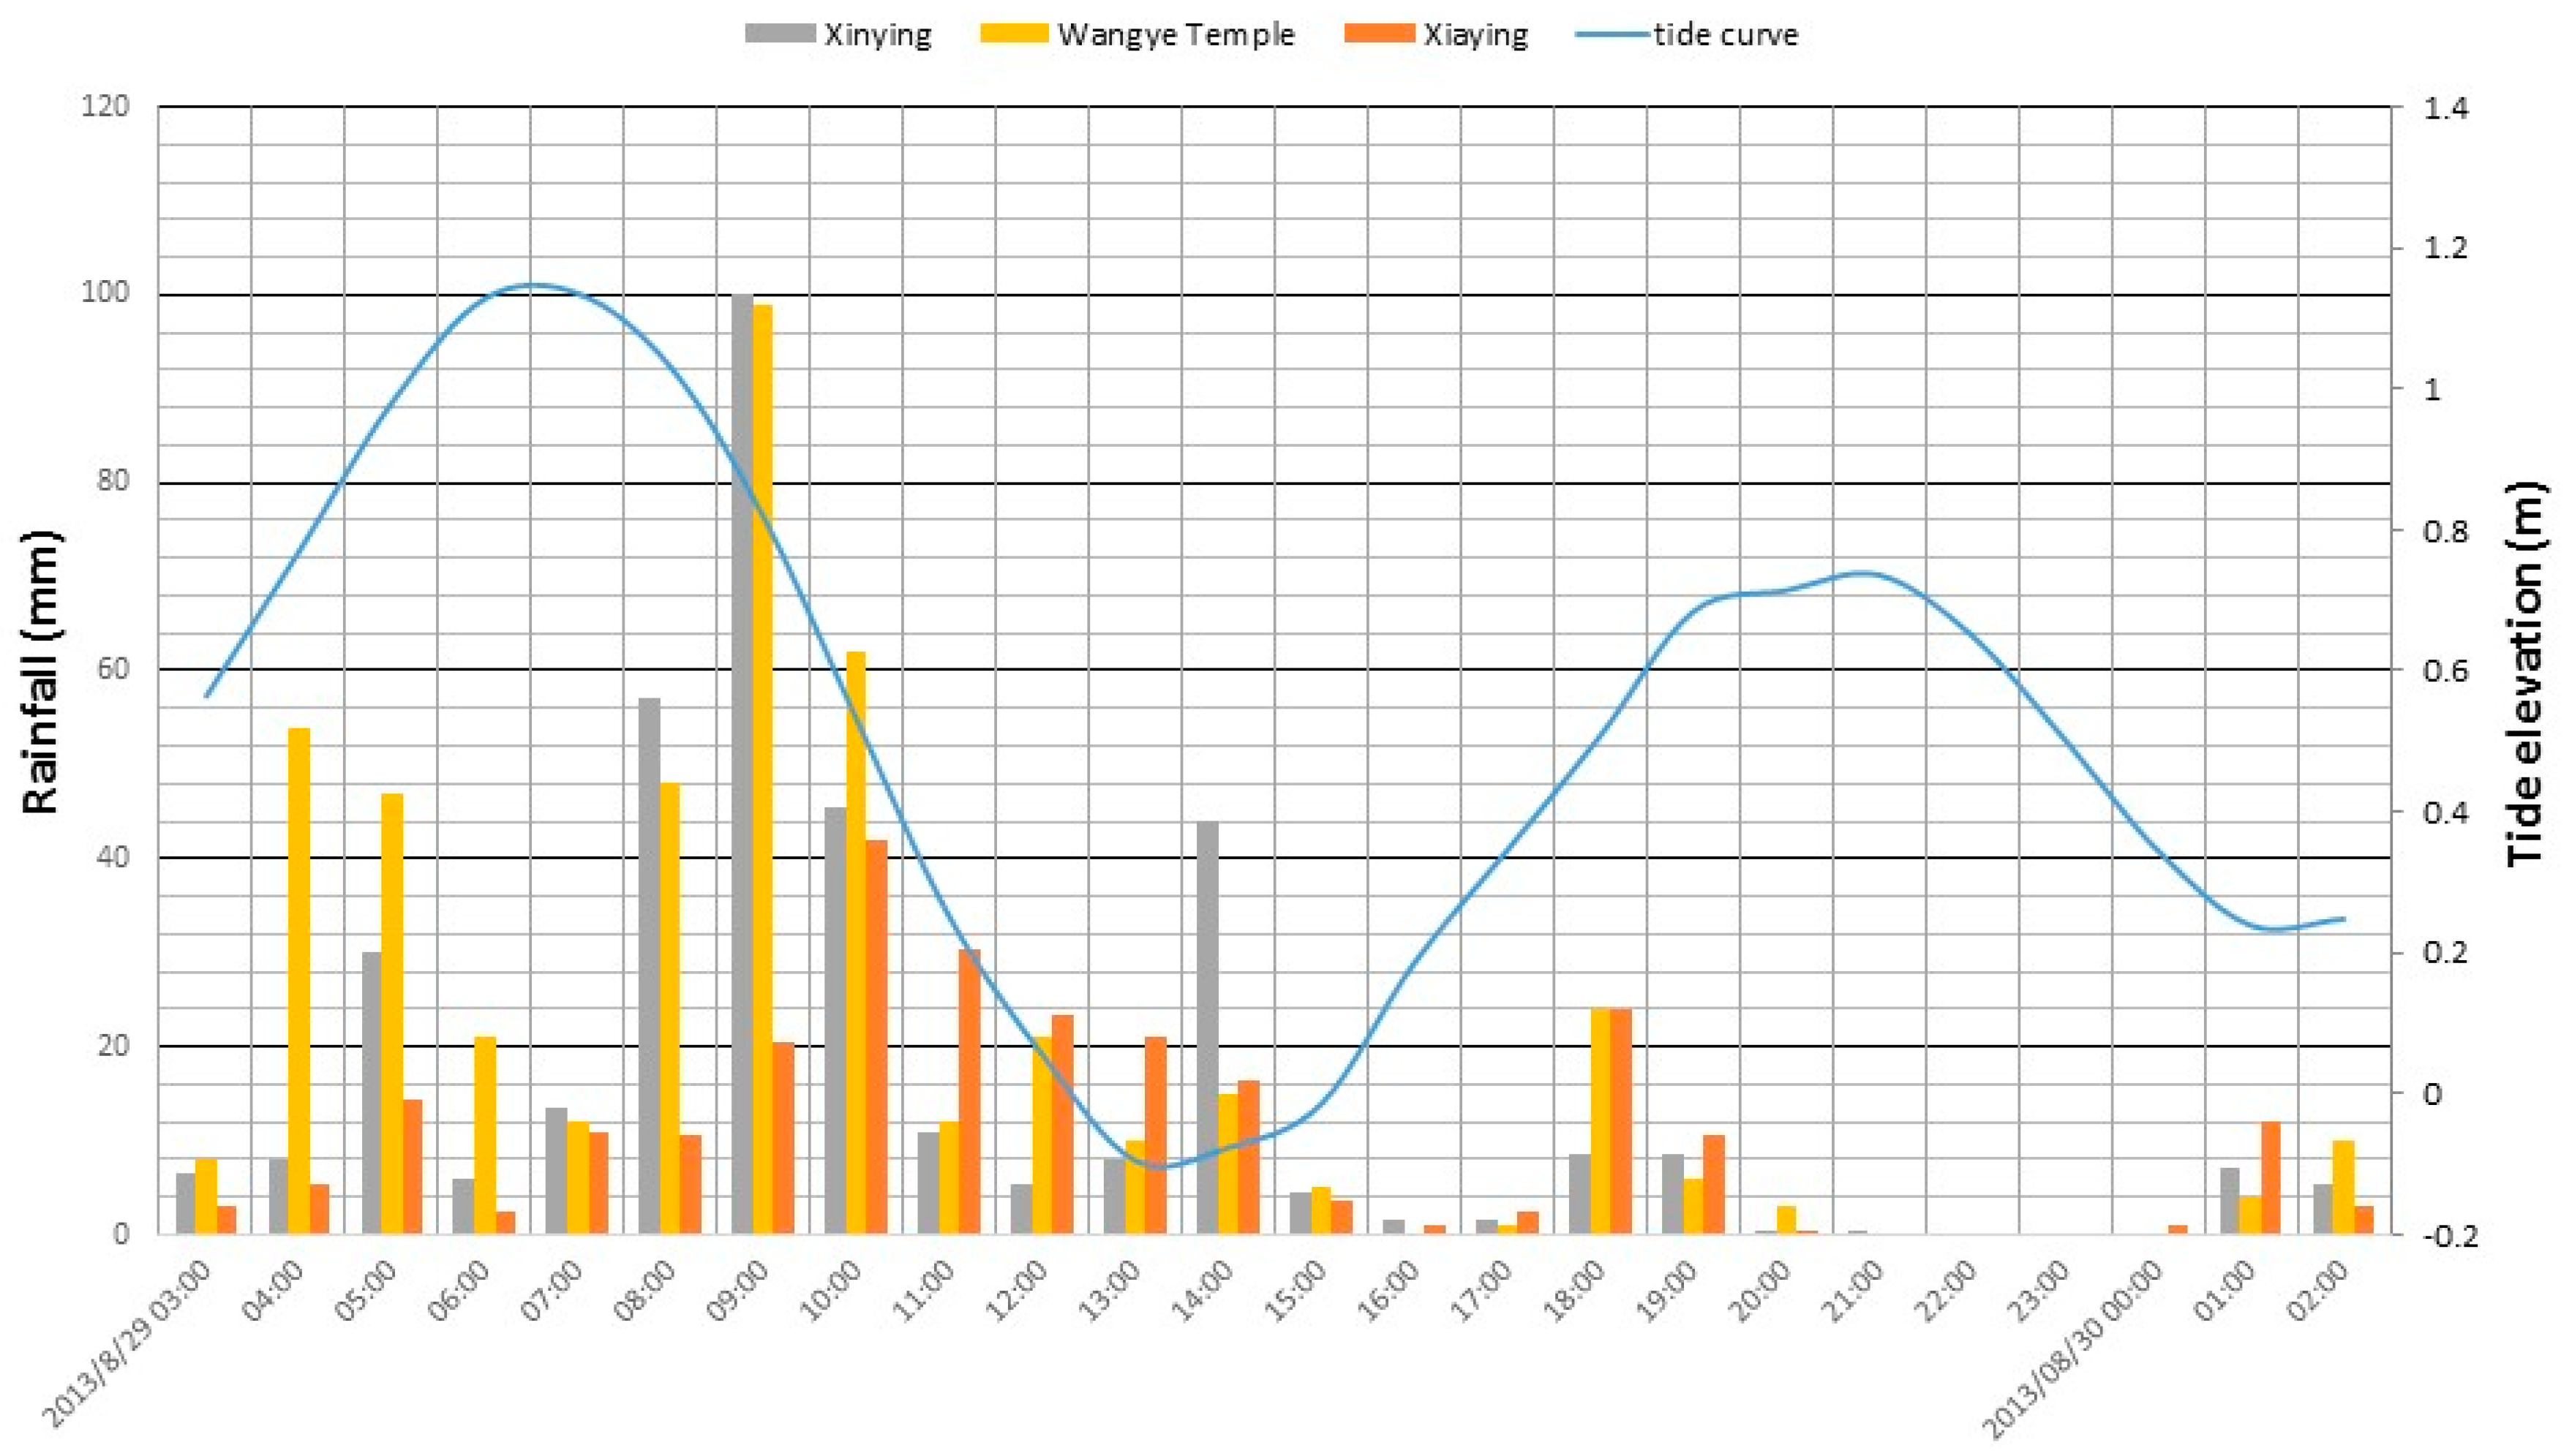
The flood events induced by Typhoon Kongrey (August 2013) and the rainstorm that occurred on 12 August 2014, referred to as rainstorm 0812 henceforth, were used for validation. Typhoon Kongrey caused serious flooding in the Jiangjun watershed, and rainstorm 0812 triggered flooding in the Sanyeh drainage system. The rainfall totals during Typhoon Kongrey at three stations from upstream to downstream on the Jiangjun River are shown in
Figure 9 with corresponding tidal elevation. The maximum three-day rainfall depth is 636 mm, and the maximum hourly rainfall intensity is 100 mm/h. The simulated flood extent and depth during Typhoon Kongrey are shown in
Figure 10.
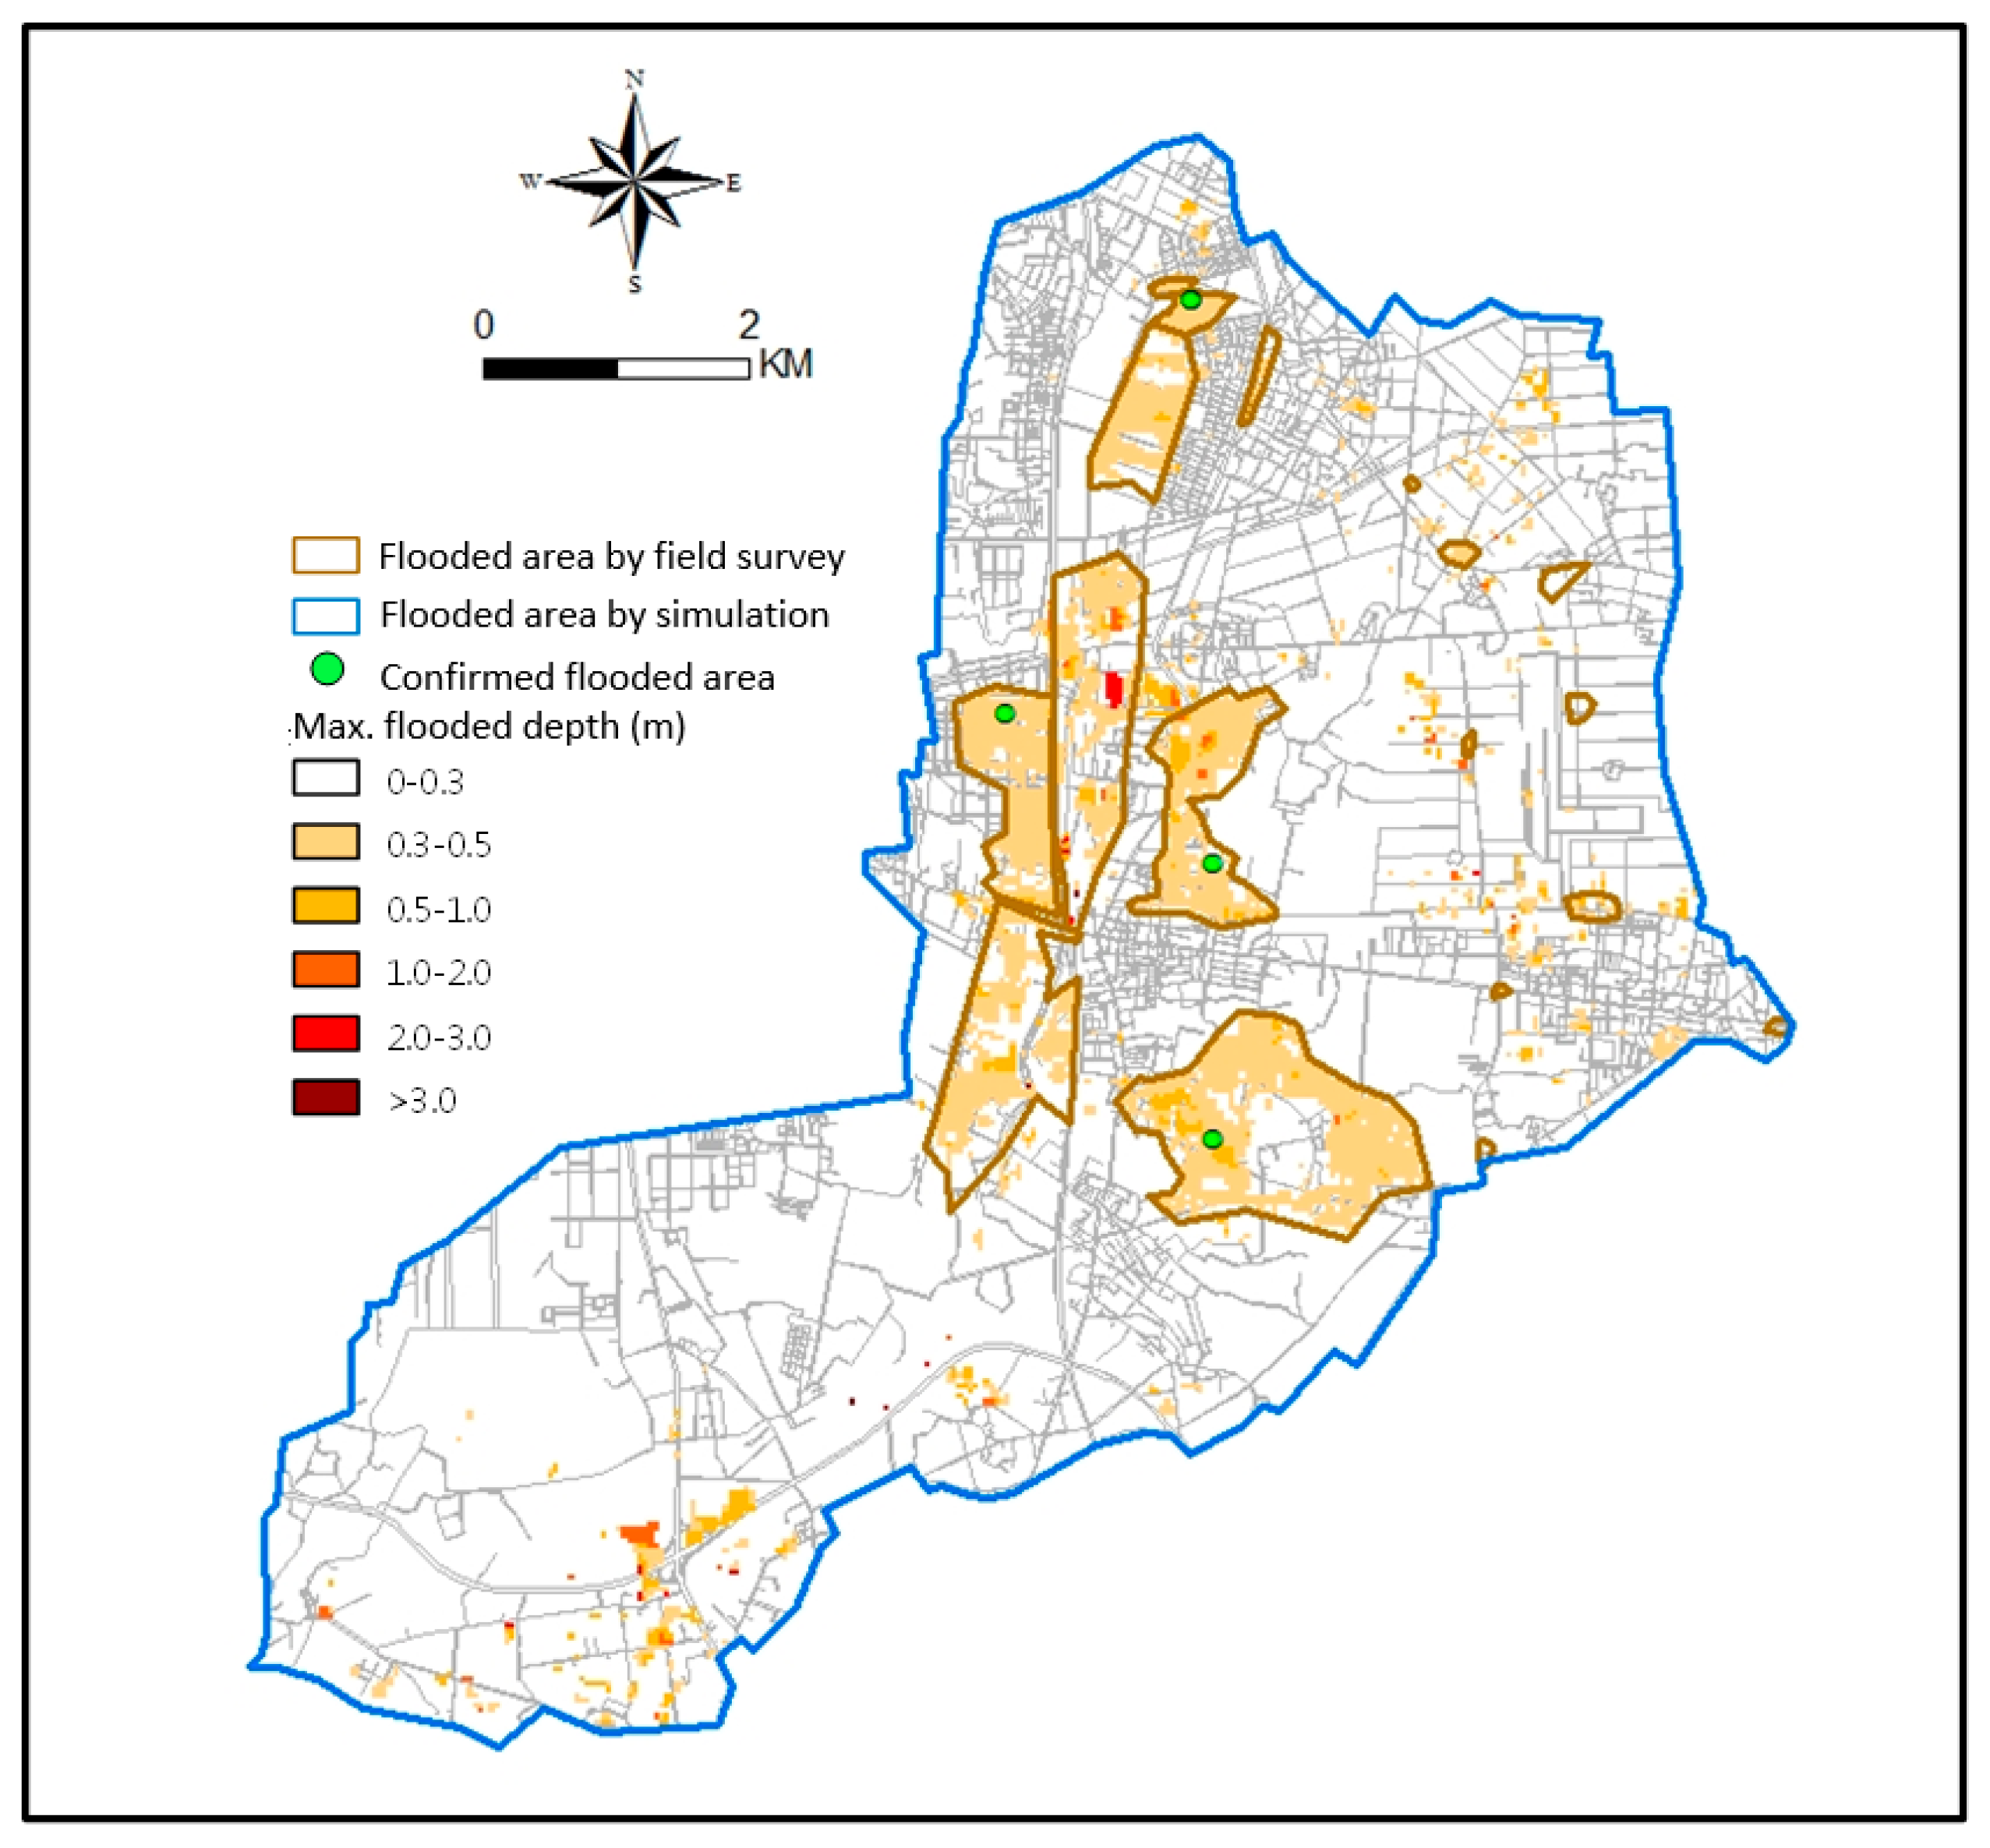
Figure 11 shows another validation event in the Sanyeh drainage system. The flood conditions determined by field investigations are shown in the figures. The maximum flood depths are 2.41 m and 4.4 m in the events, respectively.
Table 5 shows the performance of validation. The results suggest that the POD is 75% and SA is 62% in the Jiangjun watershed flood simulation during Typhoon Kongrey. Additionally, the POD and SA were 83% and 68%, respectively, for the flood simulation in the Sanyeh drainage system during rainstorm 0812. This quantitative assessment is satisfactory, however, we will try to improve further it in the subsequent work.
There are at least three potential causes of bias in flood simulations. Firstly, the historical flood surveys do not fully reflect the actual conditions. The weather during flood events was not always permitting the use of satellite and aerial imaging. Additionally, surveys implemented after peak flood times may not have recorded the correct extents and depths, and dictations from local residents are subjective, diverse and have high degrees of uncertainty. Secondly, the sewer system data have a degree of uncertainty. Furthermore, rapid changes in the developments and land use represent another cause of uncertainty. Thirdly, there is a degree of uncertainty due to simplified model physics. Due to the abovementioned uncertainties, flood model simulations for which POD or SA values were higher than 60% were considered acceptable.
3.4. Flood Inundation Maps
FIMs are designed to represent the possible flood conditions under various rainfall scenarios. Two types of rainfall scenarios were assumed: one with topography-based cumulative rainfall (CR) and the other with periodic rainfall (PR). Topography-based cumulative rainfall assigns rainfall amounts for various rainfall durations, but the amounts depend on topography. The rainfall amount in highland areas is 2.1 times higher than in the low-lying areas. The type of periodic rainfall is based on rainfalls of several return periods for various durations. Thirty-four scenarios consisting of quantitative and periodic rainfalls were assumed. To consider the effect of the sea, another eight scenarios with simultaneous rainfall and storm surge events were assumed for various return periods and 24-h durations. In total, 42 scenarios were used to produce the FIMs in the present work. These scenarios are given in
Table 6.
FIMs are designed to be exported as high-resolution, low-compression digital images such as TIFF or JPG formats. An FIM is printed on an A0 size (841 × 1189 mm) poster.
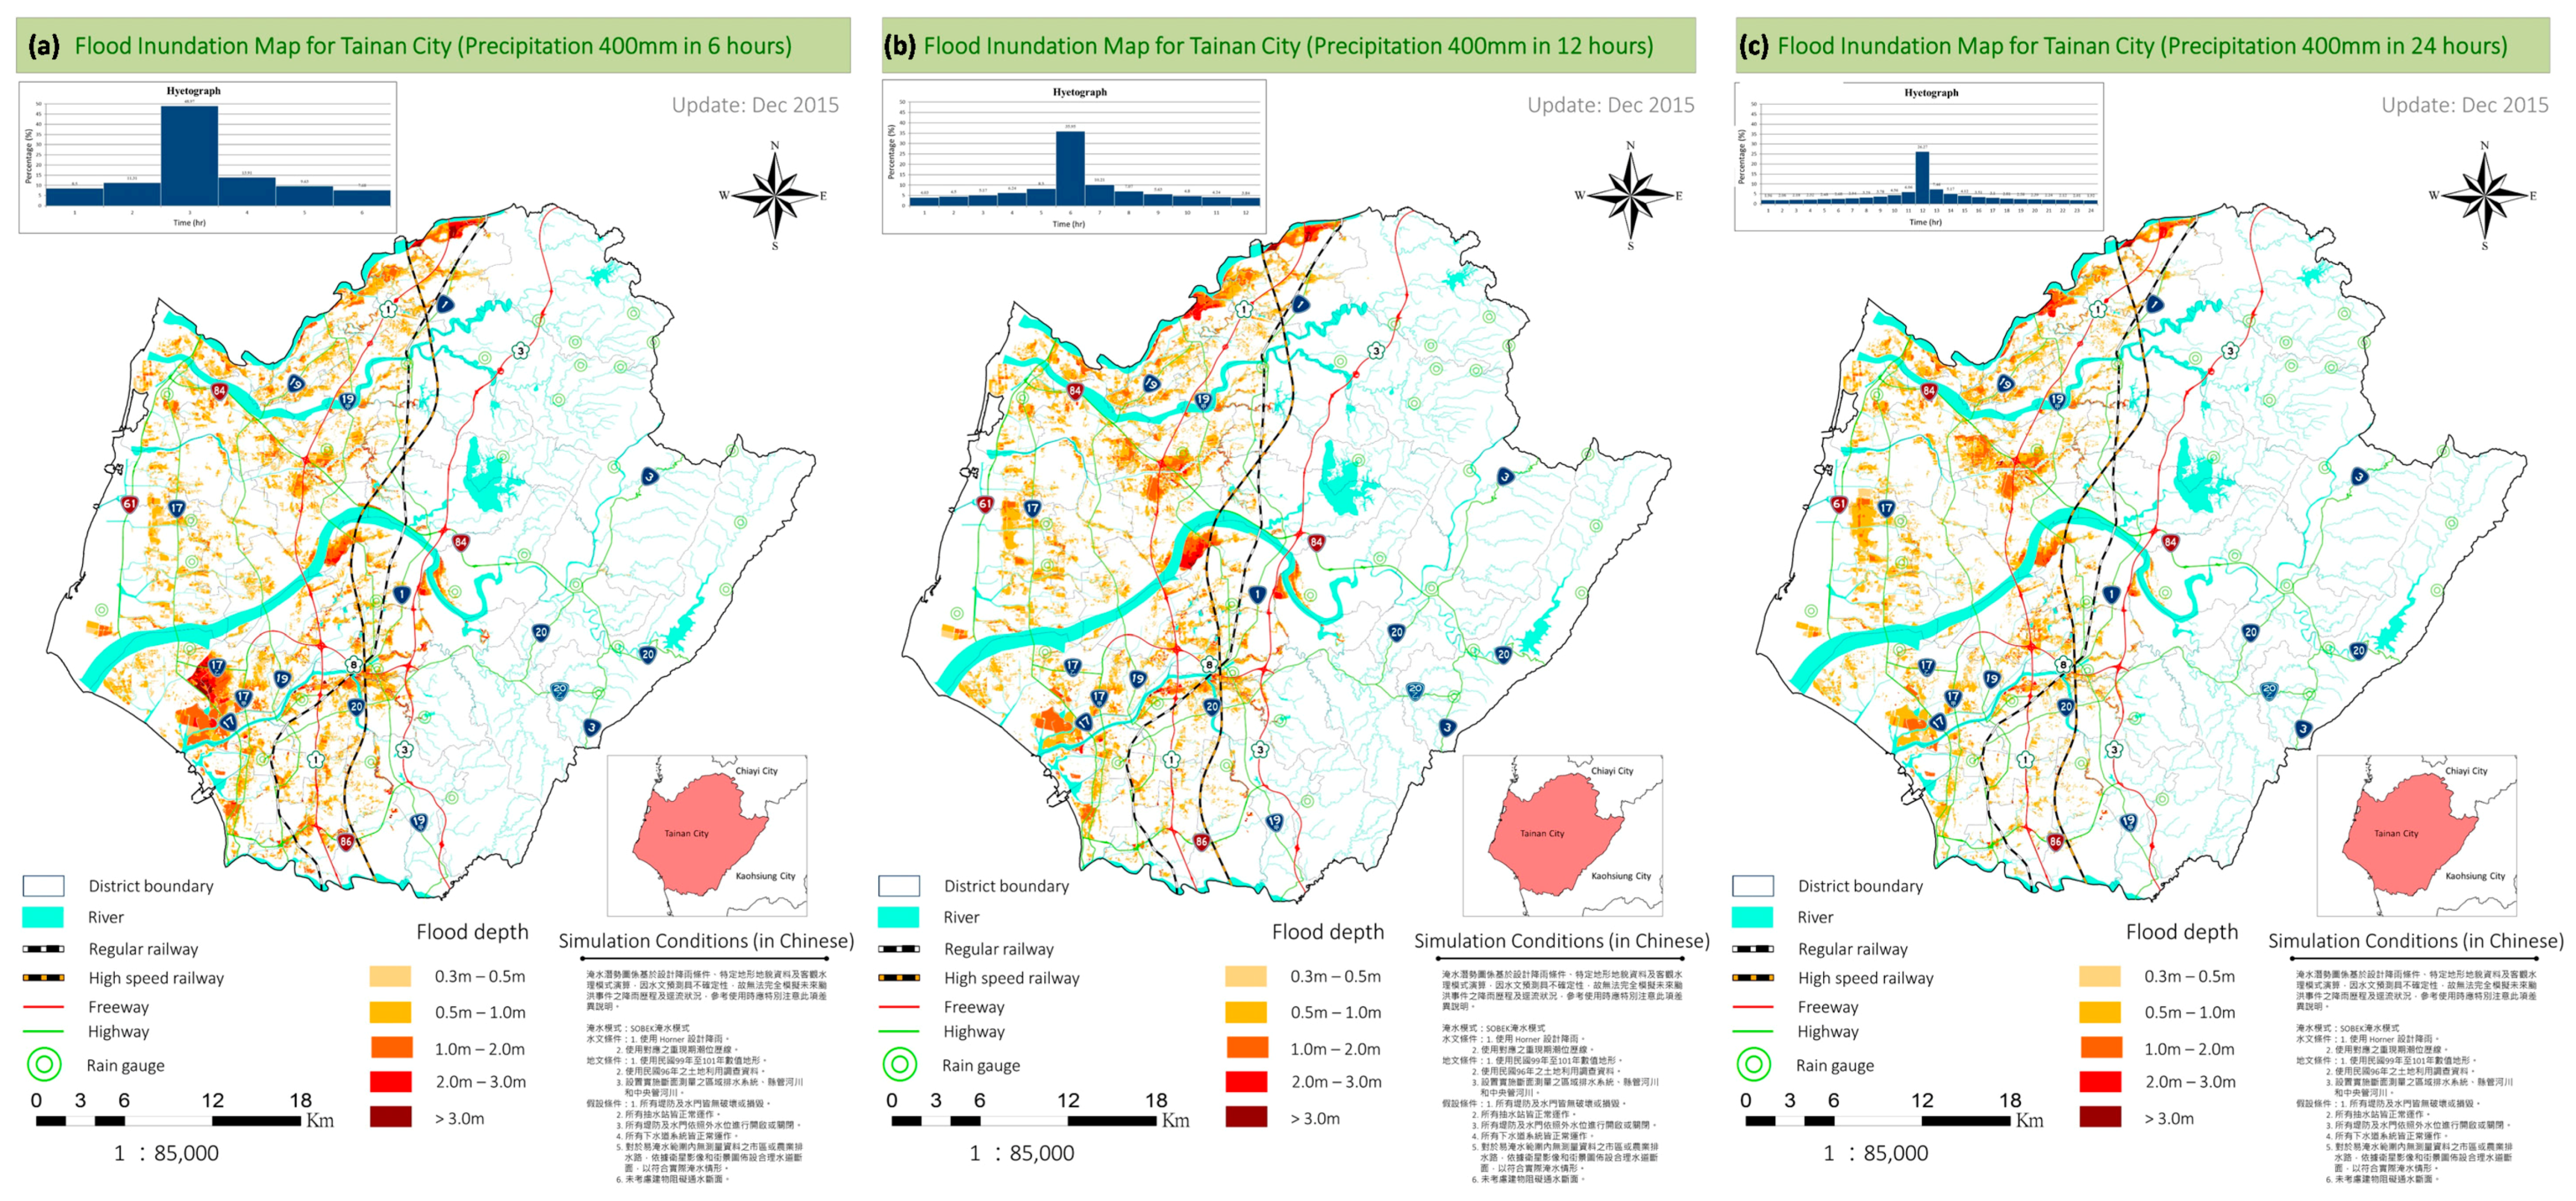
Figure 12 shows the FIMs for a cumulative rainfall of 400 mm and durations of 6, 12, and 24 h. The maximum flood depth for a rainfall of 400 mm in 6 h (scenario code CR-6-400) is higher than 3 m in Annan District (between the Tsengwen and Yensui Rivers). The total flooded area of scenario CR-6-400 is 1.73 times that of CR-24-400. However, the flood induced by scenario CR-6-400 is only 1.26 times that of CR-6-100. Therefore, the rainfall intensity is a more influential factor than the total rainfall amount.
Furthermore, the tide level was found to have an important influence on flood simulations, especially in the low-lying areas (elevation < 2 m). When the sea surface reaches the high tide phase, flooding in the low-lying areas of Tainan City is significant, especially in the old Tainan City areas, regardless of the rainfall intensity or depth. When the rainfall intensity increases (for example, in CR-6-200, CR-12-450, and CR-24-650), the flooding increases from elevation 2 m to 5 m in some areas.
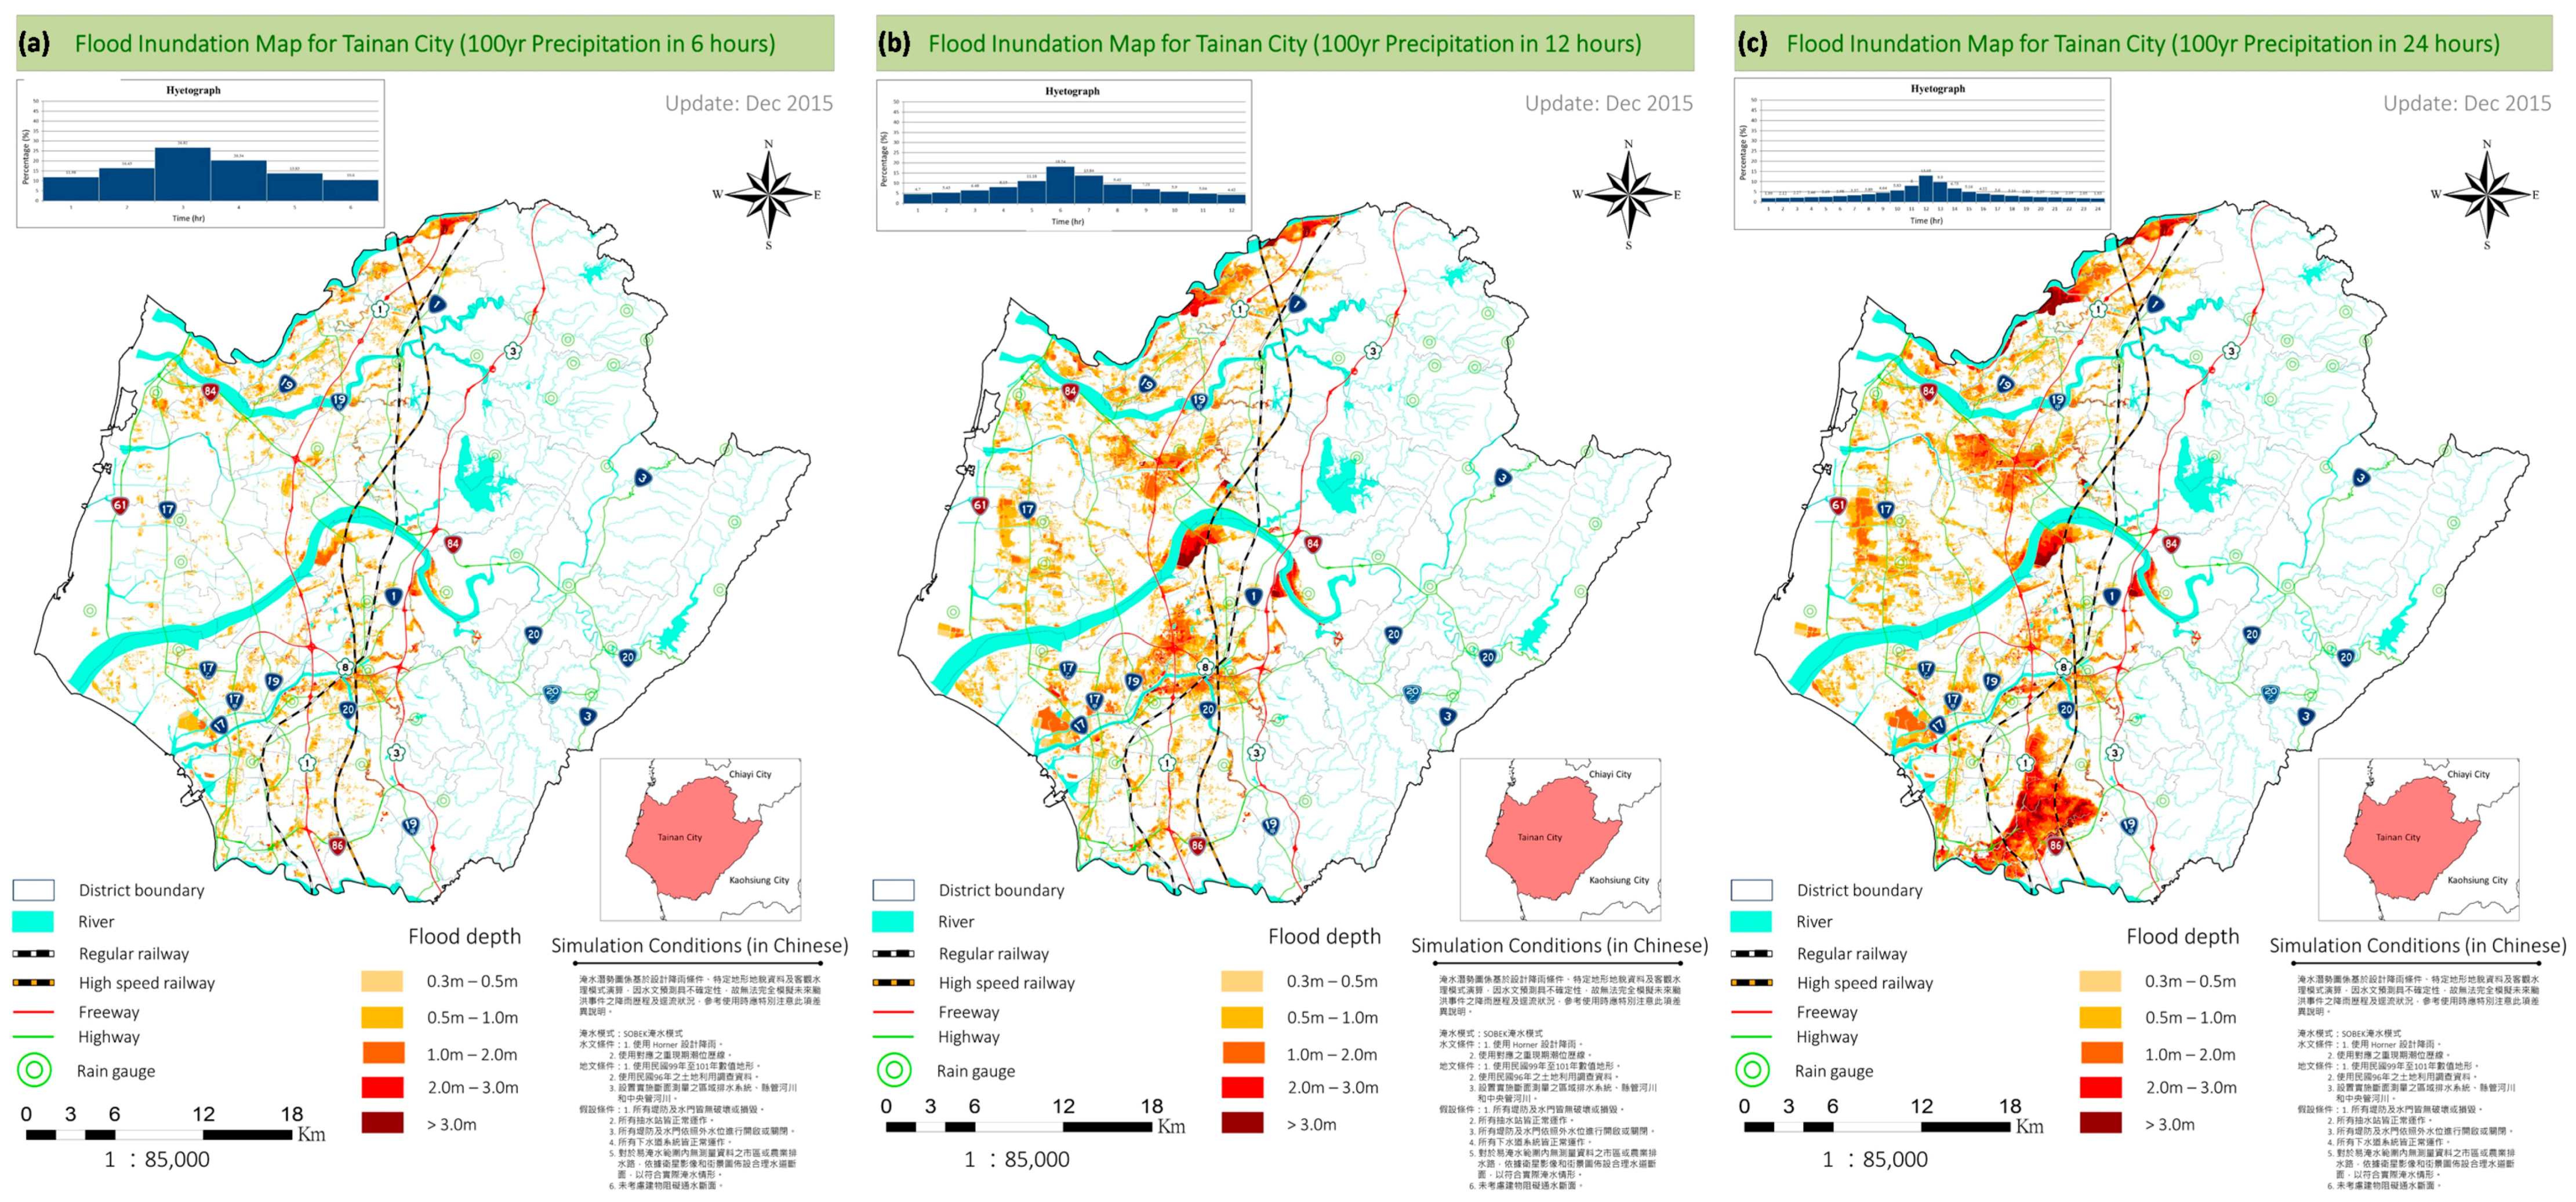
Figure 13 shows the FIMs with 100-year rainfall and durations of 6, 12, and 24 h. These rainfall scenarios with different return periods are similar to those of cumulative rainfall, but they are presented differently to satisfy different requirements. Flooding began to occur in the coastal area (elevation < 1 m) for low-intensity rainfall events such as PR-12-2 or PR-24-5. The flooding is due to low-lying land in the coastal area. When the rainfall intensity increases, such as in scenarios PR-6-2 and PR-12-10, the flood extent expands due to the influence of low-lying areas. However, when the rainfall intensity increases, such as in scenarios PR-6-10, PR-12-50, and PR-24-100, the flood extent reaches elevation > 10 m in some areas because the river discharge capability decreases due to tidal chokage.
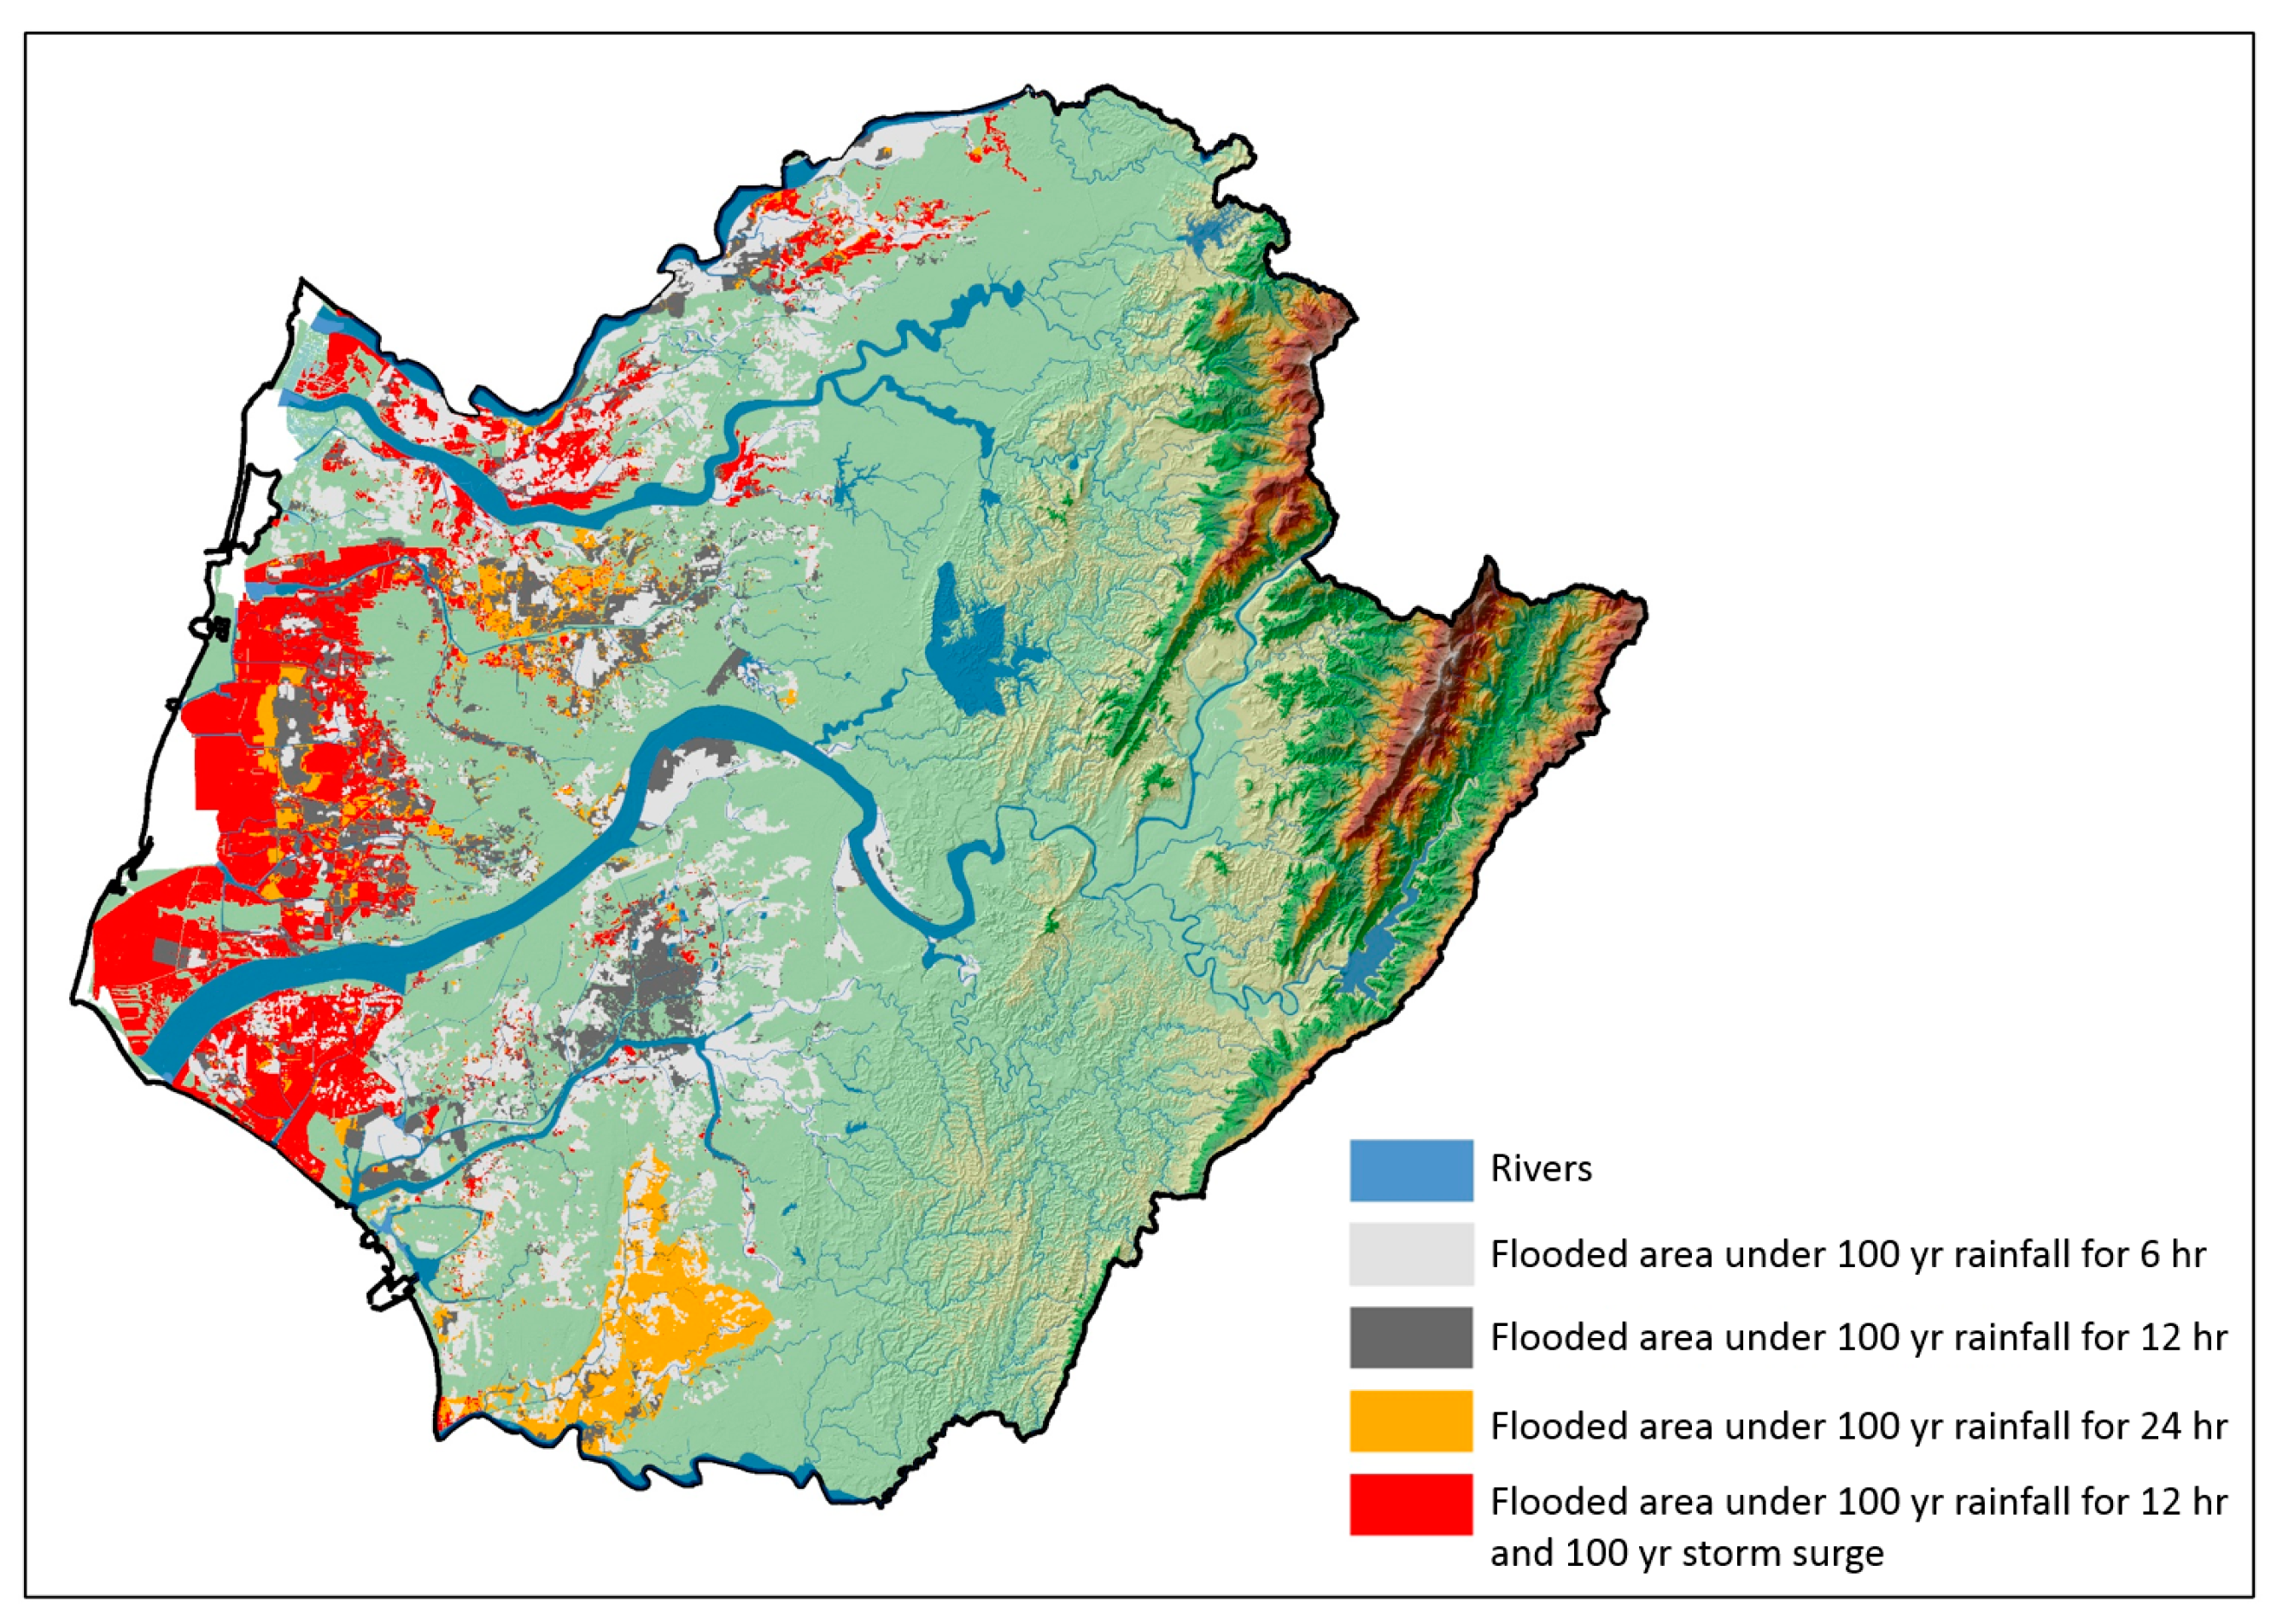
Figure 14 shows the results of various scenarios. The flood extents of a 100-year rainfall event for durations of 6, 12 and 24 h (scenario codes PR-6-100, PR-12-100 and PR-24-100) are overlapped, as is the influence of the storm surge (PR-24-100S). The most extreme scenario (100-year rainfall for 24 h) triggered severe floods, especially in the southern Tainan region (
Figure 13c); however, the storm surge considerably affected low-lying areas in the western part of Tainan City.
3.5. Non-Technical Improvement
In additional to technical development, non-technical improvement on the FIM is possible, i.e., the stakeholder engagement. Two stakeholder meetings were held in the developing process. One was held during the model simulation stage, and the other was held when the FIMs were produced. The participants of both meetings included FIM producers (the Water Resources Agency of the central government), groups that provided FIM development and technical support (university professors), first-line managers (water resource bureaus in local city governments), and public users (local residents). The objective of the first meeting was to decrease the uncertainty in records of historical flood events based on inputs from local residents and their memories/perceptions and personal records. The purpose of the second meeting was to educate the first-line managers and local residents regarding the conditions, results and uncertainty of FIMs. Additionally, that meeting provided information on web search systems, and users provided feedback to improve the FIMs.
4. Conclusions
The present paper describes the development of third-generation FIMs at the city scale. Unlike numerous studies that have focused on an urban area or a village scale, this study simulates a large city with a population of 1.8 million encompassing an area of 2200 km2 and consisting of six large watersheds and 3162 sub-watersheds. Substantial amounts of data were collected, with particular efforts devoted on measuring artificial open channel regional drainage systems. The 1D/2D coupled model SOBEK was used for flood simulations. The indicator POD (Probability of Detection) was found to be up to 88.1% for flood simulation in Typhoon Fanapi. Another indicator SA (Scale of Accuracy) was found to be up to 68% in 0812 rainstorm flood simulation. Values above this threshold were treated as satisfactory, which was in accordance with the standard defined by the Water Resources Agency of Taiwan. The inundation map database is able to generate approximate results quickly based on a forecasted cumulative rainfall that can be obtained few days in advance of the hazardous event. This capability enables a quick (second scale) view of potential flooding in support of initial decision making activities. The same maps can also be used for land use planning, development analysis, insurance applications, and retreatment strategy preparation. A flood warning system that combines real-time observations and numerical models is undoubtedly necessary in order to produce accurate forecasts. However, the associated computations may require considerable time (hours) and efforts, which makes the use of numerical models very challenging. Hence, the use of FIMs plays an important role in flood risk management applications.
In total, forty-two scenarios were used in the development of FIMs in the Tainan City. In the present work it was found that the rainfall intensity affects flood conditions more than the accumulative rainfall depth. The tidal phase is another important factor associated with the flooding scale, in the low-lying areas in Tainan City. Areas with elevation less than 1 m are frequently flooded during the high tide phase no matter how high is the scale of the rainfall intensity and depth. Storm surges are the third key factor that influences flooding in the coastal area of Tainan City. The study revealed that the extreme scenario (100-year rainfall for 24 h) would cause severe flooding in the western Tainan. It was found that one-third of the entire Tainan City would be flooded under this extreme scenario.
The third-generation FIMs presented in this paper are based on various scenarios of high-intensity rainfall data. The third-generation of FIMs represents an improvement from the previous generation of FIMs and as such it will supersede the previous maps.


