Article

Plankton Community Stability and Its Relationship with Phytoplankton Species Richness in Lake Nansihu, China

Research Center for Engineering Ecology and Nonlinear Science, North China Electric Power University, Beijing 102206, China
*
Author to whom correspondence should be addressed.
Water 2016, 8(10), 454; https://doi.org/10.3390/w8100454
Submission received: 17 May 2016 / Revised: 3 October 2016 / Accepted: 12 October 2016 / Published: 14 October 2016

Abstract

:
The relationship between biodiversity and ecosystem functioning is a central issue in ecology. The insurance hypothesis suggests that biodiversity could improve community productivity and reduce the temporal variability of main ecosystem processes. In the present study, we used a plankton community that was investigated from 2011 to 2014 in Lake Nansihu to test this hypothesis and explore the mechanisms involved. As a result, 138 phytoplankton and 76 zooplankton species were identified in the lake, and their biomasses showed apparent seasonal variations. The average temporal stability index of zooplankton taxa was significantly higher than that of phytoplankton. Complex relationships were observed between the species richness and temporal stability of different phytoplankton taxa: a unimodal relationship for both Cyanophyta and Bacillariophyta; a strong concave relationship for Euglenophyta; and no apparent relationship for both Chlorophyta and total phytoplankton. These relationships were primarily controlled by the portfolio effect; while the effects of overyielding and species asynchrony were relatively weak. Phytoplankton species richness had a significant positive influence on the temporal stability indices of protozoa, Rotifera and total zooplankton, while its influence on Cladocera and copepods was not significant. The dominant mechanisms were found to be ‘trophic overyielding’ and a weak ‘trophic portfolio effect’; however, ‘trophic species asynchrony’ played a minor role. These results demonstrated that the effects of diversity on community stability can be complex in natural ecosystems. In addition, the diversity of phytoplankton not only influenced its own temporal stability, but also affected the stability of zooplankton through trophic interactions.

1. Introduction

A high level of biodiversity loss is occurring due to global climate change and human activities [1]. The rapid loss of biodiversity has generated great concerns about the influence of diversity on main ecosystem processes, such as productivity and stability [1,2,3,4]. Aquatic ecosystems are unique, and the stabilization of their main organisms, phytoplankton and zooplankton, has been found to be influenced by variations in producer diversity [5,6]. Thus, studies on the diversity-stability relationship in plankton communities are essential to developing appropriate conservation strategies in aquatic ecosystems [7,8].
Ecosystem stability is multidimensional and contains a wide range of components, such as variability, resistance, resilience, persistence and robustness [1,9,10,11]. These aspects of stability may respond differently to variations in diversity caused by extinction or invasion [9,10,11]. Among all of these measures of stability, temporal stability is an important one and has drawn much attention [12,13,14,15]. The potential underlying mechanisms of the diversity-stability relationship include overyielding, the portfolio effect and species asynchrony [12,16,17,18,19,20,21]. Yachi and Loreau [22] found that species richness could stabilize ecosystem productivity by increasing the temporal mean and decreasing the temporal variance of productivity in a fluctuating environment. Most previous studies have suggested a positive relationship between diversity and stability at the community level (the insurance hypothesis), although a few reports have shown opposing results [10,12,23]. Tilman and Downing [24] described that plant diversity had a positive influence on stability (measured as resistance to drought) in a long-term study of grasslands. However, Dodd et al. [25] observed no relationship between species richness and the temporal stability of community biomass in a plant community. Previous studies based on artificial plankton communities in the laboratory have shown positive diversity-stability relationships [26]. Corcoran and Boeing [27] found that phytoplankton temporal stability increased with increasing diversity. McGrady-Steed et al. [28] suggested that aquatic microbial communities with higher diversity were more stable (measured as predictability). There were also experimental studies showing neutral or even negative relationships between phytoplankton diversity and stability [16,29]. Gonzalez and Descamps-Julien [16] observed no relationship between species richness and biomass stability in an artificial algae community. Moreover, field investigations conducted over the past few years have shown conflicting diversity-stability relationships in plankton communities [5,6]. Ptacnik et al. [5] reported that there was a negative relationship between phytoplankton species richness and community turnover. Conversely, Filstrup et al. [6] found a positive relationship between phytoplankton diversity and community turnover. Shurin et al. [30] suggested that compositional stability in zooplankton communities showed strong relationships with diversity, varying from positive within a biogeographical region to negative across a latitudinal gradient. According to the above analyses, the relationship between plankton diversity and community stability is complex, and a consistent conclusion has not been derived.
Producer diversity not only has impacts on its own trophic level, but also may have an impact on consumer communities through trophic interactions [31,32]. It has been reported that in the terrestrial ecosystems, the grazing impact of the consumer would be reduced at high producer diversity [33,34,35]. The ‘enemies hypothesis’ and ‘variance in edibility hypothesis’ were the main mechanisms proposed [33,34,35]. In aquatic ecosystems, ecologists have found that phytoplankton diversity promotes zooplankton abundance, and this effect was summarized as ‘trophic overyielding’ [32]. Filstrup et al. [6] discovered that higher phytoplankton diversity would result in a higher zooplankton resource use efficiency. Hillebrand and Cardinale [36] found that zooplankton effects tended to decrease as the diversity of a prey assemblage increases. However, until recently, the influence of phytoplankton diversity on the stability of zooplankton and the underlying mechanisms remained unclear. In addition, both phytoplankton and zooplankton are complex in taxonomic composition, and these groups have their own ecophysiological traits [18,37]. It remains unknown whether the temporal stability of these plankton taxa responds similarly to variations in diversity.
Lake Nansihu is the largest freshwater lake in North China. It is also an important water delivery channel and storage lake of the great South-to-North Water Diversion Project in China. There have been great variations in the plankton community and water quality in Lake Nansihu during the past few decades. In the early 1980s, the lake was in a healthy state, containing 116 phytoplankton genera and 249 zooplankton species [38,39,40]. At that time, Cryptophyta and Bacillariophyta were the dominant taxa [39]. In the subsequent years, a large amount of external untreated wastewater and agricultural runoff flowed into the lake [38,39]. In 2002, the lake was in a heavy eutrophic state, containing only 36 phytoplankton species and 28 zooplankton species [40]. These situations were changed in 2002, when a series of measures was implemented to improve the water quality and ecological conditions of the lake. As a result, 86 phytoplankton species and 52 zooplankton species were reported in 2007 [40]. The annual average concentrations of total nitrogen (TN) and total phosphorus (TP) decreased to 1.01 mg/L and 0.09 mg/L, respectively, in 2010 [41]. Lake Nansihu is now in a meso-eutrophic state, and the main risk to the lake ecosystem is algae blooms [42]. Thus, the lake provides a natural laboratory for deeply analyzing the diversity-stability relationship in the plankton community and testing of the insurance hypothesis.
In the present study, phytoplankton and zooplankton communities were investigated and measured seasonally from 2011 to 2014 in Lake Nansihu. The influence of phytoplankton diversity (measured as species richness) on the stability (temporal stability, calculated as the coefficient of variance) of different phytoplankton and zooplankton taxa was analyzed. The purpose of the present study was to explore the effects of phytoplankton diversity on community stability and characterize the underlying mechanisms in a natural ecosystem.

2. Materials and Methods
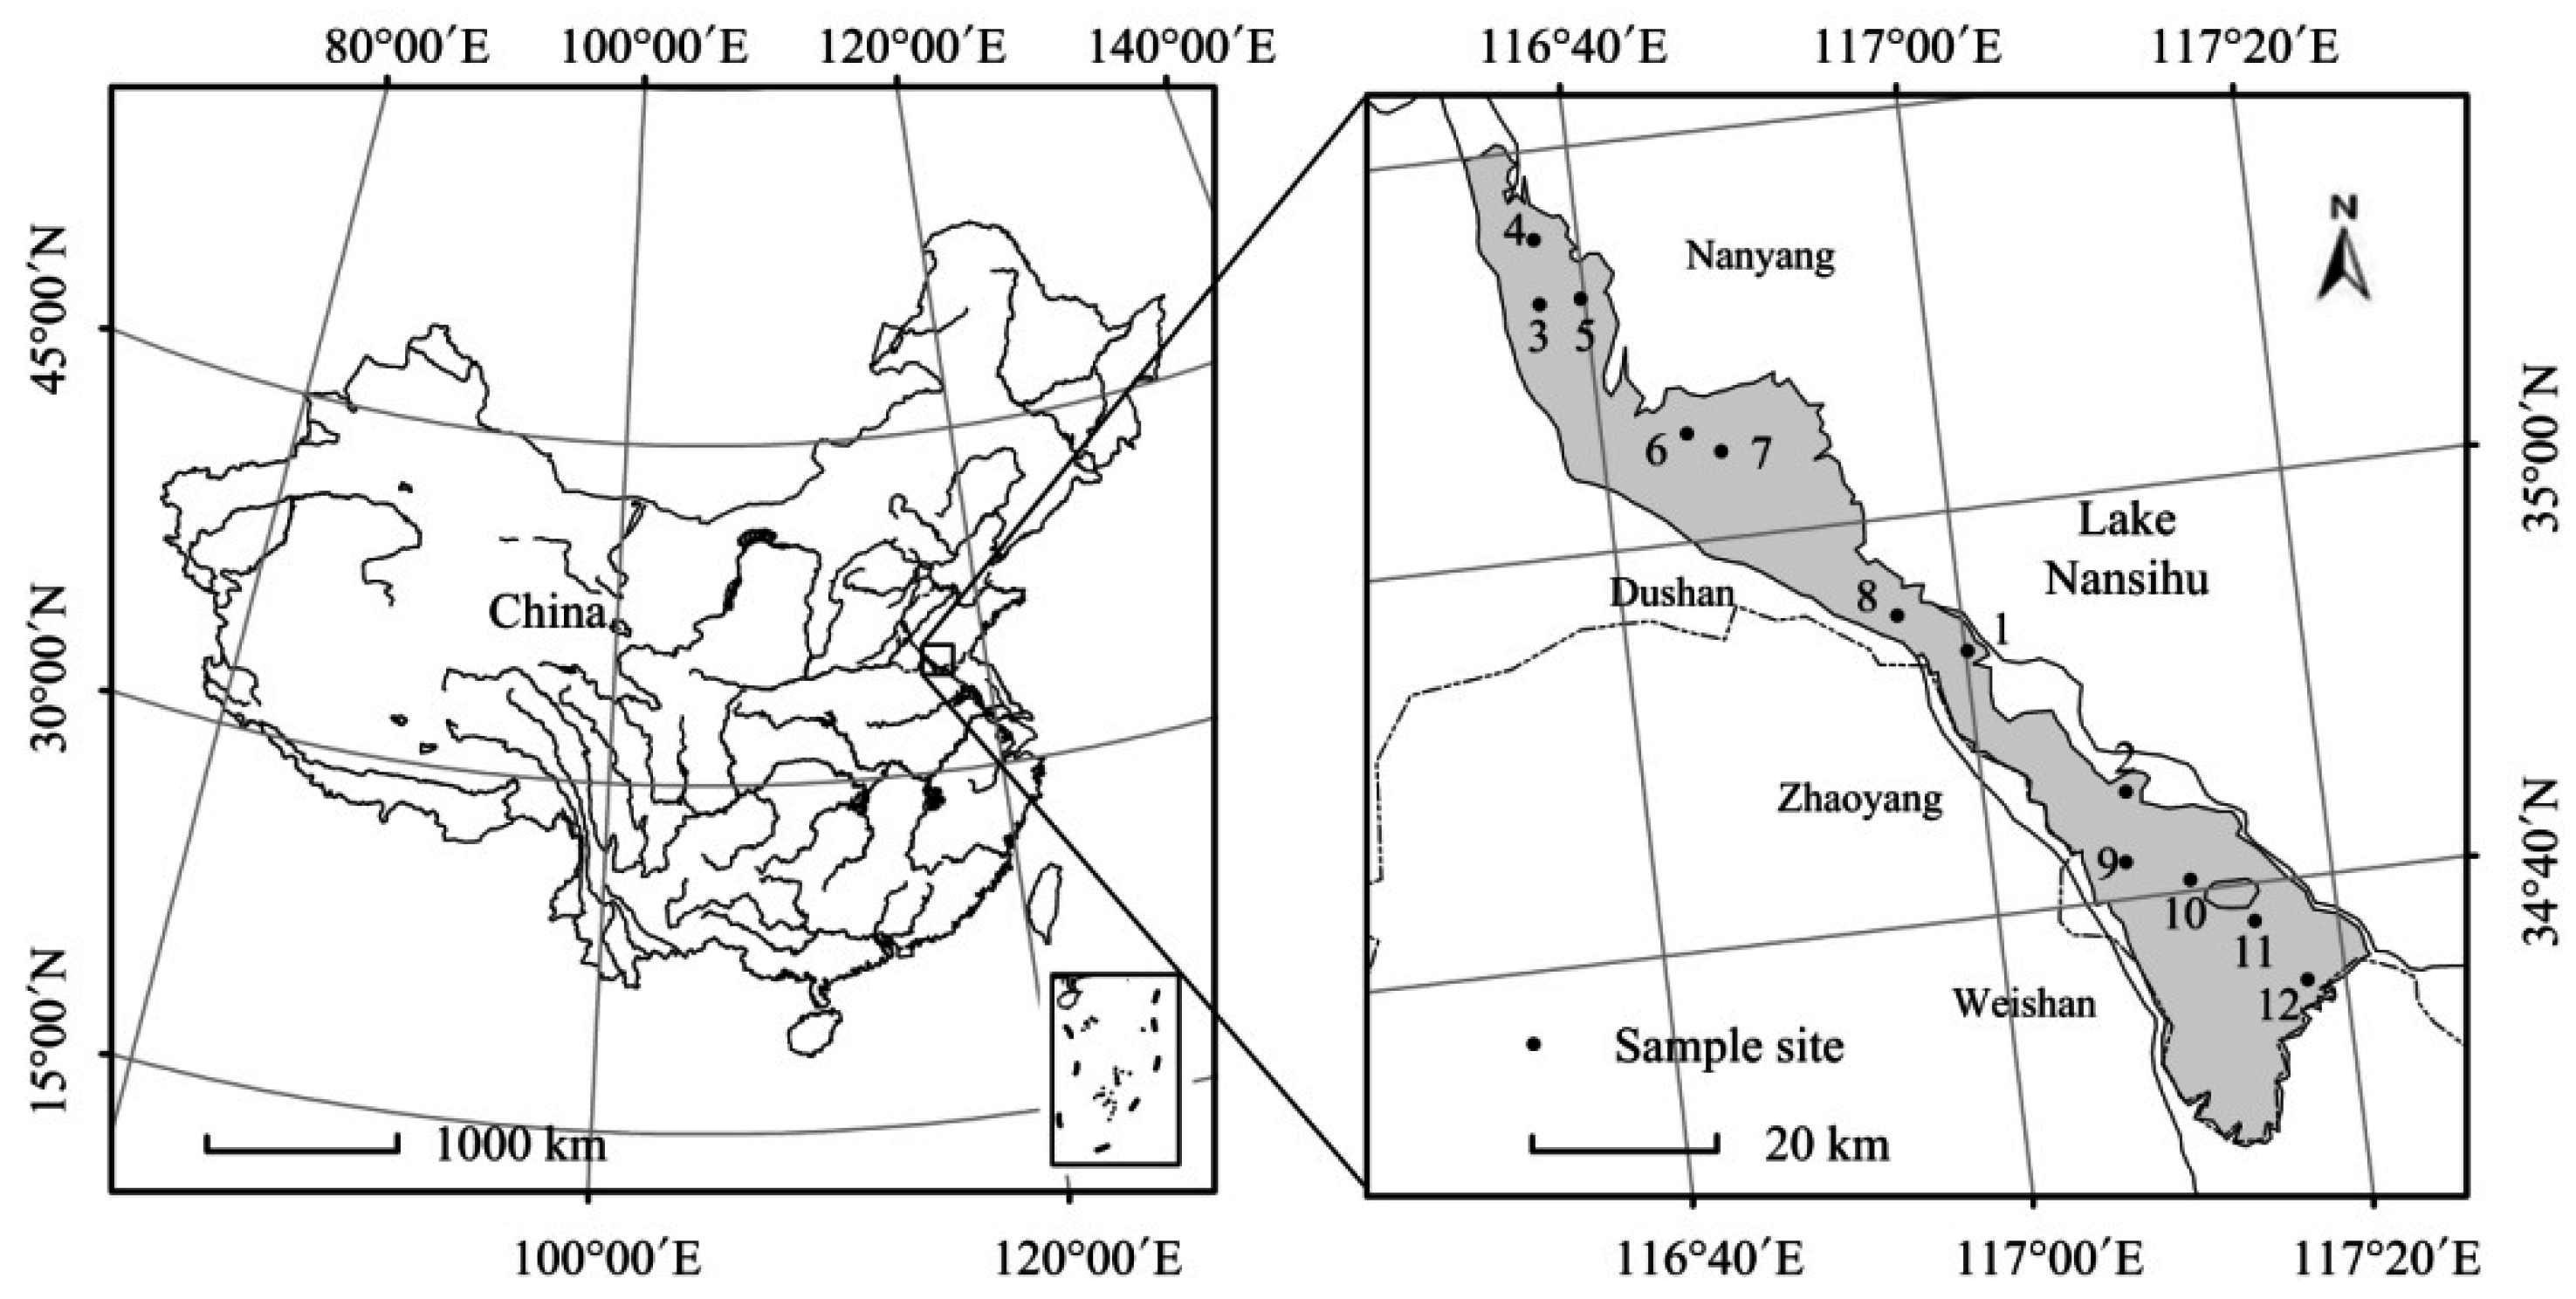
2.1. Study Area

Lake Nansihu (116°34′ E~117°21′ E, 34°27′ N~35°20′ N) is located in Shandong Province (Figure 1). This lake comprises four connected lakes: Nanyang, Dushan, Zhaoyang and Weishan lakes. The total water area of the lake is 1266 km2, with a capacity of 6.37 × 10⁹ m3. Lake Nansihu is categorized as a shallow, open and plain grassland lake with an average water depth of 1.46 m. The climate of the area is warm temperate monsoon with an annual average temperature of 13.7 °C. The annual average rainfall ranges between 550 mm and 720 mm, and nearly 60% of the precipitation occurs during the rainy summer.

2.2. Sampling and Measurements

A total of 12 sample sites was uniformly set in the four connected lakes of Lake Nansihu (Figure 1). Sites 3–5 were located in Lake Nanyang; Sites 6–8 were located in Lake Dushan; Sites 1, 2 and 9 were located in Lake Zhaoyang; and Sites 10–12 were located in Lake Weishan. These sites were located away from areas under construction or containing aquaculture. Phytoplankton and zooplankton samples were collected in early April, July, September and late November from 2011 to 2014 to represent the situations in different seasons. Each of the sites was measured 16 times, and the measurements were uniformly distributed in the four seasons. The main environmental factors were investigated in July 2012, early April, September and late November 2013. All measurements and samplings were conducted between 8:00 A.M. and 10:00 A.M. along the same route.
Water temperature, dissolved oxygen and pH were measured in situ using YSI Professional Plus (YSI Incorporated, Yellow Springs, OH, USA) at the 12 sites. Water transparency in the lake was measured using a Secchi disk. Water quality samples were collected using a Tygon tube water sampler at 0.30 m under the water surface. The samples were stored in acid-cleaned glass bottles at 4 °C and filtered through a 0.45-μm acetate filter for subsequent analyses. The concentration of TN was measured using the potassium persulfate oxidation-UV spectrophotometry method, and TP was determined using the Mo-Sb anti-spectrophotometry method [43].
Phytoplankton samples (1 L) were collected from 1 m under the water surface at each sample site and subsequently preserved in acidified Lugol’s solution for 24 h and condensed to 30 mL. A 0.1-mL aliquot of the condensed sample was added to a phytoplankton counting box to identify and quantify the cells of each species [44]. The biomass of phytoplankton species was calculated by the cell volume of each species [45].
Zooplankton samples (1 L) were collected 1 m under the water surface and preserved with formaldehyde (4%) for 24 h. The samples were condensed to 50 mL prior to analyses. A 0.1-mL aliquot of the condensed sample was used to count the individuals of protozoa, and a 1-mL sample was used to count the numbers of Rotifera, Cladocera and copepods under the microscope [46]. The zooplankton biomass was estimated from the biovolume after comparing the body shape with approximate geometric shapes [46].

2.3. Stability Index and Statistical Analyses

The temporal stability indices (TSI) of different phytoplankton and zooplankton taxa were measured as the coefficient of variation (the variance in a time series of biomass related to the mean value), which is widely used in ecology [12,14,15]. The index was calculated using the following equation [12,14,15].
T S I = μ σ = B i o V a r + C o v
In this equation, TSI is the temporal stability index of different taxa; μ is the average total biomass of each of the taxa; and σ is the standard deviation of the total biomass. The standard deviation of the total biomass included the summed variance of each species (Var) and summed covariance of two species (Cov). The TSI was calculated using the data collected from 2011 to 2014; therefore, the phytoplankton species richness at each site was measured as the number of all species appearing during the research time. Therefore, the temporal stability of community biomass comprised three components: average total biomass, summed variance and summed covariance. The relationships between phytoplankton species richness and the three components were also analyzed to explore the three potential mechanisms driving the diversity-stability relationship: overyielding, the portfolio effect and species asynchrony [12,16,17,18,19,20,21]. Previously, the three mechanisms were primarily applied within the trophic level. Here, we used these mechanisms to explore the relationships within and across trophic levels (phytoplankton diversity and zooplankton stability). If phytoplankton species richness had a positive influence on the average total biomass of zooplankton, we named this effect ‘trophic overyielding’ [32]. When phytoplankton species richness negatively influenced the summed variance and covariance of zooplankton taxa, we named these effects ‘trophic portfolio effect’ and ‘trophic species asynchrony’, respectively.
The differences of environmental factors among sites were analyzed using a linear mixed effect model (LME) with a maximum-likelihood estimator (function ‘lme’ with ‘method = ML’ within the ‘nlme’ package in R 3.2.3). Season identity was included in the model as a random factor to correct the differences introduced by seasons. Post hoc comparisons were applied using the Tukey HSD test if there were significant differences among sites (function ‘glht’ within the ‘multcomp’ package). The differences of the stability indices of the main plankton taxa (Cyanophyta, Chlorophyta, Bacillariophyta, Euglenophyta, protozoa, Rotifera, Cladocera and copepods) were analyzed using one-way ANOVA. Prior to analysis, the Kolmogorov–Smirnov method was used to test whether the data were normally distributed and the Bartlett test was performed to assess the homogeneity of the variance of the data. Post hoc comparisons were applied using the Tukey HSD test at a significance level of 0.05. The influence of phytoplankton species richness on the stability of phytoplankton and zooplankton taxa was analyzed using linear regression analysis and polynomial fitting. The regression model with the minimum Akaike information criterion (AIC) value was selected as the best fitting.

3. Results

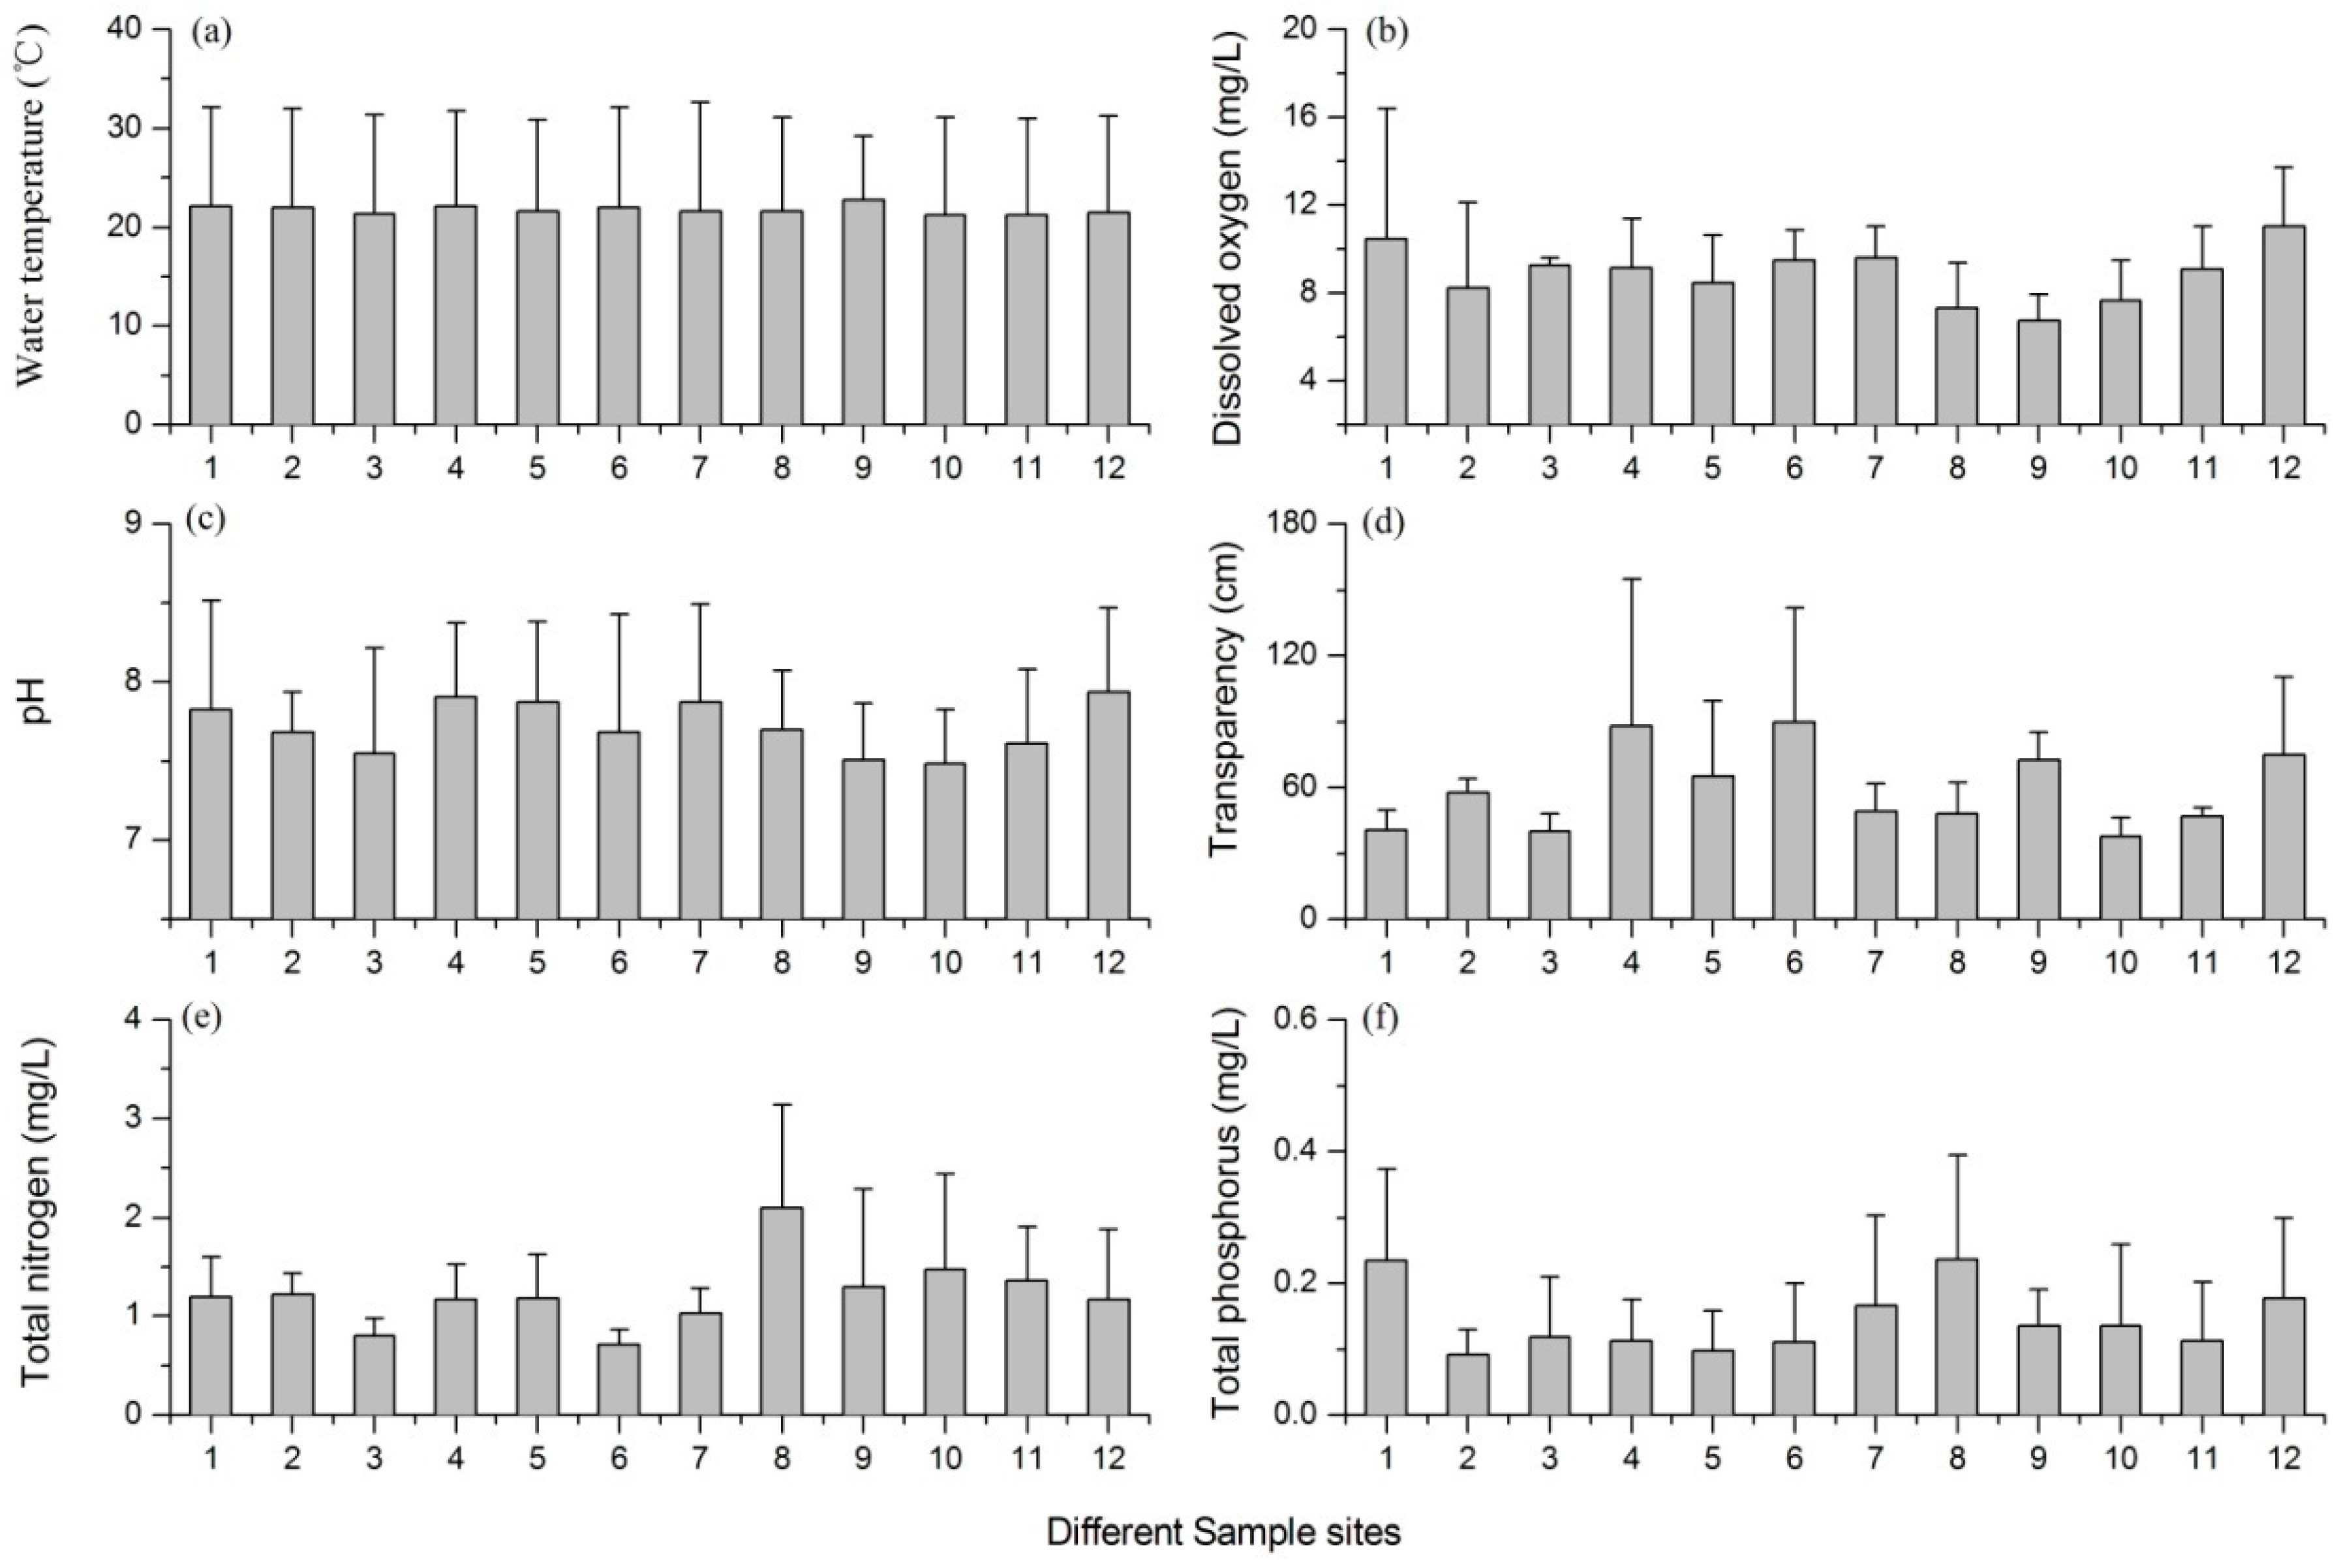
3.1. Variations of the Environmental Factors

The annual average values of water temperature ranged from 21.2 °C to 22.7 °C, but there were no significant differences among the 12 sites (LME: F(11, 33) = 0.269, p = 0.987). The dissolved oxygen concentration in the lake was at a high level, and the mean values of the 12 sites varied between 6.74 mg/L and 11.0 mg/L. There were no significant differences among the 12 sites (LME: F(11, 33) = 1.092, p = 0.397). Most of the sites in the lake were shown to be weak alkaline with a variation of pH from 7.48 to 7.94. There were no significant differences among all of these sites (LME: F(11, 33) = 0.545, p = 0.857). The lake had a low value of water transparency, and the mean value was lower than 1 m (ranging from 0.38 m to 0.90 m) at all 12 sites. There were no significant differences among the mean water transparency of the 12 sites (LME: F(11, 33) = 1.758, p = 0.103). The mean concentration of TN ranged between 0.72 mg/L and 1.98 mg/L at different sites, but there were no significant differences among the 12 sites (LME: F(11, 33) = 1.241, p = 0.301). The average TP values ranged from 0.09 mg/L to 0.36 mg/L at the 12 sample sites (Figure 2a), but there were no significant differences among all of the sites (LME: F(11, 33) = 1.358, p = 0.238). The maximum concentrations of TN and TP were observed at Site 8, and their mean values were 2.29 mg/L and 0.24 mg/L, respectively (Figure 2). Based on the values of the main environmental factors, we concluded that there were no significant differences among the 12 sites.

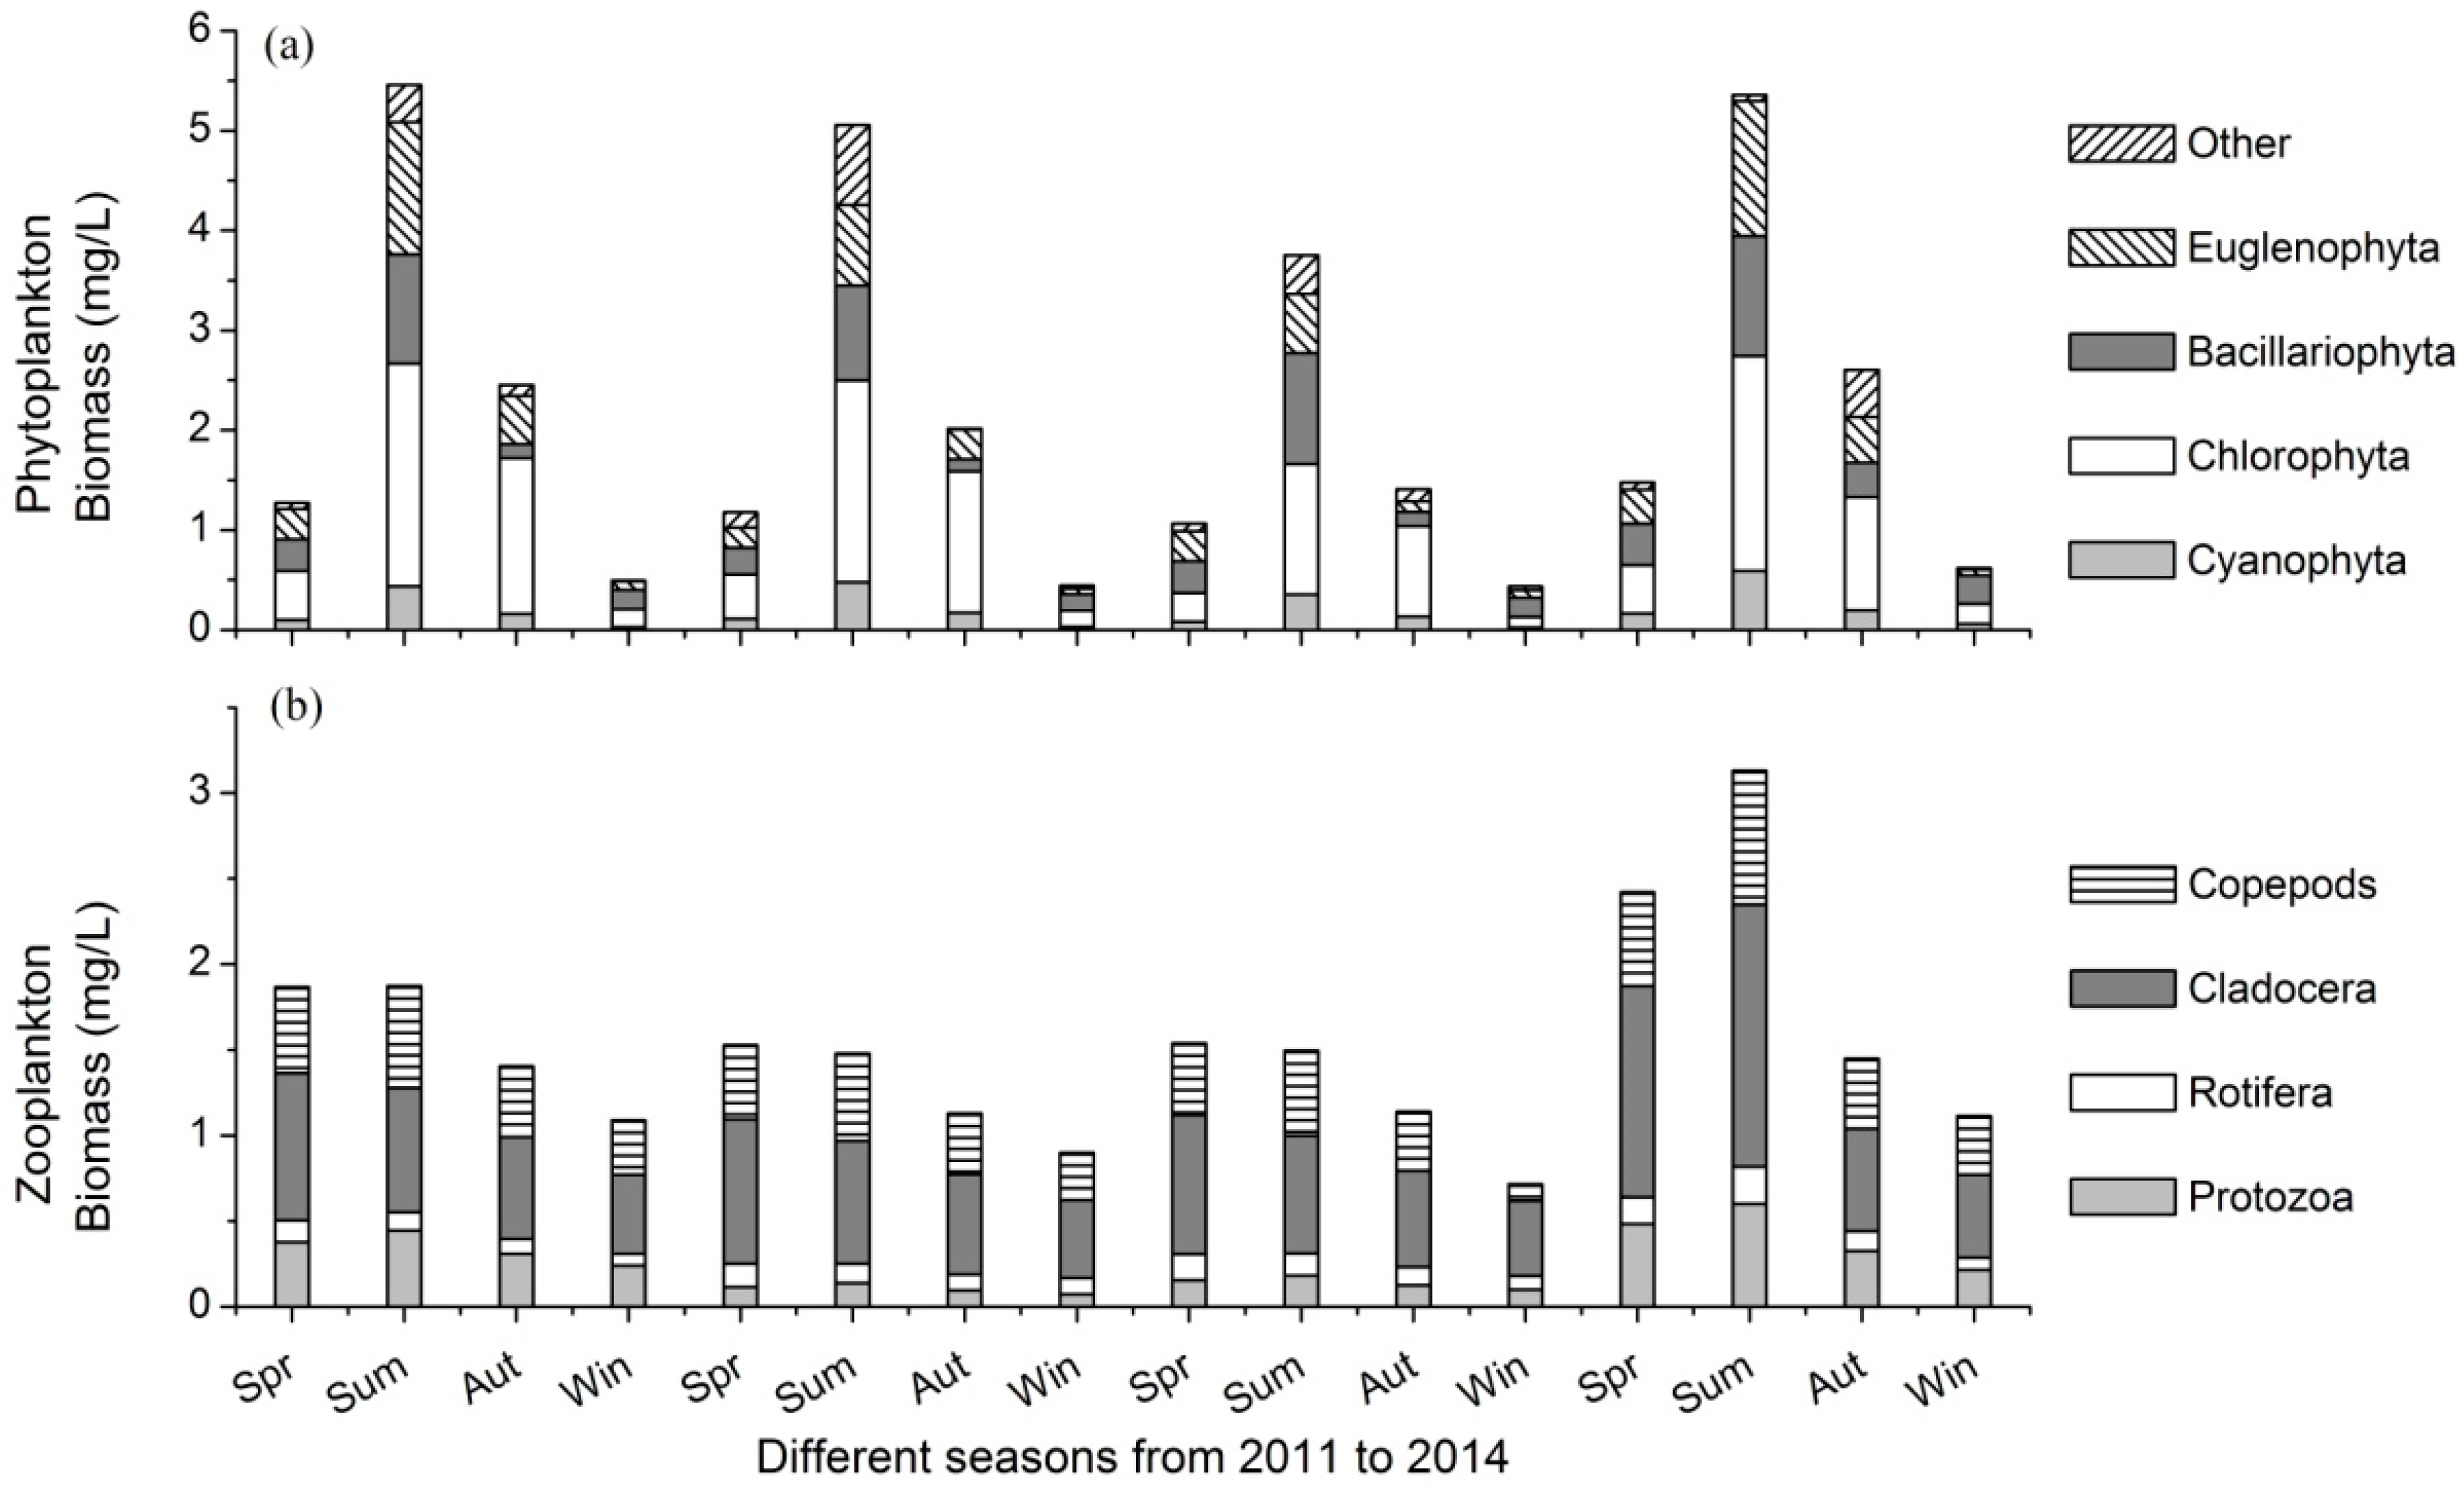
3.2. Variations of Plankton Community

A total of 138 phytoplankton species belonging to 78 genera and eight phyla was identified in Lake Nansihu from 2011 to 2014. Chlorophyta was the dominant taxon, with 60 species identified, accounting for 43.5% of the total phytoplankton species. In addition, the phytoplankton community included 33 Bacillariophyta species, 20 Cyanophyta species and 14 Euglenophyta species. The maximum phytoplankton species richness was 113, which was identified at Site 9. There were 76 zooplankton species in the lake, including 17 protozoa species, 36 Rotifera species, 12 Cladocera species and 11 copepods species. During each individual year, phytoplankton and zooplankton species richness reached their maximum values in summer and their minimum values in winter.
The phytoplankton biomass showed apparent seasonal variations, as shown in Figure 3a. In spring, the average phytoplankton biomass from 2011 to 2014 was 1.24 mg/L. The mean biomasses of the phytoplankton in summer, autumn and winter were 4.91 mg/L, 2.12 mg/L and 0.50 mg/L, respectively. Chlorophyta was the dominant taxon in the lake, with a mean biomass of 0.94 mg/L, accounting for 43.0% of the total phytoplankton biomass. Bacillariophyta and Euglenophyta had nearly the same biomass, with mean values of 0.45 mg/L and 0.43 mg/L, respectively. The mean biomass of Cyanophyta was 0.20 mg/L, which accounted for 8.92% of the total phytoplankton biomass.
In spring, the average zooplankton biomass from 2011 to 2014 was 1.84 mg/L. The mean biomasses of the zooplankton in summer, autumn and winter were 2.00 mg/L, 1.28 mg/L and 0.95 mg/L, respectively. In spring, autumn and winter, zooplankton biomass was dominated by Cladocera, while in summer, both Cladocera and copepods were the dominant taxa (Figure 3b). The mean biomasses of protozoa, Rotifera, Cladocera and copepods were 0.16 mg/L, 0.08 mg/L, 0.48 mg/L and 0.28 mg/L, respectively. The mean biomass of Cladocera accounted for 47.8% of the total zooplankton biomass.

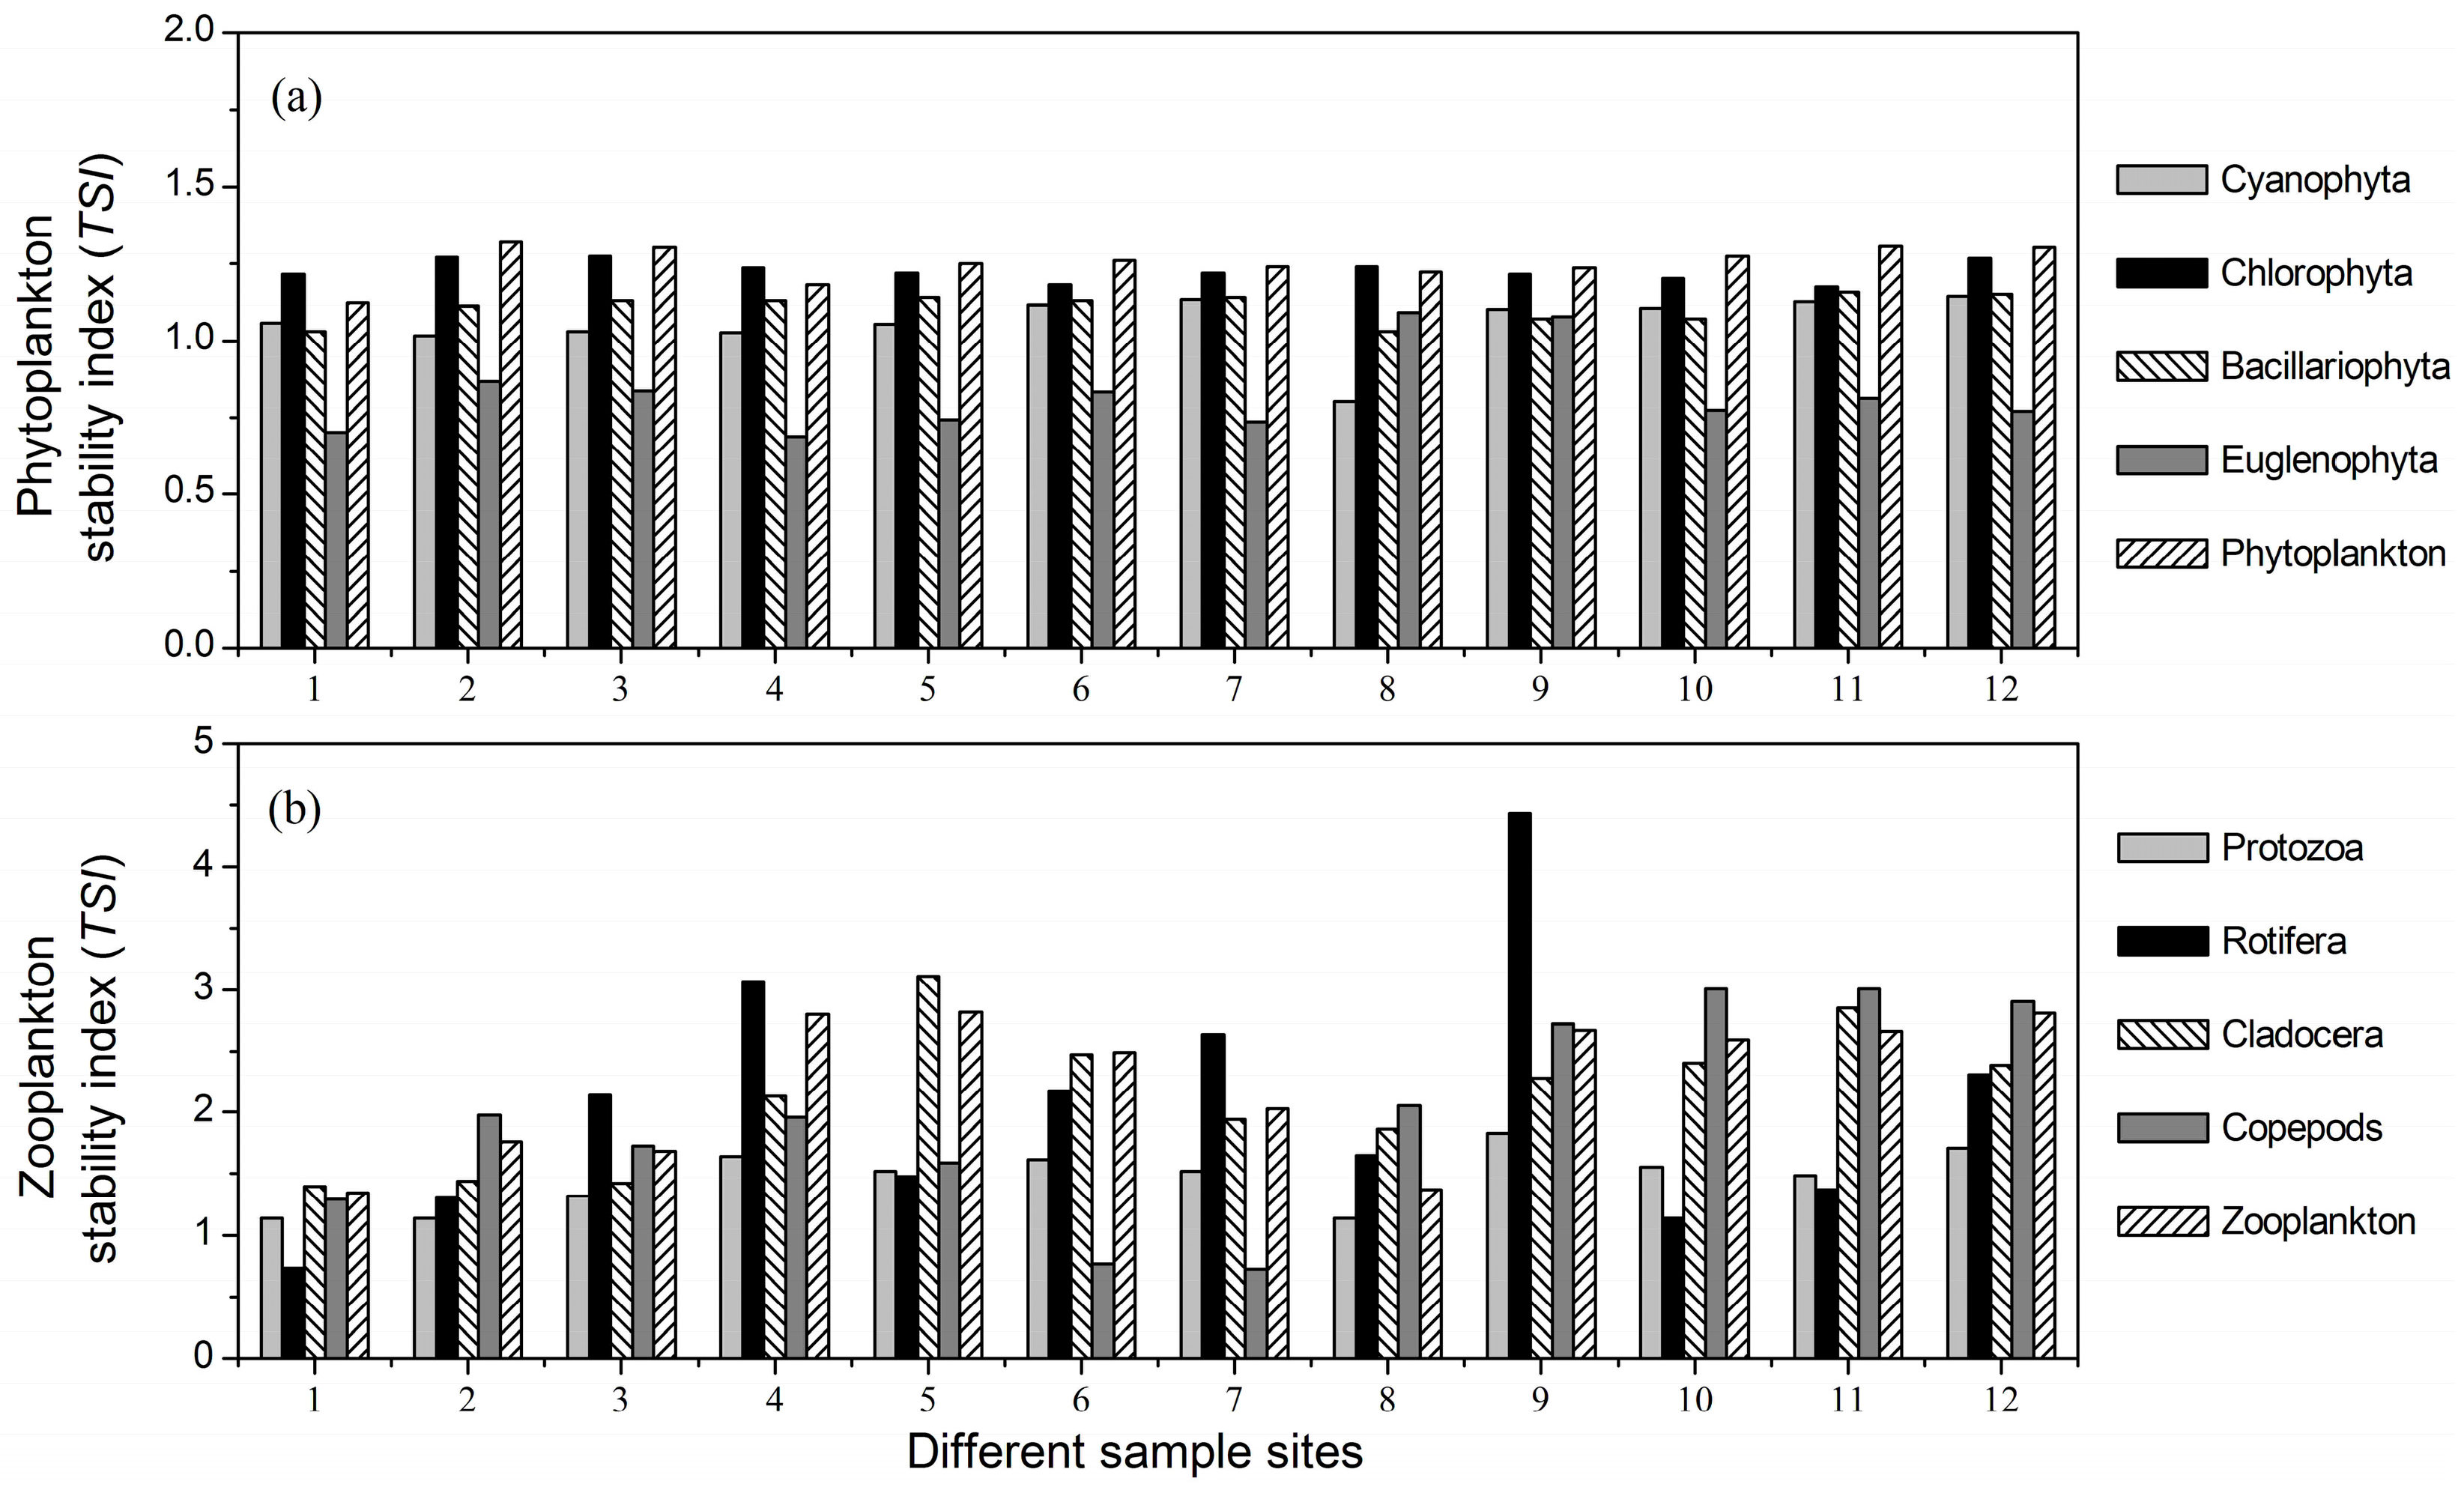
3.3. Stability Indices of Different Plankton Taxa

The TSI of Cyanophyta was nearly at the same level at the 12 sites (Figure 4a). The lowest stability index of Cyanophyta was found at Site 8 (Figure 4a). Further observations showed that Site 8 had an intermediate level of average total biomass and the largest values of both summed variance and covariance of Cyanophyta. The Chlorophyta stability was higher than that of any other phytoplankton taxa at all 12 sites, as shown in Figure 4a. At most sites, the TSI of Bacillariophyta was higher than that of Cyanophyta, but lower than that of Chlorophyta (Figure 4a). The stability index of Euglenophyta was relatively lower than that of other taxa at most sites, and its maximum value was observed at Site 8 (Figure 4a). Site 8 also had an intermediate level of average total biomass and the lowest values of both summed variance and covariance of Euglenophyta. The TSI of total phytoplankton at each site was nearly the same as that of Chlorophyta (Figure 4a).
The largest stability index of protozoa was found at Site 9, as shown in Figure 4b. Site 9 also had the lowest summed variance and intermediate levels of both average total biomass and summed covariance of protozoa. The Rotifera stability index markedly varied at different sample sites, as shown in Figure 4b. The maximum value of the Rotifera stability index was also observed at Site 9. The lowest summed variance and covariance of Rotifera both appeared at Site 9. However, the average total biomass of Site 9 was at an intermediate level. The stability indices of Cladocera and copepods were relatively high compared with that of protozoa (Figure 4b). The copepods’ stability index was low at Sites 6 and 7, but high at Sites 10, 11 and 12 (Figure 4b). Further comparison showed that Sites 6 and 7 had the lowest average total biomass, while Sites 10, 11 and 12 had relatively lower values of summed variance.
There were significant differences among the stability indices of the main plankton taxa (one-way ANOVA: F(7, 88) = 11.98, p < 0.001). The mean TSI values of Rotifera, Cladocera and copepods were significantly higher than that of all of the phytoplankton taxa (all p < 0.001 by post hoc Tukey HSD). There was no significant difference among the mean TSI values of Cyanophyta, Chlorophyta, Bacillariophyta and Euglenophyta (all p > 0.05 by post hoc Tukey HSD). The mean stability of protozoa was significantly higher than that of all of the phytoplankton taxa (all p < 0.001 by post hoc Tukey HSD), but lower than that of other zooplankton groups (all p < 0.001 by post hoc Tukey HSD). Therefore, Rotifera, Cladocera and copepods were the most stable plankton taxa, followed by protozoa, and the stability of phytoplankton taxa was the lowest.

3.4. Relationship between Phytoplankton Diversity and Stability

The Cyanophyta stability index had a unimodal relationship with species richness, and it reached the maximum value when Cyanophyta species richness was 13 (Figure 5a). Further analyses showed that Cyanophyta species richness had a concave relationship with summed variance, but a weak negative relationship with average total biomass (Figure 6a). However, the summed covariance of Cyanophyta had a weak concave relationship with species richness. There was no apparent relationship between Chlorophyta species richness and stability (R = 0.239, p > 0.05). However, the three components of Chlorophyta stability all showed concave relationships with species richness (Figure 6b). There was also a unimodal relationship between Bacillariophyta species richness and the stability index (Figure 5c). However, the correlation coefficients between the three components of Bacillariophyta temporal stability and species richness were all not significant (Figure 6c). A concave relationship was observed between the species richness and stability of Euglenophyta, as shown in Figure 5d. Euglenophyta stability reached the minimum value when its species richness was nine. The three components of Euglenophyta temporal stability were not influenced by species richness (Figure 6d). Both the summed variance and covariance of Euglenophyta were relatively low when the species richness was high (Figure 6d). The correlation coefficient between total phytoplankton species richness and stability was not significant (R = 0.285, p > 0.05). The weak negative relationship between phytoplankton species richness and its summed variance was responsible for this phenomenon (Figure 6e).

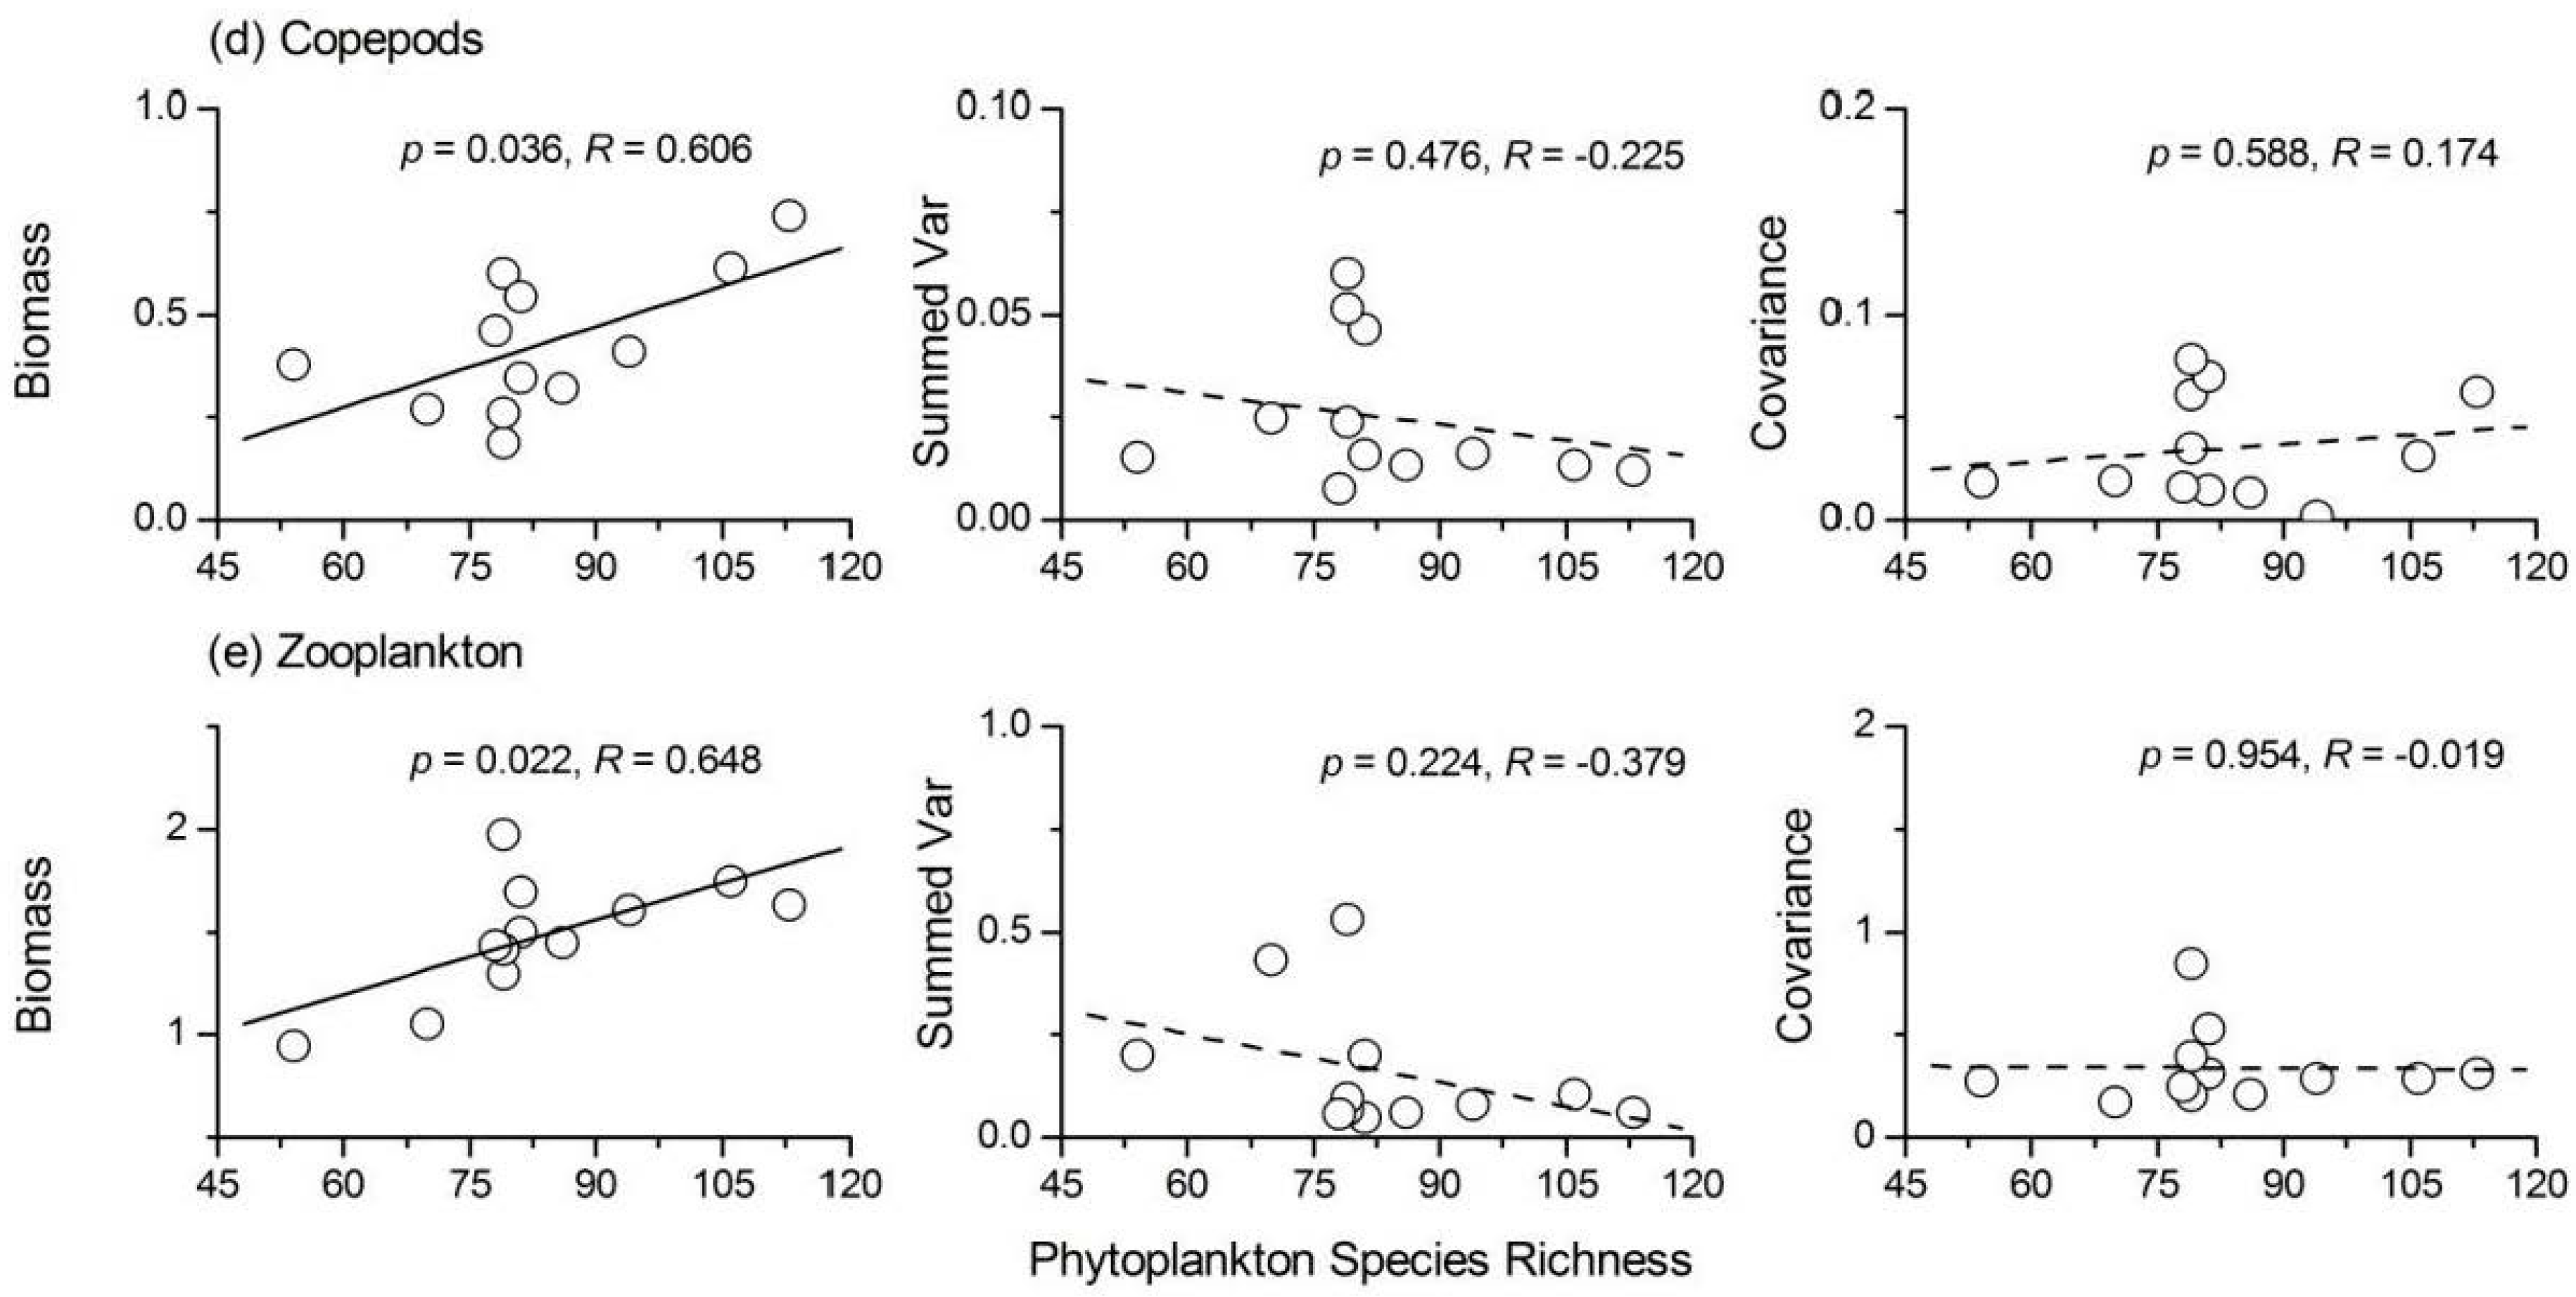
3.5. Relationship between Phytoplankton Diversity and Zooplankton Stability

Phytoplankton species richness was positively correlated with the stability of protozoa (Figure 7). Phytoplankton species richness had a weak positive relationship (R = 0.405, p > 0.05) with the average total biomass and a weak negative relationship (R = −0.407, p > 0.05) with the summed variance of protozoa (Figure 8a). There was also a positive relationship between the stability of Rotifera and phytoplankton species richness (Figure 7b). The three components of Rotifera temporal stability were all negatively correlated with phytoplankton species richness (Figure 8b). The influence of phytoplankton species richness on the temporal stability of both Cladocera and copepods was not significant (for Cladocera, R = 0.377, p > 0.05; for copepods, R = 0.490, p > 0.05). The summed variance and covariance of the two taxa were not affected by phytoplankton species richness (Figure 8c,d). The average total biomass of Cladocera and copepods increased with increasing phytoplankton species richness (Figure 8). The relationship between phytoplankton species richness and total zooplankton stability was also positive (R = 0.703, p < 0.05), as shown in Figure 7e. The strong positive relationship between phytoplankton species richness and the average total biomass of zooplankton (Figure 8e) was responsible for this phenomenon. In addition, a weak negative relationship between the summed variance of zooplankton and phytoplankton species richness was observed (R = −0.379, p > 0.05).

4. Discussion

Based on the field investigations at Lake Nansihu, we analyzed the effects of phytoplankton diversity on the stability of the plankton community and explored the potential mechanisms involved. Phytoplankton species richness not only influenced the temporal stability of its own trophic level, but also affected the stability of zooplankton. The temporal stability of different plankton taxa responded variously to the range of species richness (Figure 5 and Figure 7); however, in most cases, there was a positive diversity-stability relationship within and across trophic levels in the natural plankton community. These results confirmed the insurance hypothesis to some extent that biodiversity reduces the temporal variability of community biomass [12,22]. The average total biomass, summed variance and covariance of plankton taxa had different relationships with species richness (Figure 6 and Figure 8). These results also facilitated the quantification of the roles of overyielding, the portfolio effect and species asynchrony effects in maintaining the diversity-stability relationships [12,16,17,18,19,20,21].
There was a unimodal relationship between Cyanophyta species richness and temporal stability (Figure 5). The average total biomass of Cyanophyta decreased slightly with increasing diversity (Figure 6), a phenomenon that was in opposition with the overyielding effect. A strong concave relationship between Cyanophyta species richness and summed variance was found. These results suggested that Cyanophyta diversity affected the temporal stability mainly through the portfolio effect. Cyanophyta was much more efficient in resource use and sensitive to the variations of environmental factors (e.g., temperature and pH value) than other taxa [6,47]. With increasing nutrient concentration, the phytoplankton community was generally dominated by Cyanophyta, with low diversity, but high biomass [6]. Thus, the negative relationship between Cyanophyta biomass and diversity in Lake Nansihu was consistent with its properties [6,47]. The biodiversity effects observed in the present study were consistent with the findings of most previous studies [24]. However, Filstrup et al. [6] obtained a negative relationship between phytoplankton evenness and stability (community turnover). In the study conducted by Filstrup et al. [6], the lakes were in heavy eutrophic states, and the proportions of Cyanophyta biomass were higher than 75% of the total phytoplankton biomass at most sites. The phytoplankton community was dominated by a few Cyanophyta genera and lost the ability to respond to environmental changes, i.e., low community turnover. Therefore, Cyanophyta generally exhibits low stability in eutrophic lakes, but when its dominance exceeds a threshold point, the stability will be enhanced.
The species richness of both Chlorophyta and total phytoplankton had no apparent influence on their stability indices. The correlation coefficients between their species richness and temporal stability were not significant (Figure 5). The average total biomass, summed variance and covariance of Chlorophyta showed a concave relationship with species richness. In most cases (Chlorophyta species richness <40; Figure 6), greater Chlorophyta diversity was associated with relatively lower values of both summed variance and covariance. These results showed that Chlorophyta diversity affected the temporal stability mainly through the portfolio effect and species asynchrony. Total phytoplankton species richness had almost no influence on the average total biomass (R = 0.016, p > 0.05) and summed covariance (R = 0.039, p > 0.05). A relatively strong negative relationship between phytoplankton species richness and summed variance (R = −0.420, p > 0.05) was found. Therefore, total phytoplankton diversity affected community stability mainly through the portfolio effect. There was also a unimodal relationship between Bacillariophyta species richness and temporal stability (Figure 5). However, none of the three components of Bacillariophyta stability showed a relationship with species richness (Figure 6). Euglenophyta stability had a strong concave relationship with species richness; however, none of the three components of Euglenophyta temporal stability were influenced by species richness (Figure 6). Therefore, the underlying mechanisms of the diversity-stability relationships observed in both Bacillariophyta and Euglenophyta were not apparent. In summary, although the underlying mechanisms for the diversity-stability relationships of different phytoplankton taxa varied, portfolio effects appeared to be the most dominant. Previous ecological studies have observed conflicting results when analyzing the phytoplankton diversity-stability relationship using both experiments and field investigations. McGrady-Steed et al. [28] found that aquatic microbial communities with higher diversity were more stable (measured as predictability) in laboratory experiments. However, some other studies have shown negative or more complex relationships between phytoplankton diversity and ecosystem stability in artificial plankton communities [16,29]. Ptacnik et al. [5] and Filstrup et al. [6] also discovered conflicting relationships between phytoplankton diversity and community turnover rates based on field investigations. Taken together, these results suggest that the phytoplankton diversity-stability relationship and its underlying mechanisms were complex, particularly in natural ecosystems.
We showed that the lowest Cyanophyta stability index and the highest Euglenophyta stability index were both observed at Site 8 (Figure 4). TN and TP were the main factors influencing the biomass of Cyanophyta. Site 8 not only had relatively higher concentrations of both TN and TP, but also had larger standard deviations of TN and TP. As a result, the summed variance and covariance of Cyanophyta at Site 8 were the highest at all 12 sites. Thus, the Cyanophyta biomass at Site 8 had the highest standard deviation and lowest stability. However, TN and TP had little influence on the biomass of Euglenophyta. The minimum values of summed variance and covariance of Euglenophyta were both observed at Site 8. Therefore, Euglenophyta biomass at Site 8 had the lowest standard deviation and the highest stability.
The results of the present study showed significant differences among the stability indices of the main plankton taxa. Rotifera, Cladocera and copepods were the most stable taxa, followed by protozoa, and the stability of phytoplankton taxa was the lowest. Protozoa prey on phytoplankton species, whereas both protozoa and phytoplankton are consumed by Rotifera, Cladocera and copepods [48,49]. Thus, the temporal stability of these taxa was consistent with their trophic levels in aquatic ecosystems: plankton taxa at higher trophic levels would be more stable.
The stability indices of protozoa, Rotifera and total zooplankton were significantly increased with increasing phytoplankton species richness. Phytoplankton species richness had a weak positive relationship with the average total biomass and a weak negative relationship with the summed variance of protozoa (Figure 8a); therefore, phytoplankton diversity influenced the stability of protozoa mainly through a weak ‘trophic overyielding’ and ‘trophic portfolio effect’. The average total biomass of Rotifera was not influenced by phytoplankton species richness. However, both the summed variance and covariance of Rotifera showed a weak negative relationship with phytoplankton species richness. These results showed that phytoplankton diversity influenced the stability of Rotifera through a weak ‘trophic portfolio effect’ and ‘trophic species asynchrony’. Phytoplankton species richness had a strong positive relationship with the average total biomass and a weak negative relationship with the summed variance of total zooplankton (Figure 8). Therefore, phytoplankton diversity influenced the stability of total zooplankton through ‘trophic overyielding’ and a weak ‘trophic portfolio effect’. The correlation coefficients between phytoplankton species richness and the Cladocera or copepods stability index were not significant. Thus, phytoplankton diversity had positive impacts on the stability of the zooplankton community, but the effects were strong on the adjacent trophic level of phytoplankton (protozoa and Rotifera). The average total biomass and summed variance of Cladocera had concave relationships with phytoplankton species richness. When phytoplankton species richness was <100, species richness generally had a strong positive influence on the average total biomass of Cladocera. Therefore, phytoplankton diversity influenced the stability of Cladocera through ‘trophic overyielding’. The influence of phytoplankton species richness on the three components of copepods’ stability was nearly the same as that of the total zooplankton; therefore, ‘trophic overyielding’ and a weak ‘trophic portfolio effect’ were the main mechanisms involved. Although the underlying mechanisms controlling the influence of phytoplankton diversity on the stability of different zooplankton taxa varied, ‘trophic overyielding’ and a weak ‘trophic portfolio effect’ were dominant. Striebel et al. [32] and Filstrup et al. [6] discovered that higher phytoplankton diversity promoted zooplankton abundance, summarized as ‘trophic overyielding’. We also observed and quantified this phenomenon in the present study. In addition, the diversity of a predator also influences the producer community. Duffy [50] reported that the diversity effects of producers were enhanced in the presence of predators. Thus, we concluded that both phytoplankton and zooplankton diversity would influence each other’s ecosystem processes.
In Lake Nansihu, there were 116 phytoplankton genera and 249 zooplankton species in 1983 when the lake was in a healthy state [38,39,40]. The phytoplankton and zooplankton species richness decreased to 28 and 36 in 2002 when the lake was heavily polluted [38,39,40]. Currently, Lake Nansihu is in a meso-eutrophic state, and 138 phytoplankton species and 76 zooplankton species were identified in the present study. Therefore, the species richness of the plankton community in the lake was found to be highly correlated with the fluctuation of environmental conditions, particularly variations in water quality [51,52]. Jeppesen et al. [51] showed that phytoplankton species richness ranged from 95 when 0.2 < TP < 0.4 mg/L, to 81 when TP > 0.4 mg/L in Danish lakes. Rodrigues et al. [52] found that the number of phytoplankton was significantly decreased with increasing nutrient levels in the Paraná subsystem. These analyses suggested that plankton species richness was highly influenced by nutrient concentrations, and it might be a good indicator of the trophic states in aquatic ecosystems.
Lake Nansihu is now in a meso-eutrophic state, and the main risk to the lake is algae blooms. The observations of the present study showed that phytoplankton species richness positively influenced the stability of both phytoplankton and zooplankton in most situations (Figure 5 and Figure 7). These results suggest that we could maintain the stability and security of aquatic ecosystems by protecting and conserving the diversity of phytoplankton.

5. Conclusions

In the present study, the diversity-stability relationships of phytoplankton taxa, the effects of phytoplankton species richness on zooplankton stability, and their potential mechanisms were analyzed based on field investigations in Lake Nansihu. As per the findings of the present study, the following can be concluded.
(1)
There were 138 phytoplankton and 76 zooplankton species in the lake. Phytoplankton biomass varied from 0.44 mg/L to 5.46 mg/L, and that of zooplankton ranged between 0.95 mg/L and 2.00 mg/L in different seasons.
(2)
There were significant differences among the mean temporal stability of different plankton taxa. Rotifera, Cladocera and copepods were the most stable taxa, followed by protozoa, and the stability of the phytoplankton taxa was the lowest.
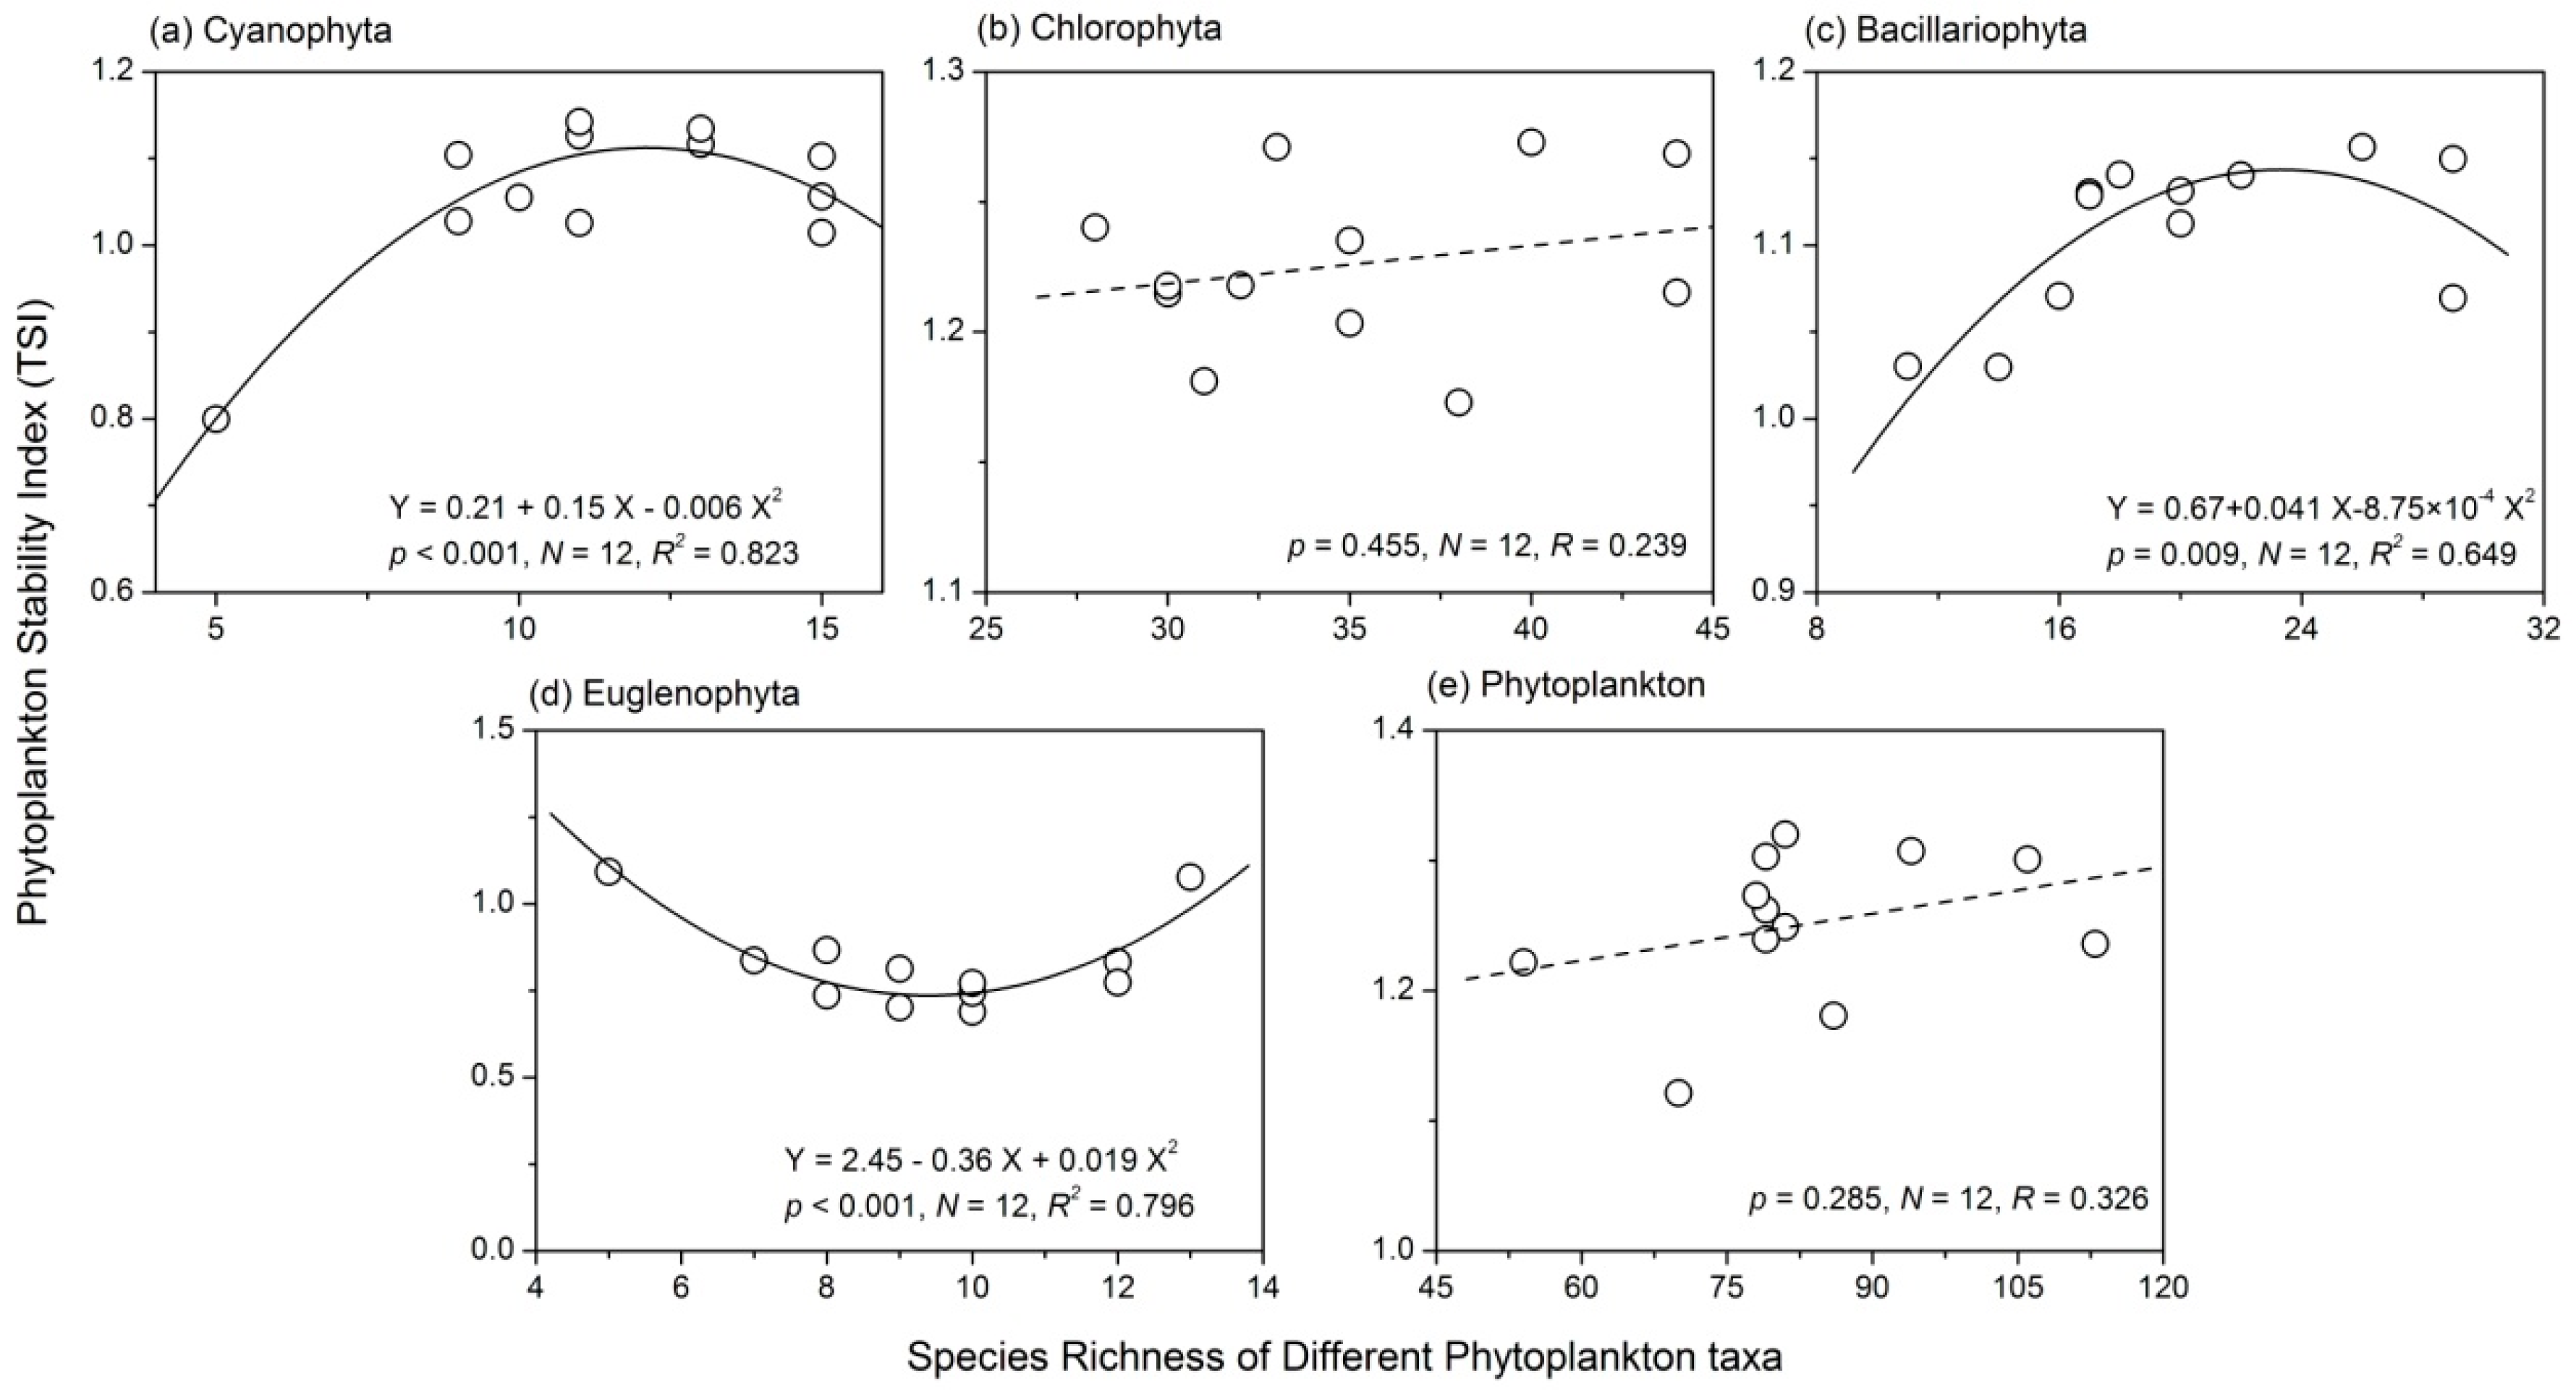
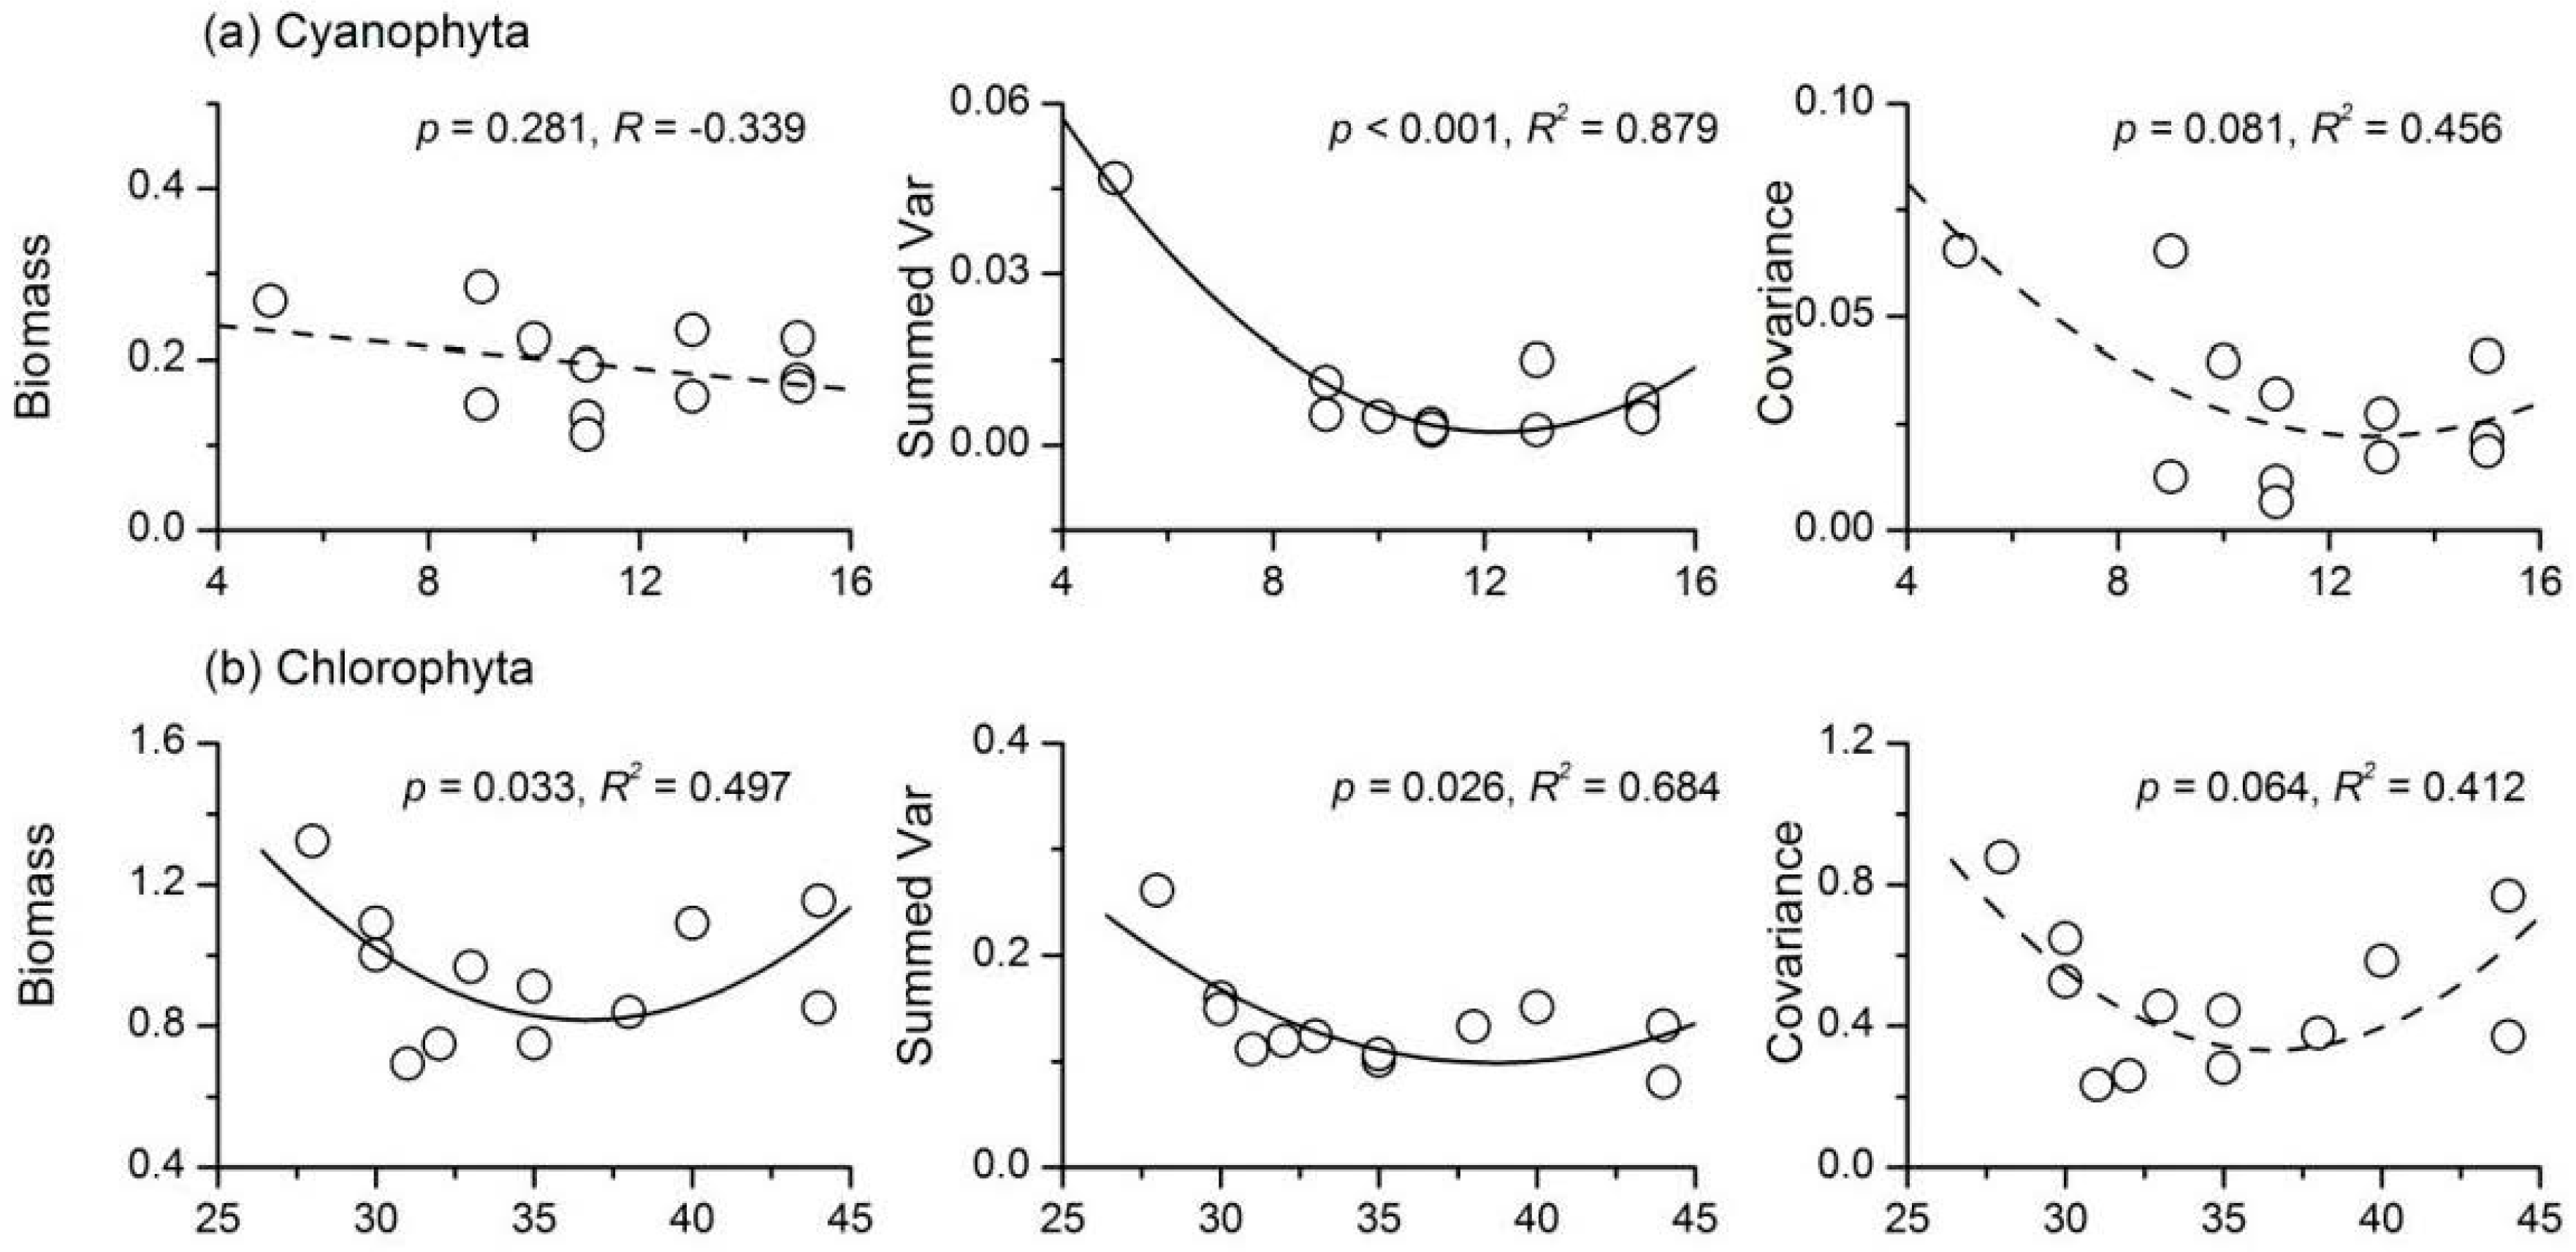
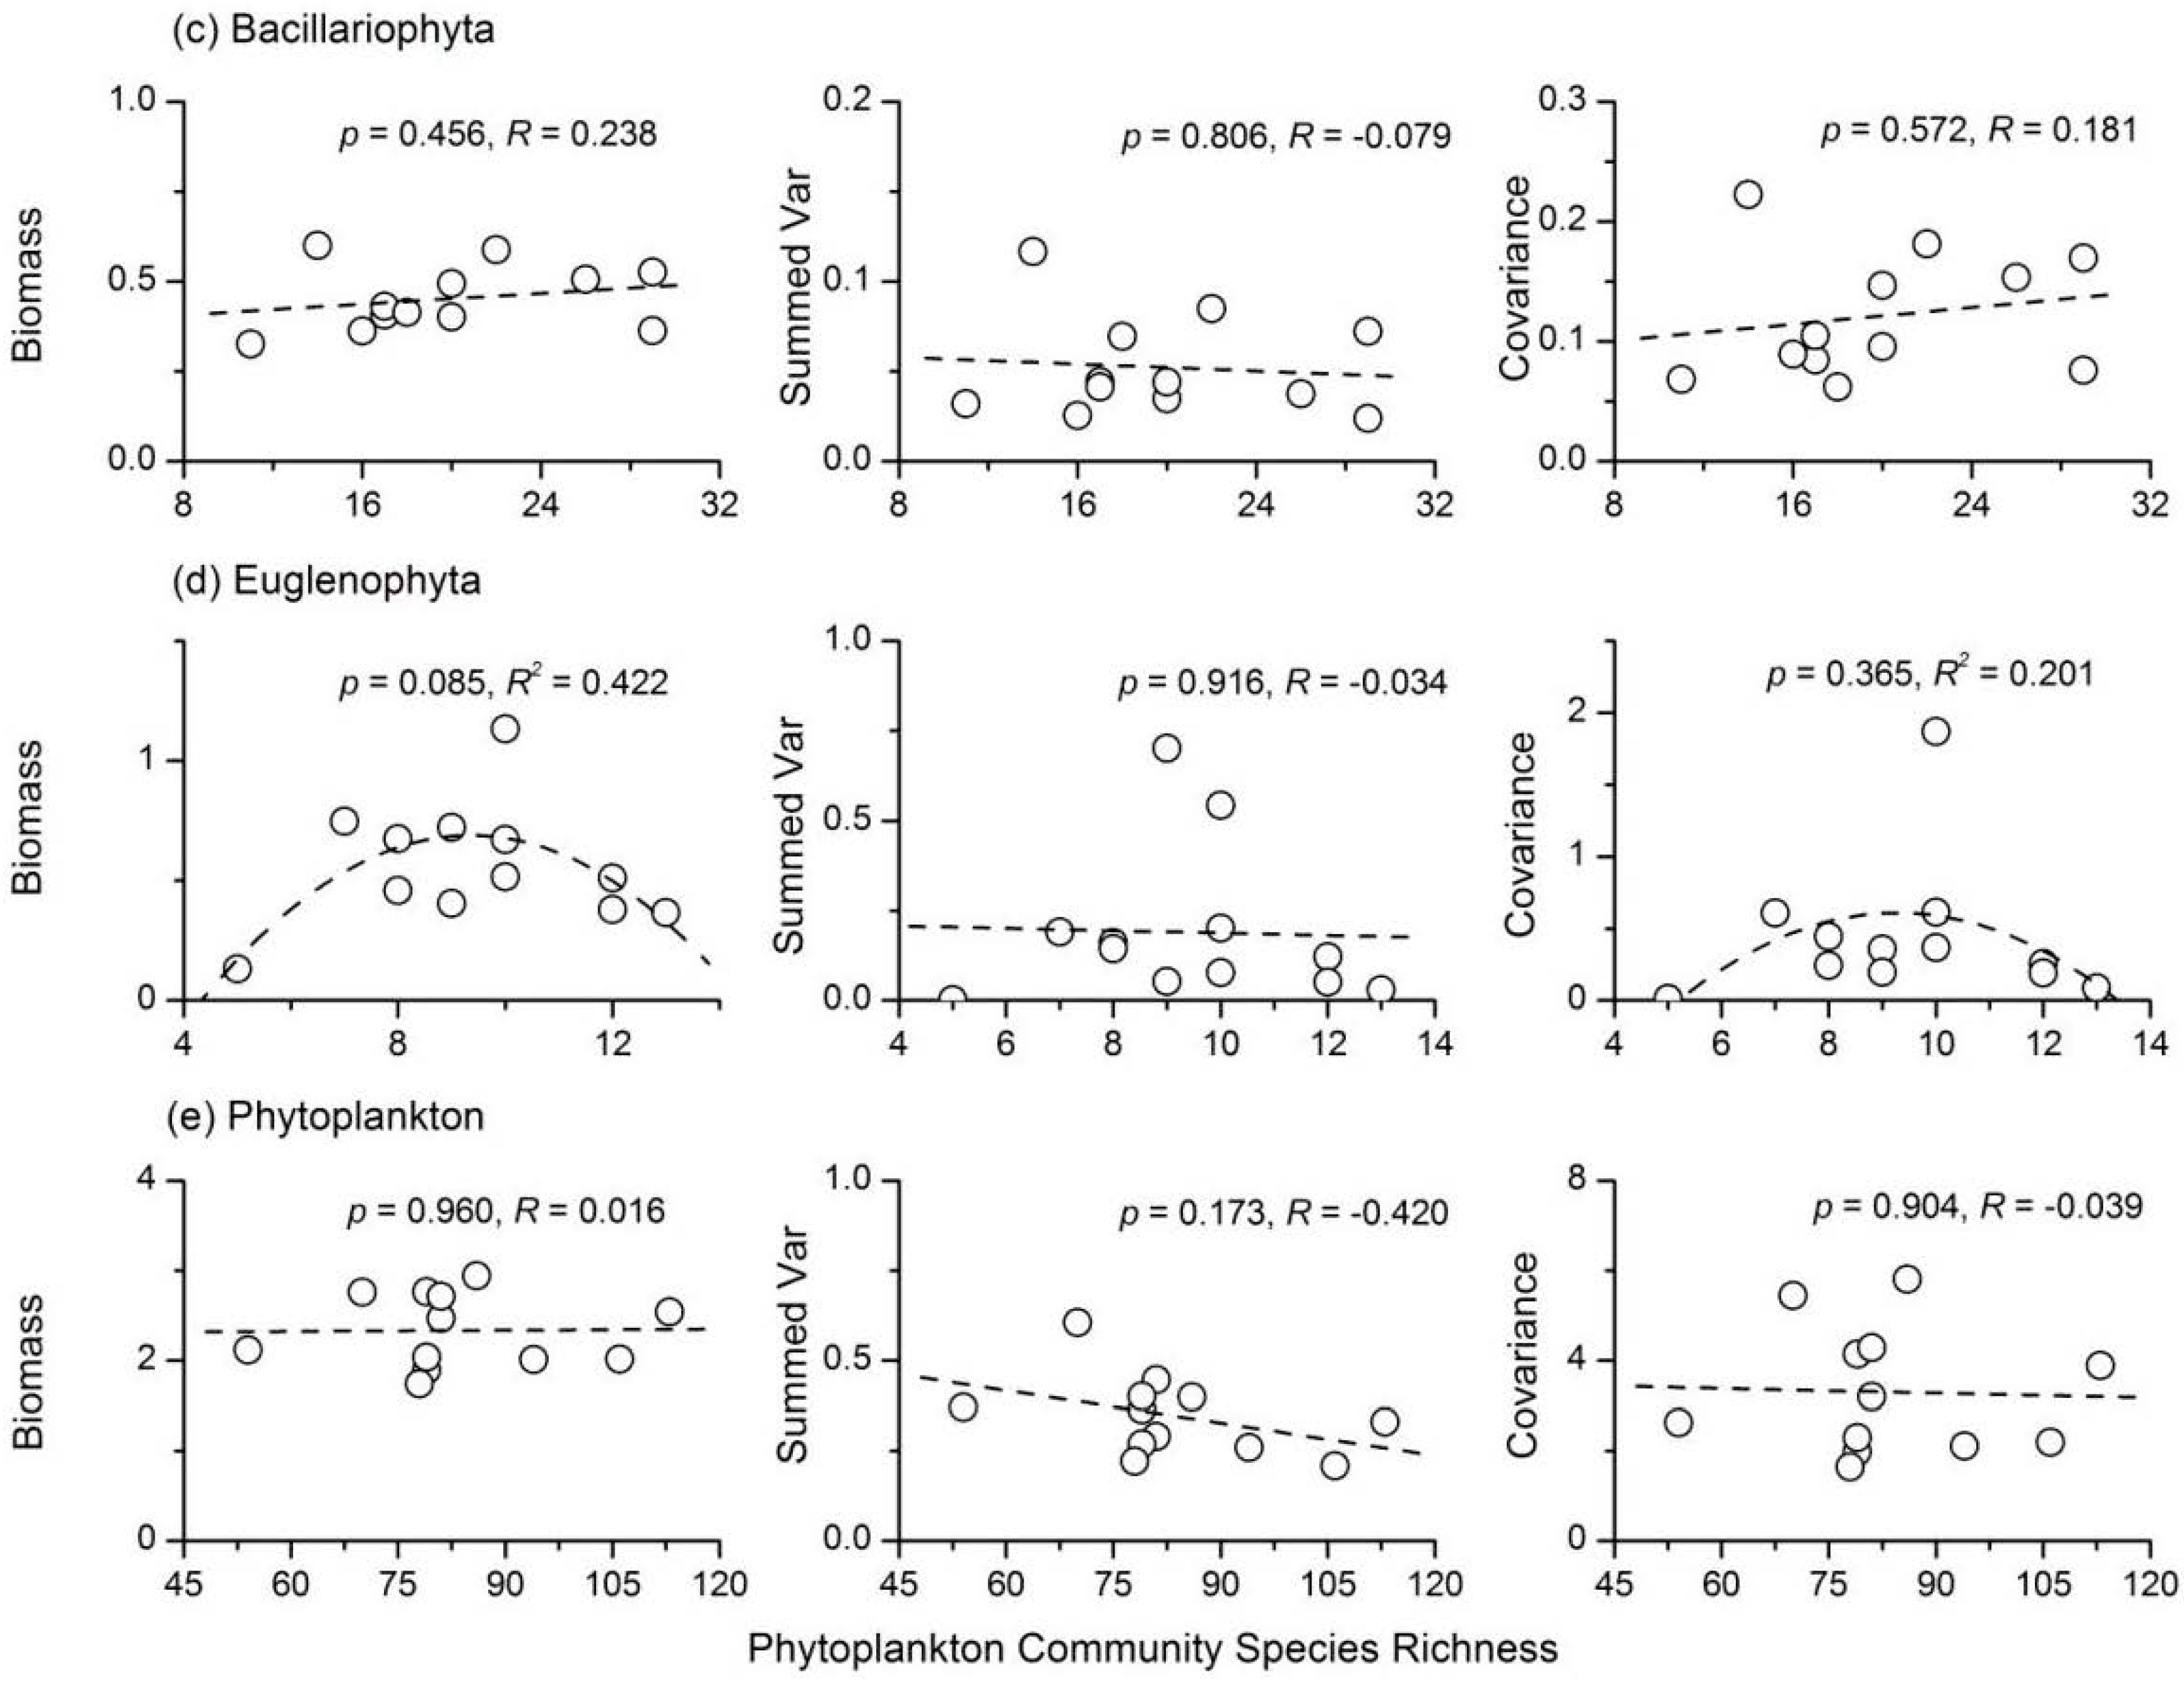
(3)
There were complex relationships between species richness and temporal stability of different phytoplankton taxa: a unimodal relationship for Cyanophyta and Bacillariophyta; a strong concave relationship for Euglenophyta; and no apparent relationship for Chlorophyta and total phytoplankton. The portfolio effect was the dominant mechanism; while the effects of overyielding and species asynchrony were relatively weak.
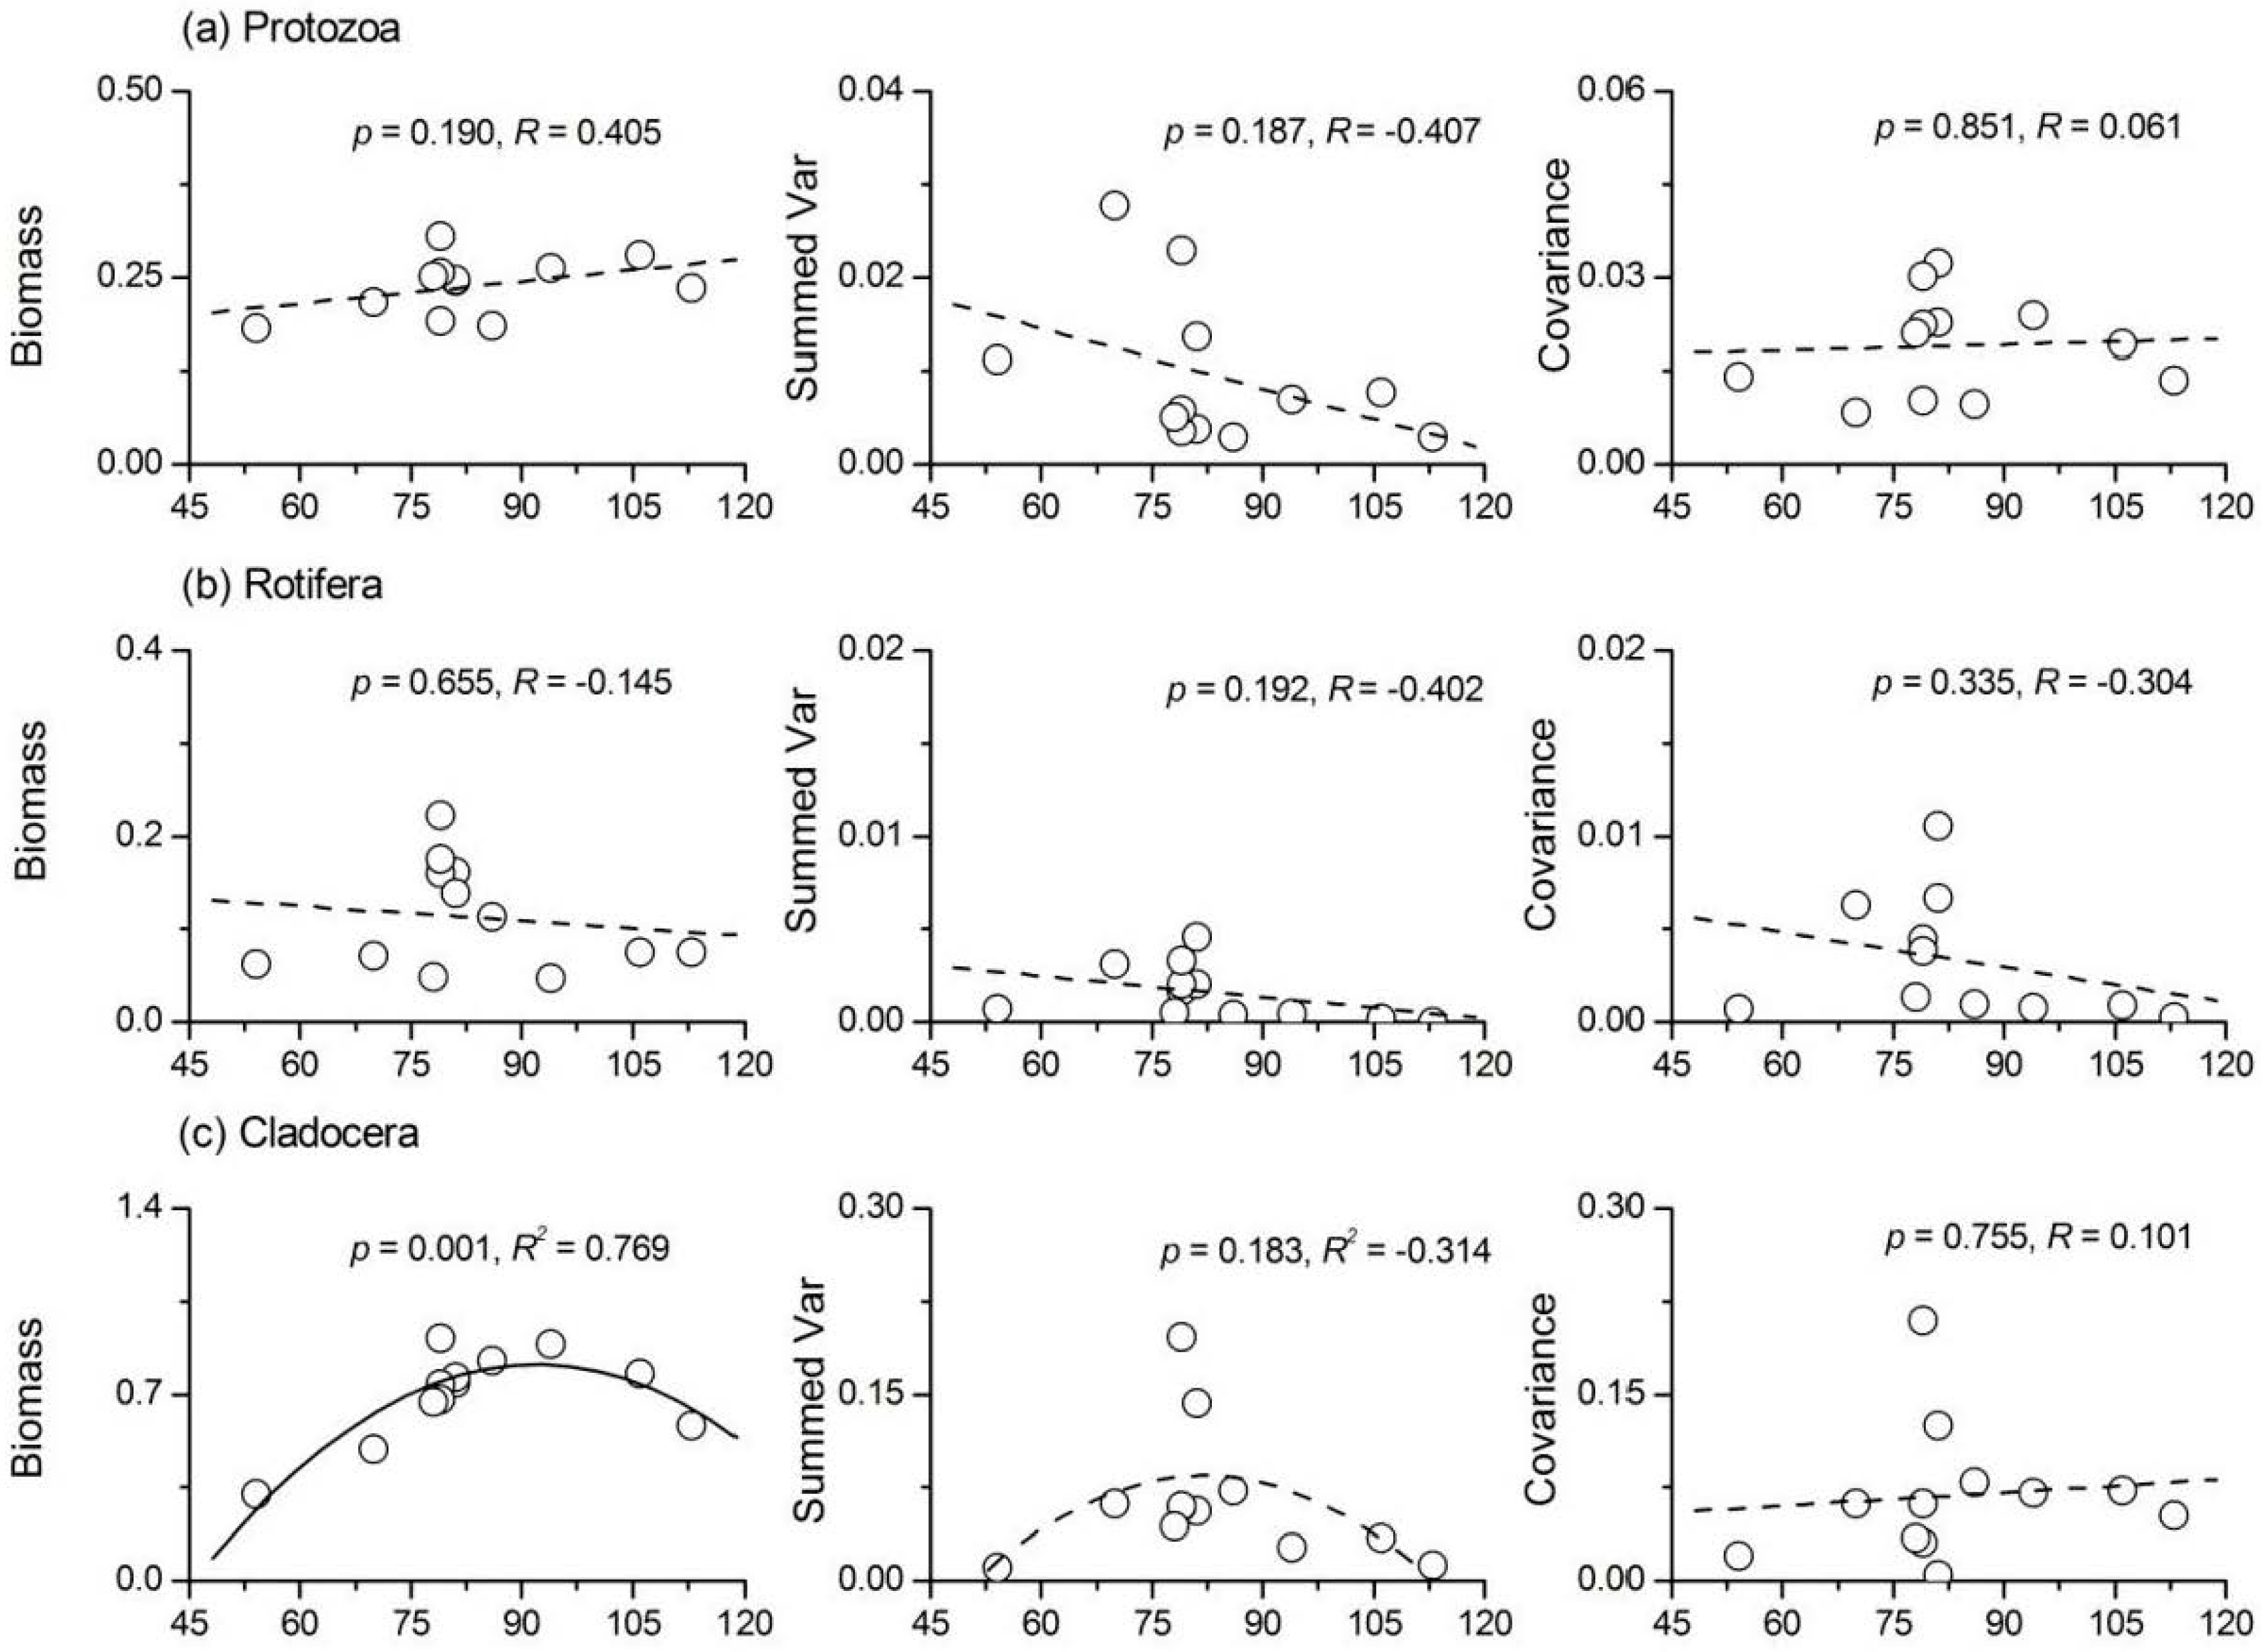
(4)
Phytoplankton species richness had a significant positive influence on the temporal stability indices of protozoa, Rotifera and total zooplankton, while its influence on Cladocera and copepods was not significant. ‘Trophic overyielding’ and a weak ‘trophic portfolio effect’ were the main mechanisms involved, whereas the effect of ‘trophic species asynchrony’ was relatively weak.
The results of the present study will be helpful in understanding the influence of phytoplankton diversity on community stability within and across trophic levels.

Acknowledgments

We would thank Jian Zhang and Mingsheng Miao for their helpful works in field investigations. We extend our thanks to Anne Jeanette Burke and Tornillo Scientific for the assistance in language editing. AuthorAid kindly enabled us to contact a native English speaker for assistance with our text. This study was financially supported by the National Special Water Programs (No. 2009ZX07210-009, No. 2015ZX07203-011, No. 2015ZX07204-007) and the Department of Environmental Protection of Shan Dong Province (SDHBPJ-ZB-08, Investigating and evaluating ecological security of Lake Nansihu).

Author Contributions

Huayong Zhang and Wang Tian were responsible for the research design. Wang Tian, Lei Zhao and Xiang Xu analyzed the data and prepared the figures. Wang Tian drafted the main text. All authors were participated in discussions and editing.

Conflicts of Interest

The authors declare no conflict of interest.

References

  1. Cardinale, B.J.; Duffy, J.E.; Gonzalez, A.; Hooper, D.U.; Perrings, C.; Venail, P.; Narwani, A.; Mace, G.M.; Tilman, D.; Wardle, D.A.; et al. Biodiversity loss and its impact on humanity. Nature 2012, 486, 59–67. [Google Scholar] [CrossRef] [PubMed]
  2. Narwani, A.; Mazumder, A. Bottom-up effects of species diversity on the functioning and stability of food webs. J. Anim. Ecol. 2012, 81, 701–713. [Google Scholar] [CrossRef] [PubMed]
  3. Hooper, D.U.; Adair, E.C.; Cardinale, B.J.; Byrnes, J.E.; Hungate, B.A.; Matulich, K.L.; Gonzalez, A.; Duffy, J.E.; Gamfeldt, L.; O’Connor, M.I. A global synthesis reveals biodiversity loss as a major driver of ecosystem change. Nature 2012, 486, 105–108. [Google Scholar] [CrossRef] [PubMed]
  4. Thompson, I.D.; Okabe, K.; Parrotta, J.A.; Brockerhoff, E.; Jactel, H.; Forrester, D.I.; Taki, H. Biodiversity and ecosystem services: Lessons from nature to improve management of planted forests for REDD-plus. Biodivers. Conserv. 2014, 23, 2613–2635. [Google Scholar] [CrossRef]
  5. Ptacnik, R.; Solimini, A.G.; Andersen, T.; Tamminen, T.; Brettum, P.; Lepistö, L.; Willén, E.; Rekolainen, S. Diversity predicts stability and resource use efficiency in natural phytoplankton communities. Proc. Natl. Acad. Sci. USA 2008, 105, 5134–5138. [Google Scholar] [CrossRef] [PubMed]
  6. Filstrup, C.T.; Hillebrand, H.; Heathcote, A.J.; Harpole, W.S.; Downing, J.A. Cyanobacteria dominance influences resource use efficiency and community turnover in phytoplankton and zooplankton communities. Ecol. Lett. 2014, 17, 464–474. [Google Scholar] [CrossRef] [PubMed]
  7. Giller, P.S.; Hillebrand, H.; Berninger, U.G.; Gessner, M.O.; Hawkins, S.; Inchausti, P.; Inglis, C.; Leslie, H.; Malmqvist, B.; Monaghan, M.T.; et al. Biodiversity effects on ecosystem functioning: Emerging issues and their experimental test in aquatic environments. Oikos 2004, 104, 423–436. [Google Scholar] [CrossRef]
  8. Weyhenmeyer, G.A.; Peter, H.; Willen, E. Shifts in phytoplankton species richness and biomass along a latitudinal gradient-consequences for relationships between biodiversity and ecosystem functioning. Freshw. Biol. 2013, 58, 612–623. [Google Scholar] [CrossRef]
  9. Pimm, S.L. The complexity and stability of ecosystems. Nature 1984, 307, 321–326. [Google Scholar] [CrossRef]
  10. Ives, A.R.; Carpenter, S.R. Stability and diversity of ecosystems. Science 2007, 317, 58–62. [Google Scholar] [CrossRef] [PubMed]
  11. Donohue, I.; Petchey, O.L.; Montoya, J.M.; Jackson, A.L.; McNally, L.; Viana, M.; Healy, K.; Lurgi, M.; O’Connor, N.E.; Emmerson, M.C. On the dimensionality of ecological stability. Ecol. Let. 2013, 16, 421–429. [Google Scholar] [CrossRef] [PubMed]
  12. Tilman, D.; Reich, P.B.; Knops, J.M. Biodiversity and ecosystem stability in a decade-long grassland experiment. Nature 2006, 441, 629–632. [Google Scholar] [CrossRef] [PubMed]
  13. Tilman, D. The ecological consequences of changes in biodiversity: A search for general principles. Ecology 1999, 80, 1455–1474. [Google Scholar] [CrossRef]
  14. Venail, P.A.; Alexandrou, M.A.; Oakley, T.H.; Cardinale, B.J. Shared ancestry influences community stability by altering competitive interactions: Evidence from a laboratory microcosm experiment using freshwater green algae. Proc. Roy. Soc. B Biol. Sci. 2013, 280, 20131548. [Google Scholar] [CrossRef] [PubMed]
  15. Thibaut, L.M.; Connolly, S.R. Understanding diversity-stability relationships: Towards a unified model of portfolio effects. Ecol. Lett. 2013, 16, 140–150. [Google Scholar] [CrossRef] [PubMed]
  16. Gonzalez, A.; Descamps-Julien, B. Population and community variability in randomly fluctuating environments. Oikos 2004, 106, 105–116. [Google Scholar] [CrossRef]
  17. Sommer, U.; Gliwicz, Z.M.; Lampert, W.; Duncan, A. The PEG-model of seasonal succession of planktonic events in fresh waters. Arch. Hydrobiol. 1986, 106, 433–471. [Google Scholar]
  18. Litchman, E.; Klausmeier, C.A. Trait-based community ecology of phytoplankton. Annu. Rev. Ecol. Evol. Syst. 2008, 39, 615–639. [Google Scholar] [CrossRef]
  19. Tilman, D.; Lehman, C.L.; Bristow, C.E. Diversity-stability relationships: Statistical inevitability or ecological consequence? Am. Nat. 1998, 9, 277–282. [Google Scholar] [CrossRef] [PubMed]
  20. Cardinale, B.J.; Wright, J.P.; Cadotte, M.W.; Carroll, I.T.; Hector, A.; Srivastava, D.S.; Loreau, M.; Weis, J.J. Impacts of plant diversity on biomass production increase through time because of species complementarity. Proc. Natl. Acad. Sci. USA 2007, 104, 18123–18128. [Google Scholar] [CrossRef] [PubMed]
  21. Isbell, F.I.; Polley, H.W.; Wilsey, B.J. Biodiversity, productivity and the temporal stability of productivity: Patterns and processes. Ecol. Lett. 2009, 12, 443–451. [Google Scholar] [CrossRef] [PubMed]
  22. Yachi, S.; Loreau, M. Biodiversity and ecosystem productivity in a fluctuating environment: The insurance hypothesis. Proc. Natl. Acad. Sci. USA 1999, 96, 1463–1468. [Google Scholar] [CrossRef] [PubMed]
  23. Downing, A.L.; Leibold, M.A. Species richness facilitates ecosystem resilience in aquatic food webs. Freshw. Biol. 2010, 55, 2123–2137. [Google Scholar] [CrossRef]
  24. Tilman, D.; Downing, J.A. Biodiversity and stability in grasslands. Nature 1994, 367, 363–365. [Google Scholar] [CrossRef]
  25. Dodd, M.E.; Silvertown, J.; Mcconway, K.; Potts, J.; Crawley, M. Stability in the plant communities of the park grass experiment: The relationships between species richness, soil pH and biomass variability. Philos. Trans. R. Soc. B 1994, 346, 185–193. [Google Scholar] [CrossRef]
  26. Naeem, S.; Li, S. Biodiversity enhances ecosystem reliability. Nature 1997, 390, 507–509. [Google Scholar] [CrossRef]
  27. Corcoran, A.A.; Boeing, W.J. Biodiversity increases the productivity and stability of phytoplankton communities. PLoS ONE 2012, 7. [Google Scholar] [CrossRef] [PubMed]
  28. McGrady-Steed, J.; Harris, P.M.; Morin, P.J. Biodiversity regulates ecosystem predictability. Nature 1997, 390, 162–165. [Google Scholar]
  29. Zhang, Q.G.; Zhang, D.Y. Species richness destabilizes ecosystem functioning in experimental aquatic microcosms. Oikos 2006, 112, 218–226. [Google Scholar] [CrossRef]
  30. Shurin, J.B.; Arnott, S.E.; Hillebrand, H.; Longmuir, A.; Pinel-Alloul, B.; Winder, M.; Yan, N.D. Diversity-stability relationship varies with latitude in zooplankton. Ecol. Lett. 2007, 10, 127–134. [Google Scholar] [CrossRef] [PubMed]
  31. Duffy, J.E.; Cardinale, B.J.; France, K.E.; McIntyre, P.B.; Thébault, E.; Loreau, M. The functional role of biodiversity in ecosystems: Incorporating trophic complexity. Ecol. Lett. 2007, 10, 522–538. [Google Scholar] [CrossRef] [PubMed]
  32. Striebel, M.; Singer, G.; Stibor, H.; Andersen, T. “Trophic overyielding”: Phytoplankton diversity promotes zooplankton productivity. Ecology 2012, 93, 2719–2727. [Google Scholar] [CrossRef] [PubMed]
  33. Root, R.B. Organization of a plant-arthropod association in simple and diverse habitats: The fauna of collards (Brassica oleracea). Ecol. Monogr. 1973, 43, 95–124. [Google Scholar] [CrossRef]
  34. Leibold, M.A. Resource edibility and the effects of predators and productivity on the outcome of trophic interactions. Am. Nat. 1989, 134, 922–949. [Google Scholar] [CrossRef]
  35. Holt, R.D.; Loreau, M. Biodiversity and Ecosystem Functioning: The Role of Trophic Interactions and the Importance of System Openness. In The Functional Consequences of Biodiversity, Empirical Progress and Theoretical Expectations; Kinzig, A.P., Pacala, S.W., Tilman, D., Eds.; Princeton University Press: Princeton, NJ, USA, 2002; pp. 246–262. [Google Scholar]
  36. Hillebrand, H.; Cardinale, B.J. Consumer effects decline with prey diversity. Ecol. Let. 2004, 7, 192–201. [Google Scholar] [CrossRef]
  37. Ciros-Pérez, J.; Ortega-Mayagoitia, E.; Alcocer, J. The role of ecophysiological and behavioral traits in structuring the zooplankton assemblage in a deep, oligotrophic, tropical lake. Limnol. Oceanogr. 2015, 60, 2158–2172. [Google Scholar] [CrossRef]
  38. Shu, F.Y.; Liu, Y.P.; Zhao, Y.; Wu, Y.P.; Li, A.H. Spatio-temporal distribution of TN and TP in water and evaluation of eutrophic state of Lake Nansi. Environ. Sci. 2012, 33, 3748–3752. (In Chinese) [Google Scholar]
  39. Zhang, Z.L.; Xin, L.J.; Liang, C.L. The analysis of hydrological characteristics and processes of ecosystem in Lake Nansi during the past 50 years. Geogr. Res. 2007, 26, 957–966. (In Chinese) [Google Scholar]
  40. Gong, J.X.; Duan, D.X.; Wang, Z.Z.; Du, X.H.; Zhang, J.L.; Liu, H.C.; Chen, J.P.; Sun, D. Research and Analysis on the Plankton of Nansi Lake. J. Yangtze Univ. Nat. Sci. Ed. 2010, 7, 39–42. (In Chinese) [Google Scholar]
  41. Wu, Z.H.; Zhang, K.; Jin, L.R.; Yang, L.K.; Zhang, J. Analysis of spatial distribution of water quality and assessment of water quality improvement in Nansi Lake. Water Resour. Prot. 2012, 28, 1–7. (In Chinese) [Google Scholar]
  42. Feng, Y.W.; Hou, K.; Pei, H.Y.; Hu, W.R.; Ren, Y.; Wei, J.L. Desmid community characteristics and its relationship with environmental variables in Nansi Lake and Dongping Lake. Chin. J. Ecol. 2015, 34, 1738–1746. (In Chinese) [Google Scholar]
  43. Arhonditsis, G.B.; Winder, M.; Brett, M.T.; Schindler, D.E. Patterns and mechanisms of phytoplankton variability in Lake Washington (USA). Water Res. 2004, 38, 4013–4027. [Google Scholar] [CrossRef] [PubMed]
  44. American Public Health Association (APHA); American Water Works Association (AWWA); Water Environment Federation (WEF). Standard Methods for the Examination of Water and Wastewater, 19th ed.; American Public Health Association: Washington, DC, USA, 1995. [Google Scholar]
  45. Sun, J.; Liu, D.Y.; Qian, S.B. Study on phytoplankton biomass I. Phytoplankton measurement biomass from cell volume or plasma volume. Acta Oceanol. Sin. 1999, 21, 75–85. (In Chinese) [Google Scholar]
  46. Zhang, H.; Cui, B.; Zhang, Z.; Fan, X. Species diversity and distribution for zooplankton in the inter-tidal wetlands of the Pearl River estuary, China. Procedia Environ. Sci. 2012, 13, 2383–2393. [Google Scholar]
  47. O’neil, J.M.; Davis, T.W.; Burford, M.A.; Gobler, C.J. The rise of harmful cyanobacteria blooms: The potential roles of eutrophication and climate change. Harmful Algae 2012, 14, 313–334. [Google Scholar] [CrossRef]
  48. Elser, J.J.; Goldman, C.R. Zooplankton effects on phytoplankton in lakes of contrasting trophic status. Limnol. Oceanogr. 1991, 36, 64–90. [Google Scholar] [CrossRef]
  49. Van Wichelen, J.; Van Gremberghe, I.; Vanormelingen, P.; Debeer, A.E.; Leporcq, B.; Menzel, D.; Codd, G.A.; Descy, J.P.; Vyverman, W. Strong effects of amoebae grazing on the biomass and genetic structure of a Microcystis bloom (Cyanobacteria). Environ. Microbiol. 2010, 12, 2797–2813. [Google Scholar] [CrossRef] [PubMed]
  50. Duffy, J.E. Biodiversity and ecosystem function: The consumer connection. Oikos 2002, 99, 201–219. [Google Scholar] [CrossRef]
  51. Jeppesen, E.; Jensen, J.P.; Søndergaard, M.; Lauridsen, T.; Landkildehuset, F. Trophic structure, species richness and biodiversity in Danish lakes: changes along a phosphorus gradient. Freshw. Boil. 2000, 45, 201–218. [Google Scholar] [CrossRef]
  52. Rodrigues, L.C.; Simões, N.R.; Bovo-Scomparin, V.M.; Jati, S.; Santana, N.F.; Roberto, M.C.; Train, S. Phytoplankton alpha diversity as an indicator of environmental changes in a neotropical floodplain. Ecol. Indic. 2015, 48, 334–341. [Google Scholar] [CrossRef]
Figure 1. Location of Lake Nansihu and the sample sites in the lake. This figure was generated using ArcGIS Version 10.0 (ESRI, Redlands, CA, USA).
Water 08 00454 g001
Figure 2. Mean values of the main environmental factors at different sites; the error bars are the standard deviations of data from different seasons. (a) Water temperature; (b) dissolved oxygen; (c) pH; (d) water transparency; (e) total nitrogen; and (f) total phosphorus.
Water 08 00454 g002
Figure 3. The biomasses of (a) phytoplankton and (b) zooplankton in different seasons from 2011 to 2014. Spr: spring, Sum: summer, Aut: autumn, Win: winter.
Water 08 00454 g003
Figure 4. The stability indices of (a) phytoplankton and (b) zooplankton taxa at the 12 sample sites. TSI, temporal stability indices.
Water 08 00454 g004
Figure 5. Diversity-stability relationships of (a) Cyanophyta; (b) Chlorophyta; (c) Bacillariophyta; (d) Euglenophyta and (e) total phytoplankton.
Water 08 00454 g005
Figure 6. Relationships between species richness and the three components of community stability for (a) Cyanophyta; (b) Chlorophyta; (c) Bacillariophyta; (d) Euglenophyta and (e) total phytoplankton.
Water 08 00454 g006aWater 08 00454 g006b
Figure 7. Relationships between phytoplankton species richness and the stability of (a) protozoa; (b) rotifer; (c) Cladocera; (d) copepods and (e) zooplankton stability.
Water 08 00454 g007
Figure 8. Relationships between phytoplankton species richness and the three components of community stability for (a) protozoa; (b) rotifer; (c) Cladocera; (d) copepods and (e) total zooplankton.
Water 08 00454 g008aWater 08 00454 g008b

