Article

Evaluating the Water Footprint of the Mediterranean and American Diets

by
Alejandro Blas
1,2,*,
Alberto Garrido
1,2 and
Bárbara A. Willaarts
1,2
1
Water Observatory of the Botin Foundation, Madrid 28001, Spain
2
Research Center for the Management of Environmental and Agricultural Risks (CEIGRAM), Universidad Politécnica de Madrid, Madrid 28040, Spain
*
Author to whom correspondence should be addressed.
Water 2016, 8(10), 448; https://doi.org/10.3390/w8100448
Submission received: 29 July 2016 / Revised: 20 September 2016 / Accepted: 8 October 2016 / Published: 13 October 2016
(This article belongs to the Special Issue Water Footprint Assessment)

Abstract

:
Global food demand is increasing rapidly as a result of multiple drivers including population growth, dietary shifts and economic development. Meeting the rising global food demand will require expanding agricultural production and promoting healthier and more sustainable diets. The goal of this paper is to assess and compare the water footprint (WF) of two recommended diets (Mediterranean and American), and evaluate the water savings of possible dietary shifts in two countries: Spain and the United States (US). Our results show that the American diet has a 29% higher WF in comparison with the Mediterranean, regardless of products’ origin. In the US, a shift to a Mediterranean diet would decrease the WF by 1629 L/person/day. Meanwhile, a shift towards an American diet in Spain will increase the WF by 1504 L/person/day. The largest share of the WF of both diets is always linked to green water (62%–75%). Grey water in the US is 67% higher in comparison with Spain. Only five products account for 36%–46% of the total WF of the two dietary options in both countries, being meat, oil and dairy products the food items with the largest WFs. Our study demonstrates that adopting diets based on a greater consumption of vegetables, fruits and fish, like the Mediterranean one, leads to major water savings.

1. Introduction

World population will reach 9 billion by 2050 and global food production will have to increase between 70% and 100% [1]. Meeting the future food demand is a major challenge for the current food production systems, and even more doing it without compromising the environmental integrity [2]. Converting more land into cultivation and increasing crop yields have been largely promoted as key solutions to increase food production globally [3,4]. These production-oriented policies explain why global agricultural area has expanded over 11% since 1960 [5], and cereal crop production has almost doubled [4].
However, the increasing competition for land, water and energy [6], as well the multiple impacts agriculture has on the environment, require rethinking possible approaches to face the daunting challenge of satisfying increasing food demand within a resource-constrained planet. Many of the currents efforts are placed in increasing the sustainability of food production through so-called “sustainable intensification”, which will require improving water use or nitrogen-phosphorus’ efficiency, implementing ecological-based management practices, judicious use of pesticides, and also reconverting much of the livestock production practices [4].
But beyond any productivity improvements, enhancement of consumption patterns and the promotion of healthier and sustainable diets will be of major importance to achieve positive environmental effects [7,8]. Recently several studies have analyzed and recognized the importance of diets in future food security and sustainability [9,10,11]. The literature shows that larger environmental impacts originate from animal products-based diets in comparison to less meat-based and vegetarian diets [8,9,11,12,13,14]. Jalava et al. [9] compared the current global consumption patterns with diets containing low contents of animal products, and found that lower intake of animal products lead to important water savings, i.e., lower water footprint.
In the course of the last decades, several methodologies, including the water footprint assessment (WFA) [15], and the life cycle analysis (LCA) [16], have been developed to assess the impacts on water resources linked to food production and consumption patterns. Both approaches involve several-step process and the suitability of one over the other very much depends on the project goal. WFA is a suitable approach particularly when the overall purpose of the assessment is to identify options for water savings, reallocation and better management, and also in order to raise awareness about water issues [16]. A WFA involves four steps: (1) definition of the scope and goals of the assessment; (2) water accounting; (3) sustainability assessment; and (4) response formulation. There is ample literature exemplifying the usefulness of WFAs [17,18,19,20,21]. As opposed to the WFA, the LCA is more suitable when the goal is to evaluate the environmental impacts linked to different human activities, where water use is one among many different impacts that can be assessed [16]. LCA also involves four steps: (1) definition of the goal and scope; (2) inventory; (3) impact assessment and (4) interpretation. Organizations like the FAO have adopted the LCA methodology and the associated ISO 14046 [22], within its environmental sustainability program.
Both the WFA and the LCA rely in the use of quantitative indicators (e.g., the water footprint), although in different phases of the assessment [16]. Several authors have compared both methodologies [16,23], and applied them to different food products, such as tomato sauce [24], tea and margarine [25], biomass production from energy crops [26], or broccoli [27] to assess the advantages and disadvantages of each one.
A large number of the studies addressing the issue of diets and water impacts relied in the methodology proposed by the WFA. Vanham et al. [12], compared the water footprint (WF) of current consumption patterns with healthier and vegetarian diets in Europe, and found that improving diets might result in reductions of the diet’s WF between 974 and 1611 L per person and day, equivalent to savings of 23%–38%. These authors also concluded that the consumption of animal products accounts for the largest share (46%) of the WF linked to the prevailing diets in Europe. Other studies comparing three European diets (current, healthy and vegetarian) across four European areas (west, north, south and east) showed that in all zones adopting healthy and vegetarian diets could lead to substantial WF reductions (up to 41%) [13]. Similar results have been obtained in other studies comparing different diets and dietary patterns at the country [11,14,28] and city level [29,30].
In much of the developed world, dietary shifts are causing important health problems [8]. This circumstance is driving national health and/or food agencies to campaign in favor of investing public funds to raise awareness among citizens about the importance of adopting healthier food habits. Countries like Spain are placing large efforts to reverse the growing obesity problems and involving different public institutions in the promotion of the Mediterranean diet [31,32]. In fact the Mediterranean diet has been recognized in many countries as a key strategy to improve a population’s health with local, traditional and seasonal products [31,33]. Also, it has been recognized by UNESCO as a cultural World Heritage [34], and was selected by the UN Food Agricultural Organization (FAO) to develop a methodological approach to assess sustainability across different agro-ecological zones [35]. In fact, the Mediterranean diet is appreciated for its lower environmental impacts in relation with other meat-based diets [32,36].
Other countries facing serious obesity problems, like the United States of America (US), are also investing large efforts to reverse this trend [37]. In fact, the United States Department of Agriculture (USDA) in an attempt to raise awareness among consumers has elaborated several national dietary guidelines and recommended diets [37,38].
Yet, most of the studies published addressing the composition of diets and associated water savings are focused on making comparisons between different dietary patterns obtained from current consumption patterns of annual statistics, like the food balance sheets of FAO [39]. Little work has been done to compare real, local or seasonal recommended diets. Comparing recommended diets, elaborated with national and traditional recipes, dishes and products, can provide insightful results about the relationship between real consumption patterns and environmental effects, and the ingredients that generate the largest water savings.
Accordingly, the main objective of this paper is to assess the WF of two contrasting and recommended food diets, i.e., the Mediterranean and American, and to evaluate the water savings of possible dietary shifts in the two countries (Spain and US). Also, we attempt to deepen in the understanding of the relationship between products origin and consumption patterns, and their influence on the total WF and the diet’s sustainability.

2. Materials and Methods

2.1. Menus and Diets Configuration

To characterize the composition and product quantities of the Mediterranean diet, two seasonal weeklong menus were defined (i.e., winter and summer) using the food guidelines elaborated by the Mediterranean Diet Foundation [40]. Each week menu included four daily meals: breakfast, morning snack, lunch and dinner. Dishes and product composition of each meal, as well as recommended daily intake quantities of each product were defined using traditional Mediterranean recipes (see Tables S1 and S2). The winter menu (Menu 1) was configured with winter seasonal products, whereas the summer menu (Menu 2) in the Mediterranean diet was configured with seasonal summer products. In total, over 116 products have been included in the elaboration of the two menus.
The American recommended diet (USDAr) was configured following the guidelines of the Center for Nutrition Policy and Promotion (CNPP) of the US Department of Agriculture [38] and the study by Haven et al. [37]. As with the Mediterranean diet, two weeklong menus (Menu 1 and Menu 2) were configured, each one containing four daily meals (breakfast, morning snack, lunch and dinner). No differences between menus in terms of seasonal products could be made with the USDAr. Recipes, product composition and weights for the two American menus were also defined using traditional recipes from the US (Tables S3 and S4). Overall, 103 products were included in the elaboration of the USDAr diet.

2.2. Water Footprint Calculation

2.2.1. Recommended Diets

We used the WFA approach, and particularly we focused on phase two (i.e., water accounting), to assess the water embedded in each menu and diet. Specifically we calculated the water footprint (WF) per person per day of the Mediterranean and USDAr diets as defined in the Global Water Footprint Standard [15].
The WF of a product is understood as the direct and indirect appropriation of freshwater resources required to produce the good, this being the final result the sum of three components: green, blue and grey [41]. Green WF refers to the rainwater stored in the soils and directly evapotranspired by crop products. The blue WF refers to the volume of surface and groundwater embedded in the production of a good. In agriculture, the blue WF refers to the total volume of irrigated water that is evapotranspired by a crop, and embedded in the production of livestock products. Finally, grey WF is an indicator of water quality degradation, and refers to the volume of freshwater required to assimilate the load of pollutants generated along the production chain of a product, in order to reach the quality standards established in the environmental regulations [15]. The WF of a product is the sum of all the water consumed along its different production steps [41]. When calculating the WF of a diet, we have only considered the amount of water consumed in the production of each food item, without considering additional water requirements for cooking purposes (e.g., boiling, washing, etc.). This assumption was made due to the lack of detailed data regarding the amount of household water used for cooking and the fact that the largest fraction of the WF of food products lies at the field level, i.e., agricultural production [20].
To estimate the WF of the different weeklong menus we relied in the global WF database of crops [41], and livestock products [42]. Both databases provide average values of green, blue and grey WF of each product (in m3/t or L/kg) for the time series 1996–2005.
Considering the impossibility of determining the origin of all consumed products, we used national values to estimate the WF of the different menus. We estimated the WF of the Mediterranean diet assuming that all products consumed are produced in Spain, whereas for the USDAr we assumed that all products have been produced in the US. Products like coffee, cocoa, pineapple, pepper, cinnamon and mustard are not produced in either of the two countries and therefore they need to be imported. The WF of each imported product was calculated at the weighted average of the WF this product has in the main producer countries from which Spain and the US import them. The weighting factor is calculated based on the ratio of imports by origin of the product in each of the two countries (i.e., Spain and US). For instance the WF of coffee consumed in Spain was estimated as a weighted average of the WF coffee has in the major production centers from which Spain imports this product (i.e., Vietnam (40%), Brazil (50%) and Colombia (10%)). To define the origin of each imported product we used trade matrix from FAOSTAT [5], for the time series 1993–2013.
For each imported product in Spain, we used the following countries’ WF data: Coffee, data from Vietnam (40%), Brazil (50%) and Colombia (10%); Cocoa, data from Ivory Coast (50%), Ghana (30%) and Indonesia (20%); Pineapple, data from Costa Rica (100%); Pepper, data from Vietnam (60%), Indonesia (30%) and India (20%); Cinnamon, data from Indonesia (50%) and China (50%); and Mustard, data from Canada (100%).
Regarding products imported into the US, we used the following countries’ WF data: pepper, cinnamon and cocoa as in Spain (same WF values); vanilla, data from Indonesia (60%) and Madagascar (40%); cilantro/parsley/sesame, data from the UK (50%) and Russia (50%); clove, data from Indonesia (100%); and nutmeg, data from Guatemala (50%) and Indonesia (50%).
Lastly, saltwater fish and seafood (i.e., hake, tuna, sea bass, megrim, squid, mussels, cod, octopus, salmon, trout, shrimps and sardines) were assigned a WF equivalent to zero, since this study only evaluates the WF of raw products and does not include the water requirements for cooking. Other studies have calculated the fish WF but most of them refer to aquaculture production [43].
Hence, the daily WF of a menu k (WFmenu, in liters per person and day) was calculated as:
WF menu   k = j = 1 n ( Green   WF j + Blue   WF j + Grey   WF j ) × W j / 7
where (Green WFj + Blue WFj + Grey WFj) is the total WF of a product j (in L/kg) and Wj is the average intake per person and week (in kg per person). Accordingly, the average WF of a diet i (WFdiet, in liters per person and day) was estimated as:
WF diet   i = K = 1 2 ( WF menu   k ) / 2
To discern the relative weight that the different products have in the WFdiet (the 116 products identified in the Mediterranean menus and the 103 of the two American menus), we grouped them into 11 different food groups: (1) meat, fish and animal fats; (2) dairy products; (3) oil and vegetable fats; (4) legumes and nuts; (5) cereals and potatoes; (6) eggs; (7) vegetables; (8) sugar; (9) cocoa, chocolate and vanilla; (10) fruits and (11) drink and others.

2.2.2. Impacts of Shifting Diets
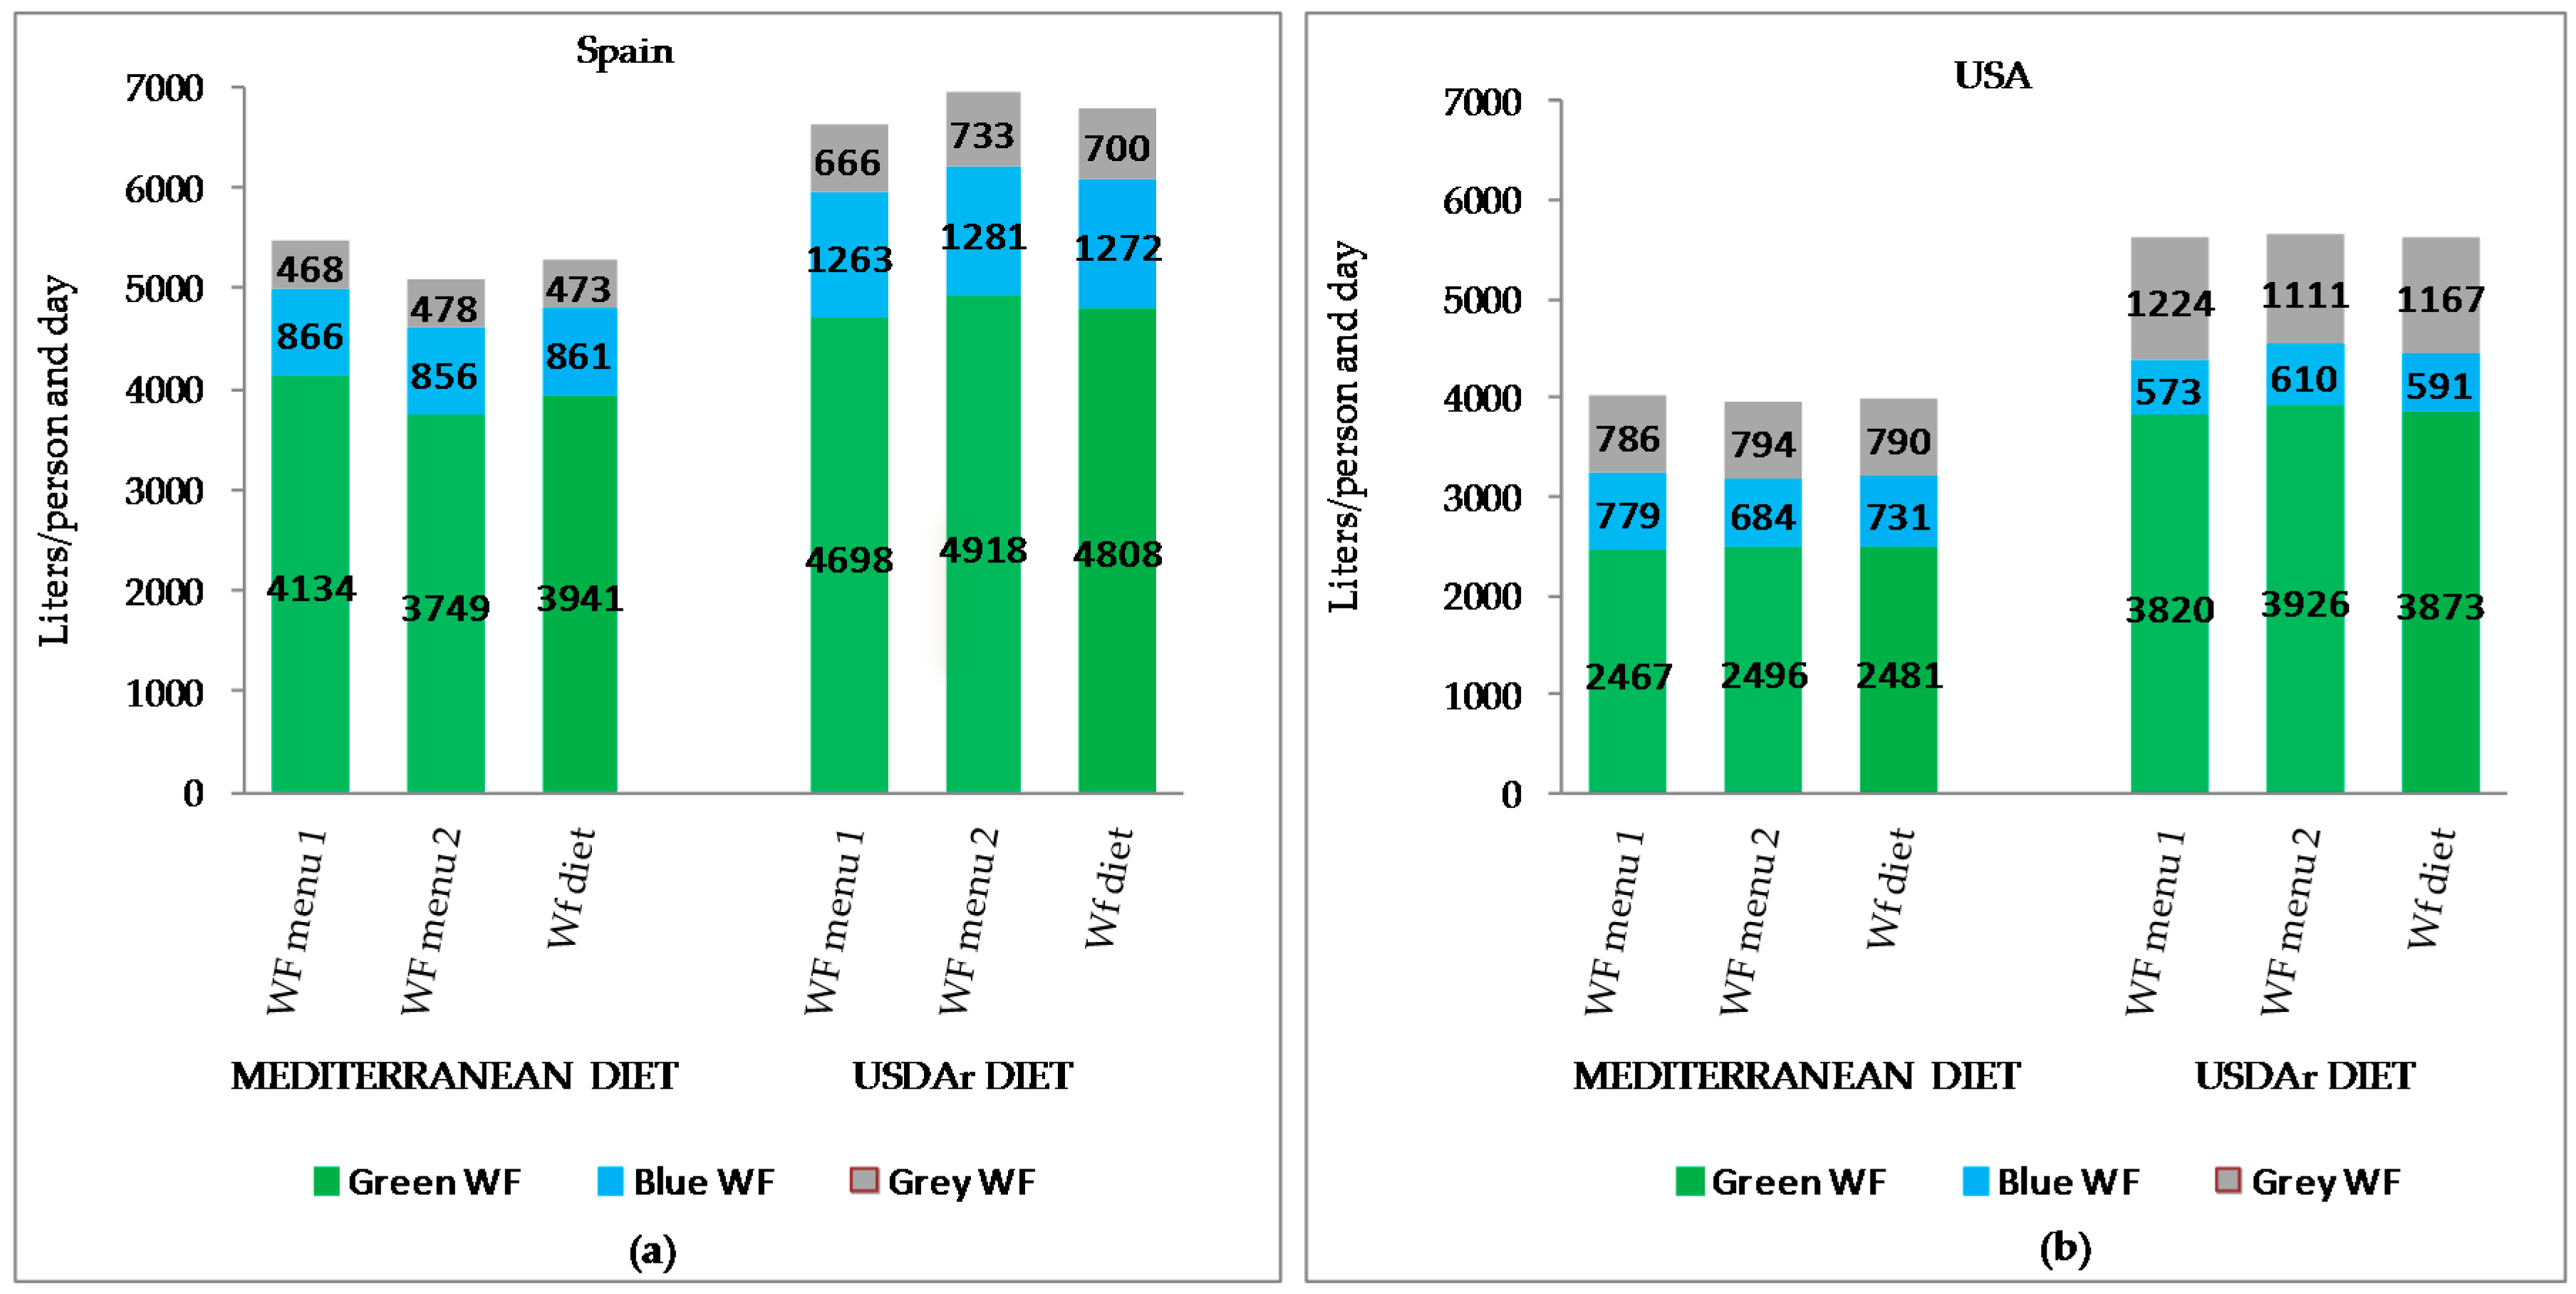
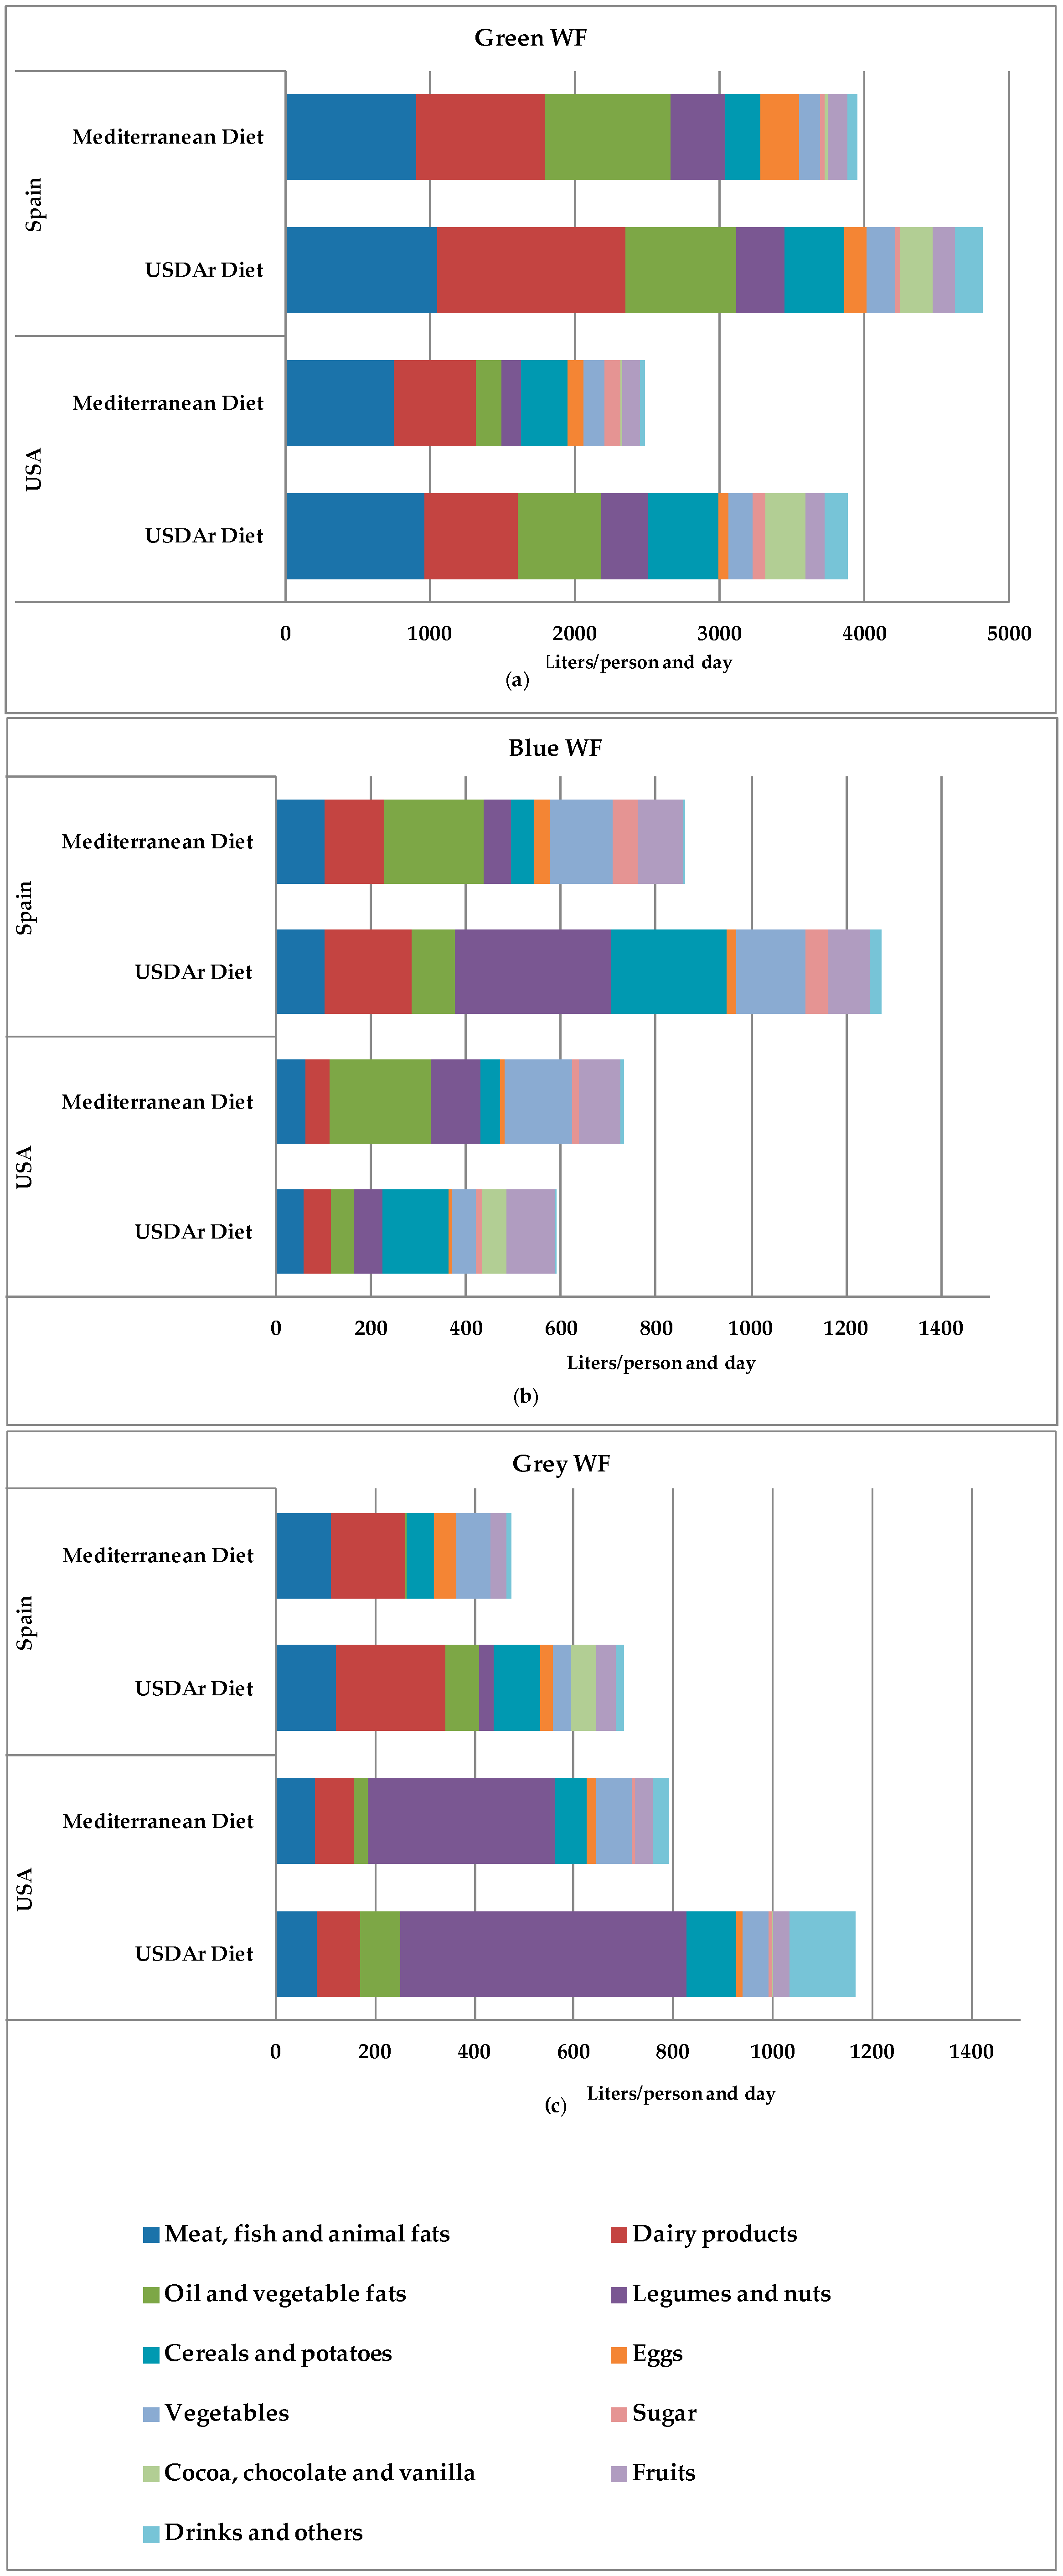
To assess the water impacts of changing diets we also estimated the WFdiet associated to a potential shift in the diets in the two countries—i.e., Spain adopting an American diet and the US adopting a Mediterranean diet. We assumed that all consumed products are also produced nationally, except for those products that are not produced in either of the two countries and need to be imported. Again, we relied on the WF databases of agricultural [41] and livestock products [42] to estimate the WFdiet.

3. Results

The WFmenu and WFdiet of the recommended Mediterranean and USDAr diets, as well as the potential shift in dietary habits, are shown in Figure 1 for Spain (a) and the US (b). The WFmenu and WFdiet of USDAr diet are higher than the Mediterranean diet, irrespectively of the products’ origin (Spain or US).
In Spain, the WFdiet of the Mediterranean diet is 5276 L per person and day, but adopting a USDAr diet will increase the WFdiet nearly 29%, up to 6780 L per person and day. The majority of this increase results from the rise in green water, followed by blue water, and to a lesser extend grey water. In the US, the WFdiet of the USDAr is 5632 L per person and day. Shifting towards a Mediterranean diet (4003 L per person and day), will decrease the WFdiet by 29%. Larger savings will be achieved in terms of green water (−1392 L/person and day) and grey water. However, in this diet-shift scenario blue WF will increase by 24%.
Green WF accounted for the largest share of both WFmenu and WFdiet in the two countries. In Spain, green WF contributes to 75% of WFdiet for the Mediterranean diet and 71% for the USDAr diet. In the US, green WF accounted for 62% of WFdiet in the Mediterranean and 69% in the USDAr diet. Blue WF was the second largest fraction in WFdiet in Spain for both Mediterranean (16%) and USDAr diet (19%). On the other hand, grey WF accounted for the second largest fraction of WFdiet in the US for Mediterranean (20%) and USDAr diets (21%).
If we took into account only the blue and green WF components of WFmenu and WFdiet, in order to discern the impacts of water resources quantity, there would be water savings equivalent to 1277 L per person and day in Spain by consuming a Mediterranean diet instead of a USDAr diet. Similar values were obtained in the US for green and blue WFs, where changing from a USDAr to a Mediterranean diet will imply a net reduction of 1252 L of water per person and day.
Comparing the WFdiet in the two different countries for the same diet revealed that, while the Mediterranean diet is more efficient in terms of water consumption in all cases, adopting a Mediterranean diet in the US would deliver greater water savings (up to 24% or 1273 L per person and day in comparison with the same diet consumed in Spain). This is due to the greater water productivity of the US’s agriculture. On the other hand, USDAr diet in Spain will increase the WFdiet 20% (1148 L/person and day) in comparison with the consumption of this diet in the US.
Figure 2 shows the contribution of the different groups of products to the WFdiet in Spain and US. Dairy products, oil and vegetable fats, and meat, fish and animal fats accounted for the 68% of the green component of the Mediterranean diet in Spain (up to 2662 L per person and day) (Figure 2a). A shift towards an American diet of Spanish consumers would increase the consumption of dairy and meat, fish and animal products groups by 30% (+547 L per person and day) and therefore enlarge the green WFdiet up to 4808 L/person and day. Legumes, cereals and potatoes, and eggs also represent a significant share of the green fraction of the WFdiet under a Mediterranean and USDAr diet in Spain (22% and 19% respectively).
Changing the consumption patterns in the US and adopting a Mediterranean diet would deliver significant green water savings (Figure 2a). Many of these water savings are related to lower green WF values associated to oil and vegetable fats (70% lower, 407 L/person and day less), meat and fish products (22% lower, 211 L/person and day less) and cocoa, chocolate and vanilla (93% lower, 257 L/person and day less) in the Mediterranean diet.
The share of blue WF among product groups is more evenly distributed in the case of the Mediterranean diet in Spain (Figure 2b). On the other hand, legumes and nuts, and cereals and potatoes groups account for the 45% of the blue component of the USDAr diet (572 L/person and day). So the largest differences in terms of blue water WF among diets in Spain are due to the higher water consumption of legumes and nuts (almost six times higher, +273 L/person and day) as well as cereals and potatoes (almost five times higher, +195 L/person and day) in the USDAr diet in comparison with the Mediterranean one.
In the case of US, the Mediterranean diet has higher blue WF than USDAr diet. Legumes and nuts, oil and vegetable fats, and vegetables account for 62% of the blue component of the Mediterranean diet in the US (up to 455 L per person and day). A shift towards a Mediterranean diet of American consumers would increase the blue WF of these products groups: legumes and nuts (68% higher, +42 L/person and day), oil and vegetable fats (nearly five times higher, +166 L/person and day) and vegetables (nearly three times higher, +89 L/person and day).
Concerning grey WF (Figure 2c) in both countries, the USDAr diet has higher values than the Mediterranean one, especially in US. Meat, fish and animal fats and dairy products account for 55% of the grey WF of the Mediterranean diet in Spain (260 L per person and day). Consuming a USDAr diet would lead to an increase of dairy products (46% higher, 70 L/person and day) and oil and vegetable fats (35 times higher, 67 L per person and day). Also, very significantly, the WF of cocoa, chocolate and vanilla group is higher and increases up to 480 times in changing to a USDAr diet (53 L/person and day).
In the case of the US, the legumes and nuts group alone accounts for almost 50% of the grey component of the USDAr diet (576 L/person and day). A change to a Mediterranean diet would afford a 35% reduction (202 L/person and day) in this product group.
The analysis of the individual products’ WF reveals that a limited number of products contribute the most to the green, blue, grey and total WFdiet account for up to 36%–46% of the total in both countries and dietary options. Table 1 and Table 2 show the five products that contribute the most to the green, blue, grey and total WFdiet for both diets and countries. Olive oil is the product which accounts the most to the WFdiet of the Mediterranean diet, both in Spain and the US, as shown in Table 1 and Table 2 respectively. On the other hand, in the USDAr diet, semi-skimmed milk is the product that accrues the largest share of the WFdiet (16%, equivalent to 1085 L per person day) in Spain (Table 1). While in the US (Table 2) the product that claims the largest WFdiet is beef meat (14%, 789 L per person and day).
Most of the products that influence the most for green, blue, grey (and thus in WFdiet) for both dietary options and countries originate from only three products groups: (a) meat, fish and animal fats; (b) dairy products; and (c) oils and vegetable fats. Moreover, products from the group of legumes and nuts account for the major part of the grey WF for both diets in US.

4. Discussion

USDAr diet has a greater average intake quantity of dairy products (756 g/person and day) than the Mediterranean diet (405 g/person and day). Also, the USDAr diet has a greater share of legumes and nuts daily intake (246 g/person and day, in comparison with 89 g/person and day in the Mediterranean diet). On the other hand, in the Mediterranean diet the intake quantity of vegetables is higher (1021 g/person and day versus 613 in USDAr diet), as well as fruits (624 g/person in the Mediterranean diet in comparison with the 545 g/person and day of the USDAr diet). Regarding meat, fish and animal fats food group, they have similar consumption rates of meat and animal fats: 187 g/person and day in the Mediterranean diet and 173 g/person and day in the USDAr one. However, in the Mediterranean diet the consumption of fish is much higher (146 versus 48 g/person and day), which significantly reduces the WFdiet linked to the consumption of animal proteins. In short, the Mediterranean diet relies on a larger intake of vegetables, fruits and fish, while in the USDAr diet the fraction of dairy, legumes and nuts products is larger. Tables S1–S4 contain a full description of the products and quantities included of each menu for both diets.

4.1. Consumption Patterns: Water Footprint of Mediterranean and USDAr Diets

In both countries, adopting a Mediterranean diet would lead to major water savings per person. In Spain, maintaining a Mediterranean diet will save up to 1504 L per person per day (≈29%); while in the US, shifting into a Mediterranean diet would deliver even greater benefits (net water savings of 1629 L per person per day, equivalent to 29%). The Mediterranean summer menu (menu 2) has a WF 7% smaller than the winter menu (menu 1) in Spain and 1.5% in the US. These differences can be attributed to the larger calorie content of the winter menu, since the proportion of food groups is similar in the two menus. Our results stand within the ranges of Vanham et al. [13], who found that healthy diets lead to water savings ranging between 3% and 30%. Moreover, our results are consistent with those studies where diets based on the consumption of vegetables and fruits [8,9,11,12,13,14,28] or totally vegetarian [44,45] have a smaller WF compared to animal products-based or non-vegetarian diets.
Some authors have shown similar water savings (up to 33%) when western dietary patterns are replaced by the adoption of a Mediterranean diet [32]. Other comparisons between the Mediterranean recommended diet and other western meat-based dietary patterns have been reported [8,28,32], concluding also that there are major water savings using a Mediterranean diet. But little is known about comparisons with other real and official recommended diets.

4.2. Products’ Origins Matter: Water Footprints in Spain and US

This study also shows that production factors also explain part of the changes in WFdiet beyond the shifts in diets. As shown in Figure 1 showed, a shift towards a Mediterranean diet in the US will decrease the WFdiet up to 4003 L per person and per day, a value below the WFdiet calculated for a Mediterranean diet in Spain (5276 L per person and per day). Also, looking only at the consumptive fraction of the WFdiet (green WF + blue WF), the lowest values appear for Mediterranean diet in the US. This means that, not only consumption patterns, but also products’ origins (prevailing climate and production conditions) are very significant factors to be taken into account for minimizing WFs. It also implies that the mixture of dietary patterns based on the consumption of vegetables, fish and fruits, followed by improved production conditions (i.e., lower WF), can contribute to achieve major water savings.
In countries like Spain, high values for green and blue WF can be explained because of the prevailing semi-arid climate conditions. Several studies have shown this close relationship between drier climate conditions and higher values of green and blue WFs [12,13,46]. High temperatures and low rainfall contribute to higher WF in L/kg of products, because of the lower yields under large production areas [47]. Further, in semi-arid conditions there is a greater need for irrigation, which increases the blue WF [13,48].
Our results demonstrate that the green and blue components of the WFdiet are higher in Spain compared to the US’s regardless of the type of diet. These results are mainly due to the differences of green WF values in the US in comparison with Spain of oil and vegetable fats in the Mediterranean diet (80% lower in the US, −688 L/person and day), and because the dairy products in the USDAr diet (51% lower in the US, −661 L/person and day). Despite the differences in water use efficiency across countries, green water is the most important component of the WFdiet in both countries. These results are in accordance with other studies that concluded the dominance of green water in food production [10,12,14,17,19,28].
The US is also more efficient in the use of blue water in food production. Our results showed that shifting towards a Mediterranean diet in the US is 15% lower than the blue WF of the Mediterranean diet when consumed in Spain. Also, adopting a USDAr diet in the US would afford a reduction of blue WF of 54% in comparison with the adoption of the same diet in Spain. These differences in blue WF are due to the higher efficiency of the US in the production of dairy products and legumes and nuts.
Despite the comparative advantages of the US in terms of blue and green water use in the production of different food items, it is less competitive in terms of grey water use. For both diets, the grey component of the WFdiet is up to 67% higher in the US in comparison with Spain. Legumes and nuts are the food products that show the largest differences in terms of grey water among the two countries. These results are in accordance with those authors that reported high levels of nitrate concentrations in the US farming areas under irrigation, or where the use of nitrogen fertilizers have increased significantly in the last years [49,50].

4.3. Data Limitation and Further Research: Water Footprint of Every Product within the Diet

The calculations of the WFdiet in this research are based on global WF datasets for crop and livestock products [41,42]. Previous research has found that WF estimations for the same products and countries can differ significantly [17,19,20]. The specific local climate and agricultural practices have a large effect on the WF of products.
Results of this research showed that olive oil is the product accounting for a large share of the Mediterranean WFdiet in both countries. According to Mekonnen and Hoekstra [41], the WF of olive oil produced in Spain accounts for 12.1 m3/L and 4.7 m3/L in the US. Salmoral et al. [19], conducted a detailed study on the WF of olive oil across the five most important production centers in Spain and found large variations, ranging between 13.1 m3/L and 22.4 m3/L [19].
Olive has been cultivated for millennia in the Mediterranean region, and has been considered by many authors a symbol of environmental sustainable systems [51,52,53]. These studies also described olive cultivation as a low-intensity production system, and usually associated with old trees, small yields, and receiving low inputs for both labor and materials [53]. These factors (mainly low yields) probably explain the large WF (particularly green water) of olives and olive oil. In view of the above, further research is needed to evaluate the high green WFs.
Other products that have a large influence in the WFdiet are dairy and meat. De Miguel et al. [17], studied the water footprint of the Spanish pork industry and obtained lower values than those estimated by Mekonnen and Hoekstra [42] (6094 L/kg versus 7184.3 L/kg respectively). The wide range of WF estimations for the same products and countries requires a detailed comparison of the values reported by Mekonnen and Hoektra [41,42]. Also, more national and local studies are needed. This also requires further research on the calculation of products’ WFs at national and more local scales.

5. Conclusions

Few studies have evaluated the WF of real recommended and daily menus, using traditional and national-local recipes and dishes with individual products analysis. As this study has shown, changing consumption patterns towards recommended diets based on a high intake of vegetables, fruits and fish would deliver significant water savings, in some cases larger than those associated to increasing efficient production. But this message is less likely to be embraced by the general public because of the lack of knowledge about the environmental impacts of current consumption patterns and in particular linked to the diets [54,55]. This study demonstrates how important diets are for consumers and the environment, and supports other studies which argue that diets do matter when referring to sustainability [45,56]. Also, this paper highlights the benefits linked to embracing the Mediterranean diet not just because of its potential health benefits, but also because it is a less water intensive diet. As shown, adopting a Mediterranean diet would lead to major water savings in Spain and also in the US. Therefore, our findings support the conclusion that diets based on low meat consumption could also be more environmentally sustainable in terms of water savings, contributing to address the health-environment problem [8].
A further conclusion of this research is that the origin of the products also matter. More water savings can be achieved when efficient production systems coexist with sustainable consumption patterns. Further research is required to assess the sustainability of diets, e.g., through LCA impact [57] or by conducting a sustainability WFA [15], since the WF of diets only provides insight on the amount of water embedded in food production, regardless of the impacts such water consumption generates in the production regions.
The largest share of the WF of the two diets analyzed in this paper is always linked to green and blue water. Nevertheless, grey WF is considerably larger in the US, mainly because of larger nitrogen pollution in water resources caused in the production of legumes and nuts.
A few products have a large influence and account for the major part of the WF of a diet in both countries and dietary options. Meat, oils, vegetable fats and dairy products are the most influential and important ones. In the USDAr diet the product which accounts the most for the final WFs values is semi-skimmed milk in Spain, and beef meat in the US. Olive oil is the product which contributes the largest percentage of water footprint in the Mediterranean diet in Spain and the US. Despite olives being millennial, local and landscape-adapted trees, their high green WF values make olive oil one of the major water consuming products, even more than meat and dairy. Further research is thus required to assess the WF of the food components that influence the WF of diets the most, in order to obtain more accurate estimates.

Supplementary Materials

The following are available online at www.mdpi.com/2073-4441/8/10/448/s1, Table S1: Recipes, dishes and products’ quantity of winter menu (menu 1) of Mediterranean diet, Table S2: Recipes, dishes and products’ quantity of summer menu (menu 2) of Mediterranean diet, Table S3: Recipes, dishes and products’ quantity of menu 1 of USDAr diet, Table S4: Recipes, dishes and products’ quantity of menu 2 of USDAr diet.

Acknowledgments

This research has been funded by the the Water Observatory of the Botin Foundation. The authors are grateful to Michelaina Jhonson for her support in the collection of information and to Maite M. Aldaya for providing valuable comments during the design phase of this research.

Author Contributions

Alejandro Blas, Alberto Garrido and Bárbara A. Willaarts conceived and designed the experiments; Alejandro Blas performed the experiments and analyzed the data; Alejandro Blas and Bárbara A. Willaarts wrote the paper; Alejandro Blas, Alberto Garrido and Bárbara A. Willaarts contributed to the analysis tools; Alejandro Blas, Alberto Garrido and Bárbara Willaarts contributed to the discussion; Alberto Garrido and Bárbara A. Willaarts supervised the experimental design.

Conflicts of Interest

The authors declare no conflict of interest.

References

  1. Godfray, H.C.J.; Beddington, J.R.; Crute, I.R.; Haddad, L.; Lawrence, D.; Muir, J.F.; Pretty, J.; Robinson, S.; Thomas, S.M.; Toulmin, C. Food Security: The Challenge of Feeding 9 Billion People. Science 2010, 327, 812–818. [Google Scholar] [CrossRef] [PubMed]
  2. Flachsbarth, I.; Willaarts, B.; Xie, H.; Pitois, G.; Mueller, N.D.; Ringler, C.; Garrido, A. The Role of Latin America’s Land and Water Resources for Global Food Security: Environmental Trade-Offs of Future Food Production Pathways. PLoS ONE 2015, 10, e0116733. [Google Scholar] [CrossRef] [PubMed]
  3. Matson, P.A.; Parton, W.J.; Power, A.G.; Swift, M.J. Agricultural Intensification and Ecosystem Properties. Science 1997, 277, 504–509. [Google Scholar] [CrossRef] [PubMed]
  4. Tilman, D.; Cassman, K.G.; Matson, P.A.; Naylor, R.; Polasky, S. Agricultural Sustainability and Intensive Production Practices. Nature 2002, 418, 671–677. [Google Scholar] [CrossRef] [PubMed]
  5. Food and Agriculture Organization of the United Nations. Stadistical Database. Available online: http://faostat3.fao.org/home/E (accessed on 1 January 2015).
  6. Tilman, D.; Fargione, J.; Wolff, B.; Antonio, C.D.; Dobson, A.; Howarth, R.; Schindler, D.; Schlesinger, W.H.; Simberloff, D.; Swackhamer, D. Forecasting Agriculturally Driven Environmental Change. Am. Assoc. Adv. Sci. 2001, 292, 281–284. [Google Scholar] [CrossRef] [PubMed]
  7. Carlsson-Kanyama, A.; González, A.D. Potential Contributions of Food Consumption Patterns to Climate Change. Am. J. Clin. Nutr. 2009, 89, 1704S–1709S. [Google Scholar] [CrossRef] [PubMed]
  8. Tilman, D.; Clark, M. Global Diets Link Environmental Sustainability and Human Health. Nature 2014, 515, 518–522. [Google Scholar] [CrossRef] [PubMed]
  9. Jalava, M.; Kummu, M.; Porkka, M.; Siebert, S.; Varis, O. Diet Change—A Solution to Reduce Water Use? Environ. Res. Lett. 2014, 9. [Google Scholar] [CrossRef]
  10. Rockström, J.; Falkenmark, M.; Karlberg, L.; Hoff, H.; Rost, S.; Gerten, D. Future Water Availability for Global Food Production: The Potential of Green Water for Increasing Resilience to Global Change. Water Resour. Res. 2009, 45, 1–16. [Google Scholar] [CrossRef]
  11. Pimentel, D.; Pimentel, M. Sustainability of Meat-Based and Plant-Based Diets and the Environment. Am. J. Clin. Nutr. 2003, 78, 660–663. [Google Scholar]
  12. Vanham, D.; Mekonnen, M.M.; Hoekstra, A.Y. The Water Footprint of the EU for Different Diets. Ecol. Indic. 2013, 32, 1–8. [Google Scholar] [CrossRef]
  13. Vanham, D.; Hoekstra, A.Y.; Bidoglio, G. Potential Water Saving through Changes in European Diets. Environ. Int. 2013, 61, 45–56. [Google Scholar] [CrossRef] [PubMed]
  14. Vanham, D. The Water Footprint of Austria for Different Diets. Water Sci. Technol. 2013, 67, 824–830. [Google Scholar] [CrossRef] [PubMed]
  15. Hoekstra, A.Y.; Chapagain, A.K.; Aldaya, M.M.; Mekonnen, M.M. The Water Footprint Assessment Manual; Earthscan: London, UK, 2011. [Google Scholar]
  16. Boulay, A.-M.M.; Hoekstra, A.Y.; Vionnet, S. Complementarities of Water-Focused Life Cycle Assessment and Water Footprint Assessment. Environ. Sci. Technol. 2013, 47, 11926–11927. [Google Scholar] [CrossRef] [PubMed]
  17. De Miguel, Á.; Hoekstra, A.Y.; García-Calvo, E. Sustainability of the Water Footprint of the Spanish Pork Industry. Ecol. Indic. 2015, 57, 465–474. [Google Scholar] [CrossRef]
  18. Chico, D.; Aldaya, M.M.; Garrido, A. A Water Footprint Assessment of a Pair of Jeans: The Influence of Agricultural Policies on the Sustainability of Consumer Products. J. Clean. Prod. 2013, 57, 238–248. [Google Scholar] [CrossRef]
  19. Salmoral, G.; Aldaya, M.M.; Chico, D.; Garrido, A.; Llamas, R. The Water Footprint of Olives and Olive Oil in Spain. Span. J. Agric. Res. 2011, 9, 1089–1104. [Google Scholar] [CrossRef]
  20. Chico, D.; Salmoral, G.; Llamas, M.R.; Garrido, A.; Aldaya, M.M. The Water Footprint and Virtual Water Exports of Spanish Tomatoes; Fundación Botín: Madrid, Spain, 2010; Volume 8. [Google Scholar]
  21. Dumont, A.; Salmoral, G.; Llamas, M.R. The Water Footprint of a River Basin with a Special Focus on Groundwater: The Case of Guadalquivir Basin (Spain). Water Resour. Ind. 2013, 2, 60–76. [Google Scholar] [CrossRef]
  22. International Organization for Standardization (ISO). ISO/DIS 14046.2: Environmental Management—Water Footprint—Principles, Requirements and Guidelines; ISO: Geneva, Switzerland, 2013. [Google Scholar]
  23. Berger, M.; Finkbeiner, M. Water Footprinting: How to Address Water Use in Life Cycle Assessment? Sustainability 2010, 2, 919–944. [Google Scholar] [CrossRef]
  24. Manzardo, A.; Mazzi, A.; Loss, A.; Butler, M.; Williamson, A.; Scipioni, A. Lessons Learned from the Application of Different Water Footprint Approaches to Compare Different Food Packaging Alternatives. J. Clean. Prod. 2016, 112, 4657–4666. [Google Scholar] [CrossRef]
  25. Jefferies, D.; Muñoz, I.; Hodges, J.; King, V.J.; Aldaya, M.; Ercin, A.E.; Milà i Canals, L.; Hoekstra, A.Y. Water Footprint and Life Cycle Assessment as Approaches to Assess Potential Impacts of Products on Water Consumption. Key Learning Points from Pilot Studies on Tea and Margarine. J. Clean. Prod. 2012, 33, 155–166. [Google Scholar] [CrossRef]
  26. Pacetti, T.; Lombardi, L.; Federici, G. Water-Energy Nexus: A Case of Biogas Production from Energy Crops Evaluated by Water Footprint and LCA Methods. J. Clean. Prod. 2015, 101, 278–291. [Google Scholar] [CrossRef]
  27. Milà, L.; Chapagain, A.; Orr, S.; Chenoweth, J.; Anton, A.; Clift, R. Assessing Freshwater Use Impacts in LCA, Part 2: Case Study of Broccoli Production in the UK and Spain. Int. J. Life Cycle Assess. 2010, 598–607. [Google Scholar] [CrossRef]
  28. López-Gunn, E.; Willaarts, B.; Dumont, A.; Niemeyer, I.; Martínez-Santos, P. The concept of water and food security in Spain. In Water, Agriculture and the Environment in Spain: Can We Square the Circle? CRC Press: Leiden, The Netherlands, 2012; pp. 21–34. [Google Scholar]
  29. Vanham, D.; Pozo, S.; Pekcan, A.G.; Keinan-boker, L.; Trichopoulou, A.; Gawlik, B.M. Water Consumption Related to Different Diets in Mediterranean Cities. Sci. Total Environ. 2016, 573, 96–105. [Google Scholar] [CrossRef] [PubMed]
  30. Vanham, D.; Mak, T.N.; Gawlik, B.M. Urban Food Consumption and Associated Water Resources: The Example of Dutch Cities. Sci. Total Environ. 2016, 565, 232–239. [Google Scholar] [CrossRef] [PubMed]
  31. Bach-faig, A.; Berry, E.M.; Lairon, D.; Reguant, J.; Trichopoulou, A.; Dernini, S.; Medina, F.X.; Battino, M.; Belahsen, R. Mediterranean Diet Pyramid Today. Science and Cultural Updates. Public Health Nutr. 2011, 14, 2274–2284. [Google Scholar] [CrossRef] [PubMed]
  32. Sáez-Almendros, S.; Obrador, B.; Bach-Faig, A.; Serra-Majem, L. Environmental Footprints of Mediterranean versus Western Dietary Patterns: Beyond the Health Benefits of the Mediterranean Diet. Environ. Health 2013, 2, 1–8. [Google Scholar] [CrossRef] [PubMed]
  33. Bonaccio, M.; Iacoviello, L.; De Gaetano, G. The Mediterranean Diet: The Reasons for a Success. Thromb. Res. 2012, 129, 401–404. [Google Scholar] [PubMed]
  34. The United Nations Educational, Scientific and Cultural Organization. Representative List of the Intangible Cultural Heritage of Humanity. Available online: http://www.unesco.org/culture/ich/en/RL/mediterranean-diet-00884 (accessed on 1 February 2015).
  35. Smith, C.; McDonald, G. Assessing the Sustainability of Agriculture at the Planning Stage. J. Environ. Manag. 1998, 52, 15–37. [Google Scholar] [CrossRef]
  36. Capone, R.; El Bilali, H.; Debs, P.; Cardone, G.; Driouech, N. Mediterranean Food Consumption Patterns Sustainability: Setting Up a Common Ground for Future Research and Action. Am. J. Nutr. Food Sci. 2014, 1, 37–52. [Google Scholar] [CrossRef]
  37. Haven, J.; Rihane, C.; Britten, P.; Johnson-Bailey, D.; Lino, M.; Rahavi, E.; Ciampo, M. Healthy Eating on a Budget at ChooseMyPlate.gov. J. Acad. Nutr. Diet. 2015, 114, 834–837. [Google Scholar] [CrossRef] [PubMed]
  38. United States Department of Agriculture. Choose My Plate. Available online: http://www.choosemyplate.gov (accessed on 1 March 2016).
  39. The Food and Agriculture Organization Corporate Statistical Database. Food Balance/Food Balance Sheets. Available online: http://faostat3.fao.org (accessed on 1 May 2016).
  40. Fundación Dieta Mediterránea. Available online: http://dietamediterranea.com/ (accessed on 1 January 2016).
  41. Mekonnen, M.M.; Hoekstra, A.Y. The Green, Blue and Grey Water Footprint of Crops and Derived Crop Products. Hydrol. Earth Syst. Sci. 2011, 15, 1577–1600. [Google Scholar] [CrossRef]
  42. Mekonnen, M.M.; Hoekstra, A.Y. A Global Assessment of the Water Footprint of Farm Animal Products. Ecosystems 2012, 15, 401–415. [Google Scholar] [CrossRef]
  43. Pahlow, M.; Van Oel, P.R.; Mekonnen, M.M.; Hoekstra, A.Y. Increasing Pressure on Freshwater Resources due to Terrestrial Feed Ingredients for Aquaculture Production. Sci. Total Environ. 2015, 536, 847–857. [Google Scholar] [CrossRef] [PubMed]
  44. Marlow, H.J.; Hayes, W.K.; Soret, S.; Carter, R.L.; Schwab, E.R.; Sabate, J. Diet and the Environment: Does What You Eat Matter? Am. J. Clin. Nutr. 2009, 89, 1699–1703. [Google Scholar] [CrossRef] [PubMed]
  45. Reijnders, L.; Soret, S. Quantification of the Environmental Impact of Different Dietary. Am. J. Clin. Nutr. 2003, 78, 664–668. [Google Scholar]
  46. Vanham, D.; Bidoglio, G. A Review on the Indicator Water Footprint for the EU28. Ecol. Indic. 2015, 26, 61–75. [Google Scholar] [CrossRef]
  47. Olesen, J.E.; Trnka, M.; Kersebaum, K.C.; Skjelvåg, A.O.; Seguin, B.; Peltonen-sainio, P.; Rossi, F.; Kozyra, J.; Micale, F. Impacts and Adaptation of European Crop Production Systems to Climate Change. Eur. J. Agron. J. 2011, 34, 96–112. [Google Scholar] [CrossRef]
  48. Wriedt, G.; Van Der Velde, M.; Aloe, A.; Bouraoui, F. Estimating Irrigation Water Requirements in Europe. J. Hydrol. 2009, 373, 527–544. [Google Scholar] [CrossRef]
  49. Power, J.F.; Schepers, J.S. Nitrate Contamination of Groundwater in North America. Agric. Ecosyst. Environ. 1989, 26, 165–187. [Google Scholar] [CrossRef]
  50. Hallberg, G.R. Pesticides Pollution of Groundwater in the Humid United States. Agric. Ecosyst. Environ. 1989, 26, 299–367. [Google Scholar] [CrossRef]
  51. Duarte, F.; Jones, N.; Fleskens, L. Traditional Olive Orchards on Sloping Land: Sustainability or Abandonment? J. Environ. Manag. 2008, 89, 86–98. [Google Scholar] [CrossRef] [PubMed]
  52. Loumou, A.; Giourga, C. Olive groves: “The Life and Identity of the Mediterranean”. Agric. Hum. Values 2003, 20, 87–95. [Google Scholar] [CrossRef]
  53. Blondel, J. The “Design” of Mediterranean Landscapes: A Millennial Story of Humans and Ecological Systems during the Historic Period. Hum. Ecol. 2006, 34, 713–729. [Google Scholar] [CrossRef]
  54. Gephart, J.A.; Davis, K.F.; Emery, K.A.; Leach, A.M.; Galloway, J.N.; Pace, M.L. The Environmental Cost of Subsistence: Optimizing Diets to Minimize Footprints. Sci. Total Environ. 2016, 553, 120–127. [Google Scholar] [CrossRef] [PubMed]
  55. Tobler, C.; Visschers, V.H.M.; Siegrist, M. Eating Green. Consumers’ Willingness to Adopt Ecological Food Consumption. Appetite 2011, 57, 674–682. [Google Scholar] [CrossRef] [PubMed]
  56. Goodland, R. Environmental Sustainability in Agriculture: Diet Matters. Ecol. Econ. 1997, 23, 189–200. [Google Scholar] [CrossRef]
  57. Kounina, A.; Margni, M.; Bayart, J.-B.; Boulay, A.-M.; Berger, M.; Bulle, C.; Frischknecht, R.; Koehler, A.; Milà i Canals, L.; Motoshita, M.; et al. Review of Methods Addressing Freshwater Use in Life Cycle Inventory and Impact Assessment. Int. J. Life Cycle Assess. 2013, 18, 701–721. [Google Scholar] [CrossRef]
Figure 1. Green, blue and grey water footprint (WF) for WFmenu1, WFmenu2 and the total WF diet of Mediterranean diet (WFdiet), and WFmenu1, WFmenu2 and the total WF diet of USDAr diet (WFdiet), for: (a) Spain and (b) the US.
Water 08 00448 g001
Figure 2. Characterization of the green (a), blue (b) and grey (c) components of the WFdiet of the Mediterranean and USDAr diets in Spain and the US for the different product groups.
Water 08 00448 g002
Table 1. The five products that contribute the most in L/person and day (lpd) and % to the green, blue, grey and total WFdiet for the Mediterranean and USDAr diets in Spain.
Mediterranean Diet
Green WFBlue WFGrey WFWFdiet
Productlpd%Productlpd%Productlpd%Productlpd%
Olive oil86722%Olive oil20724%Milk6113%Olive oil105520%
Milk3559%Milk526%Eggs439%Milk4759%
Beef meat2767%Sugar526%Cheese337%Eggs3166%
Eggs2366%Asparagus435%Beef meat286%Beef meat3166%
Cheese1975%Eggs344%Chicken286%Cheese2645%
Rest201051%Rest47455%Rest27959%Rest284754%
USDAr Diet
Green WFBlue WFGrey WFWFdiet
Productlpd%Productlpd%Productlpd%Productlpd%
SK mik 181717%Soymilk26721%SK milk 114020%SK milk 1108416%
Beef meat52911%Oats16513%Margarine7010%Beef meat6109%
Margarine3858%SK milk 11159%Beef meat568%Margarine5428%
Chicken1924%Sesame766%Vanilla497%Oats4076%
Oats1924%Margarine514%Oats426%Soymilk3395%
Rest269256%Rest59847%Rest34351%Rest379656%
Note: 1 SK milk = Semi-skimmed milk.
Table 2. The five products that contribute the most in L/person and day (lpd) and % to the green, blue, grey and total WFdiet for the Mediterranean and USDAr diets in the US.
Mediterranean Diet
Green WFBlue WFGrey WFWFdiet
Productlpd%Productlpd%Productlpd%Productlpd%
Milk32313%Olive oil21229%Chickpeas12616%Olive oil40010%
Beef meat29812%Almonds517%Almonds7910%Milk40010%
Olive oil1747%Asparagus446%Lentils638%Beef meat3208%
Bread1245%Hazelnuts375%Hazelnuts557%Chickpeas1604%
Flour1245%Milk294%Milk476%Pork Meat1604%
Rest143958%Rest35849%Rest41947%Rest256264%
USDAr Diet
Green WFBlue WFGrey WFWFdiet
Productlpd%Productlpd%Productlpd%Productlpd%
Beef meat73619%Oats7713%Beans26823%Beef meat78814%
SK milk 138710%Vanilla539%Chickpeas15213%SK milk 14518%
Vegetable oil2326%Apple juice356%Coffee12811%Beans3386%
Margarine1945%SK milk 1356%Lentils1059%Oats2825%
Oats1945%Rice356%SK milk 1585%Coffee2254%
Rest213155%Rest35560%Rest45539%Rest354863%
Note: 1 SK milk = Semi-skimmed milk.

