Article

Modeling the Hydropower–Food Nexus in Large River Basins: A Mekong Case Study

1
Fenner School of Environment and Society, The Australian National University, 48 Linnaeus Way, Acton 2600, Australia
2
KnowlEdge Srl, via San Giovanni Battista 2, Olgiate Olona 21057, Italy
*
Author to whom correspondence should be addressed.
Water 2016, 8(10), 425; https://doi.org/10.3390/w8100425
Submission received: 5 February 2016 / Revised: 15 September 2016 / Accepted: 20 September 2016 / Published: 28 September 2016
(This article belongs to the Special Issue Water-Energy-Food Nexus in Large Asian River Basins)

Abstract

:
An increasing global population and growing wealth are raising demand for energy and food, impacting on the environment and people living in river basins. Sectoral decision-making may not optimize socio-economic benefits because of perverse impacts in other sectors for people and ecosystems. The hydropower–food supply nexus in the Mekong River basins is assessed here in an influence model. This shows how altering one variable has consequent effects throughout the basin system. Options for strategic interventions to maximize benefits while minimizing negative impacts are identified that would enable national and sub-national policy makers to take more informed decisions across the hydropower, water and food supply sectors. This approach should be further tested to see if it may aid policy making in other large river systems around the world.
Keywords:
energy; food; water; rivers; nexus

1. Introduction

In this research, we propose the first steps towards a model of the hydropower–food supply nexus in a large river basin. Eventually this may be developed and used to identify key points of leverage where management interventions may change the outcomes. As the global population heads towards nine billion people the demand for energy and food is growing [1,2]. Producing energy and food consumes, converts or has other negative impacts on resources, such as the energy, land and water available for non-human managed ecosystems. Meeting human needs for energy and food while minimizing resource consumption has become a key objective of government policies. These approaches are described as “sustainable development” and “green growth”.
In the past decade considerable debate among academics and policy makers has focused on the nexus between an array of key sectors, including energy, food and water. The logic in focusing on only a few sectors in a complex system is that analysis and management interventions may be more tractable for an energy-food nexus, for example, rather than the full range of sectors considered in sustainable development [3].
In this context we examine the hydropower–food supply nexus in large river basins, because the rapid expansion of hydro-electricity production in river basins like the Amazon, Mekong and Yangtze is having perverse impacts on biodiversity and food supply [4,5,6]. Using influence diagrams, our objective is to identify the first steps towards a model of the variables and their relationships that influence the hydropower–food supply nexus. We argue that such modeling should be further developed to enhance decision-making in river basins subject to hydropower development and intensified food production around the world.
Here, the initial conceptual model is elaborated for the lower Mekong River Basin (LMB) in Southeast Asia because it is a region undergoing rapid development and because the processes of the Mekong River Commission have enabled the publication of much data that contributes to this analysis. In 2010, a strategic environmental assessment prepared for the Commission was published outlining the benefits, costs and risks of the planned construction of 88 new hydropower dams in the LMB by 2030. While the proposed developments would increase hydroelectric power generation nine-fold, it would diminish wild fish catch by 24%–40% [7] (but with a 10% reservoir fishery gain). Wild fish are a significant source of protein and micro-nutrients for the sixty million people living the LMB [8,9], so the diminution of this fish supply will require the development of alternative sources of protein through trade or local production. LMB production of alternative crop, fish or livestock supplies has opportunity costs, including those associated with the consumption of more water and with land use change, and consequent environmental and socio-economic knock-on effects [10,11].
To make better cross-sectoral decisions in such complex systems, decision makers need to appreciate the relationships between different variables where they are considering change. Here we apply causal loop (or influence) diagrams (CLDs) to map system dynamics in the expectation that this may enable points of intervention to be identified to optimize beneficial changes while minimizing perverse impacts.

2. Methodology

The approach utilized is based on the System Thinking (ST) methodology as its foundation, with the resulting conceptual models serving primarily as knowledge integrators across disciplines and sectors. ST allows us to map systems, visualizing interdependencies across variables (e.g., economic, social and environmental), with the aim of reaching a shared understanding of the underlying functioning mechanisms of the sector analyzed. ST models can be converted into mathematical models for forecasting, using a methodology called System Dynamics (SD) [12,13,14,15]. A key characteristic of utilizing ST and SD is that it allows us to integrate the three spheres of sustainable development in its analytical process. The software used to create the CLDs presented in this paper is called Vensim (www.vensim.com) and it is developed by Ventana Simulations.

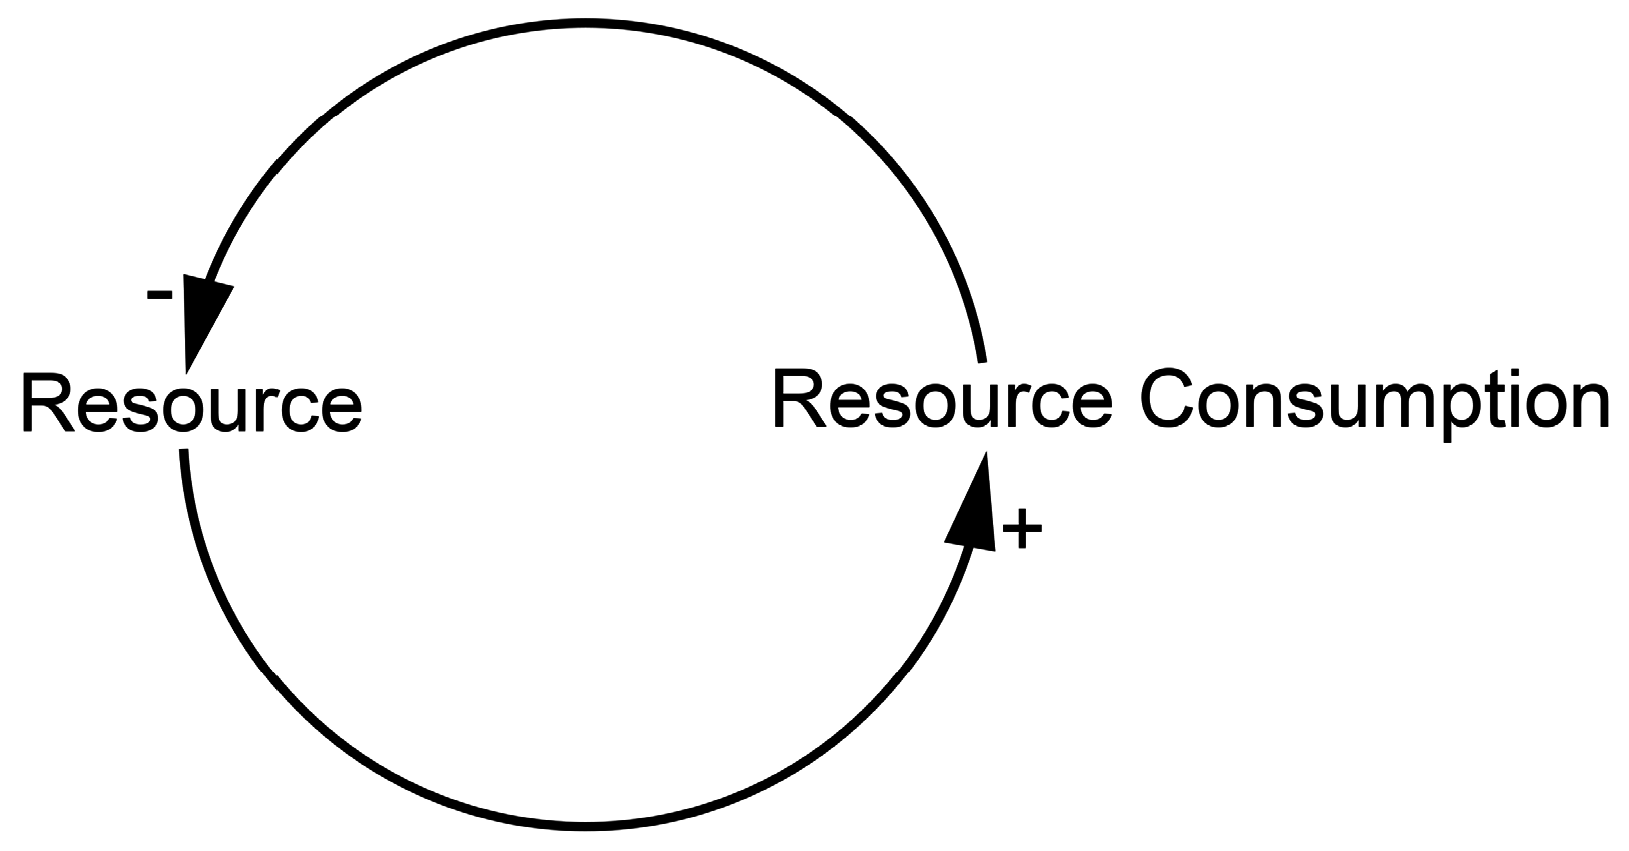
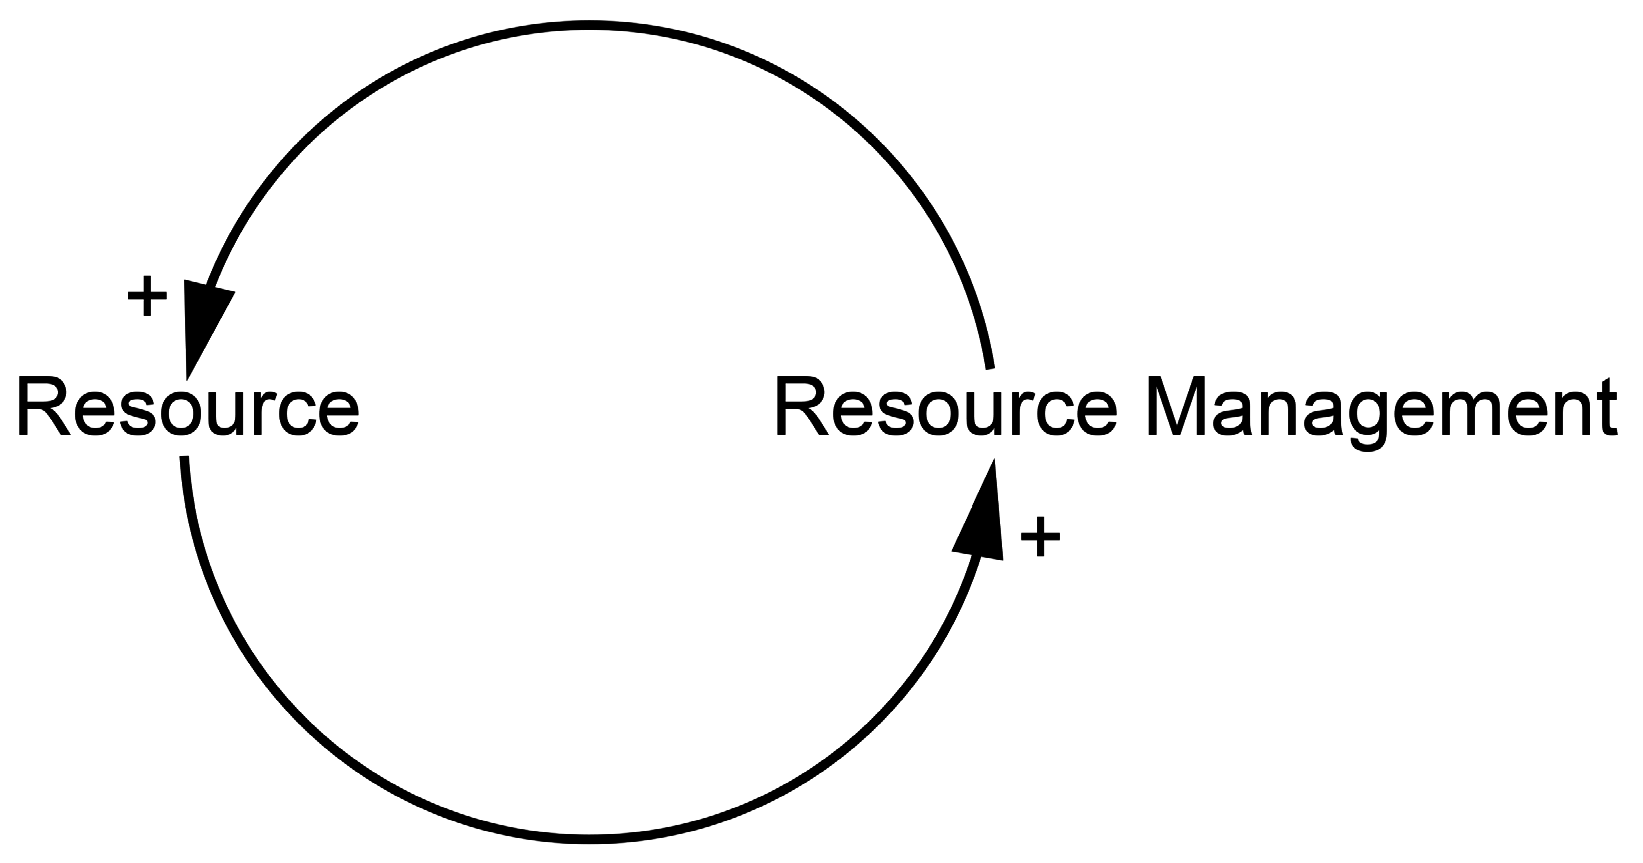
2.1. Causal Loop Diagrams

A causal loop diagram (CLD) is a map of the system analyzed, or, better, a way to explore and represent the interconnections between the key variables in the analyzed sector or system [16]. In other words, a CLD is an integrated map because it represents different system dimensions of the dynamic interplay. It explores the circular relations (or feedbacks) between the key elements—the main variables—that constitute a given system [17].
By highlighting the drivers and impacts of the issue to be addressed and by mapping the causal relationships between the key variables, CLDs support a systemic decision-making process aimed at designing solutions that last. The creation of a CLD has several purposes. First, it combines the team’s ideas, knowledge and opinions. Second, it highlights the boundaries of the analysis. Third, it allows all the stakeholders to achieve basic-to-advanced knowledge of the analyzed issues’ systemic properties [17].
Causal loop diagrams include variables and arrows (called causal links), with the latter linking the variables together with a sign (either + or −) on each link, indicating a positive or negative causal relation (see Table 1):
  • The causal link from variable A to variable B is positive if a change in A produces a change in B in the same direction.
  • The causal link from variable A to variable B is negative if a change in A produces a change in B in the opposite direction.
Circular causal relations between variables form causal, or feedback, loops. The role of feedback loops in the decision making process crucial. It is often the very system we have created that generates the problem, due to external interference, or to a faulty design, which shows its limitations as the system grows in size and complexity. In other words, the causes of a problem are often found within the feedback structures of the system being studied. The indicators are not sufficient to identify these causes and explain the events that led to the creation of the problem.
There are two types of feedback loops: positive and negative. A feedback loop is positive when an intervention in the system triggers other changes that amplify the effect of that intervention, thus reinforcing it [18]. A loop is balancing when it tends towards a goal or equilibrium (and hence reducing the rate of change), balancing the forces in the system [18].
For an extended introduction in the application of CLDs see Proust [19], Dyball and Newell [20], and Probst and Bassi [17]. They have been used to model the relationship between climate, energy and water management (see for example [21]). Here they will be used at a very general level to provide static models of basic relationships between a range of ecological and human factors.

2.2. Limitations of CLDs

However, CLDs have two interrelated limitations. Firstly, all CLDs are simplifications of the situation under consideration. As such, all CLDs are only ever partial representations of the actual. This point leads to the second limitation. There are multiple possible CLD representations for any particular situation under consideration. Thus, any particular CLD developed to represent a particular problem situation may be seen by some as incomplete, or as failing to focus on what some particular actor, agent or stakeholder may deem as important. Different actors within the problem situation may hold very different values and worldviews and thus see very different interactions and feedback mechanisms within the system as being important.
The effectiveness of a CLD will be directly related to the system under consideration and its boundaries being clearly identified. Multi-stakeholder perspectives and cross-sectoral knowledge should be incorporated as far as possible to appropriately identify the causes of the problem and design effective interventions. The partial nature of all CLDs along with any errors in creating diagrams may lead to representations that stakeholders do not accept, the generation of policy interventions that are not recognized, and policy implementation that is ineffective or even exacerbates the problem.
The estimation of the strength of causal relations, even if these are appropriately identified, cannot be guaranteed, as CLDs are a qualitative tool. The use of CLDs will be considerably strengthened when used together with a similar integrated and dynamic causal descriptive mathematical simulation model, where such data and agreement on all variables and interrelationships is available.

2.3. Application to River Basins

In this paper we now step through a series of increasingly more complex influence diagrams. We start with the most basic relationships and then add the details needed to capture complexity and identify options for intervention. This modeling of the energy–food–water nexus that occurs in the Lower Mekong Basin resulting from the construction of hydropower dams is based on a set of simple balancing and reinforcing loops set out in Figure 1 and Figure 2.
In Figure 1, the influence model indicates that more of a resource enables greater consumption (+) of that resource while more consumption of that resource in general leads to a diminishing availability (−) of that resource. This creates a simple balancing loop in which resource use is constrained by the availability of the resource: it is a negative feedback loop.
In Figure 2, resource use through appropriate management leads to an increase in the availability of that resource, creating a simple reinforcing loop in which the resource is maintained or increased through resource management: a positive feedback loop. When dealing with management of a natural resource such a positive feedback loop will be constrained in time and space as system limits are reached and ultimately fail.
Using Figure 1 and Figure 2, we develop simple resource use models for the use of the water flow in the Lower Mekong Basin, which supplies food in both the main stem and tributaries of the river and also provides the energy for the development of hydro-electricity generation.
Figure 3 shows the start of the construction of a combined simple model for both resource uses of food supply and hydropower dam construction for energy generation in the LMB. This combined model will be more fully developed in Results below.

3. Results

Using the influence model components from Figure 1, Figure 2 and Figure 3 the basic factors and relationships of the hydropower–food supply nexus in the lower Mekong Basin were identified from the existing literature and public data that is available for the region. Increasingly complex and complete models are set out with variables and causal links identified in increasing detail. We start with a basic combined model at Figure 4, bringing together the relationship between the two resource uses of the same LMB river flow resource: hydropower dams and food supply.
The Strategic Environmental Assessment commissioned by the Mekong River Commission [7] and others indicate that construction of water infrastructure projects in the LMB have major negative effects on the wild fish catch from the river system. While it is easy to see that the construction of hydropower dams change river flow, such a connection with food supply is less obvious: changes in food supply alone do not necessarily change river flow for the LMB or any other river basin. Just how is the management of the resource of the LMB river flow linked to the supply of food and how does that supply of food affect river flow? Further stages in this loop are needed to capture the influences at work. Orr et al. [10], among others, have shown that the development of hydropower projects changes overall food supplies in the lower Mekong Basin, including increasing demand for land-based agricultural production. Changes in land-based food production entail major changes in water infrastructure and water management, for example, changes from once a year flood recession rice crop to two or even three annual crops using managed irrigation [22]. Increasing food supply reduces the water resource, driving more investment in water resource management associated with food production. This forms a basic causal loop, or influence diagram (Figure 4) from which the hydropower–food supply nexus in the lower Mekong Basin can be constructed. The effects of this loop on the system and the nature of its feedback, positive or negative, are further explored below. Information from the literature was drawn on to deduce and graph the relationship between variables.

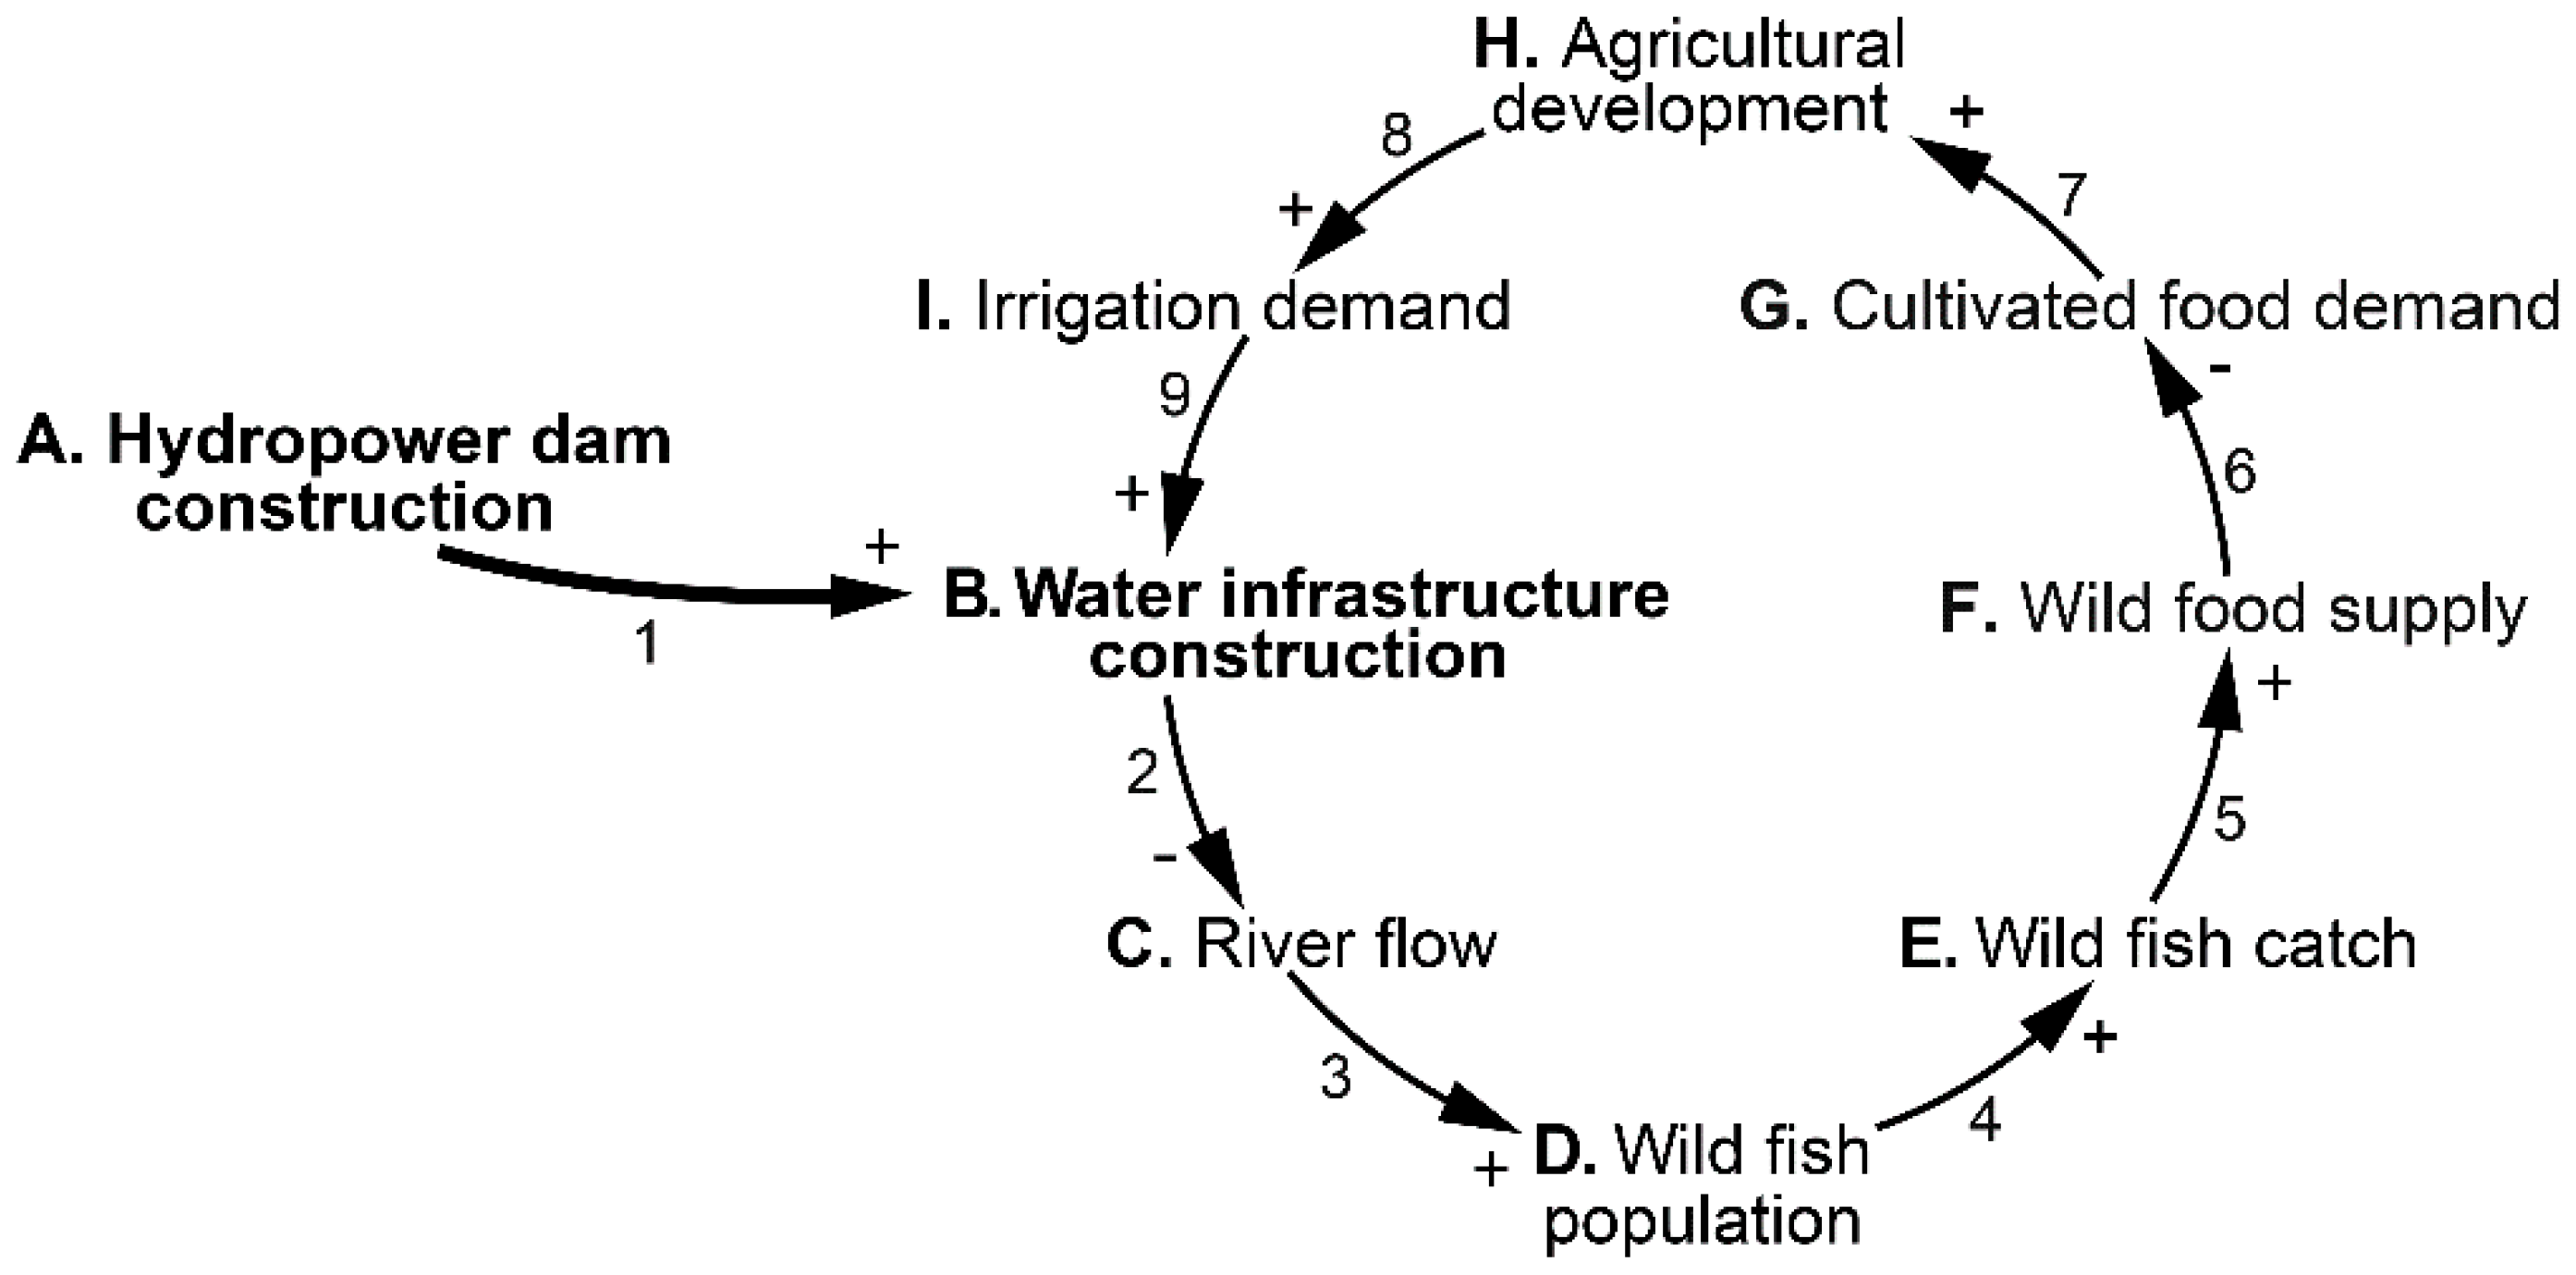
3.1. Food Supply Influence Model

In Figure 5, the food supply influence model is stepped out, comprising one feedback loop as follows. The increase in hydroelectricity generation [7], and the upgrading and expansion of irrigated agriculture [22], is leading to water infrastructure construction. Water infrastructure impacts natural river flows in a number of ways, including through diversion of water to crops, loss of water through evaporation from reservoirs, storage and release of water that increases dry season flows and diminishes wet season flows, changing flows of sediments and nutrients, as well as forming barriers to migration and breeding of fish [23]. For example, following construction of the Pak Mun dam in Thailand in the late 1990s, the fish catch directly upstream of the dam declined by 60%–80% [24].
As a consequence, wild fish populations in the Mekong River system are diminishing, and a net reduction of in the wild fish catch for food of 23.4% to 37.8% by 2030 is projected from the construction of 88 hydro dams in the Lower Mekong Basin due to the barrier effect alone [7,10]. This is anticipated to diminish the supply of protein per country as indicated in Table 3, and consequently, adding to increasing demand for protein [11].
The diminution of the wild fish catch, along with population growth and government policies favoring exports are creating greater demand for food [10,22], leading to increased demand for irrigation [30,31,32]. As a consequence, each of the LMB national governments have policies for agricultural development that emphasize greater production, including through expansion of irrigated agriculture, facilitated through water infrastructure construction [22,33,34,35,36]. In turn this is leading to an expansion of water infrastructure, including water storages, canals and flood protection dykes, which exacerbate loss of wild fish [37,38].
This is a reinforcing feedback loop with the external influence of hydropower dam construction increasing water infrastructure construction leading to changes in the river flow. This then reduces the stock of wild fish with a subsequent decrease in the wild fish catch, decreasing the food supply. This adds to increasing demand for food, requiring further agricultural development, giving rise to an ever increasing demand for further water infrastructure construction, leading to further loss of wild fish stock and loss of food supply.

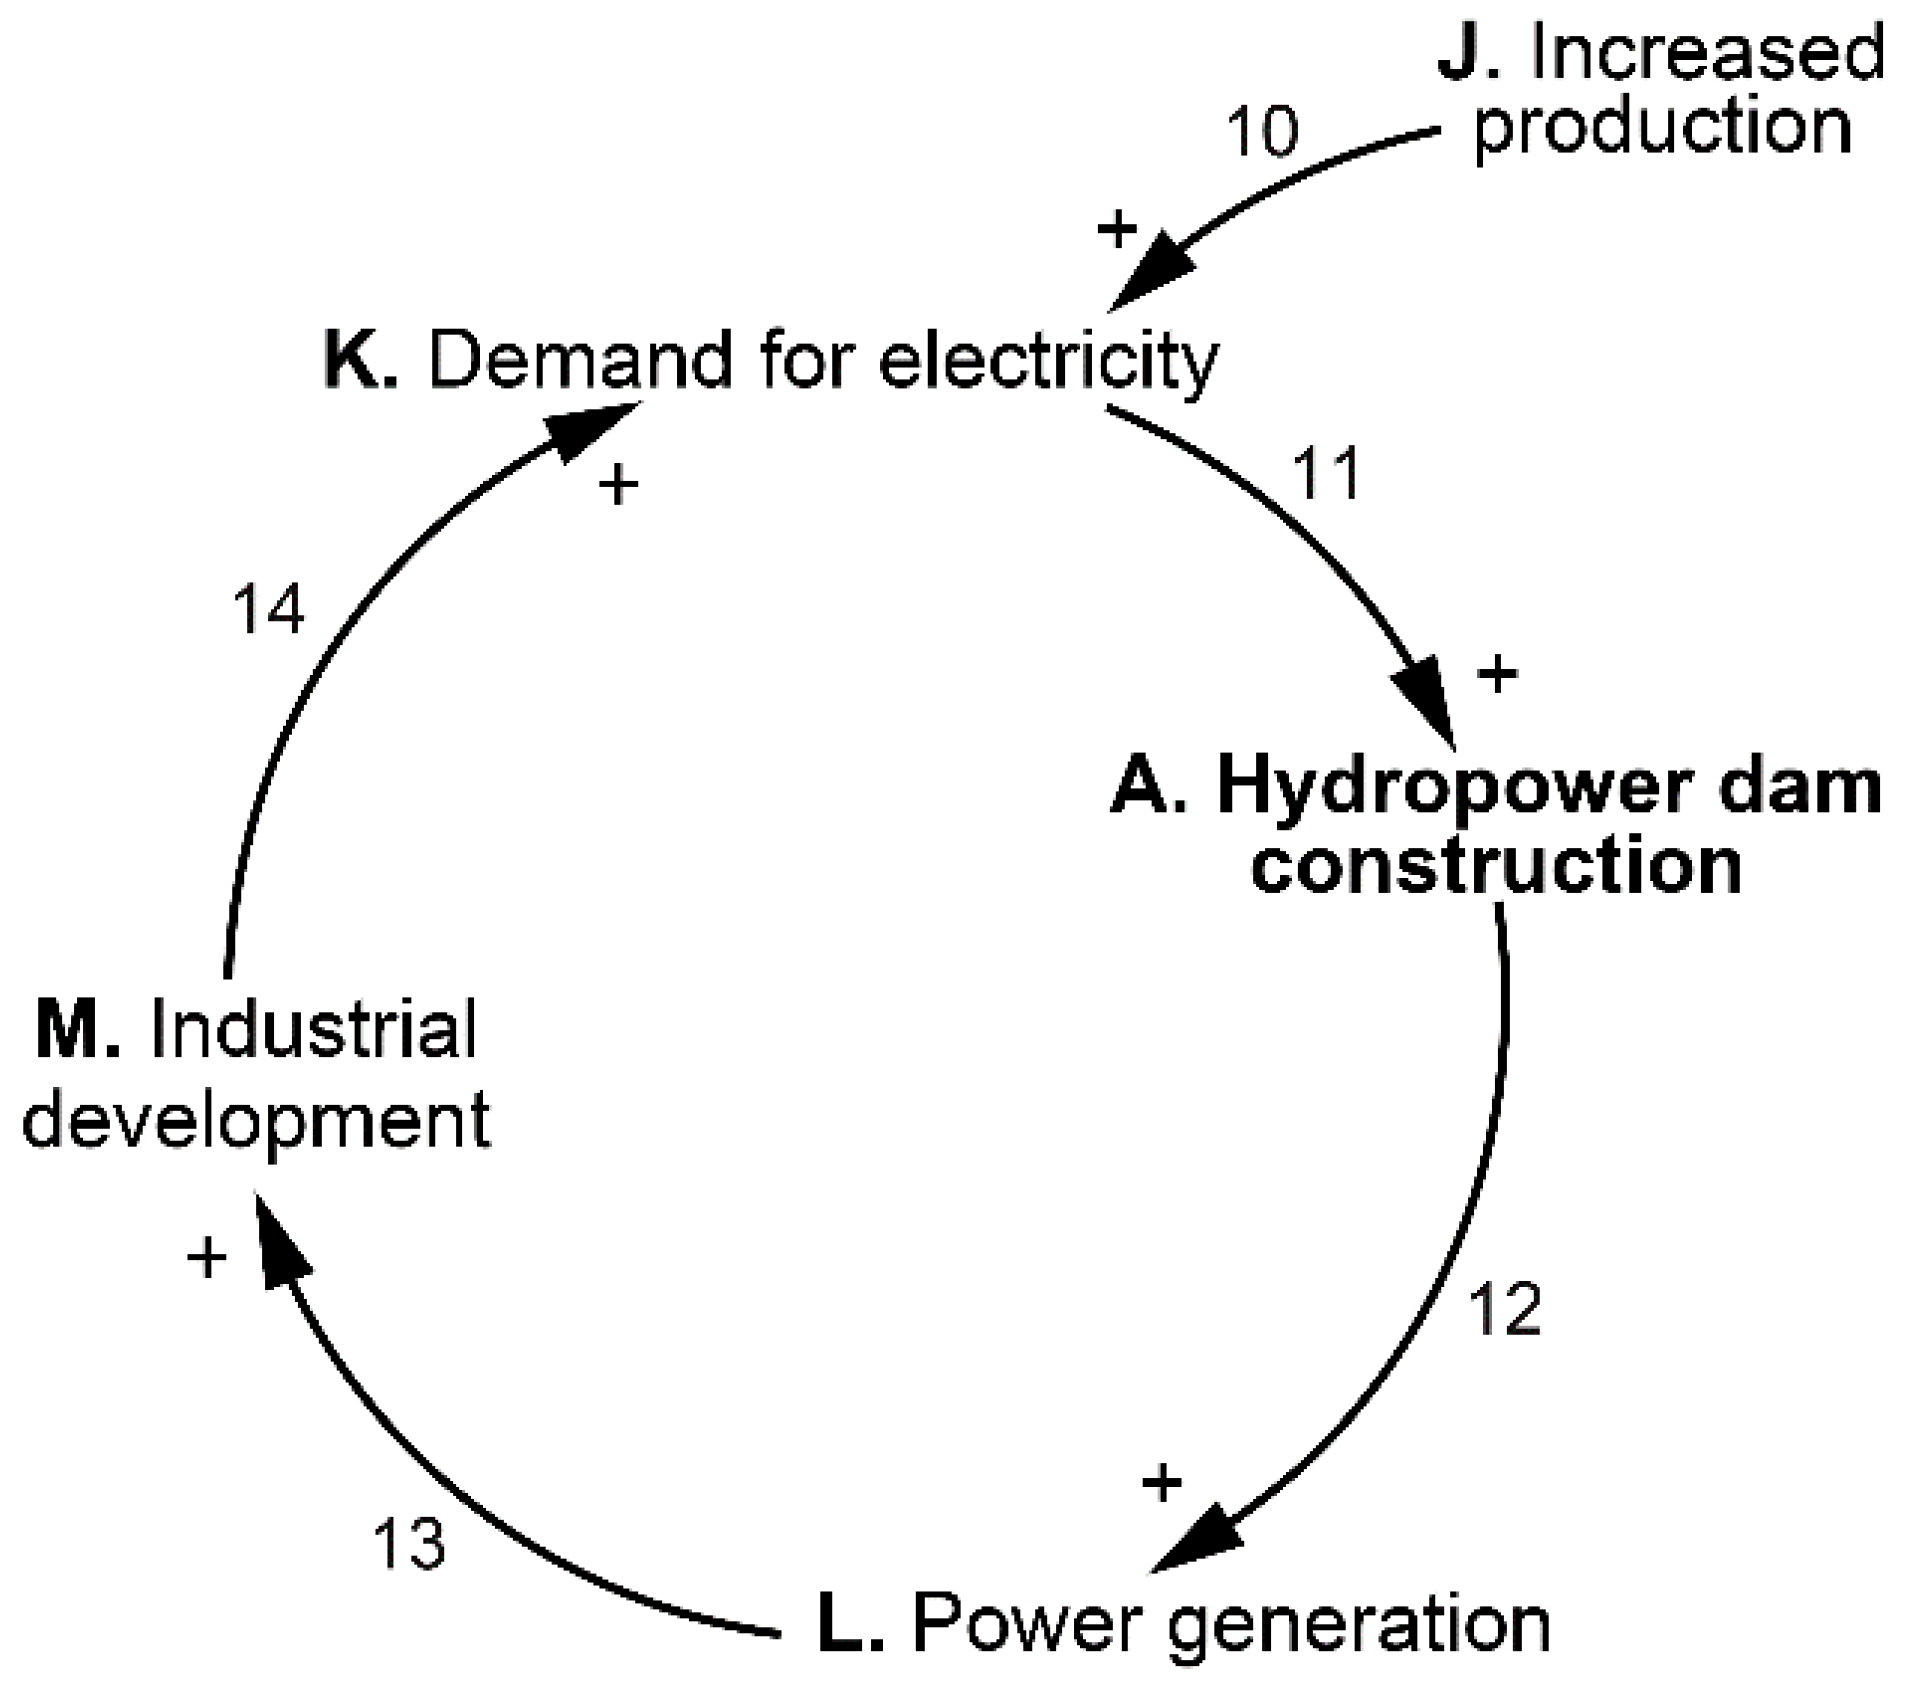
3.2. Hydropower Supply Influence Model

The hydropower supply influence model is shown in Figure 6. Increased demand for electricity is driving still further hydropower construction in the region [39]. Southeast Asia’s energy demand is projected to increase by 80% or more between 2013 and 2035 [11,39]. Programs for grid interconnections among the countries of Southeast Asia will enable countries like Laos to further export electricity to neighboring countries where there is a high demand, including China, Thailand and Vietnam. The Strategic Environmental Assessment for the LMB calculates that there is 53,000 MW potentially feasible hydropower generation available based on flows in the Mekong River basin while the eleven main stem dams would produce 14,697 MW of this total [7].
New hydropower dams are increasing power generation, which is supporting industrial development. Access to electricity ranges from near-universal in Thailand down to 66% of the population in Cambodia [32,39]. Cambodia has experienced over a decade of strong economic growth focused in the garment manufacture, tourism and construction industries. The high cost of energy has constrained agricultural processing, leading to a call for access to cheaper electricity from neighboring countries [40]. Laos has also had a prolonged period of economic growth driven by investments in the hydropower, mining, agriculture, transport and tourism supported by new roads and rural electrification: it sees itself becoming the hydropower “battery” for the region [41]. There have been three decades of strong economic growth in Vietnam’s agricultural sector and industry, and the economy is changing from a focus on natural resource utilization to services. However, poor infrastructure and power cuts constrain the economy at this time [42]. Although Vietnam has recently expressed concern over the impacts of hydropower development in Laos on the Mekong delta, its state-owned corporations are among the investors in proposed hydropower projects in Laos [43]. Thailand has experienced four decades of economic growth with the economy transitioning from an agricultural focus to one based on manufacturing and services, including tourism. Extensive imports of energy, including hydropower from Laos, fuel the Thai economy [44]. In turn, this industrial development further increases demand for electricity.

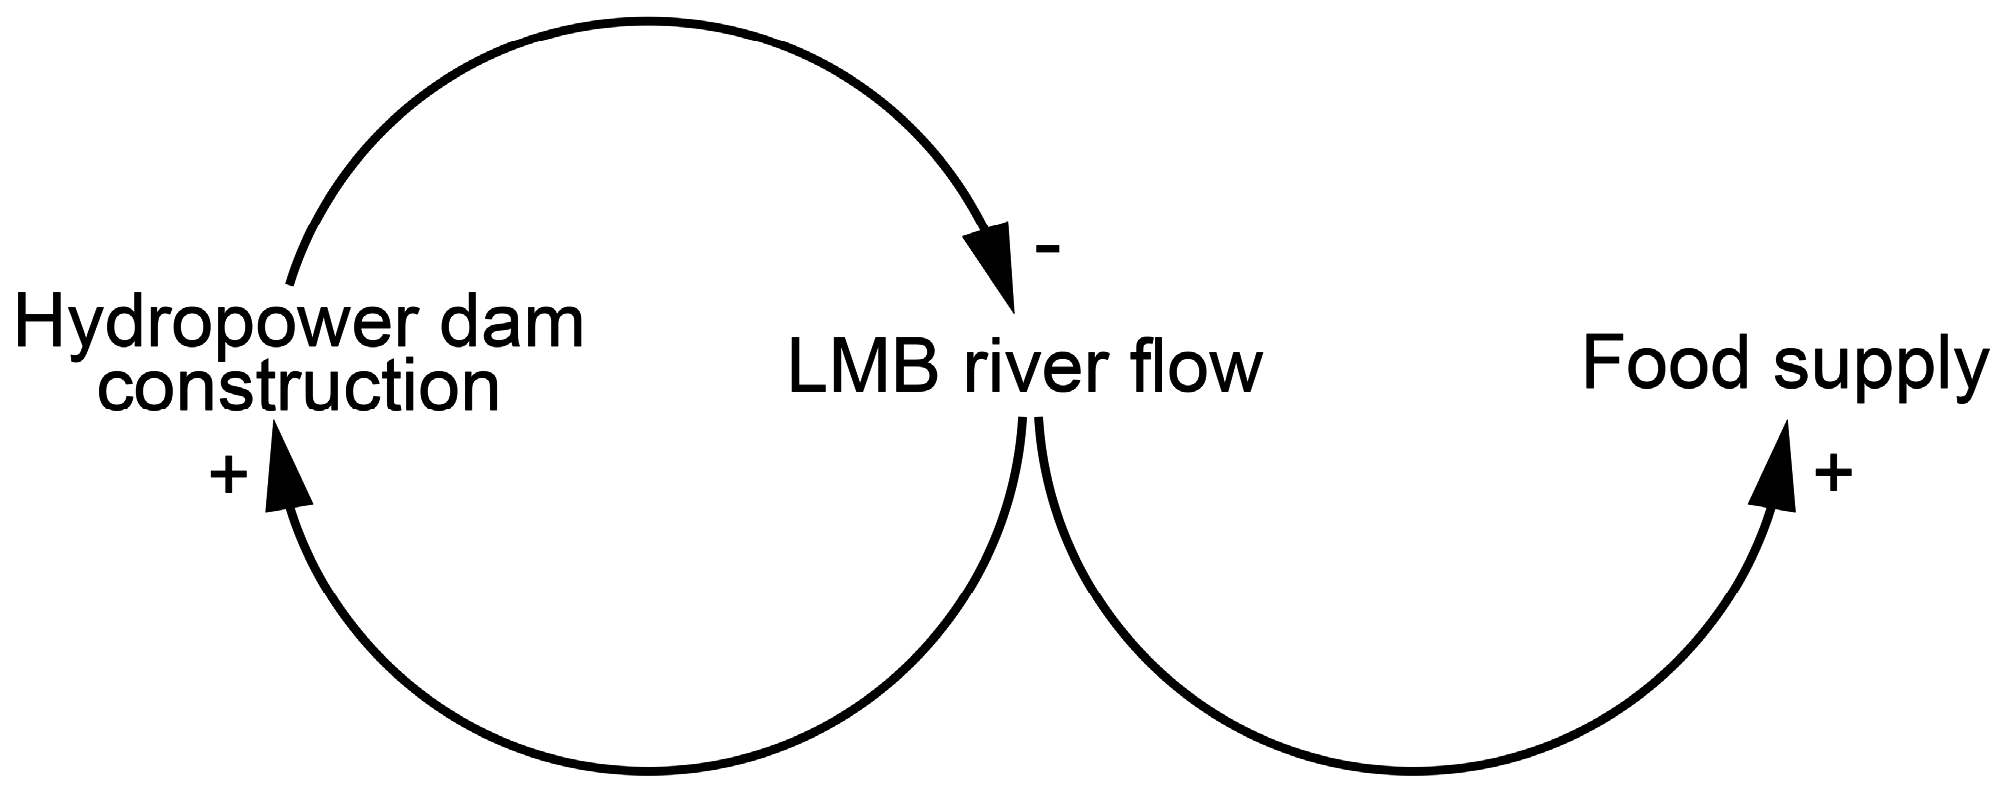
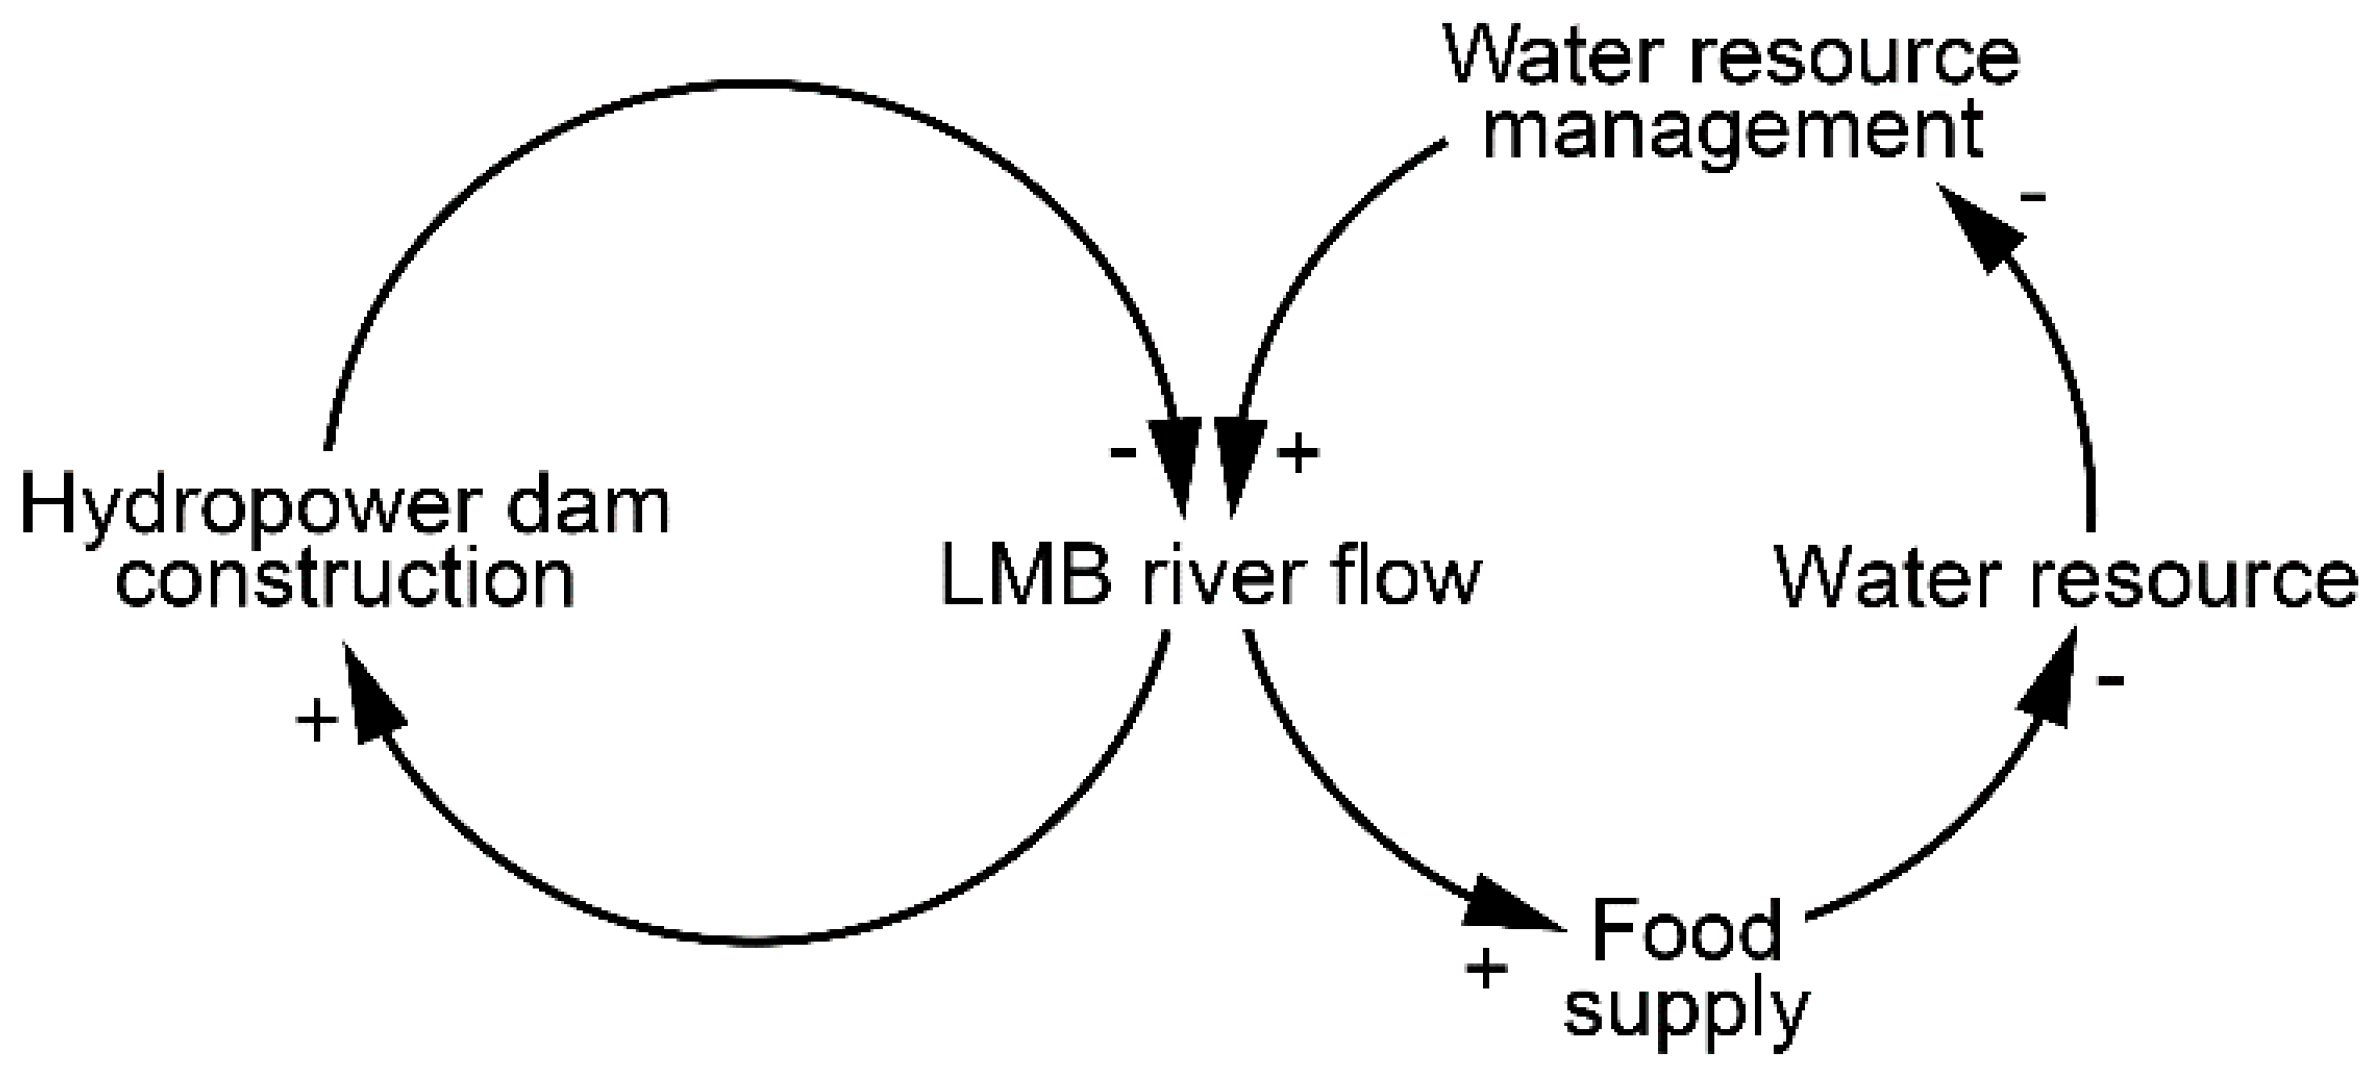
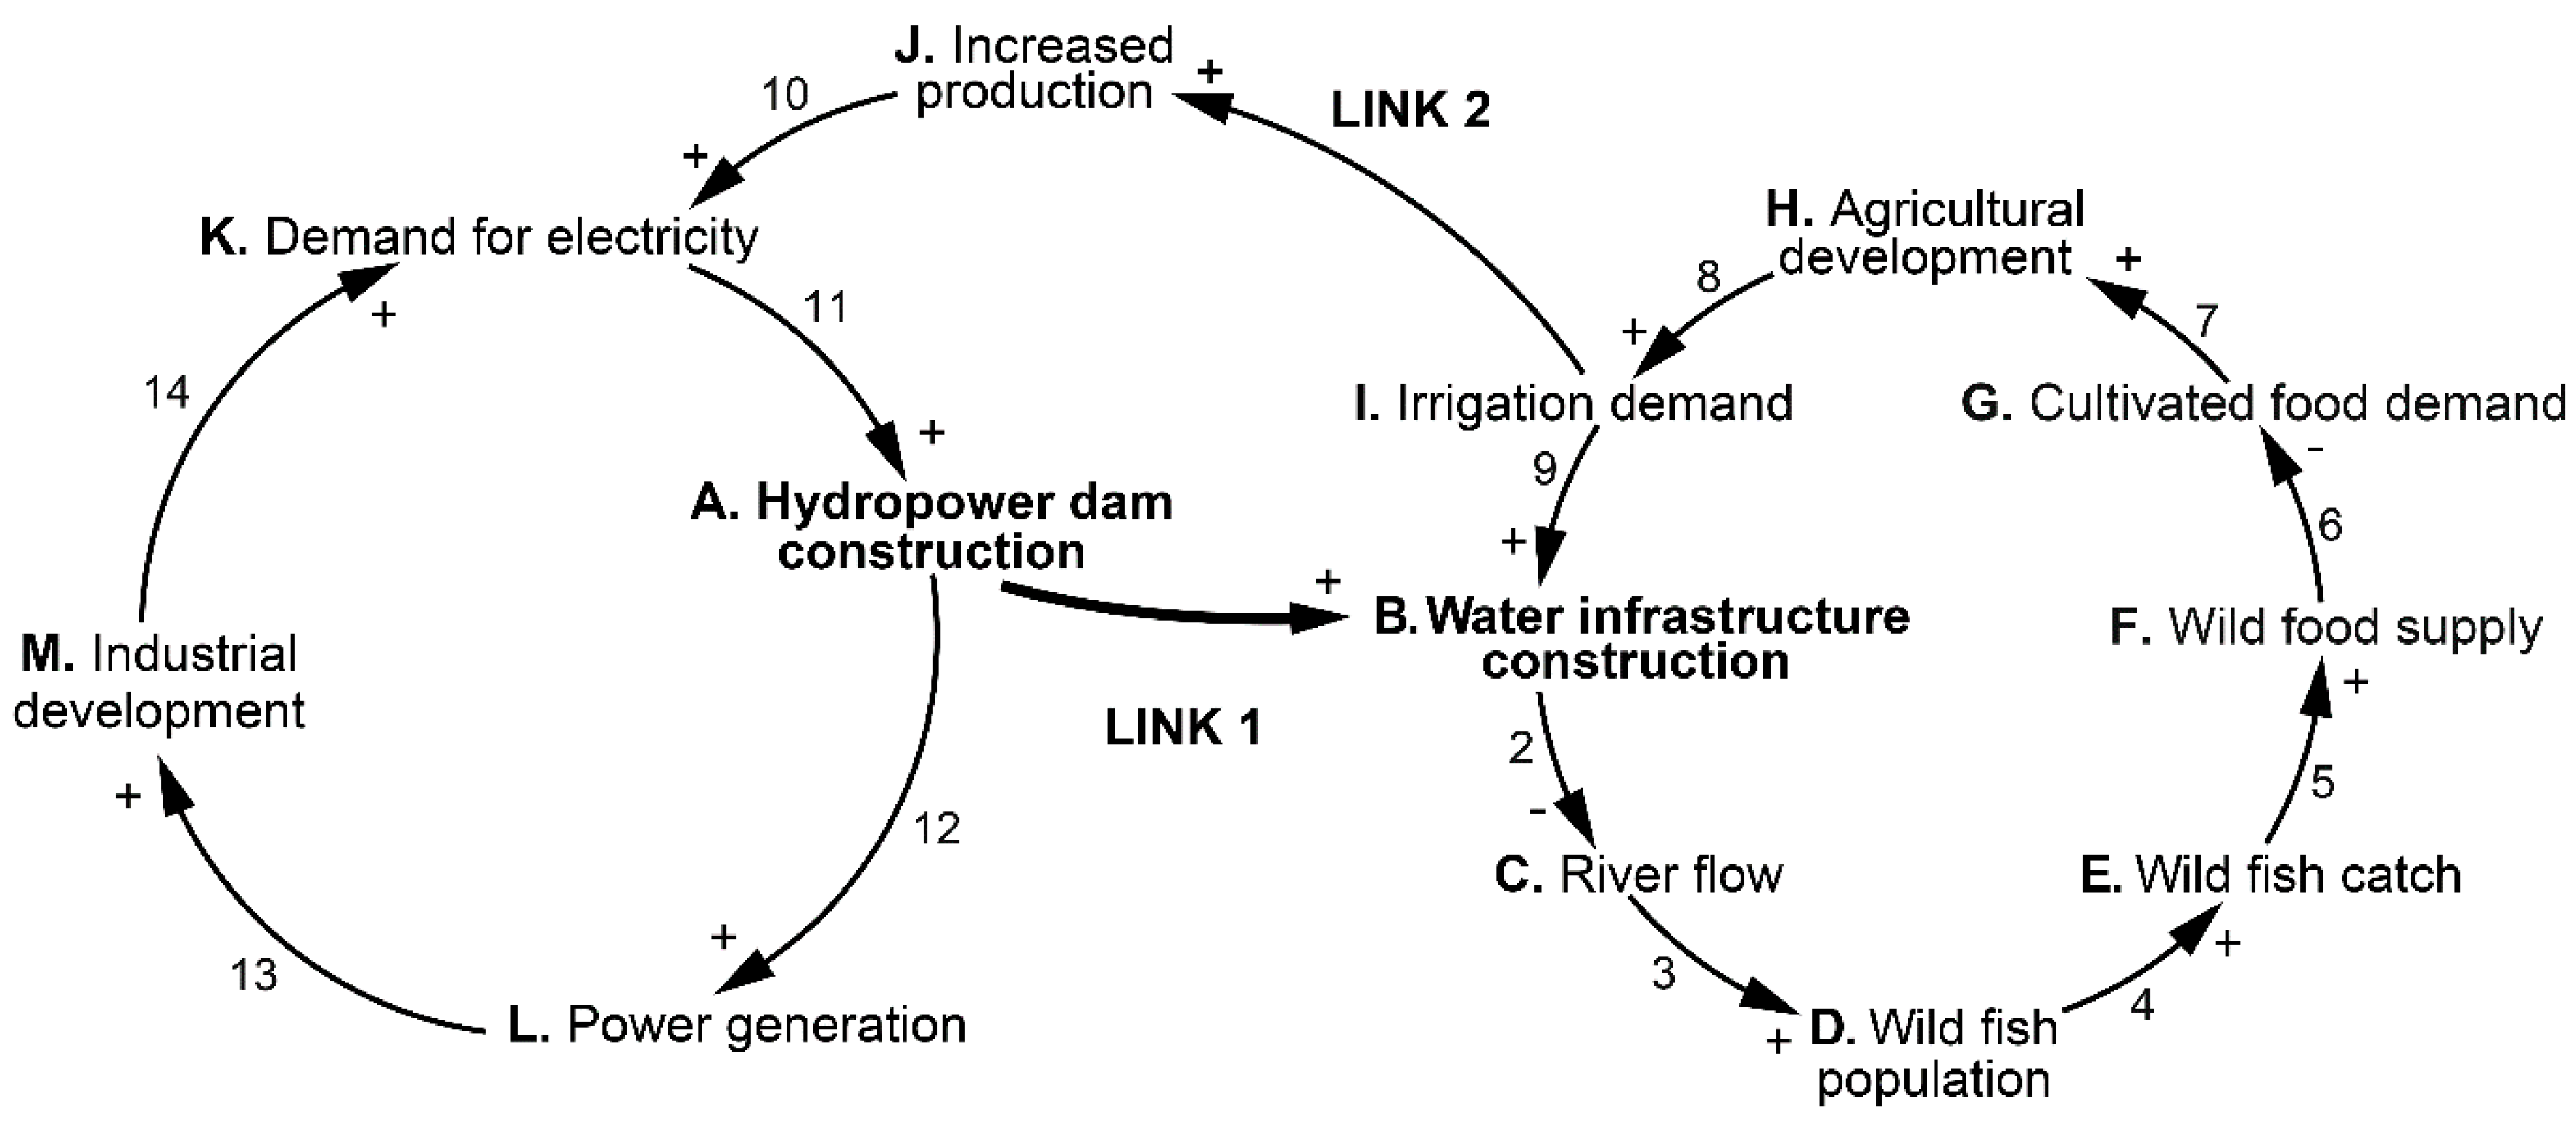
3.3. Hydropower–Food Supply Nexus Influence Model for the LMB

In Figure 7, the food supply and hydropower feedback loops are connected with two major links, as follows. In Loop 1, construction of water infrastructure is diminishing wild fish stocks. In Loop 2, hydro dam construction increases demand for electricity. Details of the variables A to M and the causal links 1 to 14 are found in the lists provided for Figure 5 and Figure 6.
Connecting these two reinforcing loops to create a generic river basin model, in Link 1, hydro dam construction is projected to lead to a net reduction in wild fish stock, diminishing the supply of protein (Table 1), and consequently, adding to increasing demand for protein [11]. Agricultural development in part is being driven by demand for protein rich foods in countries with emerging economies, including Thailand and Vietnam [48,49,50]. In Link 2, agricultural development requires considerable energy for pumping water, for manufacture of farm chemicals and for transport, among other aspects [51].
Arguably, a third link would show that increased irrigation diminishes power generation by diverting water upstream of hydropower dams. For simplicity this link is not included. While the precise degree to which hydropower generation would be diminished by irrigation diversions is unknown, the major areas of irrigation in the Basin are currently downstream of planned dams. Further, for one of the major proposed lift irrigation projects the immediate downstream loss of hydropower potential is 5.2% in the wet season and double that in the dry season [52].
Consequently, agricultural intensification is increasing demand for more energy and thus power generation. Balancing loops are also present in this system, such as related to the dynamics of fish population (catch affects the stock) and ecosystem health. On the other hand, the two reinforcing feedback loops mentioned above emerge as the dominant ones.
In this way, the water infrastructure–food production and the hydropower–industrial development loops are connected and self-reinforcing. To test this generic model, it was applied to the hydropower–food supply nexus in the Lower Mekong Basin to provide the starting point to construct a model of the energy food water nexus in that region. Elaborating the model, Figure 8 gives our initial version of an elaborated influence model for the hydropower–food supply nexus in the lower Mekong Basin. This elaborated model also includes other major, external influences that affect major variables of the generic models, for example, fossil fuel inputs into energy as an individual factor in agricultural development [53]. The darker shaded overlap between the energy and food loops in Figure 8 highlights that water, agricultural resources use, biodiversity and hydropower dams are the nexus in this system.
It also starts to identify consequences for a range of natural resources availability as ecosystem services are increasingly used for energy and agricultural production. These include impacts on forest cover, biodiversity and atmospheric greenhouse gas composition.

4. Discussion

This influence model for the hydropower–food supply nexus in the lower Mekong Basin illustrates two important attributes of this system, namely that it is a complex system that has reinforcing loops that tend to increase resource consumption at the expense of ecosystem health, and also that achieving desired outcomes requires strategic interventions.

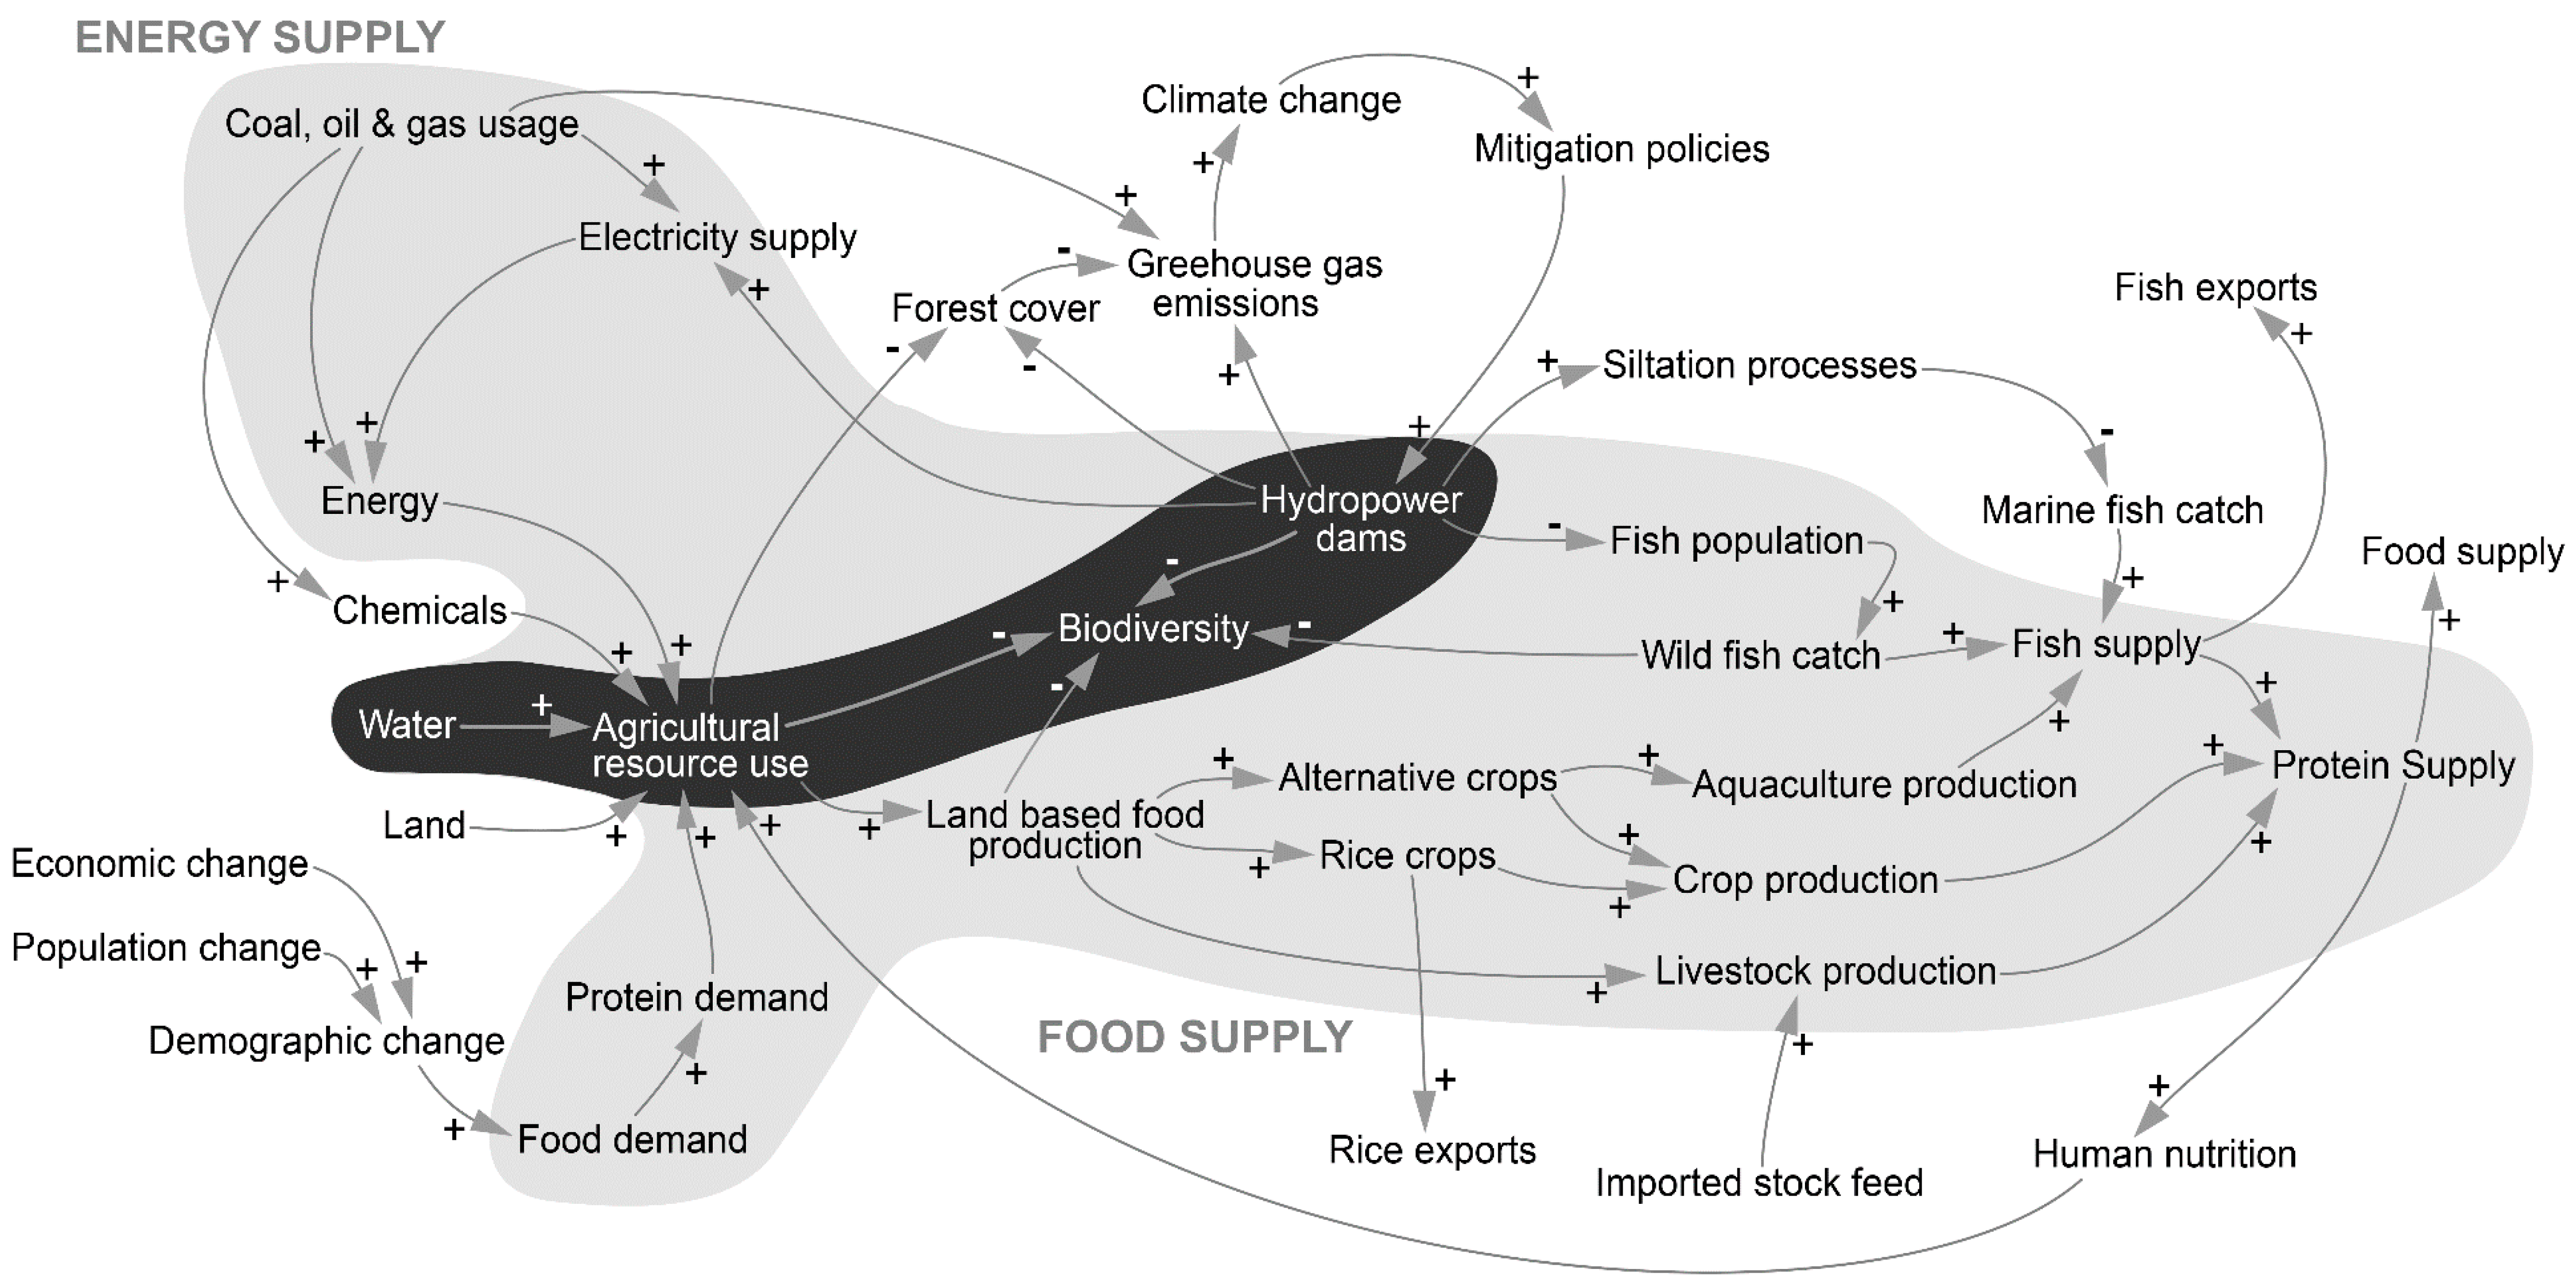
4.1. A Complex System

Our model (Figure 8) highlights that the hydropower–food supply nexus in the lower Mekong Basin is part of a complex system where an intervention in one aspect, such as hydro dam construction, will have cascading consequences for a wide range of other sectors in the socio-ecological system. This raises a number of challenges for governance institutions. The key implication is that sectoral decision making to maximize outputs of one variable can have negative consequences on other variables in other sectors. A key example in this case is that hydro dam development leads to a loss in wild fish stock among a range of negative impacts on other variables.
More conventional assessment approaches misrepresent the complexity of the system being impacted, for example, by investment in hydropower dams. As an example, the 2015 technical review report on “Prior Consultation for the Proposed Don Sahong Hydropower Project” in Laos focuses almost exclusively on potential local impacts without considering the broader range of values influenced in the Basin system [54]. Further Matthews and Motta [55] detail the gap between Chinese policies to manage the water, energy and food nexus versus the lack of application by Chinese state-owned enterprises constructing dams in the Mekong region. We contend that the influence modeling detailed here could inform better nexus decisions in both these cases were the relevant decision makers motived to improve outcomes across sectors.
An important finding from this influence model is that the current development trajectory in the lower Mekong Basin is self-reinforcing. To elaborate: hydro dam development in diminishing wild fish stocks adds to the demand for alternative protein-rich food supplies from intensive agriculture, which in turn requires industrial inputs such as farm chemicals and water pumping. This further increases demand for electricity, hydropower dam construction and further undermines environmental integrity. In other words, without high-level policy intervention across sectors, such as by central institutions in a national government, the current development path is not sustainable and will continue to diminish fisheries, increase land use conversion to agriculture, consume more water and drive biodiversity loss.
Decisions in single sectors, especially those that are more economically and politically powerful such as in energy generation and agriculture, are unlikely to maximize benefits and minimize impacts for sustainable development. This suggests that institutions such as the Mekong River Commission, whose mandate does not cover all of the key variables in this system, cannot catalyze sustainable development without the active support of senior leaders in its member national governments [56]. Further, the river system links the lower Mekong Basin nations, such that (for example) hydropower dam development in Laos and Vietnam impacts negatively on variables downstream in Cambodia (such as fish supply) regardless of the Cambodian Government’s policies and practices.
There may be two approaches to managing these transboundary water use conflicts within the Mekong River basin. As Belinskij [57] identifies, the 1995 Mekong Agreement has a number of gaps (such as regulating use of tributaries) and emphasizes the sovereignty of member states more than international water law. Were the Mekong Agreement to be revised, influence modeling could be used to inform the scope of a new mandate consistent with international water law that would strengthen institutions for managing the nexus. Further, the lower Mekong Basin national governments could make better cross-sectoral decisions at national and lower Basin scales using influence modelling. There are governance processes that with enhancements could be harnessed to this end, for instance, the national five-year planning process in Vietnam [42], and the Basin Development Planning process of the Mekong River Commission [58]. The influencing modeling could be applied, for example, to underpin and increase the robustness of alternative scenarios for policy development, such as those proposed in the Mekong region by Kesninen et al. [59].
Many of the causal links illustrated in Figure 8 are not new. A key question is why will another analytical or planning tool be used by decision makers, given that so many nexus decisions taken in the Mekong have perverse impacts? What our influence model provides is a framework for policy makers to explore how to maximize benefits and minimize perverse outcomes across sectors, in order for them to make more informed decisions. Over time, we argue that particularly impacted countries and key governmental agencies will be motived to use influence models to solve acute problems. One example is the recent decisions by the government in Vietnam to cease rice intensification programs in the Mekong delta in favor of restoring traditional floating rice and diversifying food production because of a number of negative impacts of triple crop rice production.

4.2. Strategic Interventions

This model (Figure 8) then prompts the question of whether government and other decision makers can intervene to generate alternative outcomes, for instance, to enhance food security or maintain forest cover, without incurring unacceptable negative impacts. A number of the variables in this model are very difficult to change. For example, alone a national government in the Mekong region will have almost no influence over climate change, as the atmosphere is a global commons, and demographic change has long lag times that mean it would take decades to effect a different outcome were this desired. Yet this model suggests that there are a number of strategic opportunities for government and other decision makers to intervene to significantly change the outcomes. Here we suggest a three such interventions to illustrate this potential: in particular, alternative electricity supplies, agricultural land use intensification and better fisheries management.
Supplying electricity differently could significantly change outcomes. If non-hydro renewable power generation were used to forestall new hydropower generation capacity, there would be the potential to conserve wild fish populations, biodiversity and forest cover, while reducing greenhouse gas emissions [52]. For instance, a number of studies suggest that significant wind and biofuel generation is feasible in the region, as well as demand management through energy trade and also energy efficiency in the industrial sector [60,61,62]. These interventions would require policies that favor investment in non-hydro renewable power generation. Alternatively, if there were a desire to continue hydropower development but reduce the scale of its perverse impacts, a number of methods exist to select projects with lower social and environmental impacts as opposed to the current ad hoc commissioning processes [63,64]. These methods would, for instance, enable projects to be selected that have lower impacts on fish populations or inundate smaller areas of land. More centralized planning of hydropower concessions would be required.
Theoretically, managing existing agricultural land more intensively and sustainably has the potential to produce more food with no further loss of forest cover and biodiversity, while reducing greenhouse gas emissions [65]. Sustainable intensification of agriculture is the focus of relevant global programs, including of the UN Food and Agricultural Organization [66] and the Cooperative Group on International Agriculture Research [67]. Nevertheless there are risks, including of increased agricultural productivity driving demand for agricultural expansion in the landscape [68,69]. Governments would need to better regulate land use and invest in agricultural support for this intervention to succeed.
Better wild fisheries management has the potential to increase the sustainable catch and thus the protein supply, reducing demand for this food from aquaculture, crops and livestock. Measures such as fish conservation areas, enforcement of fisheries regulations and removal of non-hydropower barriers to migration may all increase fish stocks and thus the sustainable yield [70,71,72]. This intervention requires stronger, day-to-day regulation at a local scale if it is to succeed.
The three interventions described above could be considered largely complementary and could be led by sectoral government agencies, such as those for energy, agriculture, forests and fisheries. In this sense these interventions are not overly complex governance challenges. We suggest that the primary challenges for societies and governments to implement this sort of approach lie in leadership and transparent implementation. Political leadership is required for these types of strategic intervention to receive priority and funding for implementation from central government planning and financial agencies. As these types of interventions involve favoring some kinds of vested interests over others, such as solar panel suppliers over hydropower developers, then transparency of decision making and enforcement will be needed at national and sub-national scales.

4.3. Analytical Value

Our analysis of the hydropower–food supply nexus in the lower Mekong Basin through progressively more elaborate influence models has mapped a complex system at a level of detail that may be interrogated to identify strategic interventions that may maximize desirable outcomes while minimizing perverse impacts. We argue that this approach can be used to identify the most important, generic variables that may apply to the hydropower–food supply nexus to inform policy making for other large river systems globally. Around the world, planning is advanced to develop hydropower on the last remaining free flowing rivers, for example, with the Amazon, Amur, Brahmaputra, Congo and Irrawaddy rivers [73]. This model needs to be tested to assess its applicability to such large rivers around the world. At either end of a development spectrum, two places where there may be sufficient data to inform such an analysis are the heavily developed Yangtze River in China [74] and the Tapajos River tributary of the Amazon that is little impacted to date (Bagossi, personal communication). This type of analysis would enable national and sub-national policy makers to take more informed development and management decisions across a range of sectors.

4.4. Novelty

This research adds new findings and methodological lessons for managing the water, energy and food nexus in the Mekong River basin and transboundary river basins more generally. The methodological novelty lies in the systematic scope of these influence models, which show how any one intervention has knock-on effects on others. More conventional assessment approaches, such as the Don Sahong hydropower project environmental impact assessment, misrepresent the complexity of the system and are thus likely to result in negative impacts. Application of these models is not only an analytical tool, but can also be a focus for dialogue among actors across sectors, and inform governance.
A key finding from this analysis of the Mekong River basin is that the current development trajectory for more industrial energy and food production is self-reinforcing. This means that for proponents of changed management in a particular sector, that they will need to engage other sectors and at greater scales if their proposed change is to last. In the case of the Mekong, the analysis presented here highlights policy decisions that need to be taken by national leaders if greater positive synergies with interventions across sectors are to be realized.

5. Conclusions

This analysis of the hydropower–food supply nexus in the lower Mekong Basin through the application of influence models has shown how changing one variable can be seen to have knock on effects throughout a complex system. This modeling also enables identification of options for strategic interventions to maximize benefits while minimizing negative impacts. This kind of analysis requires political leadership and would enable national and sub-national policy makers to take more informed cross-sectoral decisions. We propose that this approach be tested to see if it may identify the generic variables that may apply to the hydropower–food supply nexus to inform policy making for other large river systems globally. The different levels of industrial use of the waters of large transboundary rivers offers the prospect that systematically applying this model may enable lessons on avoiding perverse impacts and seizing positive synergies to be shared to enhance river management.
In the context of a “nexus approach” to transboundary river basins [75], the use of influence models aids systematic analysis by identifying links across sectors. Developing and using influence models enables discourse among actors on trade-offs and synergies across water, energy, food and other sectors. Finally, by making costs and benefits more explicit among different actors, this modeling can enhance governance with better cross-sectoral collaboration and policy coherence.

Acknowledgments

The authors’ research was supported by the Luc Hoffmann Institute for conservation research through its Navigating the Nexus program. Clive Hilliker, ANU, prepared the figures in this paper.

Author Contributions

Jamie Pittock proposed the research, was lead writer, and assessed the variables. Jamie Pittock and David Dumaresq drafted the initial influence diagrams and text. Andrea M. Bassi contributed expertise on influence modelling methods, and revised the diagrams and text.

Conflicts of Interest

The authors declare no conflict of interest.

References

  1. Molden, D. (Ed.) Water for Food, Water for Life a Comprehensive Assessment of Water Management in Agriculture; Earthscan & International Water Management Institute: London, UK; Colombo, Sri Lanka, 2007.
  2. International Energy Agency (IEA). World Energy Outlook 2012; IEA: Paris, France, 2012. [Google Scholar]
  3. Hussey, K.; Pittock, J.; Dovers, S. Justifying, extending and applying “nexus” thinking in the quest for sustainable development. In Climate, Energy and Water; Pittock, J., Hussey, K., Dovers, S., Eds.; Cambridge University Press: Cambridge, UK, 2015; pp. 1–5. [Google Scholar]
  4. Richter, B.D.; Postel, S.; Revenga, C.; Scudder, T.; Lehner, B.; Churchill, A.; Chow, M. Lost in development’s shadow: The downstream human consequences of dams. Water Altern. 2010, 3, 14–42. [Google Scholar]
  5. Vorosmarty, C.J.; McIntyre, P.B.; Gessner, M.O.; Dudgeon, D.; Prusevich, A.; Green, P.; Glidden, S.; Bunn, S.E.; Sullivan, C.A.; Liermann, C.R.; et al. Global threats to human water security and river biodiversity. Nature 2010, 467, 555–561. [Google Scholar] [CrossRef] [PubMed]
  6. World Commission on Dams (WCD). Dams and Development: A New Framework for Decision-Making. The Report of the World Commission on Dams; Earthscan: London, UK, 2000. [Google Scholar]
  7. International Center for Environmental Management (ICEM). MRC Strategic Environmental Assessment (SEA) of Hydropower on the Mekong Mainstream: Final Report; ICEM: Hanoi, Vietnam, 2010. [Google Scholar]
  8. Hortle, K.G. Consumption and the Yield of Fish and Other Aquatic Animals from the Lower Mekong Basin; Mekong River Commission: Vientiane, Laos, 2007. [Google Scholar]
  9. Ziv, G.; Baran, E.; Nam, S.; Rodríguez-Iturbe, I.; Levin, S.A. Trading-off fish biodiversity, food security, and hydropower in the Mekong river basin. Proc. Natl. Acad. Sci. USA 2012, 109, 5609–5614. [Google Scholar] [CrossRef] [PubMed]
  10. Orr, S.; Pittock, J.; Chapagain, A.; Dumaresq, D. Dams on the Mekong River: Lost fish protein and the implications for land and water resources. Glob. Environ. Chang. 2012, 22, 925–932. [Google Scholar] [CrossRef]
  11. Pittock, J.; Dumaresq, D.; Orr, S. The Mekong River: Trading off hydropower, fish and food. Reg. Environ. Chang. 2016. submitted. [Google Scholar]
  12. Meadows, D.H. The unavoidable a priori. In Elements of the System Dynamics Method; Randers, J., Ed.; Productivity Press: Portland, OR, USA, 1980; pp. 23–57. [Google Scholar]
  13. Randers, J. Elements of System Dynamics Method; Productivity Press: Portland, OR, USA, 1980. [Google Scholar]
  14. Richardson, G.P.; Pugh, A.I., III. Introduction to System Dynamics Modeling with Dynamo; Productivity Press: Portland, OR, USA, 1981. [Google Scholar]
  15. Forrester, J.W.; Lux, N.; Stuntz, L. Road Maps: A guide to Learning System Dynamics; System Dynamics Group, Sloan School of Management, MIT: Cambridge, MA, USA, 2002. [Google Scholar]
  16. Sterman, J.D. Business Dynamics: Systems Thinking and Modeling for a Complex World; Irwin/McGraw-Hill: Boston, MA, USA, 2000. [Google Scholar]
  17. Probst, G.; Bassi, A. Tackling Complexity. A Systems Approach for Decision Makers; Greenleaf Publishing: London, UK, 2014. [Google Scholar]
  18. Forrester, J.W. Industrial Dynamics; Productivity Press: Portland, OR, USA, 1961. [Google Scholar]
  19. Proust, K.; Newell, B. Catchment and Community: Towards a Management-Focused Dynamical Study of the Act Water System; The Australian National University: Canberra, Australia, 2006. [Google Scholar]
  20. Dyball, R.; Newell, B. Understanding Human Ecology: A Systems Approach to Sustainability; Earthscan/Routledge: London, UK, 2014. [Google Scholar]
  21. Proust, K.; Dovers, S.; Foran, B.; Newell, B.; Steffen, W.; Troy, P. Climate, Energy and Water: Accounting for the Links; Land and Water Australia: Canberra, Australia, 2007; p. 68. [Google Scholar]
  22. Johnston, R.; Try, T.; de Silva, S. Agricultural Water Management Planning in Cambodia; International Water Management Institute and Australian Centre for International Agricultural Research: Colombo, Sri Lanka, 2013. [Google Scholar]
  23. Postel, S.; Richter, B. Rivers for Life: Managing Water for People and Nature; Island Press: Washington, DC, USA, 2003; p. 253. [Google Scholar]
  24. Amornsakchai, S.; Annez, P.; Vongvisessomjai, S.; Choowaew, S.; Kunurat, P.; Nippanon, J.; Schouten, R.; Sripapatrprasite, P.; Vaddhanaphuti, C.; Vidthayanon, C.; et al. Pak Mun Dam, Mekong River Basin, Thailand. A WCD Case Study Prepared as an Input to the World Commission on Dams; World Commission on Dams: Cape Town, South Africa, 2000. [Google Scholar]
  25. Basin Development Plan Programme (BDPP). Regional Irrigation Sector Review for Joint Basin Planning Process; Basin Development Plan Programme, Mekong River Commission: Vientiane, Laos, 2009. [Google Scholar]
  26. International Center for Environmental Management (ICEM). MRC SEA for Hydropower on the Mekong Mainstream. Fisheries Baseline Assessment Working Paper; ICEM: Hanoi, Vietnam, 2010. [Google Scholar]
  27. Food and Agricultural Organization of the United Nations. FAOstat; FAO: Rome, Italy, 2009. [Google Scholar]
  28. Pech, S. Water sector analysis. In The Water-Food-Energy Nexus in the Mekong Region; Smajgl, A., Ward, J., Eds.; Springer: New York, NY, USA, 2013; pp. 19–60. [Google Scholar]
  29. Godfray, H.C.J.; Beddington, J.R.; Crute, I.R.; Haddad, L.; Lawrence, D.; Muir, J.F.; Pretty, J.; Robinson, S.; Thomas, S.M.; Toulmin, C. Food security: The challenge of feeding 9 billion people. Science 2010, 327, 812–818. [Google Scholar] [CrossRef] [PubMed]
  30. Floch, P.; Molle, F. Irrigated agriculture and rural change in Northeast Thailand: Reflections on present developments. In Governing the Mekong: Engaging in the Politics of Knowledge; Daniel, R., Lebel, L., Manorom, K., Eds.; Strategic Information and Research Development Centre: Petaling Jaya, Malaysia, 2013; pp. 185–198. [Google Scholar]
  31. Phengphaengsy, F.; Noble, A. Reconsidering irrigation management transfer in Laos. In Governing the Mekong: Engaging in the Politics of Knowledge; Daniel, R., Lebel, L., Manorom, K., Eds.; Strategic Information and Research Development Centre: Petaling Jaya, Malaysia, 2013; pp. 137–162. [Google Scholar]
  32. Thuon, T. Localizing development and irrigation management in Cambodia. In Governing the Mekong: Engaging in the Politics of Knowledge; Daniel, R., Lebel, L., Manorom, K., Eds.; Strategic Information and Research Development Centre: Petaling Jaya, Malaysia, 2013; pp. 163–184. [Google Scholar]
  33. Brooks, J. Agricultural Policy Choices in Developing Countries: A Synthesis; OECD: Paris, France, 2010. [Google Scholar]
  34. Ministry for Agriculture and Forestry. Strategy for Agricultural Development 2011 to 2020; Lao PDR Ministry for Agriculture and Forestry: Vientiane, Laos, 2010.
  35. Tran, C.T. Overview of Agriculture Policy in Vietnam; Food Fertilizer and Technology Center for the Asian and Pacific Region: Taipei, Taiwan, 2014. [Google Scholar]
  36. Singhapreecha, C. Economy and Agriculture in Thailand; Food Fertilizer and Technology Center for the Asian and Pacific Region: Taipei, Taiwan, 2014. [Google Scholar]
  37. Trung, N.H.; Tuan, L.A.; Trieu, T.T. Multi-level governance and adaptation to floods in the Mekong delta. In Governing the Mekong: Engaging in the Politics of Knowledge; Daniel, R., Lebel, L., Manorom, K., Eds.; Strategic Information and Research Development Centre: Petaling Jaya, Malaysia, 2013; pp. 111–126. [Google Scholar]
  38. De Silva, S.; Johnston, R.; Senaratna Sellamuttu, S. Agriculture, Irrigation and Poverty Reduction in Cambodia: Policy Narratives and Ground Realities Compared; CGIAR Research Program on Aquatic Agricultural Systems: Penang, Malaysia, 2014. [Google Scholar]
  39. International Energy Agency (IEA). Southeast Asia Energy Outlook. World Energy Outlook Special Report; IEA: Paris, France, 2013. [Google Scholar]
  40. World Bank. Clear Skies. Cambodia Economic Update; World Bank Group: Washington, DC, USA, 2014. [Google Scholar]
  41. World Bank. Country Partnership Strategy Progress Report for the Lao People’s Democratic Republic; Report No. 90281-la; World Bank Group: Washington, DC, USA, 2014. [Google Scholar]
  42. World Bank. Country Partnership Strategy for the Socialist Republic of Vietnam for the Period fy12-fy16; Report No. 65200-vn; World Bank Group: Washington, DC, USA, 2011. [Google Scholar]
  43. The Mekong River Commission (MRC). Mekong Basin Hydropower Database—Master; The Mekong River Commission Secretariat: Vientiene, Laos, 2009. [Google Scholar]
  44. Central Intelligence Agency (CIA). Thailand; CIA: Langley, VA, USA, 2015. [Google Scholar]
  45. Fullbrook, D. Food security in the wider Mekong region. In The Water-Food-Energy Nexus in the Mekong Region; Smajgl, A., Ward, J., Eds.; Springer: New York, NY, USA, 2013; pp. 61–104. [Google Scholar]
  46. Mushtaq, S.; Maraseni, T.N.; Maroulis, J.; Hafeez, M. Energy and water tradeoffs in enhancing food security: A selective international assessment. Energy Policy 2009, 37, 3635–3644. [Google Scholar] [CrossRef] [Green Version]
  47. Lazarus, K. Mining in the Mekong region. In The Water-Food-Energy Nexus in the Mekong Region; Smajgl, A., Ward, J., Eds.; Springer: New York, NY, USA, 2013; pp. 191–208. [Google Scholar]
  48. Walker, P.; Rhubart-Berg, P.; McKenzie, S.; Kelling, K.; Lawrence, R.S. Public health implications of meat production and consumption. Public Health Nutr. 2005, 8, 348–356. [Google Scholar] [CrossRef] [PubMed]
  49. Bender, A. Meat and Meat Products in Human Nutrition in Developing Countries; FAO: Rome, Italy, 1992. [Google Scholar]
  50. High Level Panel of Experts on Food Security and Nutrition (HLPE). Note on Critical and Eerging Issues for Food Security and Nutrition. Prepared for the Committee on World Food Security; FAO: Rome, Italy, 2014. [Google Scholar]
  51. Faidley, L. Energy and agriculture. In Energy in Farm Production; Fluck, R., Ed.; Elsevier: Amsterdam, The Netherlands, 1992; pp. 1–12. [Google Scholar]
  52. Foran, T. Impacts of natural resource-led development on the Mekong energy system. In The Water-Food-Energy Nexus in the Mekong Region; Smajgl, A., Ward, J., Eds.; Springer: New York, NY, USA, 2013; pp. 105–142. [Google Scholar]
  53. Conforti, P.; Giampietro, M. Fossil energy use in agriculture: An international comparison. Agric. Ecosyst. Environ. 1997, 65, 231–243. [Google Scholar] [CrossRef]
  54. The Mekong River Commission (MRC). Technical Review Report on Prior Consultation for the Proposed Don Sahong Hydropower Project; The Mekong River Commission Secretariat: Vientiane, Laos, 2015. [Google Scholar]
  55. Matthews, N.; Motta, S. Chinese state-owned enterprise investment in Mekong hydropower: Political and economic drivers and their implications across the water, energy, food nexus. Water 2015, 7, 6269–6284. [Google Scholar] [CrossRef]
  56. Dore, J.; Lazarus, K.; Molle, F.; Foran, T.; Kakonen, M. De-marginalizing the Mekong River Commission. In Contested Waterscapes in the Mekong Region: Hydropower, Livelihoods and Governance; Molle, F., Foran, T., Kakonen, M., Eds.; Earthscan: Abingdon, UK, 2012; pp. 357–382. [Google Scholar]
  57. Belinskij, A. Water-energy-food nexus within the framework of international water law. Water 2015, 7, 5396–5415. [Google Scholar] [CrossRef]
  58. The Mekong River Commission (MRC). Mekong Basin Planning. The Story Behind the Basin Development Plan. The BDP Story; MRC: Vientienne, Laos, 2013. [Google Scholar]
  59. Keskinen, M.; Someth, P.; Salmivaara, A.; Kummu, M. Water-energy-food nexus in a transboundary river basin: The case of Tonle Sap Lake, Mekong River basin. Water 2015, 7, 5416–5436. [Google Scholar] [CrossRef]
  60. Watcharejyothin, M.; Shrestha, R.M. Regional energy resource development and energy security under CO2 emission constraint in the greater Mekong sub-region countries (GMS). Energy Policy 2009, 37, 4428–4441. [Google Scholar] [CrossRef]
  61. Foran, T. Action research to improve Thailand’s electricity planning processes. In Governing the Mekong: Engaging in the Politics of Knowledge; Daniel, R., Lebel, L., Manorom, K., Eds.; Strategic Information and Research Development Centre: Petaling Jaya, Malaysia, 2013; pp. 49–70. [Google Scholar]
  62. Karki, S.K.; Mann, M.D.; Salehfar, H. Energy and environment in the ASEAN: Challenges and opportunities. Energy Policy 2005, 33, 499–509. [Google Scholar] [CrossRef]
  63. Opperman, J.J.; Hartmann, J.; Harrison, D. Hydropower within the climate, energy and water nexus. In Climate, Energy and Water; Pittock, J., Hussey, K., Dovers, S., Eds.; Cambridge University Press: Cambridge, UK, 2015; pp. 79–107. [Google Scholar]
  64. The Mekong River Commission (MRC). Basin-Wide Rapid Sustainability Assessment Tool; MRC: Vientiene, Laos, 2010. [Google Scholar]
  65. Godfray, H.C.J.; Garnett, T. Food security and sustainable intensification. Phil. Trans. R. Soc. B 2014, 369, 20120273. [Google Scholar] [CrossRef] [PubMed]
  66. UN Food and Agricultural Organisation. Strategic Framework 2010–2019; UN Food and Agricultural Organisation: Rome, Italy, 2009. [Google Scholar]
  67. Water Land and Ecosystems (WLE). Sustainable Intensification of Agriculture: Oxymoron or Real Deal; CGIAR Research Program on Water, Land and Ecosystems: Colombo, Sri Lanka, 2015. [Google Scholar]
  68. Tscharntke, T.; Klein, A.M.; Kruess, A.; Steffan-Dewenter, I.; Thies, C. Landscape perspectives on agricultural intensification and biodiversity—Ecosystem service management. Ecol. Lett. 2005, 8, 857–874. [Google Scholar] [CrossRef]
  69. Perfecto, I.; Vandermeer, J. The agroecological matrix as alternative to the land-sparing/agriculture intensification model. Proc. Natl. Acad. Sci. USA 2010, 107, 5786–5791. [Google Scholar] [CrossRef] [PubMed]
  70. Dugan, P.J.; Barlow, C.; Agostinho, A.A.; Baran, E.; Cada, G.F.; Chen, D.; Cowx, I.G.; Ferguson, J.W.; Jutagate, T.; Mallen-Cooper, M. Fish migration, dams, and loss of ecosystem services in the Mekong basin. Ambio 2010, 39, 344–348. [Google Scholar] [CrossRef] [PubMed]
  71. Biodiversity and Fisheries Management Opportunities in the Mekong River Basin. Available online: http://69.90.183.227/doc/nbsap/fisheries/Coates.pdf (accessed on 22 September 2016).
  72. Cowx, I.; Almeida, O.; Bene, C.; Brummett, R.; Bush, S.; Darwall, W.; Pittock, J.; Van Brakel, M. Value of river fisheries. In Proceedings of the Second International Symposium on the Management of Large Rivers for Fisheries, Volume I; Welcomme, R., Petr, T., Eds.; FAO Regional Office for Asia & the Pacific: Bangkok, Thailand, 2004; pp. 1–20. [Google Scholar]
  73. World Wide Fund (WWF). Free-Flowing Rivers—Economic Luxury or Ecological Necessity; WWF: Gland, Switzerland, 2006. [Google Scholar]
  74. Anonymous. Yangtze Conservation and Development Report; Chinese Academy of Sciences: Beijing, China, 2007. [Google Scholar]
  75. Keskinen, M.; Guillaume, J.; Kattelus, M.; Porkka, M.; Räsänen, T.; Varis, O. The water-energy-food nexus and the transboundary context: Insights from large Asian rivers. Water 2016, 8, 193. [Google Scholar] [CrossRef]
Figure 1. Balancing, negative feedback loop.
Water 08 00425 g001
Figure 2. Reinforcing, positive feedback loop.
Water 08 00425 g002
Figure 3. Model of resource uses of food supply and hydropower dam construction for energy generation using lower Mekong River Basin (LMB) river flow.
Water 08 00425 g003
Figure 4. Basic influence model for the hydropower–food supply nexus in the lower Mekong Basin.
Water 08 00425 g004
Figure 5. Food supply influence model in the lower Mekong Basin. Details of the variables A to I in Figure 5 and the causal links 1 to 9 are defined in Table 2 below.
Water 08 00425 g005
Figure 6. Hydropower influence model for the lower Mekong Basin. Details of the variables J to N and the causal links 10 to 14 for Figure 6 are defined in Table 2 and Table 4.
Water 08 00425 g006
Figure 7. Influence model for the hydropower–food supply nexus in the lower Mekong Basin.
Water 08 00425 g007
Figure 8. Elaborate influence model for the hydropower–food supply nexus in the lower Mekong Basin. The shaded food supply loop on the right is drawn from Figure 5, whereas the energy loop on the left is based on Figure 6. The darker shaded overlap between these two loops highlights that water, agricultural resources use, biodiversity and hydropower dams are the nexus in this system.
Water 08 00425 g008
Table 1. Causal relations and polarity: + = a positive causal relation; − = a negative causal relation.
Variable AVariable BSign
+
+
Notes: “↑“ means increase;“↓“ means decrease.
Table 2. Definitions of variables and causal links in Figure 5 and later figures.
#VariableDefinition
AHydropower dam constructionThere were 46 hydropower dams in the Mekong River basin in 2015 [7]
BWater infrastructure constructionThere were 10,800 irrigation projects in the LMB as at 2009 [25]
CRiver flowThe Mekong River has an annual water discharge to the sea of 475 km3 on average [7]
DWild fish populationThe Mekong River is one of the most biodiverse river systems in the world with 781 fish species described, including a number of globally endangered species [7]
EWild fish catchThe freshwater wild fish catch in the four LMB states was estimated in 2010 to be two million tonnes of fish per year [26]
FWild food supplyRiver flows support a freshwater capture fishery in the four LMB states estimated in 2010 to be two million tonnes of fish per year [26]. In each country, 47%–80% of animal protein for local residents comes from freshwater fisheries, and 90% of this is from capture fisheries [8]. There are other wild foods obtained from freshwater ecosystems as well
GCultivated food demandFAOStat Food Balance Tables (2009) provide a country-by-country analysis of apparent consumption of all foodstuffs with aggregate figures for calorie and protein intake on a daily basis. The total average protein intake for the LMB is 66.7 grams per capita per day (g/c/d). Of this 21.4 g/c/d is from animal protein. Of this animal protein intake the proportions coming from fish are 56% for Cambodia, 38% for Laos, 31% for Thailand and 24% for Vietnam [27]
HAgricultural developmentIn one projection, to replace the diminished wild fish catch resulting from 88 hydropower dams in the LMB in 2030, there would need to be an additional 5.483 Mha of crops, or 2.857 Mha of pasture for livestock, or 4.177 Mha for a combination of crops and livestock [11]
IIrrigation demandThe current area equipped for irrigated agriculture of four million hectares may increase to as much as 10.2 Mha by 2030 under a high development scenario, with a growing portion of the land used for second and third crops during the year [25]. In 2000, irrigated agriculture’s consumptive water use was around 72.8 km3 or 15% of annual average Mekong River discharge, half of which was in the Mekong delta [28]
#Causal LinksDefinitions
1Dam construction increases water infrastructureBy directly providing infrastructure and by increasing dry season flows, hydropower dam construction is projected to contribute to an expansion of water infrastructure for agriculture, domestic and industrial use [7,28], including for 4000 planned new irrigation projects by 2030 in the LMB [25]
2Water infrastructure influences river flowIt is projected that river flows will change seasonally and be diminished as water diversion for irrigated agriculture in the Mekong Basin grows to 104.5 km3 in 2025, or 22% of discharge, and 25%–30% of discharge by 2050 [28]
3Size of the fish population is influenced by river flowsSeasonally specific river flows support fish populations by enabling migration along the rivers for breeding and access to floodplain habitats in the wet season. The 88 planned hydropower projects by 2030 will increase in active water storage capacity 700% to 69.8 km3, changing the timing of river flows [7]. This construction of planned dams is projected to reduce wild fish populations and catch by 23.4% to 37.8% by 2030 [10]. River flows are also disrupted when water infrastructure forms barriers to migration. A diminution of the wet season area flooded reduces wild fish populations [26]
4The wild fish population underpins the fish catchThe size of the wild fish population influences the scale of fish catch [26]
5Wild fish catch makes a significant contribution to wild food supplyIn each LMB country, 47%–80% of animal protein for local residents comes from freshwater fisheries, and 90% of this is from capture fisheries [8]
6The scale of the wild supply of food influences demand for cultivated foods from aquaculture, crops and livestockFood demand in the LMB region is rising due to growing populations as well as poverty reduction and growing wealth [27,29]. At the same time, hydropower dam development is project to diminish the wild freshwater fish catch by 23.4% to 37.8% by 2030 and thus supply of important protein and other nutrients [10,11]
7Demand for food drives agricultural developmentIf demand is not met this will drive further agricultural development. The options for supplementing food supply include importing food or increasing production of crops, livestock and aquaculture [10,11]. Considerable expansion of food production is projected in the region [25]
8Irrigation development is an important component of agricultural developmentThe current area equipped for irrigation of nearly four million hectares in 2009 may increase to as much as 10.2 million hectares by 2030 under a high development scenario, with a growing area used for second and third crops during the year [25]
9Increased demand for irrigation drives new water infrastructure constructionAround 4000 new irrigation projects are planned by 2030 in the LMB that will require levees, canals, water storages and pumping stations [25]. It is projected that water diversion for irrigated agriculture in the Mekong Basin will grow to 104.5 km3 in 2025, or 22% of discharge, and 25%–30% of discharge by 2050 [28]
Table 3. Projected loss in fish protein due to hydropower development to 2030 as a proportion (%) of all national protein supply. The range reflects uncertainty as to the portion of the Mekong wild fish harvest caught in each country (after [11]).
Min/MaxCambodia (%)Laos (%)Thailand (%)Vietnam (%)
Minimum6.52.61.60.7
Maximum23.18.23.32.1
Table 4. Definitions of variables and causal links in Figure 6 and later figures, following on from data in Table 3.
#VariableDefinition
JIncreased productionIn one projection, the area of crop production in the lower Mekong River Basin would need to increase by between 6% and 59% per country to replace the diminished wild fish catch resulting from 88 hydropower dams in the LMB in 2030 [11]
KDemand for electricityIn 2015 annual demand for electricity was around 400,000 GWHr in the LMB [7]
LPower generationThere were 5574 MW of hydropower generation operating or under construction in the LMB in 2010, and 90% of electricity generation in the region is from fossil fuels [7]
MIndustrial development“In common with other countries in the wider East Asia region, over the last two decades the four countries of the LMB have experienced rapid economic development. This has largely been driven by industrial growth, and in particular growth in manufacturing production for export” (p. 54) [7]
#Causal linksDefinition
10Increased agricultural production increases demand for electricityThere are relatively few options for gravity-fed expansion of irrigated agriculture in the region, with plans for new projects involving large scale lift irrigation or smaller scale pumping from local canals and water bodies [38,45]. Pumping water requires significant amounts of energy, in addition to the energy requirements for producing farm chemicals, transport and processing crops [46]
11Increased demand for electricity drives further hydropower constructionThe Mekong Basin has 53,000 MW of potentially feasible hydropower generation available based on flows in the Mekong River basin [7]. There are 42 new hydropower dams likely to be constructed in the Mekong Basin by 2030 [7]
12Increasing hydropower construction increases generationGenerating capacity of 29,760 MW is possible from identified, planned LMB hydropower projects [7]
13More power generation drives industrial developmentMore power generation drives industrial development. In addition to expanding current growth in manufacturing production for export, a number of new, energy intensive industries depend in large part on hydropower development. Most notable is the proposed mining and smelting of an estimated 300 million tons of exploitable bauxite to produce alumina in Laos. Production of 0.5 M tons of alumina per year would require around 150 MW for smelting and 600–800 MW for downstream processing (and a lot of water) [47]. Production of other mineral products is also likely
14Industrial development drives further demand for electricityAll LMB countries show high average annual demand growth rates between 2010 and 2025 of between 5.5% in Thailand and 11.6% in Cambodia based on official forecasts [7]. Economic growth in the region is expected to increase 240% between 2005 and 2030 [7]

