1. Introduction
The hydrologic and sedimentologic regime of arctic rivers is quite different from rivers located in temperate environments. Long, severe winters and the presence of permafrost (perennially frozen soils) create conditions of little to no baseflow throughout the winter, and rapid runoff occurs during breakup. Sediment transport in arctic settings has not been studied as extensively as sediment transport in temperate regions. Many reasons account for this lack of comprehensive studies, including remote location of rivers, harsh weather, and difficult logistics of working in the Arctic.
One of the first studies of suspended sediment transport in arctic Alaska was done in 1962 on the Colville River [
1]. Total suspended load and dissolved organic material were measured, and it was determined that 75% of sediment transport occurred during breakup (i.e., initial open water flow in a stream previously frozen), a transport regime confirmed by numerous other studies on arctic rivers [
2,
3,
4]. Runoff hydrographs indicate the significance of snowmelt, with the highest suspended sediment concentration (SSC) usually measured during spring melt [
4,
5,
6]. While arctic rivers often have snowmelt-driven hydrographs, summer storms can transport enormous volumes of sediments [
7].
Arctic rivers such as those on the Alaska North Slope are greatly influenced by regional climate. Snow can be present for 8 months of the year, and the entire area is underlain by continuous permafrost [
8]. It is well known that permafrost has a strong influence on the hydrology of a region [
9,
10,
11]; however, the effect on sediment transport is less well-understood. Sediment supply and transport are influenced by a variety of factors common to both arctic and temperate rivers, including basin size, climate, precipitation intensity and duration, runoff volume, underlying geology, vegetation, ice cover, and large-scale relief within the watershed [
12]. Snow and rain are prime examples of factors that can influence the SSC of a river both at a specific point in time and throughout the flow season, particularly through the hydrologic runoff response of the watershed to rain and snow.
Because of the environmental setting, snow is an important variable in calculating input to arctic river systems. Numerous studies of arctic nival streams have confirmed that a relationship exists between snow water equivalent (SWE) and SSC, and that SWE, in fact, is a stronger influence than available melt energy [
3,
4,
6,
13]. During the initial melt period of snowpack, there is usually a significant linear correlation between temperature and discharge, as well as temperature and SSC, but the strength of these relationships decreases as snowpack is depleted [
4]. Note, however, that the presence of ice and snow in a river channel during the initial flow period can substantially reduce bed scour and sediment transport loads [
7,
14,
15]. The size of the watershed is a consideration, as “larger watersheds require greater hydrologic inertia to produce substantial discharge” ([
4], p. 312). Snowmelt has such an influence on sediment transport in arctic rivers that suspended sediment transport throughout the rest of the flow season can seem inconsequential. Braun et al. [
3] found that 88% of the annual sediment load into Lake Sophia in Nunavut, Canada, occurred during snowmelt. Forbes and Lamoureux [
4] reported similar results on the Lord Lindsay River in Nunavut, Canada, where 93% of total suspended sediment transport occurred during snowmelt annually.
Changes in discharge can reveal a watershed’s response to a summer storm. Larger watersheds usually respond slower and less dramatically to a rain event than a similarly located but smaller watershed [
4]. Summer rains are rarely intense or affect a large percentage of the watershed; they may, however, impact suspended sediment discharge of a catchment, as they occur when sediment sources are exposed and more easily eroded [
16]. Under the right conditions, a summer storm can transport the majority of suspended sediment in a flow season, which is the period between breakup and the beginning of freeze-up (generally mid-May to mid-September in arctic Alaska) [
17,
18]. These extreme events, which are difficult to capture, require a large number of samples in a short amount of time. In the Canadian Arctic, a large event was captured in 1998 [
18], and an extreme rainfall event was recorded in the Alaskan Arctic on the Kuparuk River in 1999 by Kane et al. [
17]. The hydrograph peak recorded during the rain event in Alaska was three times greater than any previously measured peak, including those caused by annual spring melt.
With this many factors to take into account, it is understandable why so few in-depth studies have been completed in the Arctic. However, even among studies of sediment transport in arctic and ice-affected rivers, many do not consider rivers that freeze to the bed over the winter. Methods for estimating sediment transport that occurs under ice have been developed [
19,
20], though the researchers were most concerned with the effects downstream of flow-regulating dams and reservoirs. Turcotte et al. [
21], who conducted a comprehensive review of sediment transport in ice-affected rivers, considered the increase in sediment transport that can occur because of ice rafting, freeze-thaw cycles, and ice jams, but did not specifically review rivers that are located in regions underlain by continuous permafrost.
The principal objective of this study was to complete an initial quantification of suspended sediment transport in three pristine rivers in Arctic Alaska, where no previous data existed.
2. Study Area
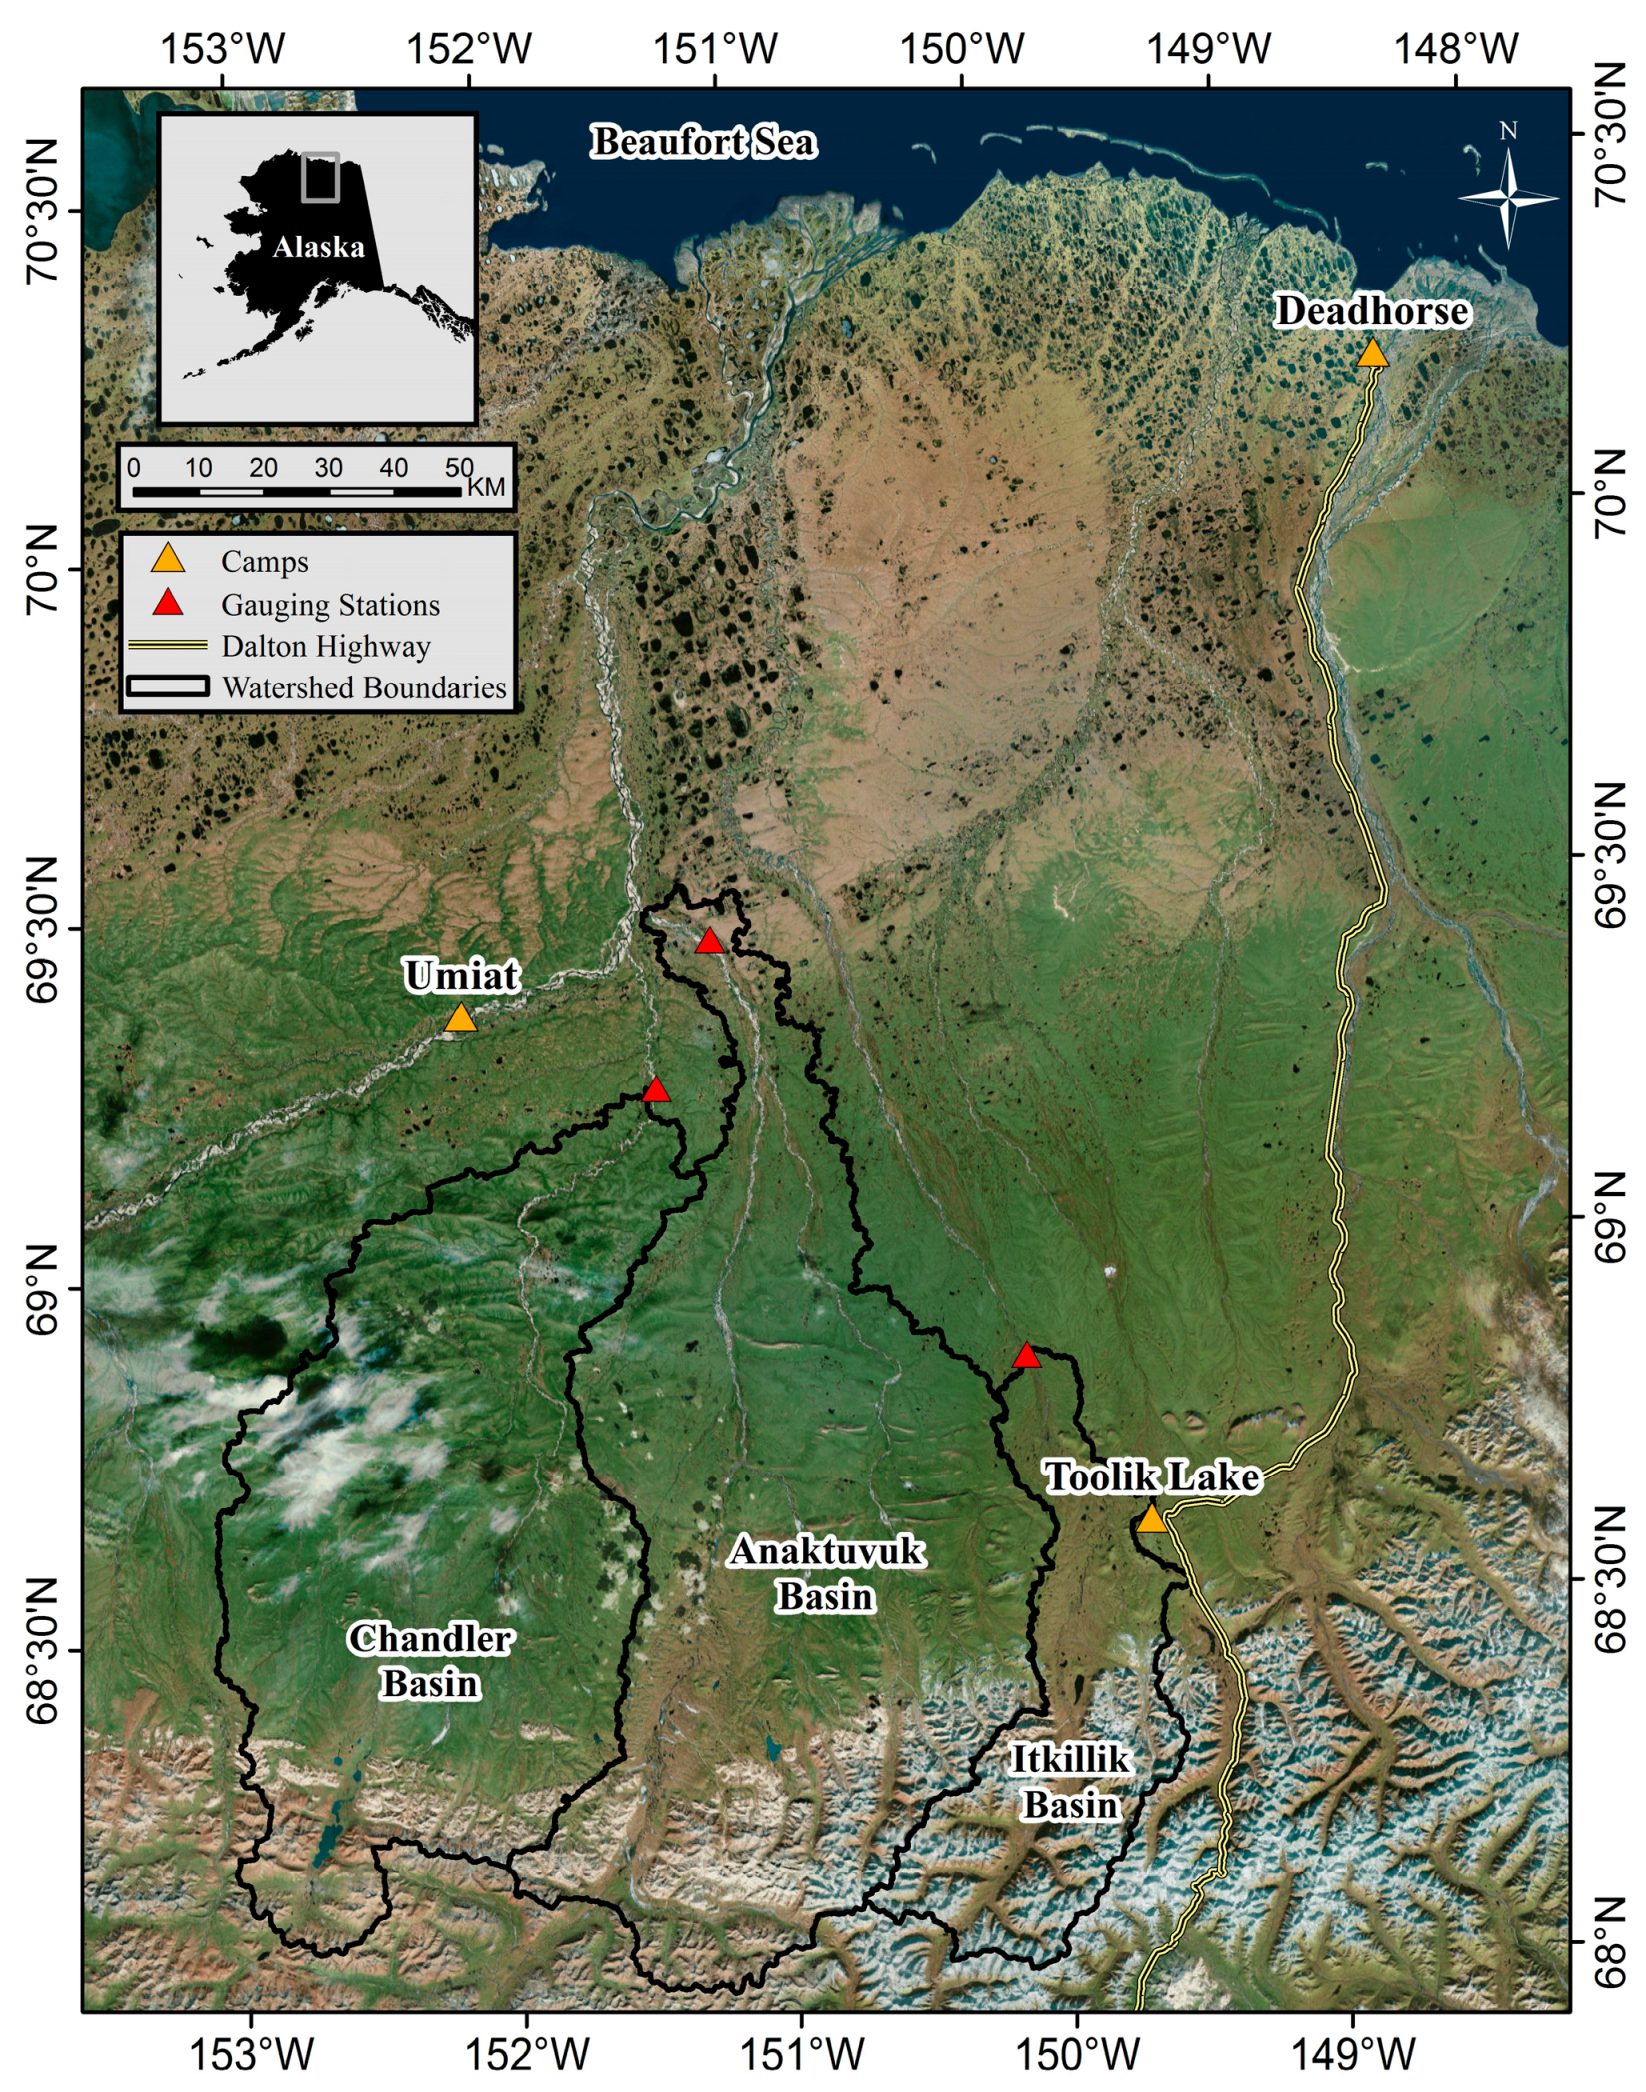
The three rivers studied were the Anaktuvuk, Chandler, and Itkillik (
Figure 1). The geographic coordinates for the gauging stations are listed in
Table 1. Located on the Alaska North Slope, these rivers flow north from the foothills of the Brooks Range into the Colville River, which empties into the Beaufort Sea. All three rivers are underlain by continuous permafrost that ranges from 250 to 600 m thick [
8], with the permafrost thickening northward. In this region, the active layer (i.e., the zone below the ground surface and above the permafrost table that thaws seasonally) is usually 50 cm, but may vary between 25 and 100 cm. With snow on the ground for 7 to 9 months of the year, breakup does not begin until mid-May at the basin headwaters in the mountains [
22]. As one heads north, breakup occurs later; near the coast, it may occur in late May or early June.
During the 3 years of meteorological monitoring for this study, the coldest month was usually December or January, with the average monthly temperature between −29.3 °C and −10.8 °C. July was the warmest month, with temperatures between 7.5 °C and 12.6 °C. A low of −49.8 °C was recorded at the Anaktuvuk River meteorological station in January 2010, and a high of 30.9 °C was recorded at the Chandler River in June 2011 [
22].
Vegetation in this region is characterized by low shrubs and tundra with tussocks. Vegetation in the foothills includes sedges, dwarf shrubs, and willows, and some alders along the river valleys [
23]. In the mountains, no vascular vegetation is found at elevations over 900 m; at these elevations, the vegetation mat is mainly lichens and sedges, and the plant cover is open [
24].
The Anaktuvuk River originates at a glacier in the Endicott Mountains, centrally located within the Brooks Range. The study site is located approximately 215 km downstream of the river’s origin, and has a basin area of 7000 km
2 upstream of the gauging site. The Anaktuvuk River flows into the Colville River, just north of the Colville River’s confluence with the Chandler River. The gauging station is located at an elevation of 31 m above sea level. This location was the farthest north study site and was at the lowest elevation. The Anaktuvuk River at the gauging station is braided, although flow is confined to a single channel at most discharges. Hydraulic characteristics at the gauging site have been reported by Toniolo et al. [
25]. The width of the channel ranges between 100 and 330 m.
The Chandler River, which also flows into the Colville River near the Umiat camp, originates at Chandler Lake. The river flows for approximately 225 km before reaching the study site, and has a basin area of 5800 km2 upstream of the study site. The gauging site was located at an elevation of 86 m above sea level. The Chandler River has numerous side channels that are active during high water levels, with the majority of flow occurring in a single main channel. Discharge measurements were carried out at a location where no lateral channels are typically active. At this location the channel width ranges between 40 and 210 m.
The Itkillik River was the easternmost stream in this study. The headwaters are located 153 km upstream of the gauging site in the Brooks Range. The study site was located at an elevation of 429.2 m above sea level; the watershed area upstream of this location is approximately 1900 km2. This river has a steep gradient. At the gauging site, the river flows in a single channel, with a width that ranges between approximately 30 and 80 m.
3. Methods
Field activities at rivers in arctic environments are influenced by the remote location of the field sites. For example, the three study sites are only accessible by helicopter, which limits the time that researchers can spend at each site since helicopters are a costly means of transportation and they require good weather conditions for safe flights. Thus, the methodological approach used in this work took into account limited time at each site. Methods used included bed sediment distribution characterization, depth-integrated sampling for suspended sediments, automated sampling for suspended sediments, and discharge measurements. The goal of this combination of methods was to achieve a fairly continuous monitoring record of suspended sediment data in each river, with researchers being on-site a few times during the open-water season.
To determine the bed sediment distribution at each river, a photographic sampling method [
26] was used. Specifically, the bed sediment distribution was calculated for each river using a taped grid, 0.9 m by 0.9 m, on exposed gravel bars near the end of spring fieldwork. Within this 0.9 m square grid, nine sections were demarcated. One rock in each section was numbered and brought back to the lab for precise weighing and measuring. Photographs of each grid were taken, and the sediments were measured and separated into size intervals at later dates. In the photographs, only those sediments that were large enough to be seen without magnification and entirely visible were measured. Using this method of photo-sampling, we analyzed only sediments that were in the topmost layer of riverbed. Although photo-sampling has limitations, the approach is useful for remote fieldwork, as it requires minimal time and effort in the field. Studies show that negative-bias in sizing can occur because some sediments are partially hidden due to the downward tilt that many streambed sediments exhibit [
26].
Stream water samples were taken with Isco 3700 portable autosamplers and depth-integrated suspended sediment samplers (Rickly Hydrological, Model DH76) to determine the SSC. In spring 2011 and 2013, samples were taken four times daily on the Anaktuvuk, Chandler, and Itkillik Rivers. In the summers of 2011–2013, samples using the Isco were taken once daily. In general, the autosampler intake hoses were located approximately 15 cm above the riverbed, near the river bank. Several depth-integrated samples from the main channel were taken during each site visit, and concentrations from these samples were averaged. The distribution of suspended sediments was assumed to be approximately constant across the main channel [
27]. Samples taken with the autosampler and the depth-integrated sampler were analyzed in the lab to determine SSC, following ASTM Standards 3977-97 and 2974 (Test Method C). Relationships between SSC from the autosamplers and the depth-integrated samplers were developed for each river.
Discharge measurements were made using an acoustic Doppler current profiler (ADCP), with a minimum of four transects made per measurement. The coefficient of variation between the four transects was less than 5%; if not, more transects were made [
28]. An ADCP RDI Rio Grande 1200 kHz was used when maximum channel depths were greater than 5 m; an ADCP RDI StreamPro 2000 kHz was used when maximum depths were less than 5 m. Water levels were monitored at each site using HOBO U20 water level pressure transducers as well as Instrumentation Northwest Aquistar PT12 (SDI12) pressure transducers. The stage-discharge relationships were created using data from the discharge measurements and the 15-min pressure transducer measurements. To create these rating curves, the measurements were plotted, and a best fit trend line was established [
29].
Finally, suspended sediment rating curves (i.e., the relationship between SSC and river discharge) were developed for the three rivers. Such curves are only valid when the channels are ice-free. These relationships were used to calculate the suspended sediment loads during the open-water months throughout the study period.
4. Results
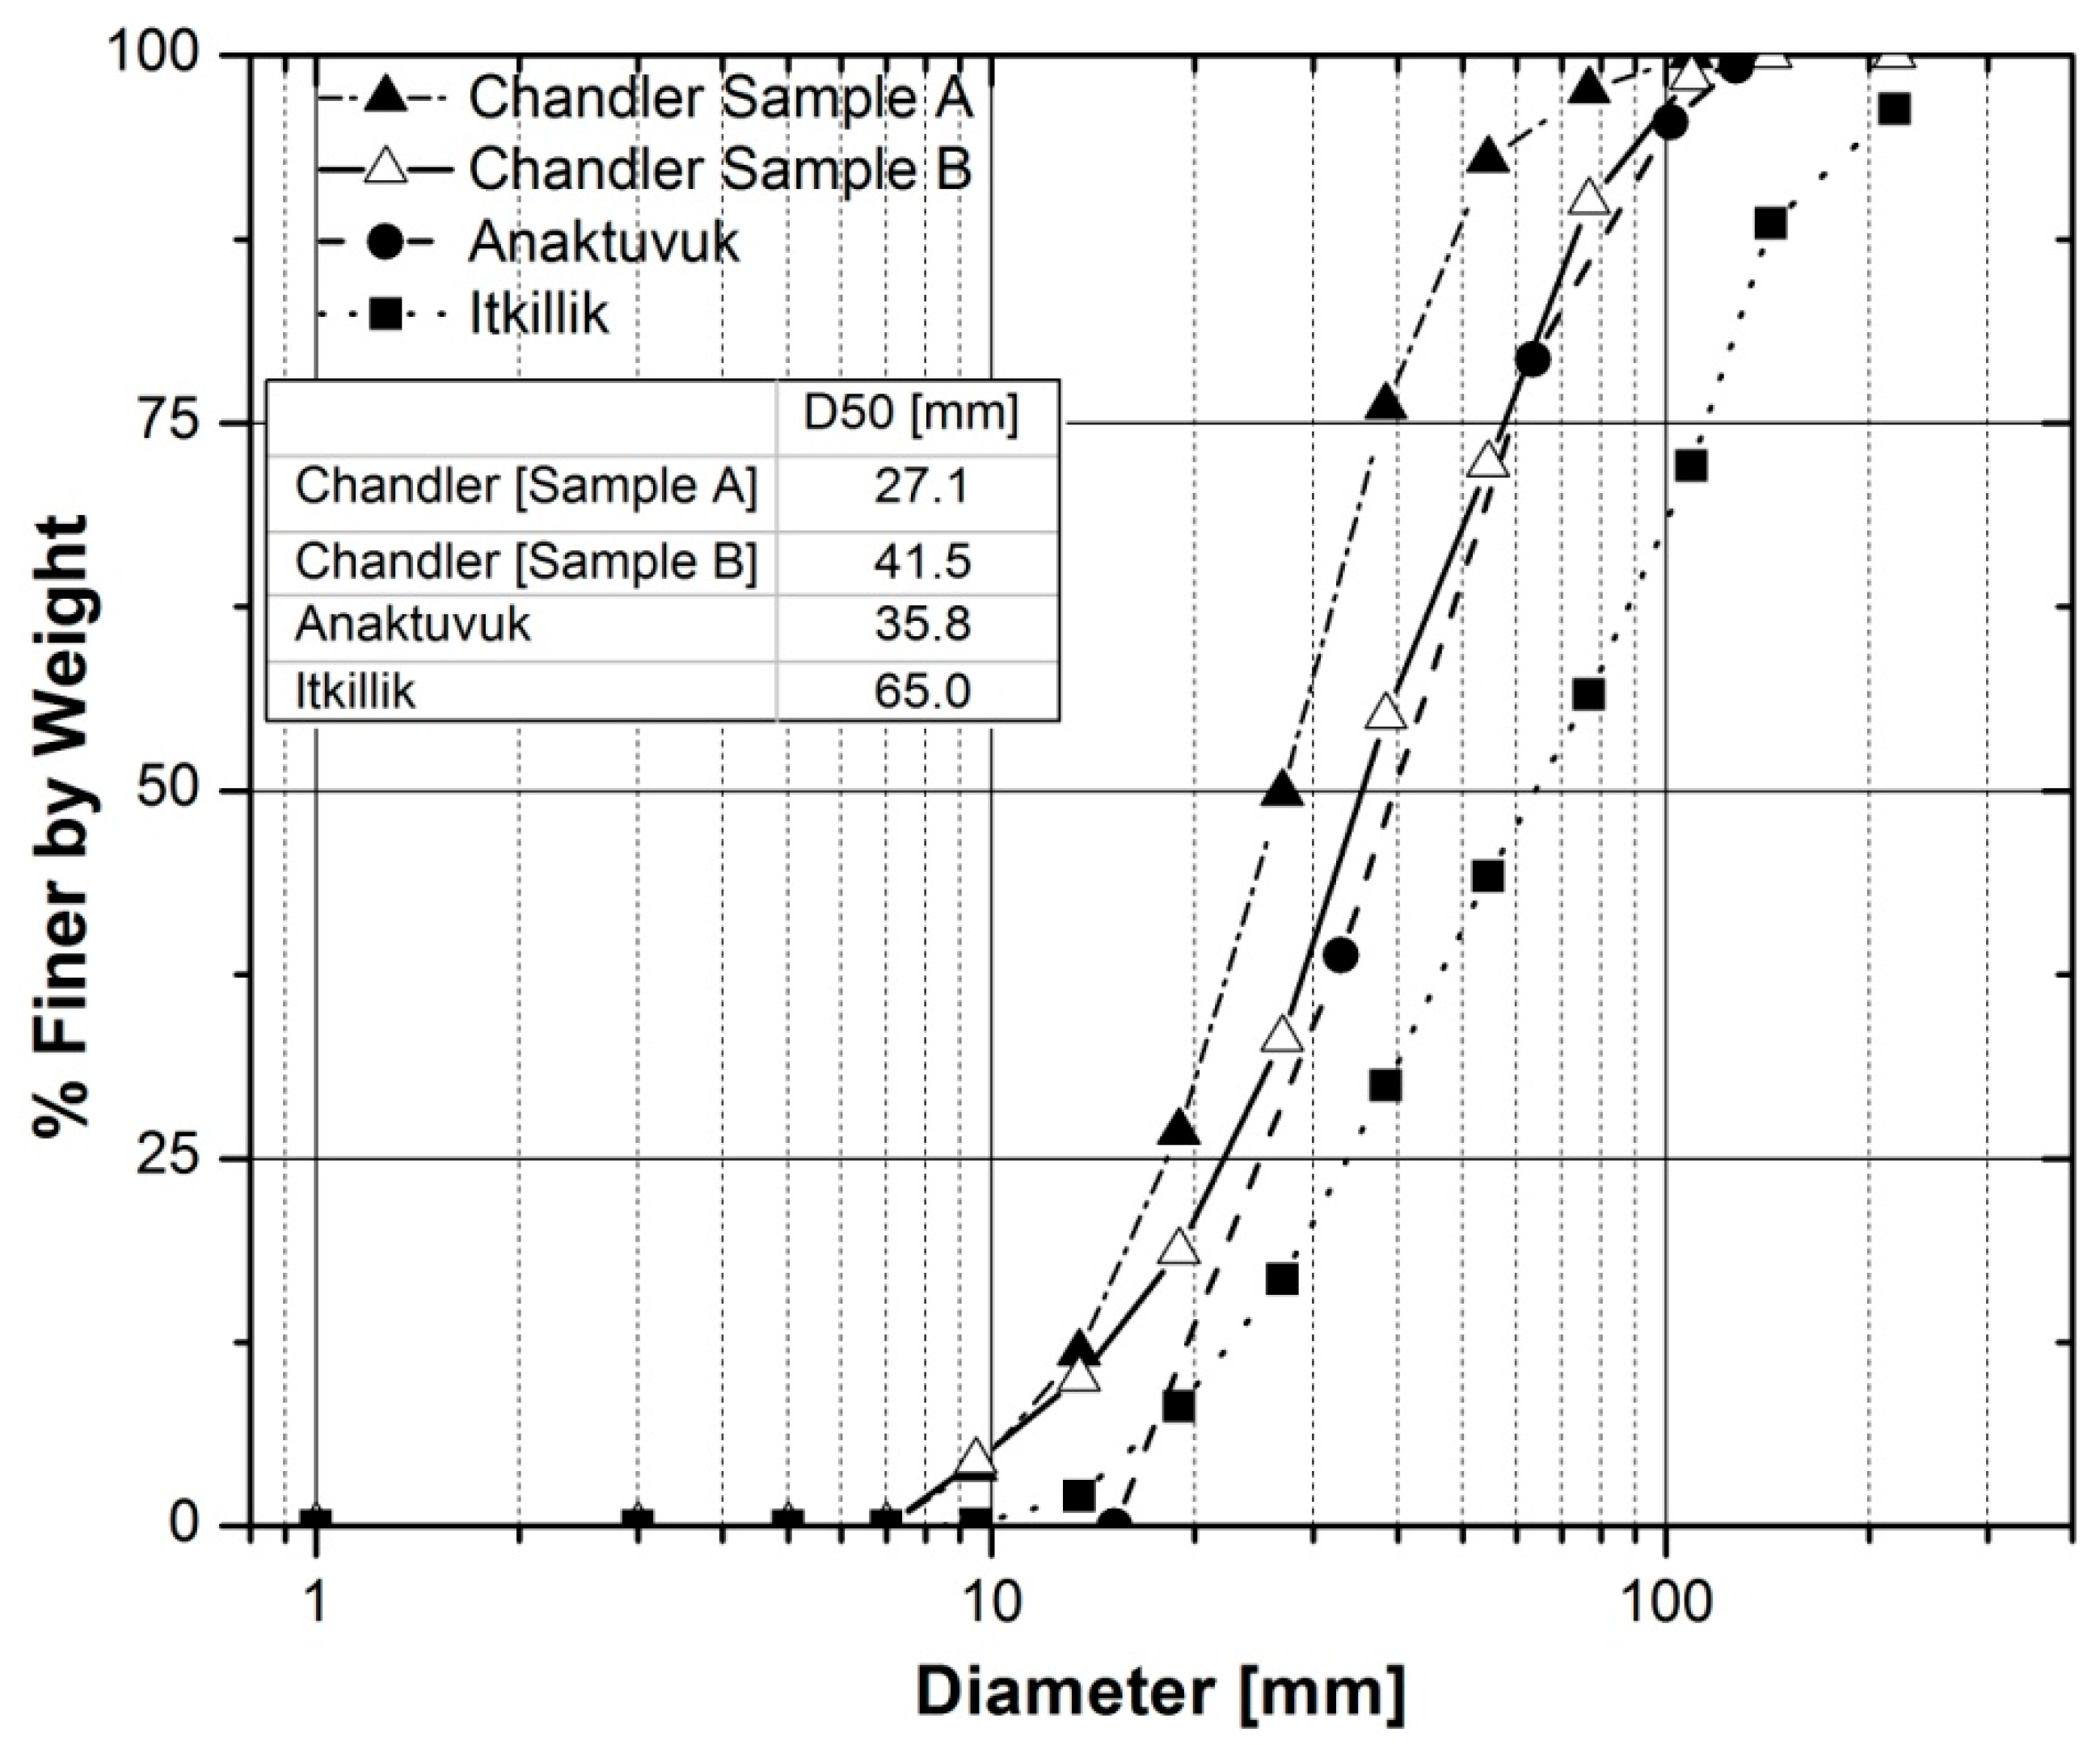
The grain-size distribution of surficial bed sediments is shown in
Figure 2. While the Anaktuvuk and Itkillik Rivers had no significant changes in sediment sizes on exposed gravel bars, the variation of sediment sizes in the Chandler River was noticeable. In consequence, two sediment distributions (Samples A and B) are presented for this river. The median grain size, D
50, for all the samples were in the coarse to very coarse gravel range.
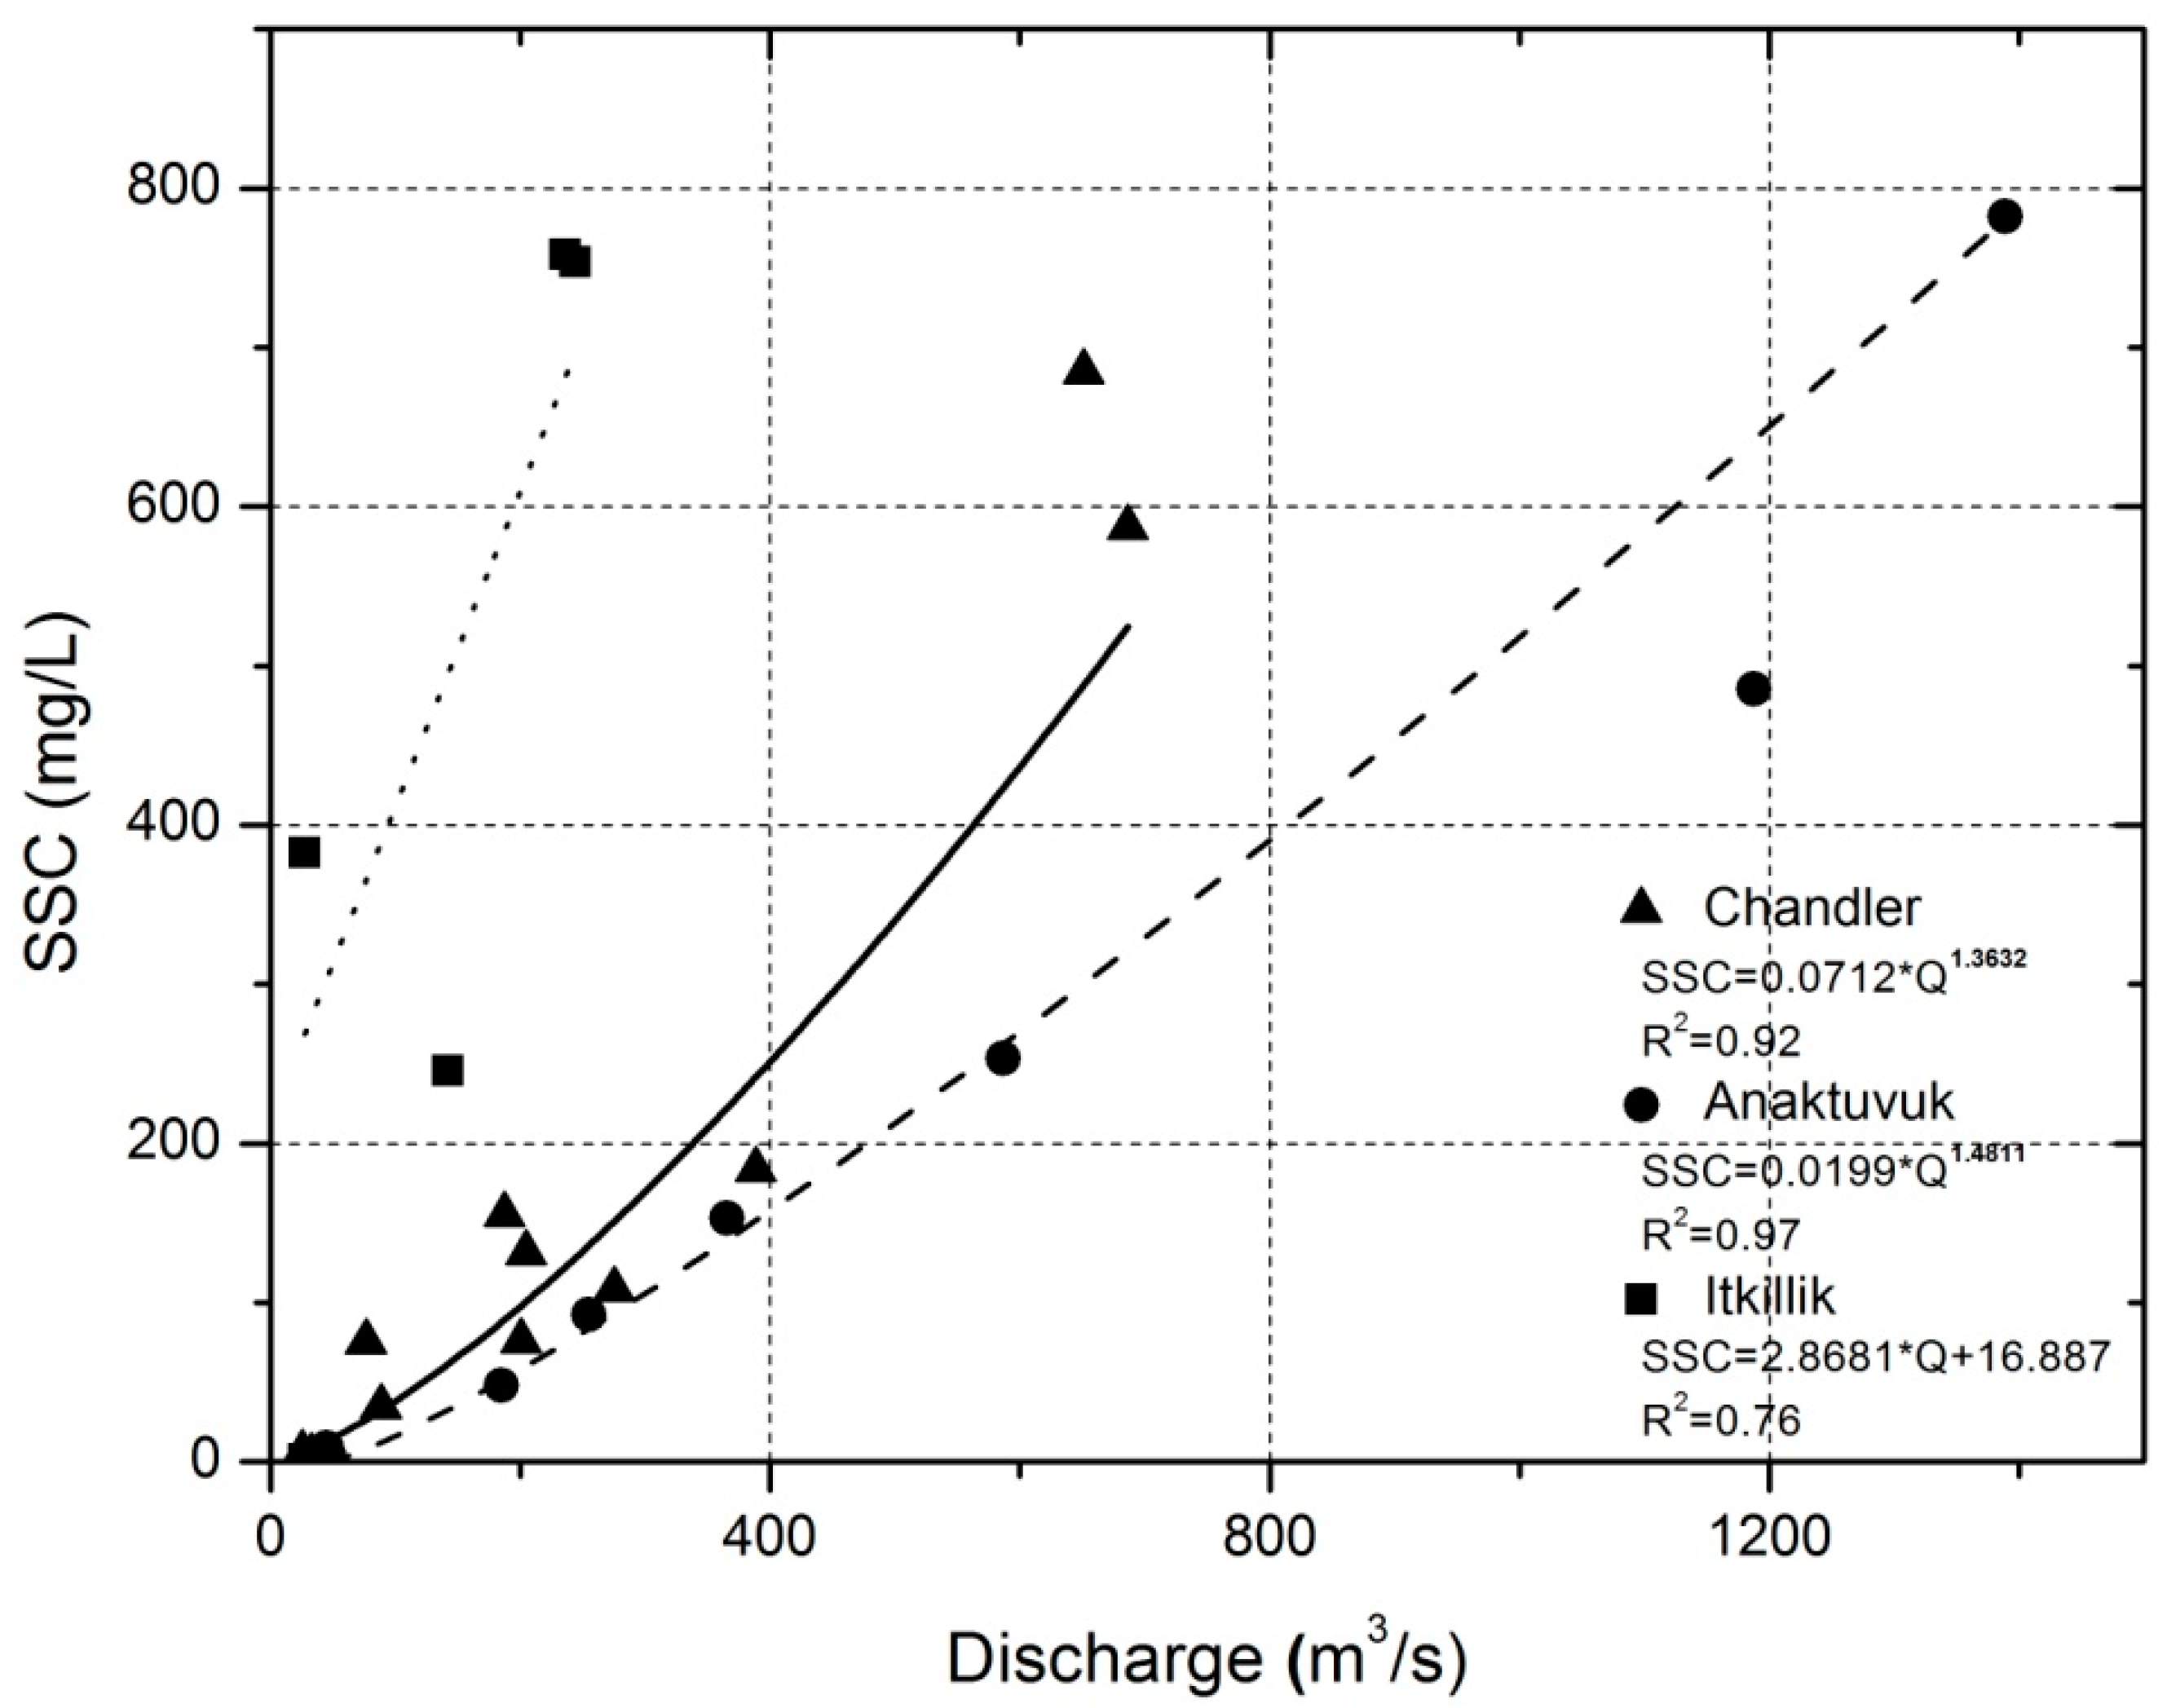
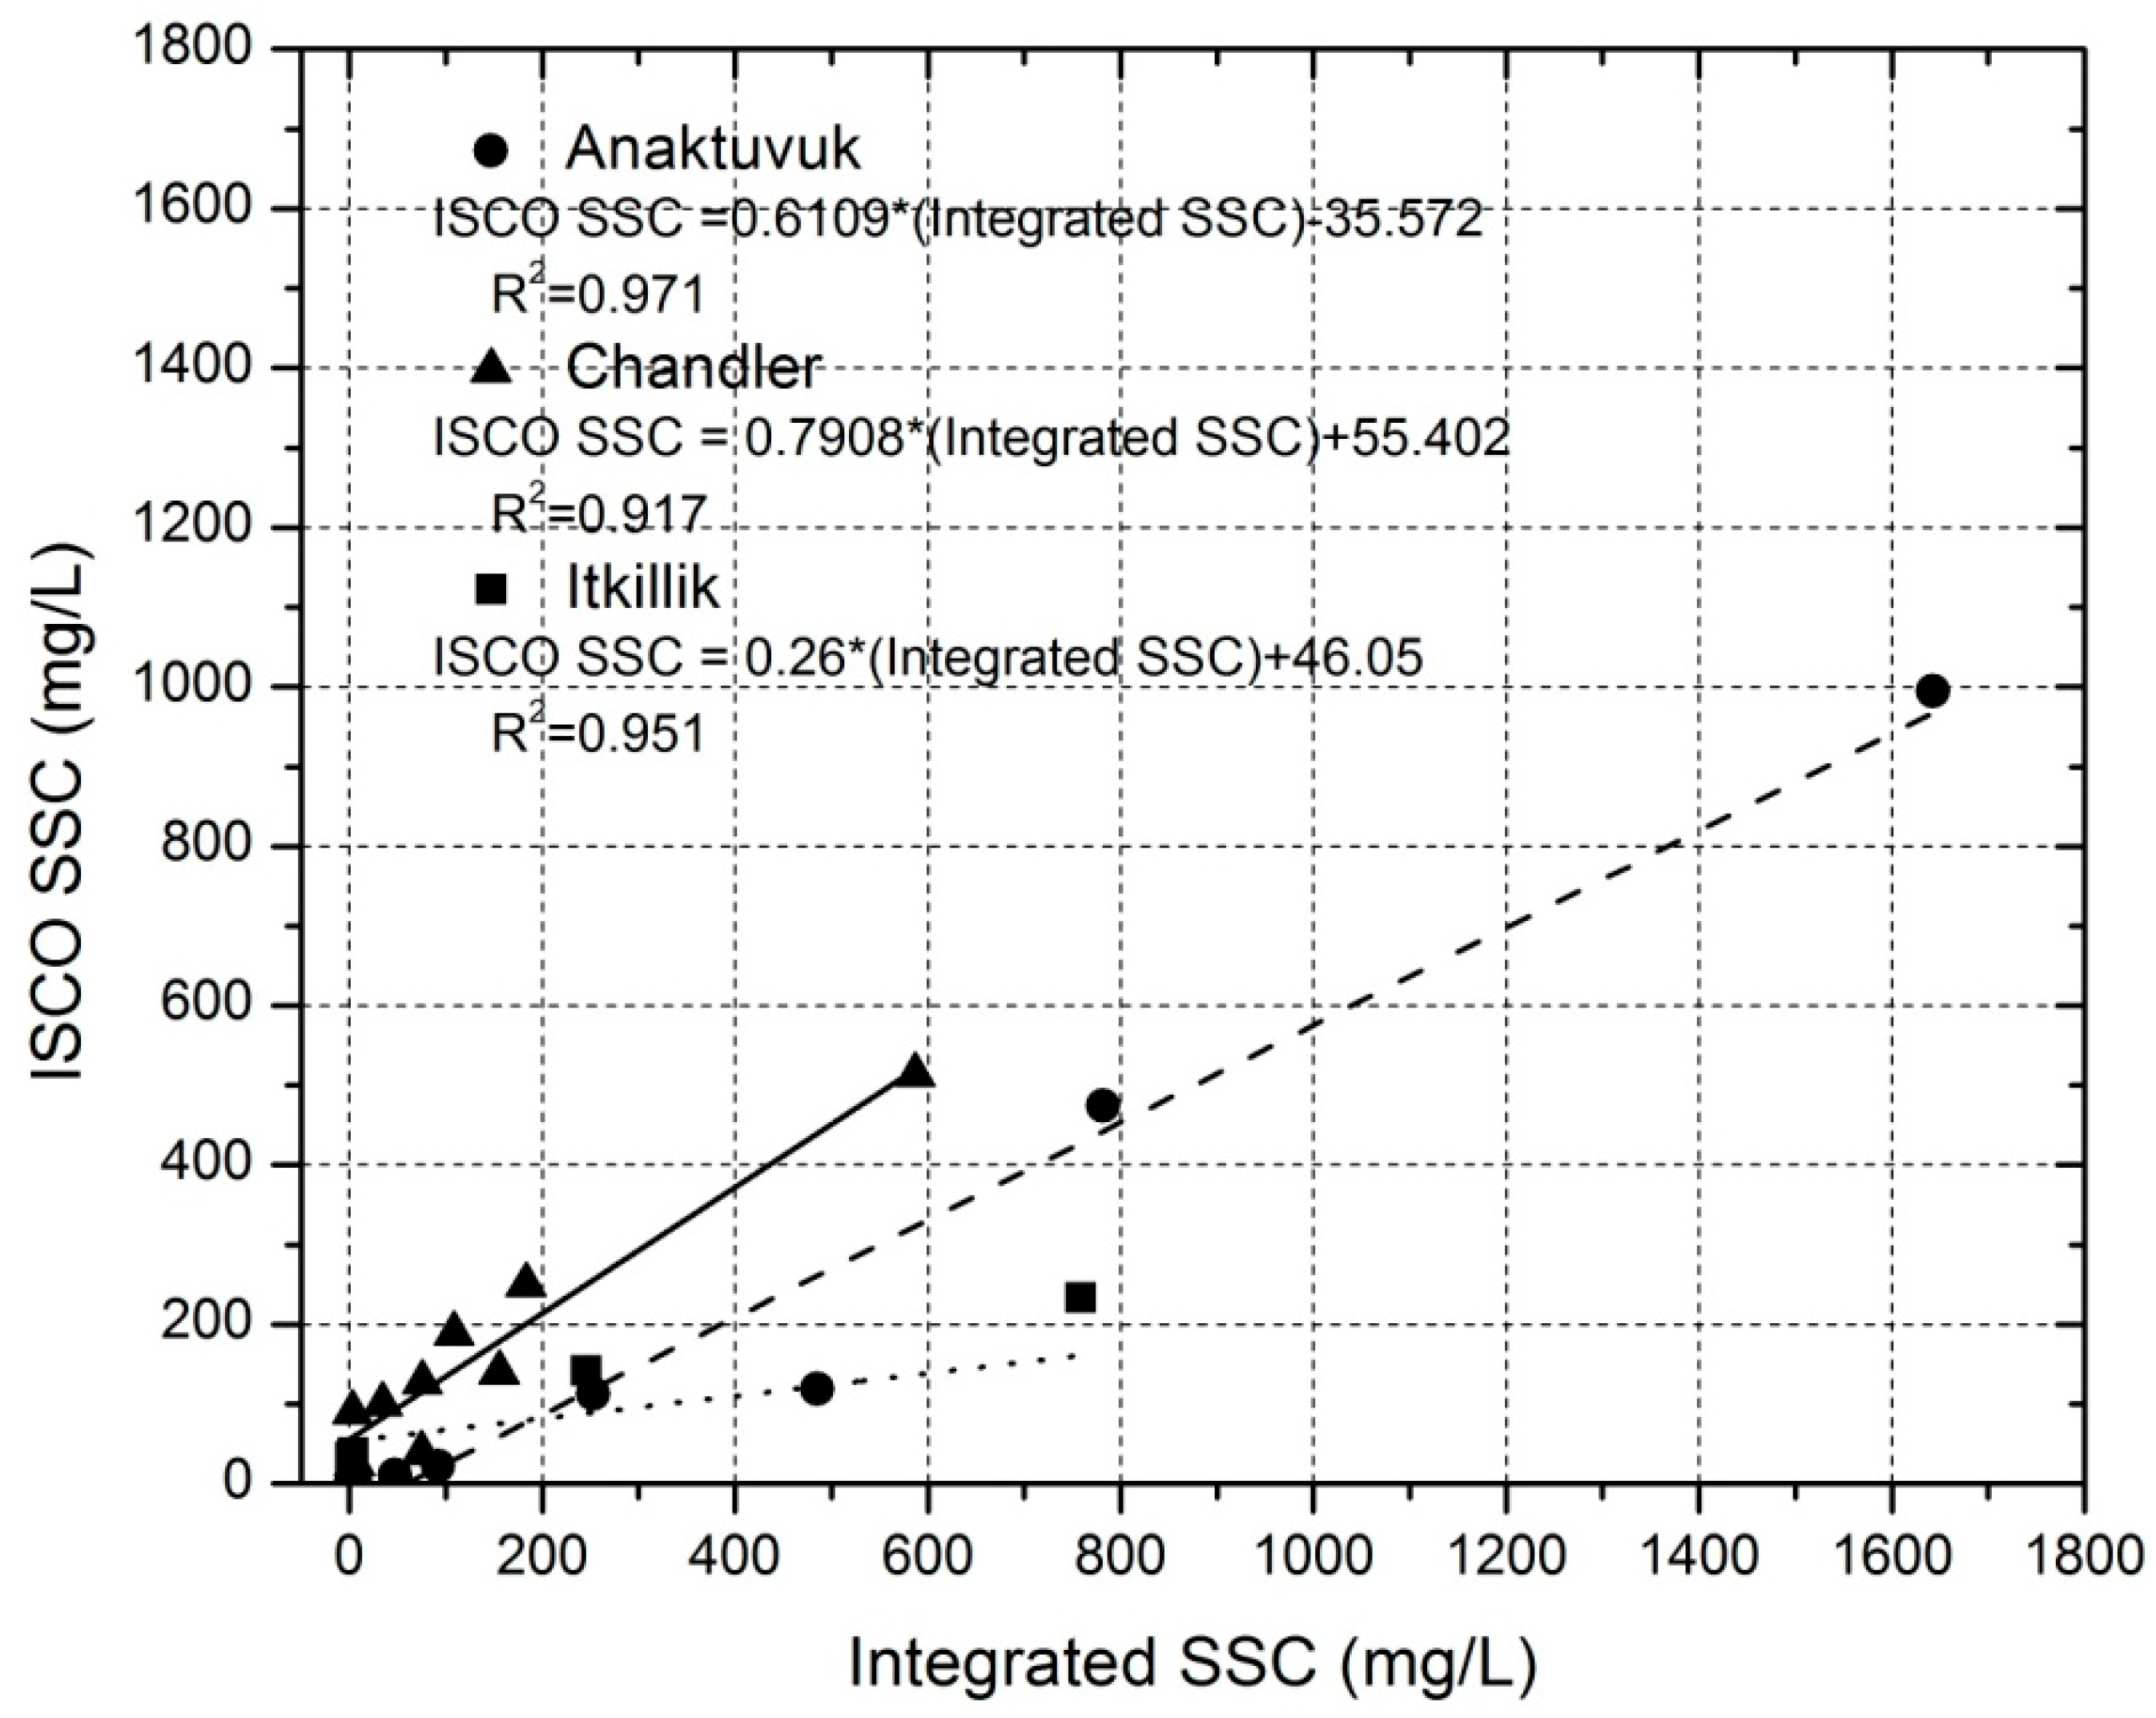
The relationships between SSC from Isco and depth-integrated samples for each of the three rivers are shown in
Figure 3. The high
R2 values reported in the figure indicate that these relationships provide an accurate method for evaluating SSC throughout the entire river cross section and throughout time. It would be useful to develop similar relationships in rivers with limited accessibility.
Suspended sediment rating curves were developed for the Anaktuvuk, Chandler, and Itkillik Rivers (
Figure 4). These curves do not consider periods of time when channels were ice-affected, since such periods lack reliable discharge data. Effectively, suspended sediment rating curves are accurate for flows that occur after breakup. The suspended sediment rating curves were developed using SSC from depth-integrated samples, as these samples provide information about the entire water column.
In
Figure 4, it is evident that the Itkilik River carries a larger suspended sediment concentration for a given discharge than the Chandler River and the Anaktuvuk River. The best fit was linear at the Itkillik River gauging station; a power fit was used on the Chandler and Anaktuvuk Rivers. It is important to note the limited number of collected samples at the Itkillik River station. We speculate that differences in soil conditions in the three watersheds are responsible for the variation in concentration for a given discharge.
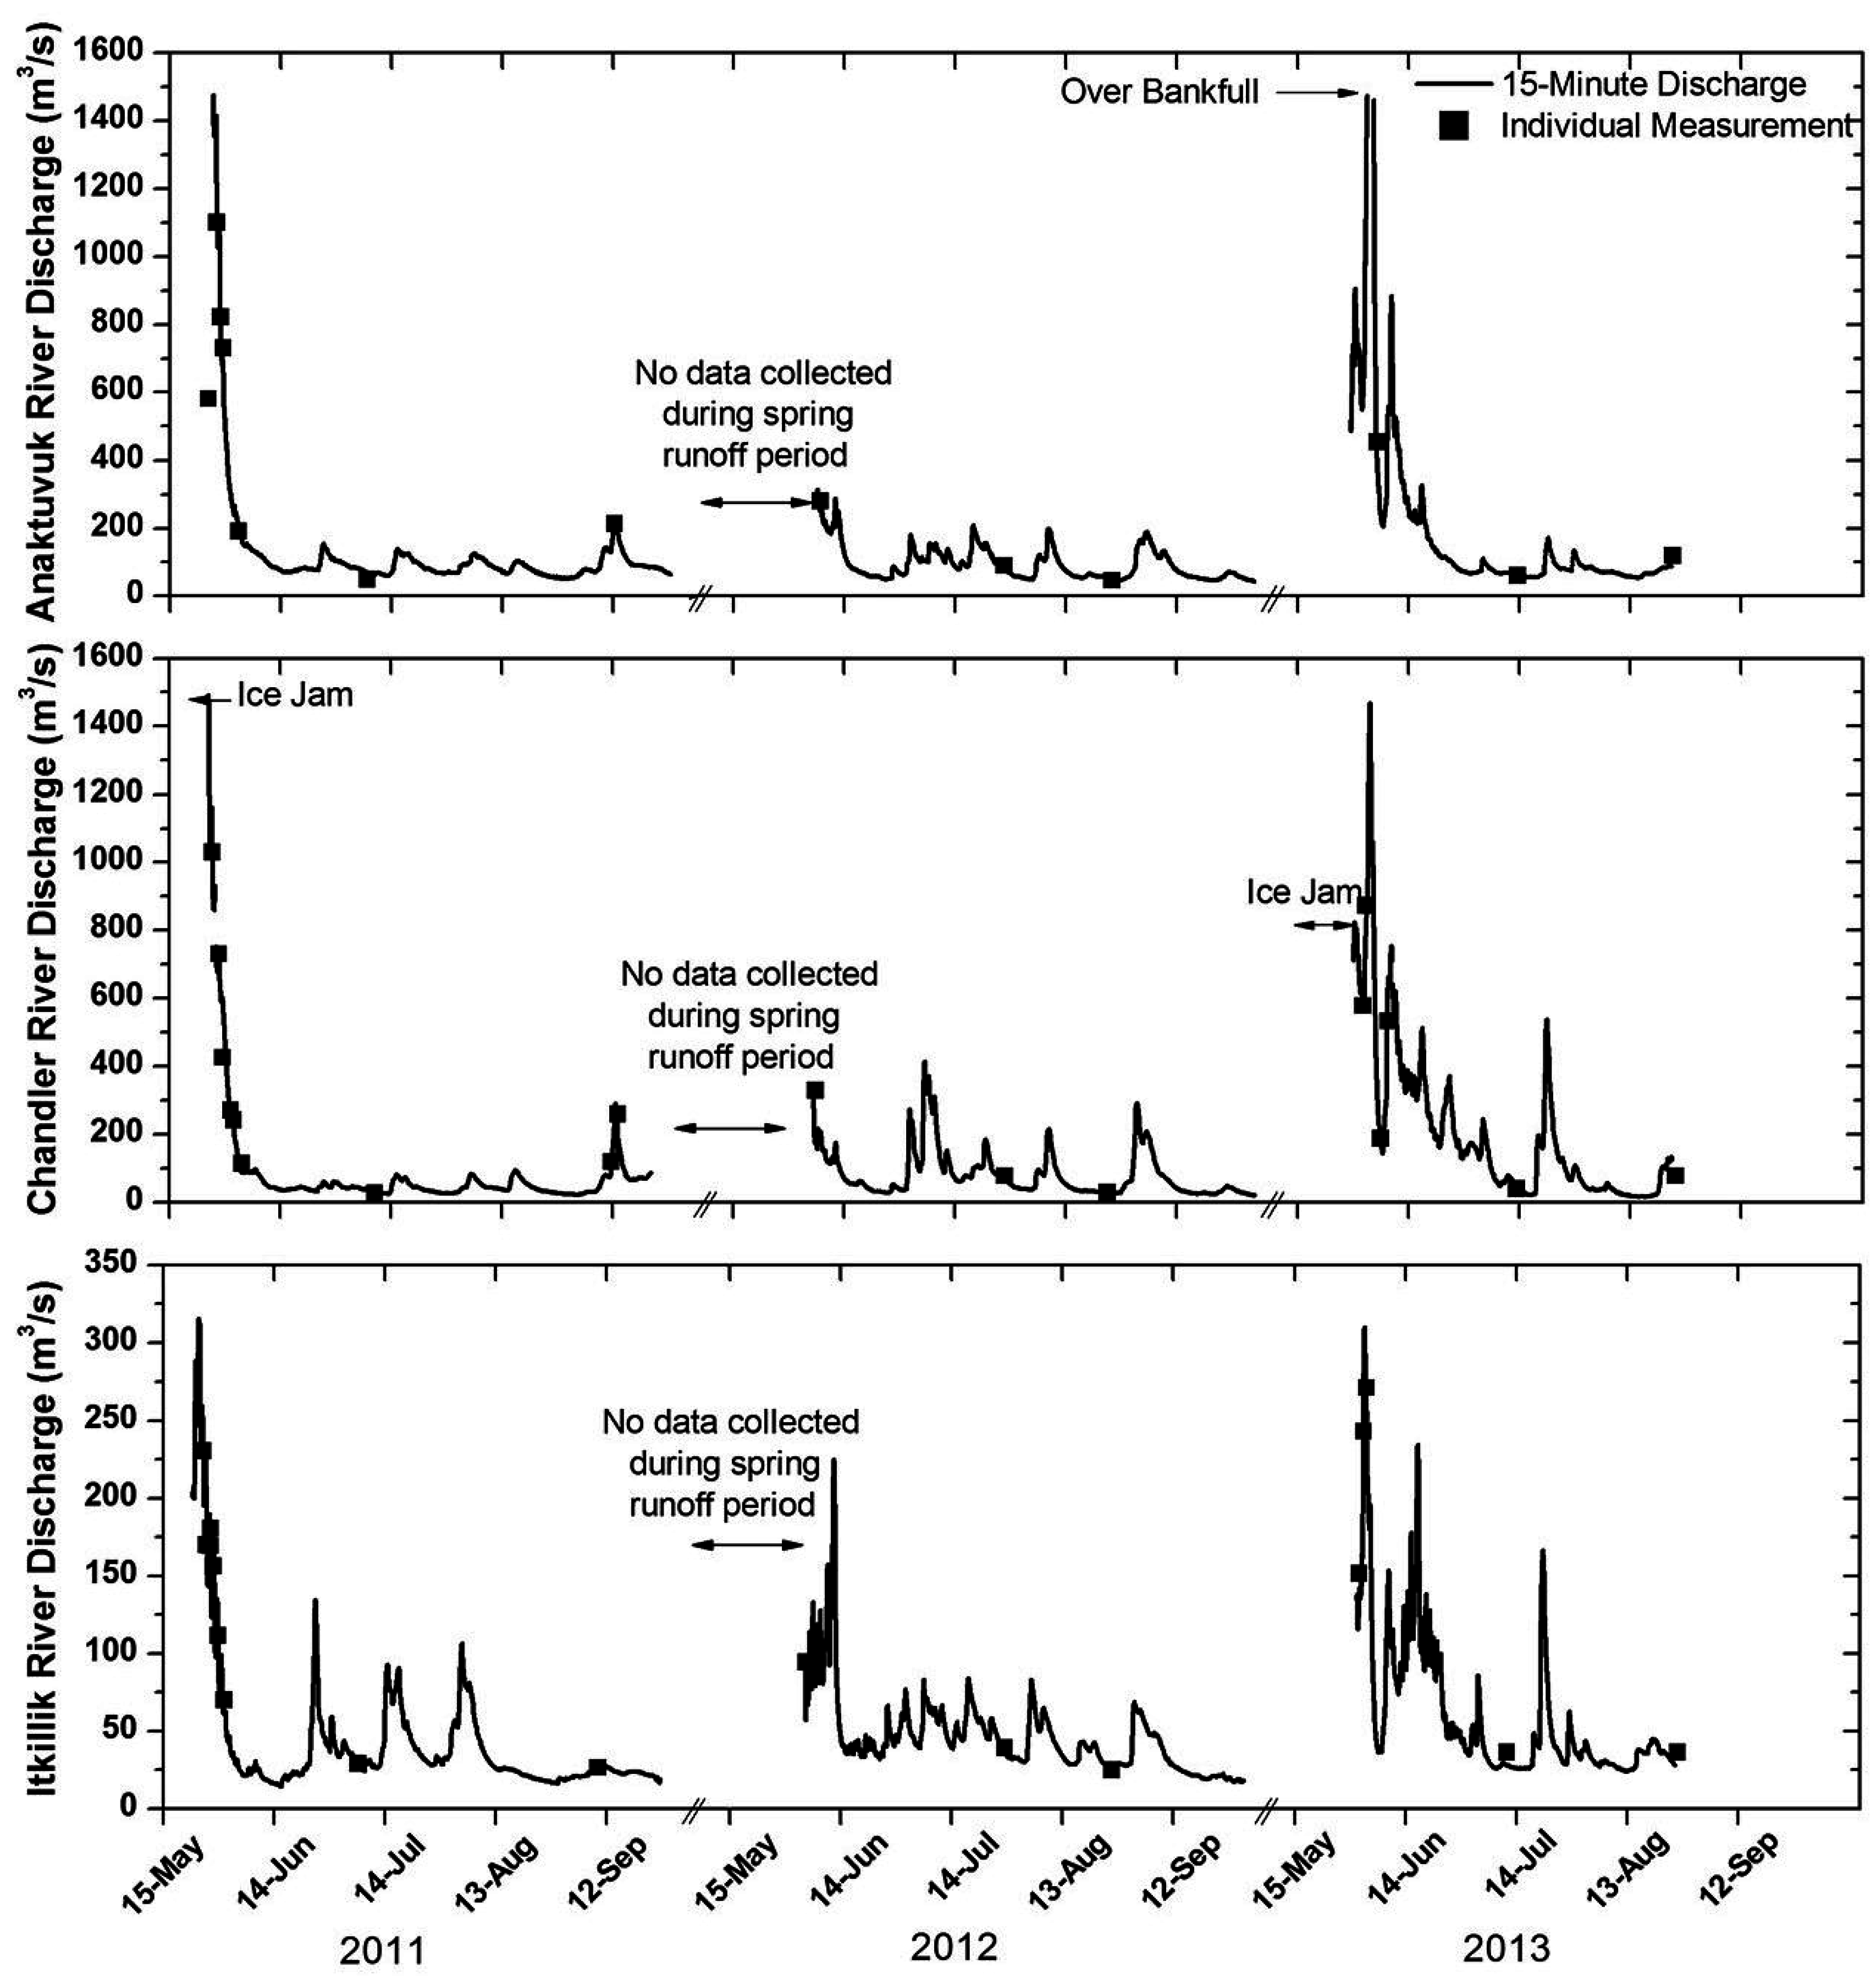
Figure 5 shows the hydrographs for each river.
Suspended sediment yields on a month-by-month basis for each river are shown in
Table 2. All rivers indicate maximum yields in May 2011 and June 2013. Furthermore, the highest maximum suspended yields through 2011 and 2013 occurred during May and June. Note that May 2012 data for all rivers are not available due to logistical issues encountered reaching the study sites that year.
Reported end-of-winter SWE for the watersheds [
29] indicate that SWE was higher in 2013 than in 2011 (see
Table 3). However, the maximum sediment yields during breakup were reported in 2011, not in 2013, which clearly points out the significance of the air temperature during this critical time of year (i.e., warm temperatures will produce a fast snowmelt, with abundant suspended sediment; cold temperatures will produce a slow snowmelt, with reduced suspended sediment).
The suspended sediment load in Anaktuvuk River was significantly higher in July 2012 than in July 2011 (around 433% increase), while the Chandler River experienced an even larger increase in July 2012 compared with July 2011. A similar trend was observed in the Itkillik River. This variability is due to changing patterns of precipitation, in that summer 2012 was wetter overall than summer 2011, and an extensive rain event was recorded in June 2013 [
29]. Reported cumulative rainfall [
29] for stations located at high and low elevations are shown in
Table 4. The table shows the inter-annual variability of precipitation distribution in the watersheds.
5. Discussion
A comparison of slopes in the relationships between SSC from Isco and depth-integrated samples (see
Figure 3) for each of the three rivers points out that the Isco under-estimated SSC when compared to the SSC from the depth-integrated samples.
The high
R2 values reported in
Figure 4 show strong relationships between SSC and discharge. In consequence, future sediment loads could be estimated as function of discharge, which certainly would limit the required field visits.
An analysis of available data indicates that the Itkillik River has the highest sediment concentration per unit discharge (see
Figure 4), which suggests that fine sediment is readily available in the watershed. In addition, this river has the biggest bed sediment on exposed bars, which implies that high water discharges could occur at the gauging site. While higher discharges were measured on the other two rivers (i.e., Anaktuvuk and Chandler), the bed sediment data suggest reduced shear stresses, due to the smaller D
50, at these gauging areas.
The available data indicate that the Itkillik River reacts more than the other rivers to summer rainfall events, as indicated by suspended sediment yields. The Itkillik River watershed is the smallest of the study rivers; thus, summer storms could cover a higher percentage of the area than a bigger watershed (i.e., Anaktuvuk and Chandler). In addition, the precipitation data (
Table 4) show the variation of rainfall events inside the watersheds in terms of elevation and year-to-year precipitation respectively. Thus, river discharge (and consequently suspended sediment loads) can vary significantly during the summer seasons.
A comparison of monthly suspended sediment yields between the Chandler and Anaktuvuk Rivers (
Table 2) shows consistently high values at the Chandler River. In terms of sediment in suspension, the Anaktuvuk River is the most diluted of the study rivers (
Figure 4).
The 3-year record shows not only the importance of breakup on suspended sediment load (year 2011, for instance), but also the contribution of widespread rainfall events (June 2013). In addition, the existing data set suggests the end of winter SWE might not be as critical as previously thought.
6. Conclusions
This study presents an initial assessment of suspended sediment loads in three Alaska North Slope rivers: the Anaktuvuk, Chandler, and Itkillik. The study sites can only be accessed by helicopter, the use of which limits researchers’ time in the field due to the cost of this type of transportation and the weather conditions required for safe flying.
A series of tasks were carried out in the field, and several relationships were established to calculate sediment yields. These tasks involved water sampling using autosamplers and depth-integrated samplers, as well as continuous recording of water levels and discrete discharge measurements. In terms of relationships, equations were established (a) between SSC from autosamplers and depth-integrated SSC; and (b) between SSC and water discharge. Suspended sediment loads were calculated using both relationships and rating curves. The calculated monthly sediment yields show high variability both monthly and annually.
This initial data set could be used as a baseline for future studies related to the effects of climate change in cold regions.


