Article

Seawater and Freshwater Circulations through Coastal Forested Wetlands on a Caribbean Island

1
Ecolab, UMR 5245, CNRS-Université Paul Sabatier-INPT, 118 route de Narbonne, Toulouse Cedex 31062, France
2
UMR ECOFOG-Dynecar, Université des Antilles, Pointe-à-Pitre 97159, Guadeloupe, France
3
Impact Mer, 90 rue du Pr Raymond Garcin, Fort-de-France 97200, Martinique, France
4
Geolab, UMR 6042, 4 rue Ledru, CNRS-Université Blaise Pascal, Clermont-Ferrand Cedex 63057, France
*
Author to whom correspondence should be addressed.
These authors contributed equally to this work.
Water 2015, 7(8), 4108-4128; https://doi.org/10.3390/w7084108
Submission received: 22 May 2015 / Revised: 20 July 2015 / Accepted: 22 July 2015 / Published: 27 July 2015

Abstract

:
Structure and composition of coastal forested wetlands are mainly controlled by local topography and soil salinity. Hydrology plays a major role in relation with tides, seaward, and freshwater inputs, landward. We report here the results of a two-year study undertaken in a coastal plain of the Guadeloupe archipelago (FWI). As elsewhere in the Caribbean islands, the study area is characterized by a micro-tidal regime and a highly seasonal climate. This work aimed at understanding groundwater dynamics and origin (seawater/freshwater) both at ecosystems and stand levels. These hydrological processes were assessed through 18O/16O and 2H/1H isotopic analyses, and from monthly monitoring of water level and soil salinity at five study sites located in mangrove (3) and swamp forest (2). Our results highlight the importance of freshwater budget imbalance during low rainfall periods. Sustained and/or delayed dry seasons cause soil salinity to rise at the mangrove/swamp forest ecotone. As current models on climate change project decreasing rainfall amounts over the inner Caribbean region, one may expect for this area an inland progression of the mangrove forest to the expense of the nearby swamp forest.

1. Introduction

In natural contexts, coastal tropical lowland areas are covered by mangroves, swamp forests, and/or herbaceous marshes [1,2]. Such wetlands generally display a typical zonation which has been described for long in the literature as distinct vegetation belts following one another from the shores landwards [3,4,5,6]. Among the environmental gradients that shape these zonation patterns, soil salinity, and topography (i.e., waterlogging) appear as the main factors controlling plant community composition and structure, as well as wetland subsystems’ function [7,8,9]. However, mechanisms involved in the variations of soil salinity through space and time are not easy to understand [10]. In coastal wetlands, freshwater input during the rainy season is not the sole factor explaining seasonal variations of groundwater salinity. Seawater can infiltrate coastal aquifers underneath the less dense freshwater lens and move landwards. Moreover, soil texture can modify seawater circulation through the sediments due to differences in porosity [10,11]. In addition, seasonal changes in the water table depend not only on freshwater inputs and tidal rhythm, but also on the loss of freshwater through evapotranspiration processes which increase landwards. Thus, the vegetation of coastal tropical wetlands, which mostly consists of tidal forests, interacts with hydrologic processes [12,13].
In the Antilles, tidal range is low (less than 0.5 m) and the climate exhibits two main contrasted seasons. In the Caribbean, there is only one rainy season: the Inter Tropical Convergent Zone (ITCZ) reach the whole region from July to November and move back in December (see Figure 1). The high evapotranspiration rate (125 to 150 mm per month) induces a water deficit between January and June. During this dry season, the conjunction of low rainfall amounts and high atmospheric pressure cause the water table to drop several weeks below ground level in coastal wetlands [14]. In these islands, watershed size and freshwater discharge are often limited. For this reason and because of high evaporation, mean groundwater salinity in coastal areas is generally higher than that of seawater [15]. However, groundwater salinity may temporarily fall after heavy rainfall events or remain under that seawater nearby permanent streams of freshwater [14,16].
The aim of this study is to understand the hydrological dynamics that occur in coastal wetlands of the Antilles, and, more precisely, to propose a conceptual model for the hydrological functioning of both mangrove and swamp forest ecosystems. For this purpose, we monitored water level and salinity over two years in contrasted sites of both coastal forests. In order to search for water origin (sea vs. freshwater) we conducted isotopic measurements (18O and 2H) on groundwater samples.
Figure 1. Average monthly rainfall amounts (in blue) at Raizet meteorological station since 1951 and average evapotranspiration (in red). Error bars figure standard deviation.
Water 07 04108 g001

2. Materials and Methods
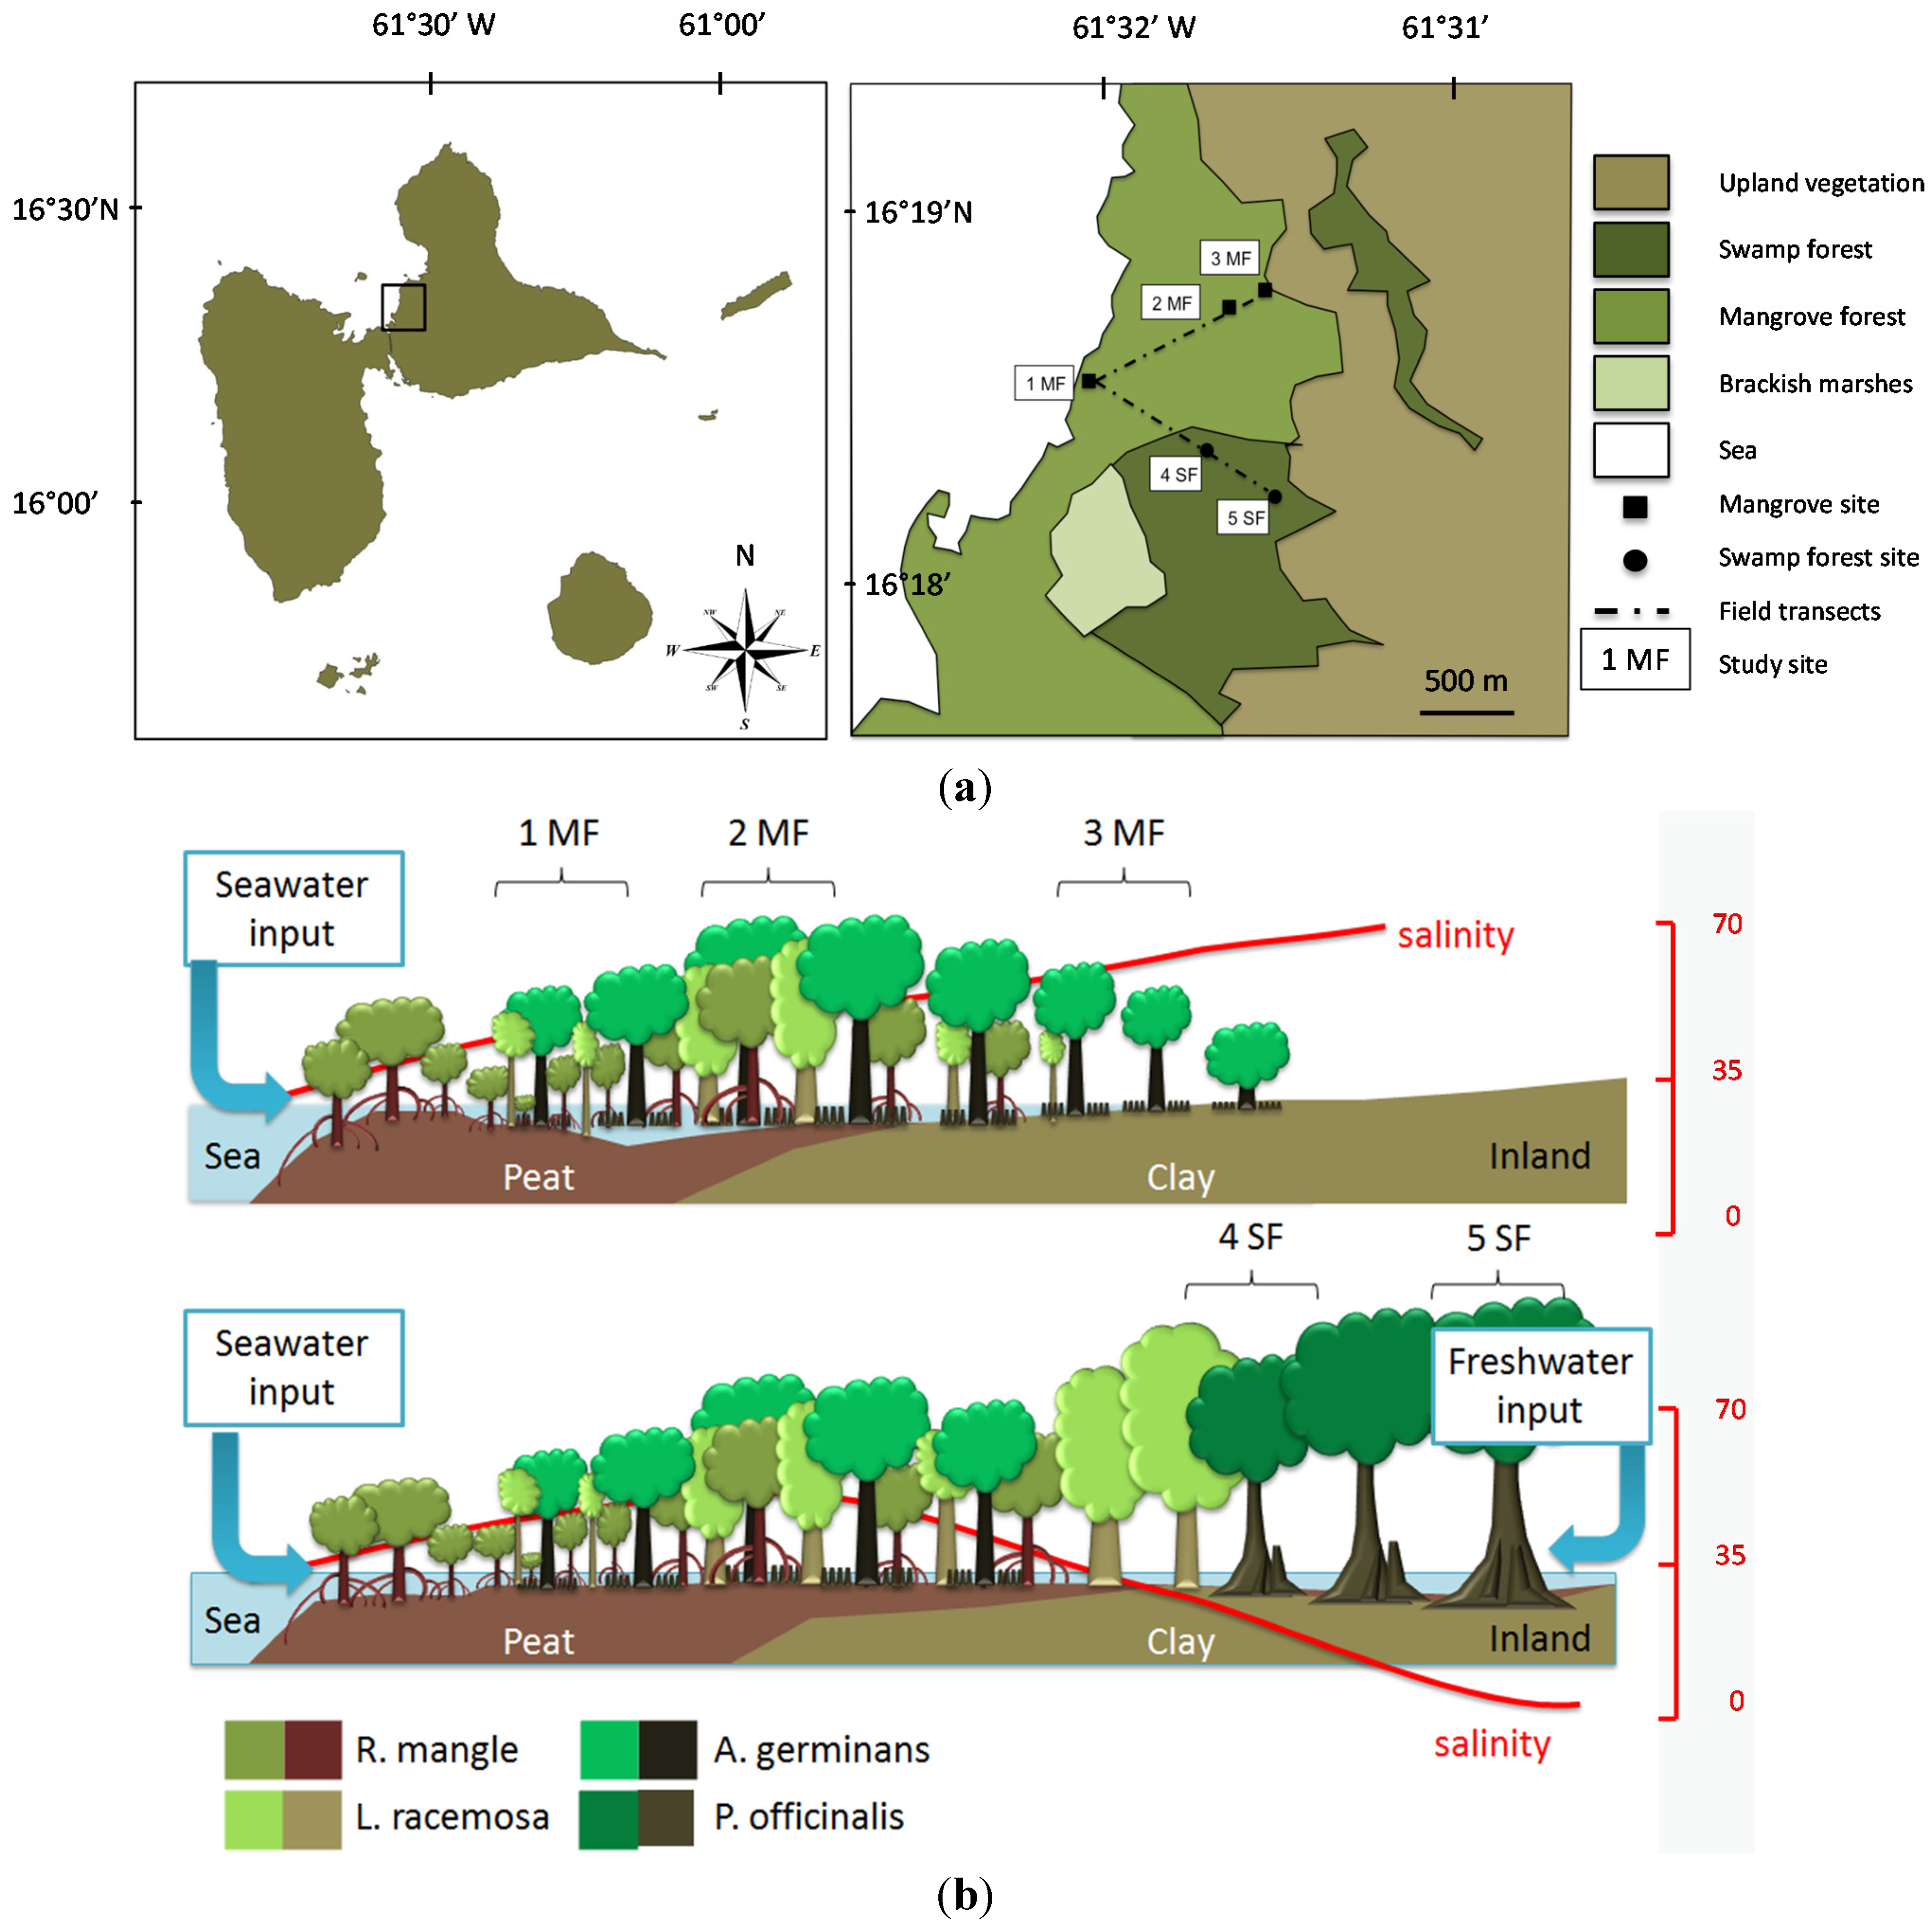
2.1. Study Sites

The study area is located along the Bay of the Grand Cul-de-sac Marin, Guadeloupe, Lesser Antilles (Figure 2a). Floristic and physiognomic changes occur in relation to a landward/seaward gradual variation in soil waterlogging and salinity (Figure 2b). The limestone bedrock is overlaid by clayey sediments which are overtopped by peat seaward. A total of five sampling sites were selected along two transects and have been studied for two years, from January 2011 to December 2012. On the sea front, the mangrove forest consists of a narrow, monospecific belt of Rhizophora mangle trees. A few meters landward, the vegetation turns into a shrubby (less than 7 m high), mixed formation with R. mangle, Laguncularia racemosa and Avicennia germinans occurring together (study site 1MF) on a peat soil with low bulk density (22.4 kg·m−3). In the inner part of the study area, the canopy is much denser, with trees heights up to 15 m and above. The study site 2MF is located in this part of the forest, in a mixed stand supporting the three above-mentioned species on a clayey soil of higher bulk density (106.7 kg·m−3). The third study site (3MF) is located at the landward edge of the mangrove forest. Here the substrate is constituted by hyper-saline, very dense clayey sediments (166.1 kg·m−3). It consists of a low (4–6 m) monospecific A. germinans stand. The two last sites are located in the nearby swamp forest dominated by Pterocarpus officinalis. Site 4SF is closed to the mangrove edge, whereas site 5SF is located landward where groundwater salinity is very low (ca. 7 g·L−1). The soil is clayey with intermediate bulk density (89.3 and 71.1 kg·m−3 for 4SF and 5SF respectively).
Figure 2. (a) Location of the Guadeloupe Archipelago in the Caribbean Sea, on the lesser Antilles arc; study area on the eastern cost of the Grand Cul-de-Sac Bay, and location of the sampling sites in the mangrove forest (1MF to 3MF, respectively R. mangle, L. racemosa and A. germinans) and the swamp forest (4SF to 5SF, P. officinalis); (b) Vegetation belts, soil types, soil salinity (red curve, the scale is in g·L−1) and location of the sampling sites.
Water 07 04108 g002

2.2. Water Level and Soil Salinity

A water-table monitoring well was set up at the center of each study site. The depth from water level to ground surface was measured manually, monthly over two years, from January 2011 to February 2013, and water-level variation over time was compared between the five sampling sites. During the same period and with the same periodicity, we measured soil salinity near the surface (0–10 cm depth), where salt content exhibits the largest seasonal fluctuations. Measurements were performed at the laboratory because the water table often fell below ground surface, and there was therefore not enough water to make direct measurements using either conductometric or refractometric methods, especially on clayey soils. Salinity of three pooled samples per site (a total of 15 samples) was measured on saturated soil-paste with a conductimeter (Multi 350i and ConOx probe, WTW, Germany) using the normalized protocol (NF ISO 11265; AFNOR 1995). The deviation from the mean value was used to highlight salinity fluctuations. Rainfall amounts per hour were obtained from the meteorological center (Raizet, Météo-France) located less than 5 km away from the study sites. Daily maximum sea levels were obtained from the tide gauge-meter located in the harbor of Pointe-à-Pitre, 8 km south from the study sites (SHOM, Service Hydrographique et Océanographique de la Marine). The rainfall amount was cumulated each month and the daily maximum sea level was averaged each month before surveying water level and soil salinity.

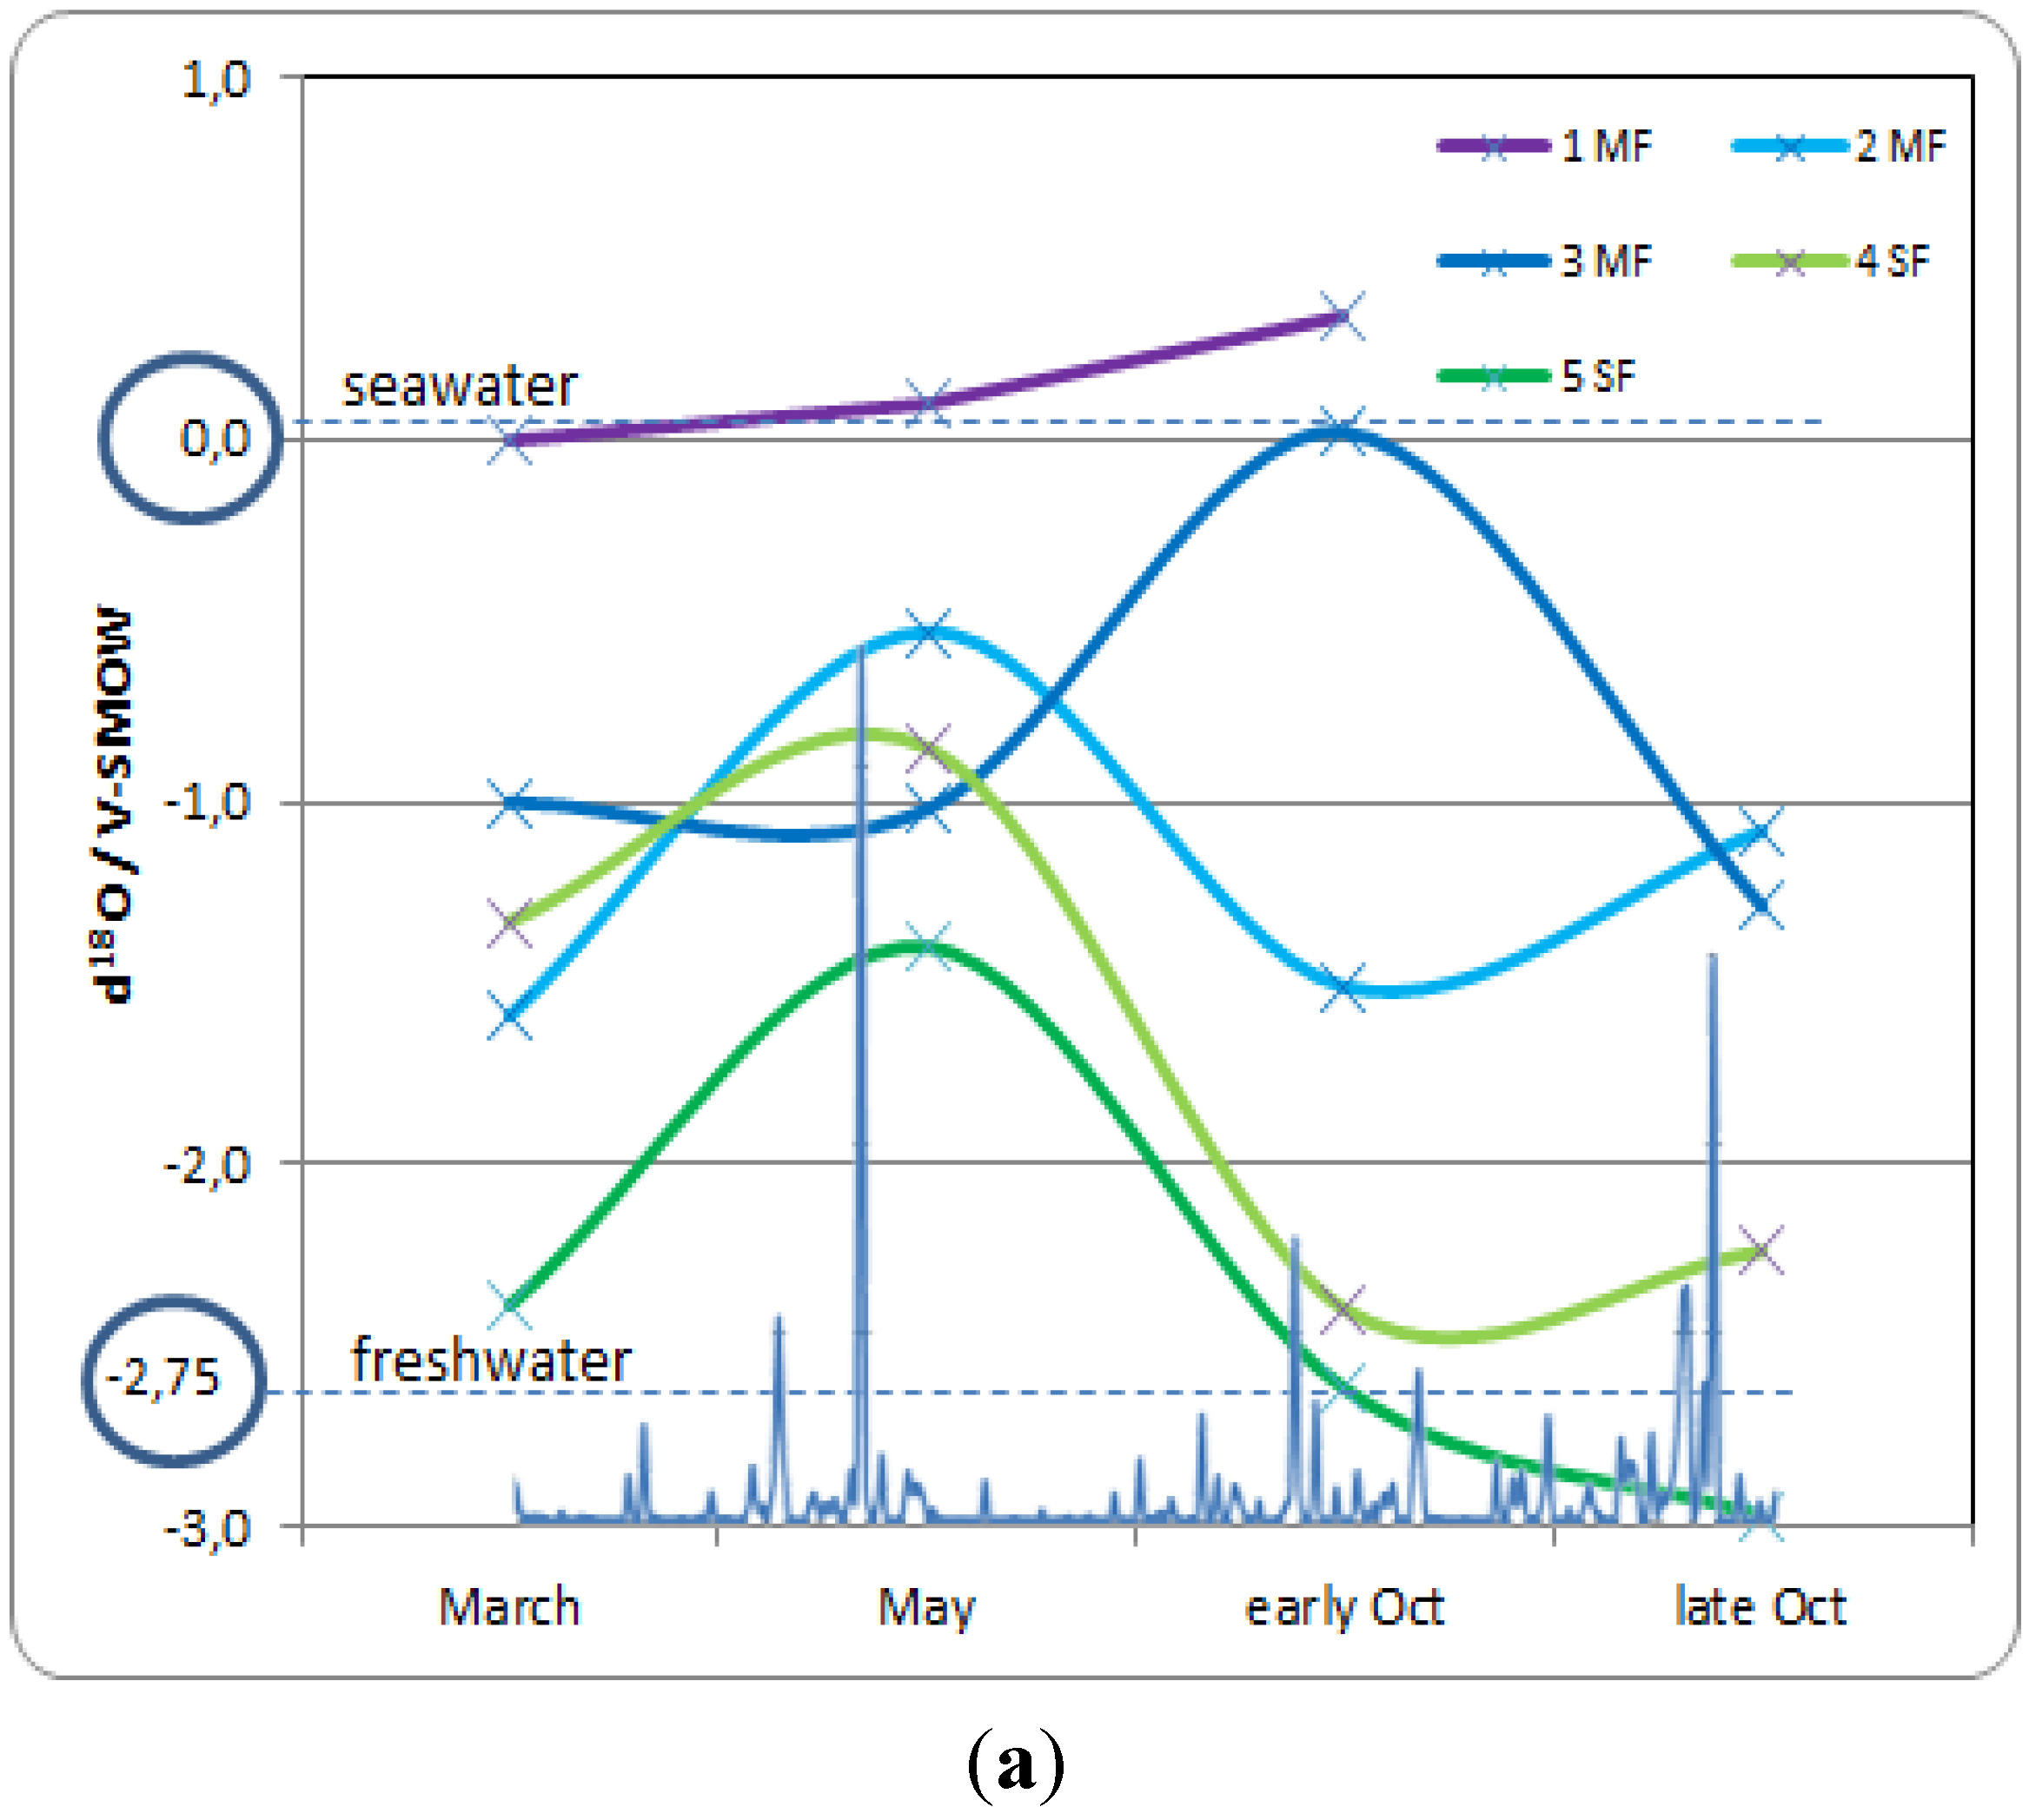
2.3. Isotopic Analysis

In March, May and October 2012, water samples were taken from the sea, from surrounding freshwater springs and from each of the five wells, at the top of the water table. The water samples were collected in 10 mL glass vials with secure caps ready to be sent to the isotopic laboratory. The 18O and 2H stable isotope composition of water was measured and reported with reference to the Vienna Standard Mean Ocean Water (V-SMOW) and the Vienna Standard Light Antarctica Precipitation (V-SLAP), in parts per thousand. The definition for oxygen is: δ18O V-SMOW (‰) = ((18O/16O sample)/(18O/16O standard) − 1) × 1000; and for deuterium: δ2H V-SMOW (‰) = ((2H/1H sample)/(2H/1H standard) − 1) × 1000.
In a preliminary study, the two water pools characteristic have been determined, i.e., the two end-members of the isotopic measurements. The fresh water pool was measured on nearby springs: δ18O = −2.74 +/−0.16 (n = 3), which corresponds to slightly depleted coastal rainfall. The salty pool was obtained from seawater taken in the Grand Cul-de-sac Marin: δ18O = +0.33 +/−0.06 (n = 3), closed to GMWL (Global Meteoric Water Line).
The isotopic analyses were carried out in the Shiva Isotopic Platform in ECOLAB (Toulouse, France) using a continuous flow IRMS (Elementar Isoprime 100 coupled with a Geo-Multiflow for the water–gas equilibration). In the laboratory, 0.3 mL aliquots of the water were taken in capped 3.7 mL Exetainer vials (Labco Ltd., High Wycombe, UK). In order to measure the δ18O values, the samples and the internal standards were flushed offline with a gas mixture of 5% CO2 in Helium. The vials were then left to equilibrate at 40 °C for about 8 h. The analytical precision of the measurements was ±0.2‰. To measure the δ2H values of the samples, Hokko beads were added to the vials containing the water samples and the internal standards before the vials were flushed offline with a gas mixture of 5% H2 in Helium. The vials were left to equilibrate at 40 °C for about 8 h. The analytical precision of the measurements was ±2.0‰. The deuterium excess was calculated using the Global Meteorological Water Line (GMWL) as defined by Craig [17] and completed by Dansgaard [18], i.e.: d-excess = δ2H − 8 × δ18O.

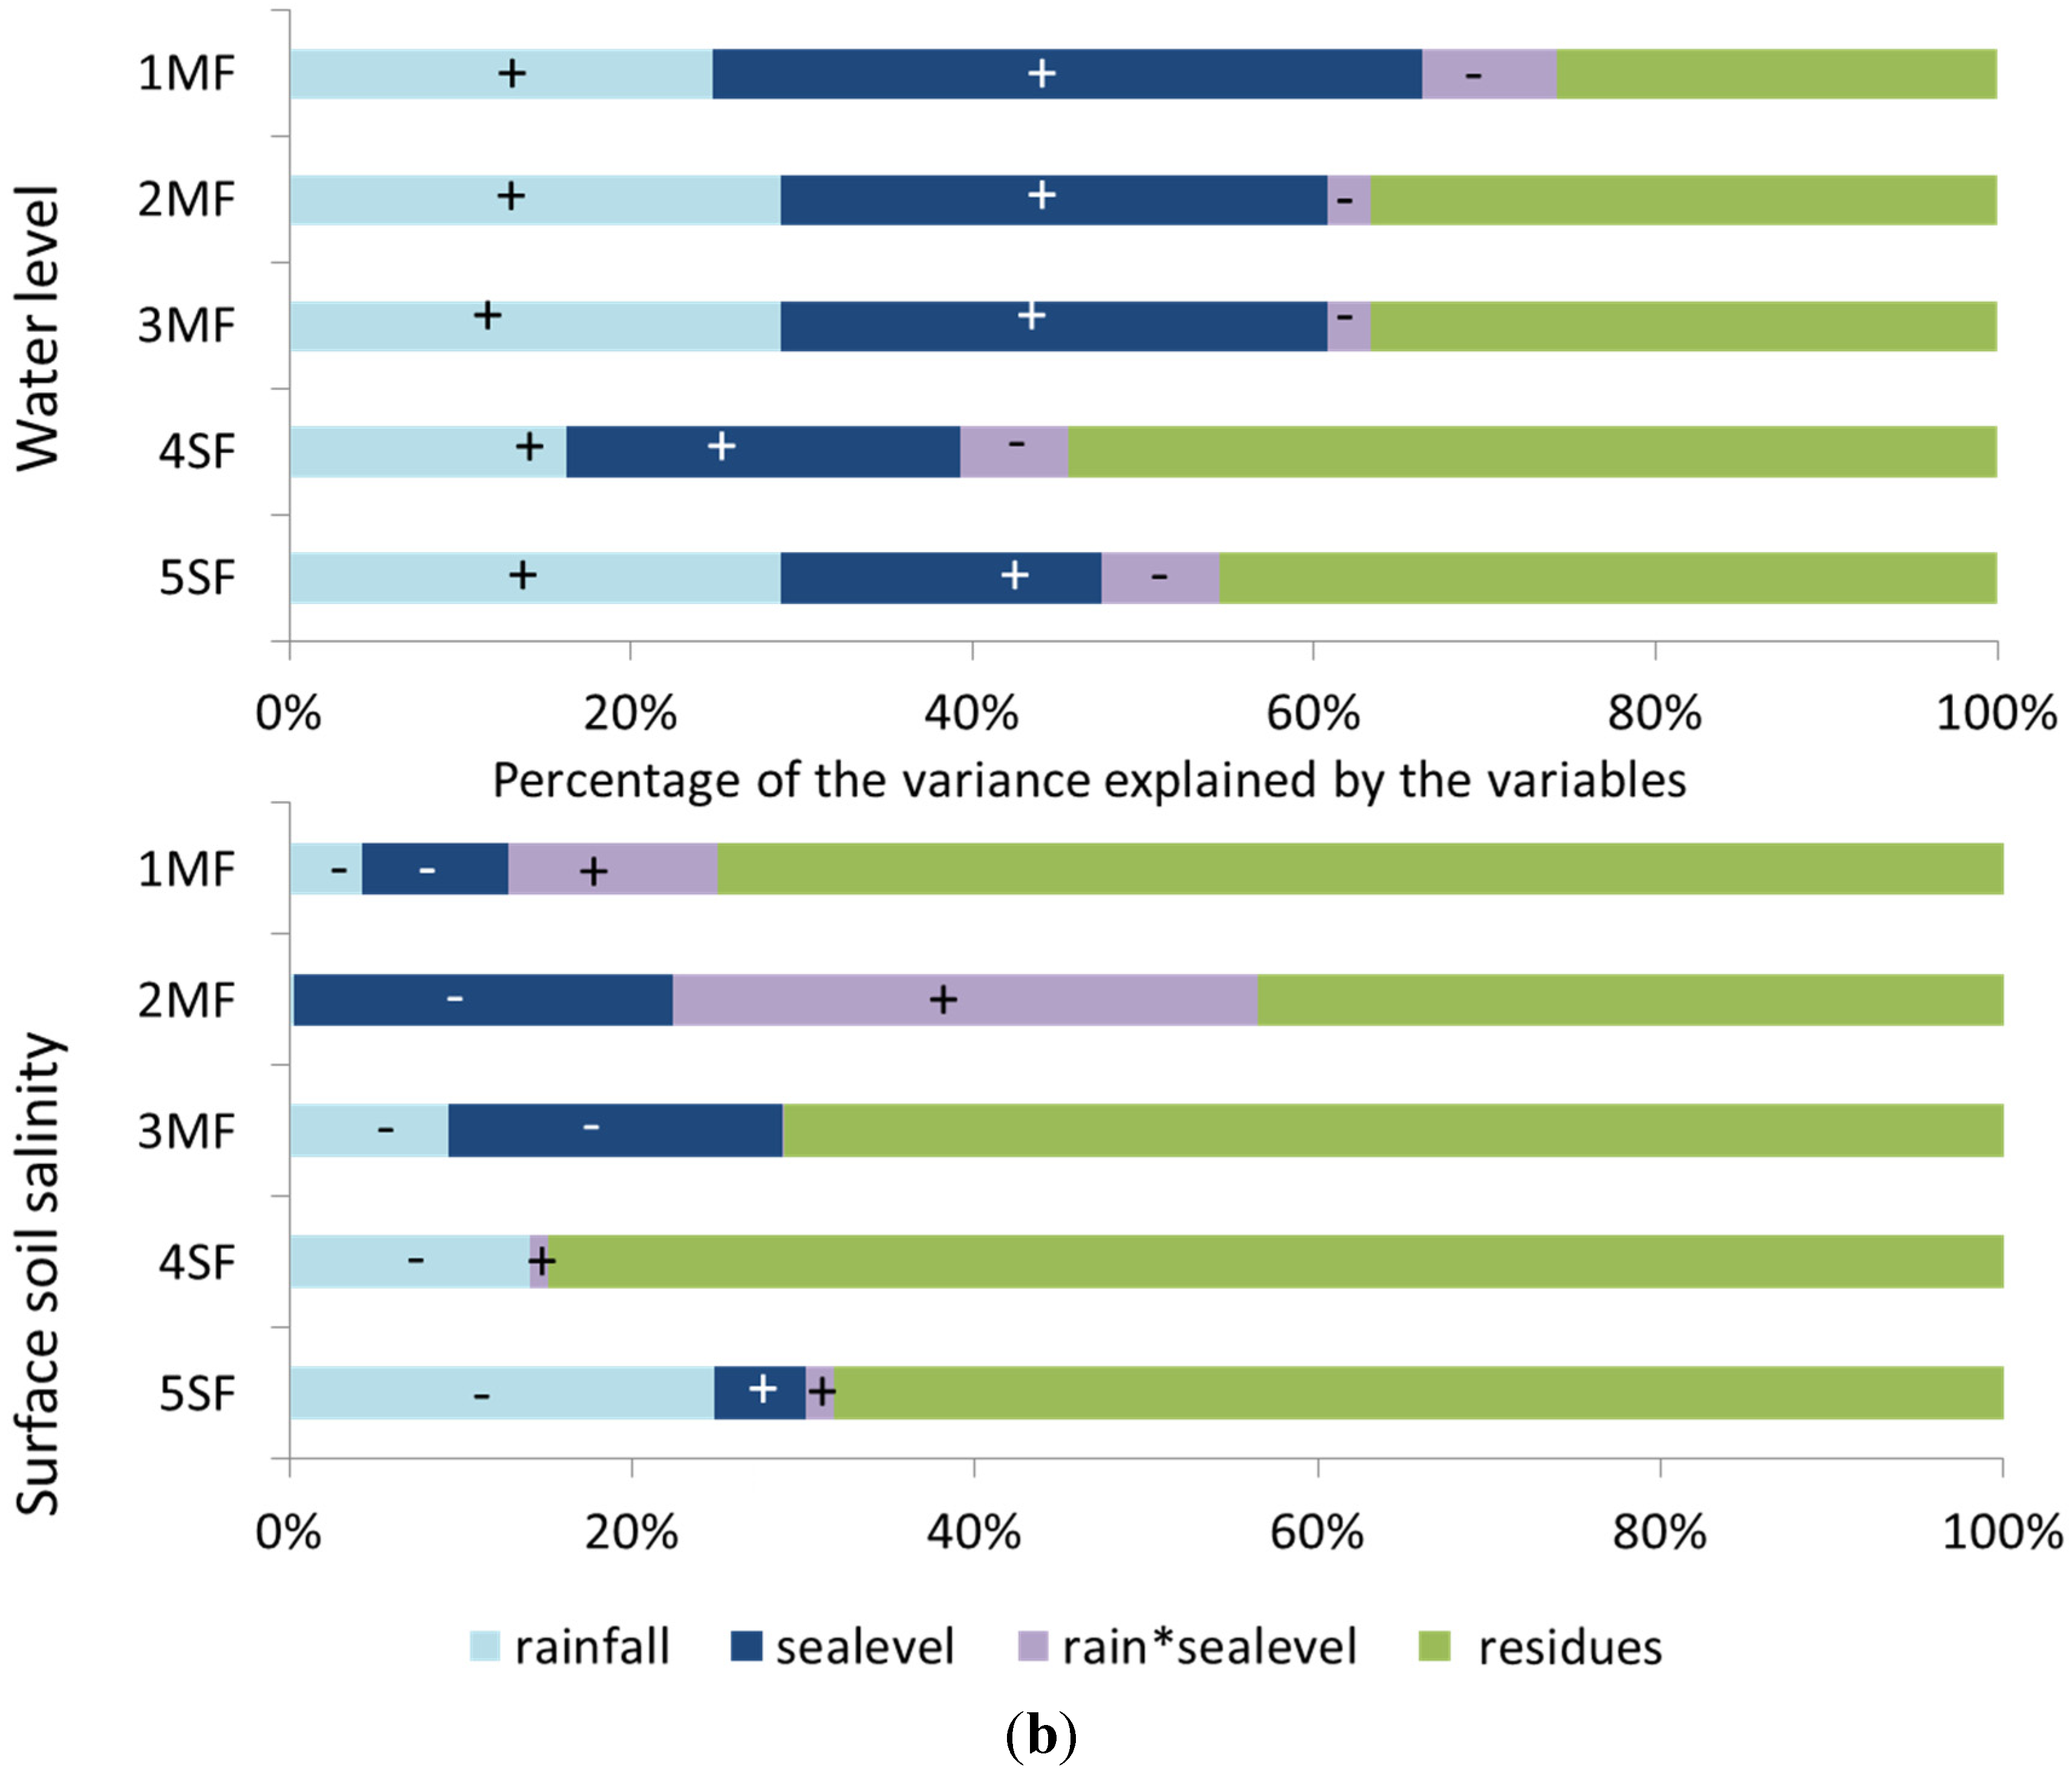
2.4. Statistical Tests

We modelled site by site the link between edaphic parameters (water level on site and top soil salinity) and climate through two forcing variables (seawater level and rainfall amounts) with a linear regression framework according to Wagner et al. 2012 [19]. A covariance analysis (ANCOVA) was used to discuss the effects of forcing variables (seawater level and rainfall amounts as co-variates) on edaphic parameters (water-table level and top-soil salinity), as monthly rainfall amounts and sea level appeared to be related. Our analysis was based on the following models.
For the station i and the monitoring period j:
Water-table level i,j = seawater level j + rainfall amounts j + seawater level × rainfall amounts j + residuals i,j
Top-soil salinity i,j = seawater level j + rainfall amounts j + seawater level × rainfall amounts j + residuals i,j
ANCOVA result’s validity was checked with (i) a graphical analysis of the residuals (standardized residuals vs. theoretical quantiles and residuals vs. predicted values); (ii) Cook’s distance calculation on each residual to check if it was inferior to 1 and (iii) a Shapiro-Wilk test on the residuals to check normality (see “Appendix A” for detail).

3. Results

3.1. Study Sites Characteristics

Relative soil elevation, mean water-table level (as seen from the monitoring wells) and soil salinity for the five sampling sites (1MF, 2MF, 3MF, 4SF and 5SF) are reported in Table 1. Because it is very difficult to accurately determine the mean sea level in a specific place, mean ground level at site 1MF will serve as the zero topographic level in our experimental design. The other sites, located more inland, have similar or higher relative altitude, excepted 2MF which is located in a small topographic depression. Water levels are negatively correlated to relative elevation. However, comparison between mangrove and swamp forest sites shows that for a same relative elevation (1MF vs. 4SF and 3MF vs. 5SF), swamp forest sites are more prone to flooding than mangrove forest. The swamp forest sites show low salt amounts in the soil (7 to 21 g·L−1), whereas soil salinity in the mangrove forest ranges from that of sea water (33 g·L−1) to twice as much (72 g·L−1) in the Avicennia area.
Table 1. Relative soil elevation (1MF taken as zero level), annual means of the water level and soil salinity over the two-year sampling period.
EcosystemStationsDistance from the Sea (m)Relative Elevation (cm)Water Level (cm) Mean (min ; max))Mean Soil Salinity (g·L−1) Mean (min ; max)
Mangrove1MF500.0−6.2 (−34 ; 4)32.2 (21 ; 53)
2MF750−6.83.0 (−39 ; 13)49.9 (33 ; 65)
3MF10001.6−11.3 (−47 ; 11)72.0 (35 ; 113)
Swamp forest4SF1050−0.90.3 (−33 ; 11)20.8 (12 ; 40)
5SF13502.1−4.9 (−26 ; 4)6.6 (2.8 ; 12)

3.2. Hydrological Parameters

Figure 3a shows variations of water level and soil salinity over the two-years monitoring period. The results of the ANCOVA are illustrated in Figure 3b. It gives the percentage of variance for water level and soil surface salinity explained by rainfall and/or sea level at each mangrove and swamp forest site.
For water levels and topsoil salinity at each site, residual analysis showed that residuals were normally (Shapiro-Wilk’s tests, p > 0.05) and independently distributed. The analysis of residual vs. fitted values showed homoscedasticity and a distribution of residuals around a zero mean. Concerning water levels, Cook’s distances were always lower than 1; however, concerning two residuals were higher. These two residuals were associated with a very strong rain event in September 2011. However, as they were associated to top soil salinity values equal to the annual average we choose to keep them in the analysis. Our residual analysis showed that the data set was suitable for ANCOVA analysis.
Concerning water level, the model shows high residual values for some measurement sessions in all study sites. They all occurred during dry seasons (from February to May) for the lowest water level values. We also found that water table variance was a little bit higher for low water table values.
Concerning topsoil salinity, the model also showed higher variance values in the swamp forest sites during the dry season. In mangrove sites the variance stayed constant over the predicted values.
Therefore, on one hand, our model seems to give a quite good general picture of the interaction between water level and the two selected environmental variables (more than 40% of explained variance). On the other hand, our model seems not adequate for predicting correctly the intensity of dry events on the water level. We also noted that, in swamp forest, our model underestimate the water level and overestimate the topsoil salinity during the dry season. This could be due to the karst system and to the numerous springs that seems to provide fresh water in the forest, even during strong dry events.
Figure 3. (a) Water level (solid line, variation in cm), sea level (blue area, relative variation), soil salinity (dashed red line, relative variation), and monthly rainfall (black bars) in the five study sites from January 2011 to February 2013. The sea level and soil salinity are expressed as the deviation (%) from the mean value calculated over the two-year period; (b) Percentage of the variance for water level and topsoil salinity explained by rainfall and/or sea level in each mangrove or swamp forest site; ANCOVA analysis.
Water 07 04108 g003aWater 07 04108 g003b
Water level is influenced both by rainfall and by sea level. Water-table level is high/low when both rainfall and sea level are high/low. In stands near to the seashore, like at site 1MF, water level is mainly controlled by the sea level (40% of the variance). On the contrary, in more inland stands like (e.g., 4SF and 5SF), water level depends mainly on rainfall amounts. For all sites, soil salinity is less explained by rainfall amounts and sea level than water level. Except for site 5SF, salinity tends to increase when rainfall amounts and sea level decrease. In the swamp forest, soil salinity variations result mainly from the amount of rainfall; conversely, in the mangrove forest, rainfall alone is a very weak descriptor of salinity variations.

3.3. Groundwater Dynamics

The monitoring of water level and soil salinity was completed by isotopic measurements. Figure 4a reports seasonal fluctuations of groundwater δ18O values, and Figure 4b reports that of soil salinity, from March to late October 2012. In the mangrove forest, groundwater at site 1MF only contained seawater (δ18O closed to +0.2‰) and soil salinity remained closed to that of seawater (35 g·L−1). The two mangrove sites located more inland (2MF and 3MF) showed isotopic values that indicate a mixture between fresh and seawater (about 50/50), with δ18O ranging from −1.6‰ to −1.0‰; however, soil salinity remained high, especially at site 3MF, due to salt accumulation resulting from evaporation. In early October, at the beginning of the wet season, δ18O values from the 2MF site dropped from −0.5‰ to −1.5‰. Such values indicate inputs of freshwater, although soil salinity remains quite constant. Conversely, the 3MF site reacted in late October with a drop of δ18O values from 0‰ to −1.3‰. The clay substrate of the 3MF site enabled slower water mixing than in the peat substrate of the 2MF site. The calculated deuterium excess [18] (between +10‰ to +20‰) revealed that during the dry season (March to May) globally no evaporation occurred in all mangrove sites. The only exception is the site 1MF which displays lower values, and negative values in mid-May and even early October. This means that outside the small mangrove band near the shore at 1MF, no ground-water evaporation occurred there, due to enough water availability.
Concerning the swamp forest, during the dry season (from March to May), salinity increased slowly and the isotopic values shifted in the direction of the seawater pool (δ18O around 0‰). When the wet season began (October), salinity decreased, and the swamp forest recovered isotopic values corresponding to fresh water (δ18O = −2.5‰). High deuterium excess is observed in March (+ 14 to +20) suggesting strong water-vapor recycling process under the canopy of the swamp forest. In May, the d-excess values dropped to +3 to +11, and increased again in October with values ranging from +13 to +18, with always lower value for 4SF station.
Figure 4. (a) Seasonal fluctuation of groundwater δ18O values in year 2012, with reference to seawater and freshwater (ellipses); (b) Seasonal fluctuation of soil salinity, showing the influence of seawater during the dry season (March to May), and of freshwater during the wet season (September–October). In super-imposition on the X axis the rainfall amount with the first storm on 7th May (231 mm) and the Raphael storm on 13–19 October (626 mm).
Water 07 04108 g004aWater 07 04108 g004b

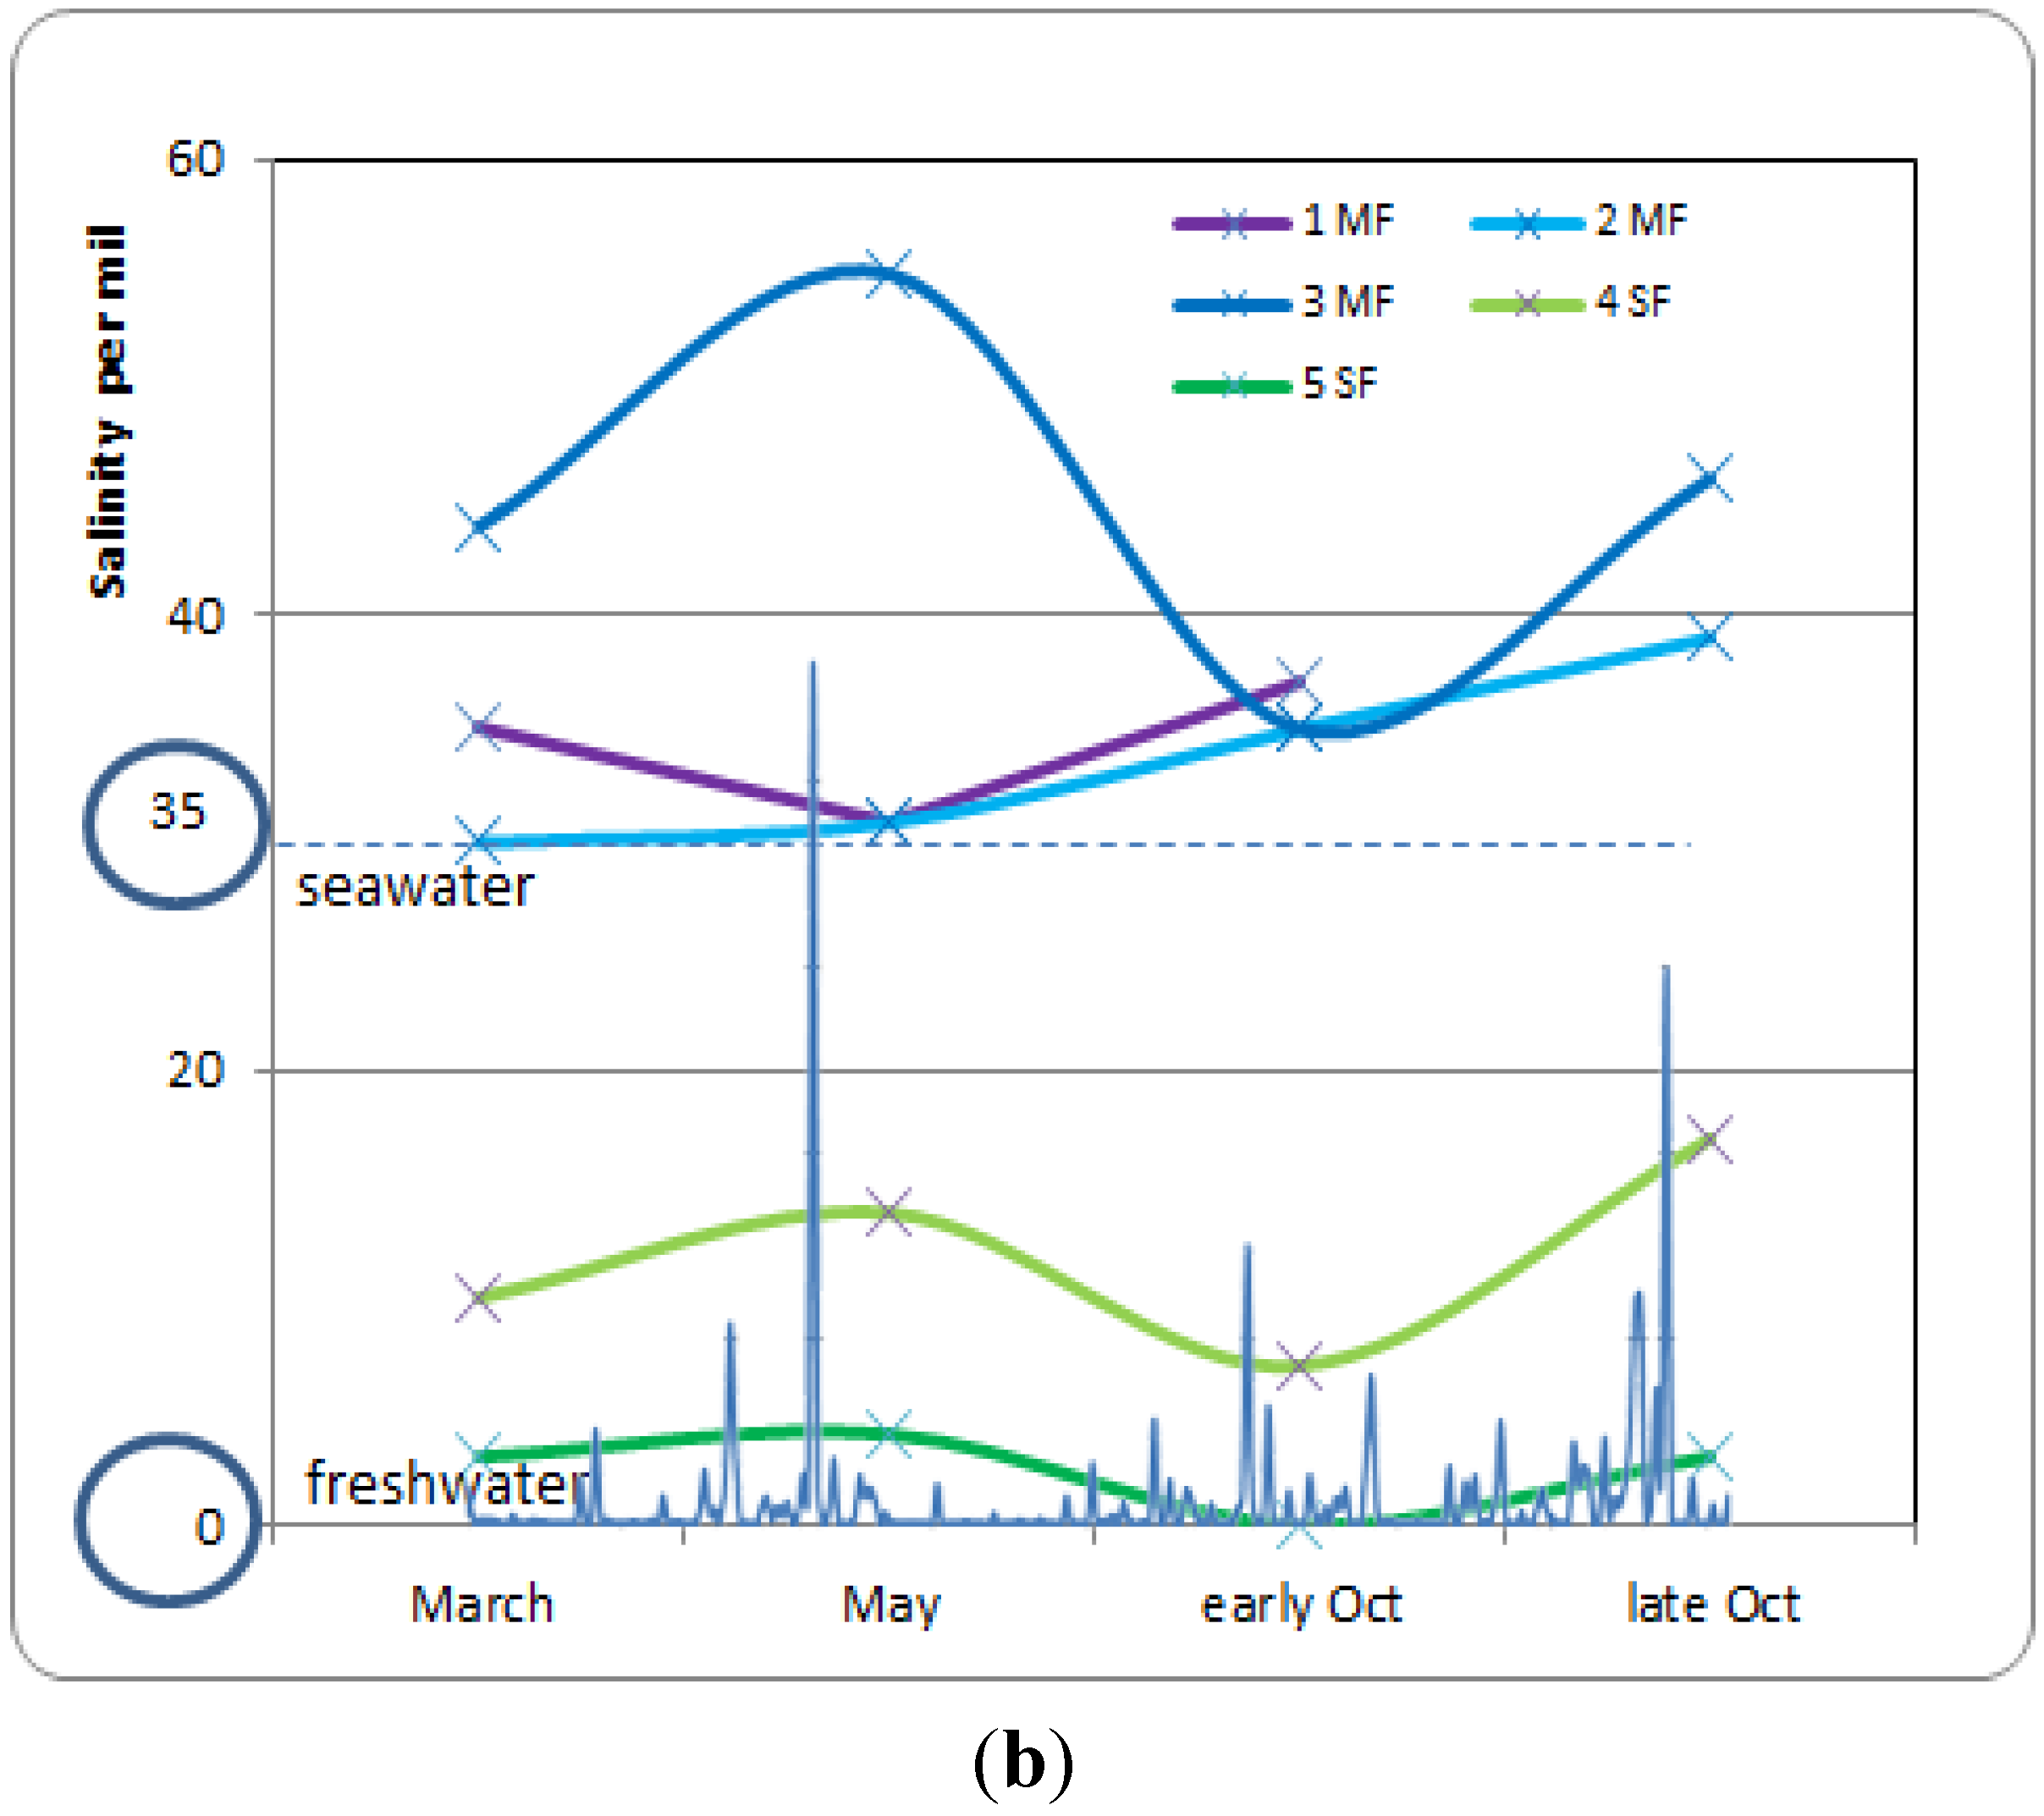
3.4. Soil Salinity and Water-Table Dynamics in the Mangrove and Swamp Forests

In order to better understand the seasonal dynamics of soil salinity and water fluxes, we have set up a conceptual framework highlighting mangrove (Figure 5a) and swamp forest (Figure 5b) distinctive features.
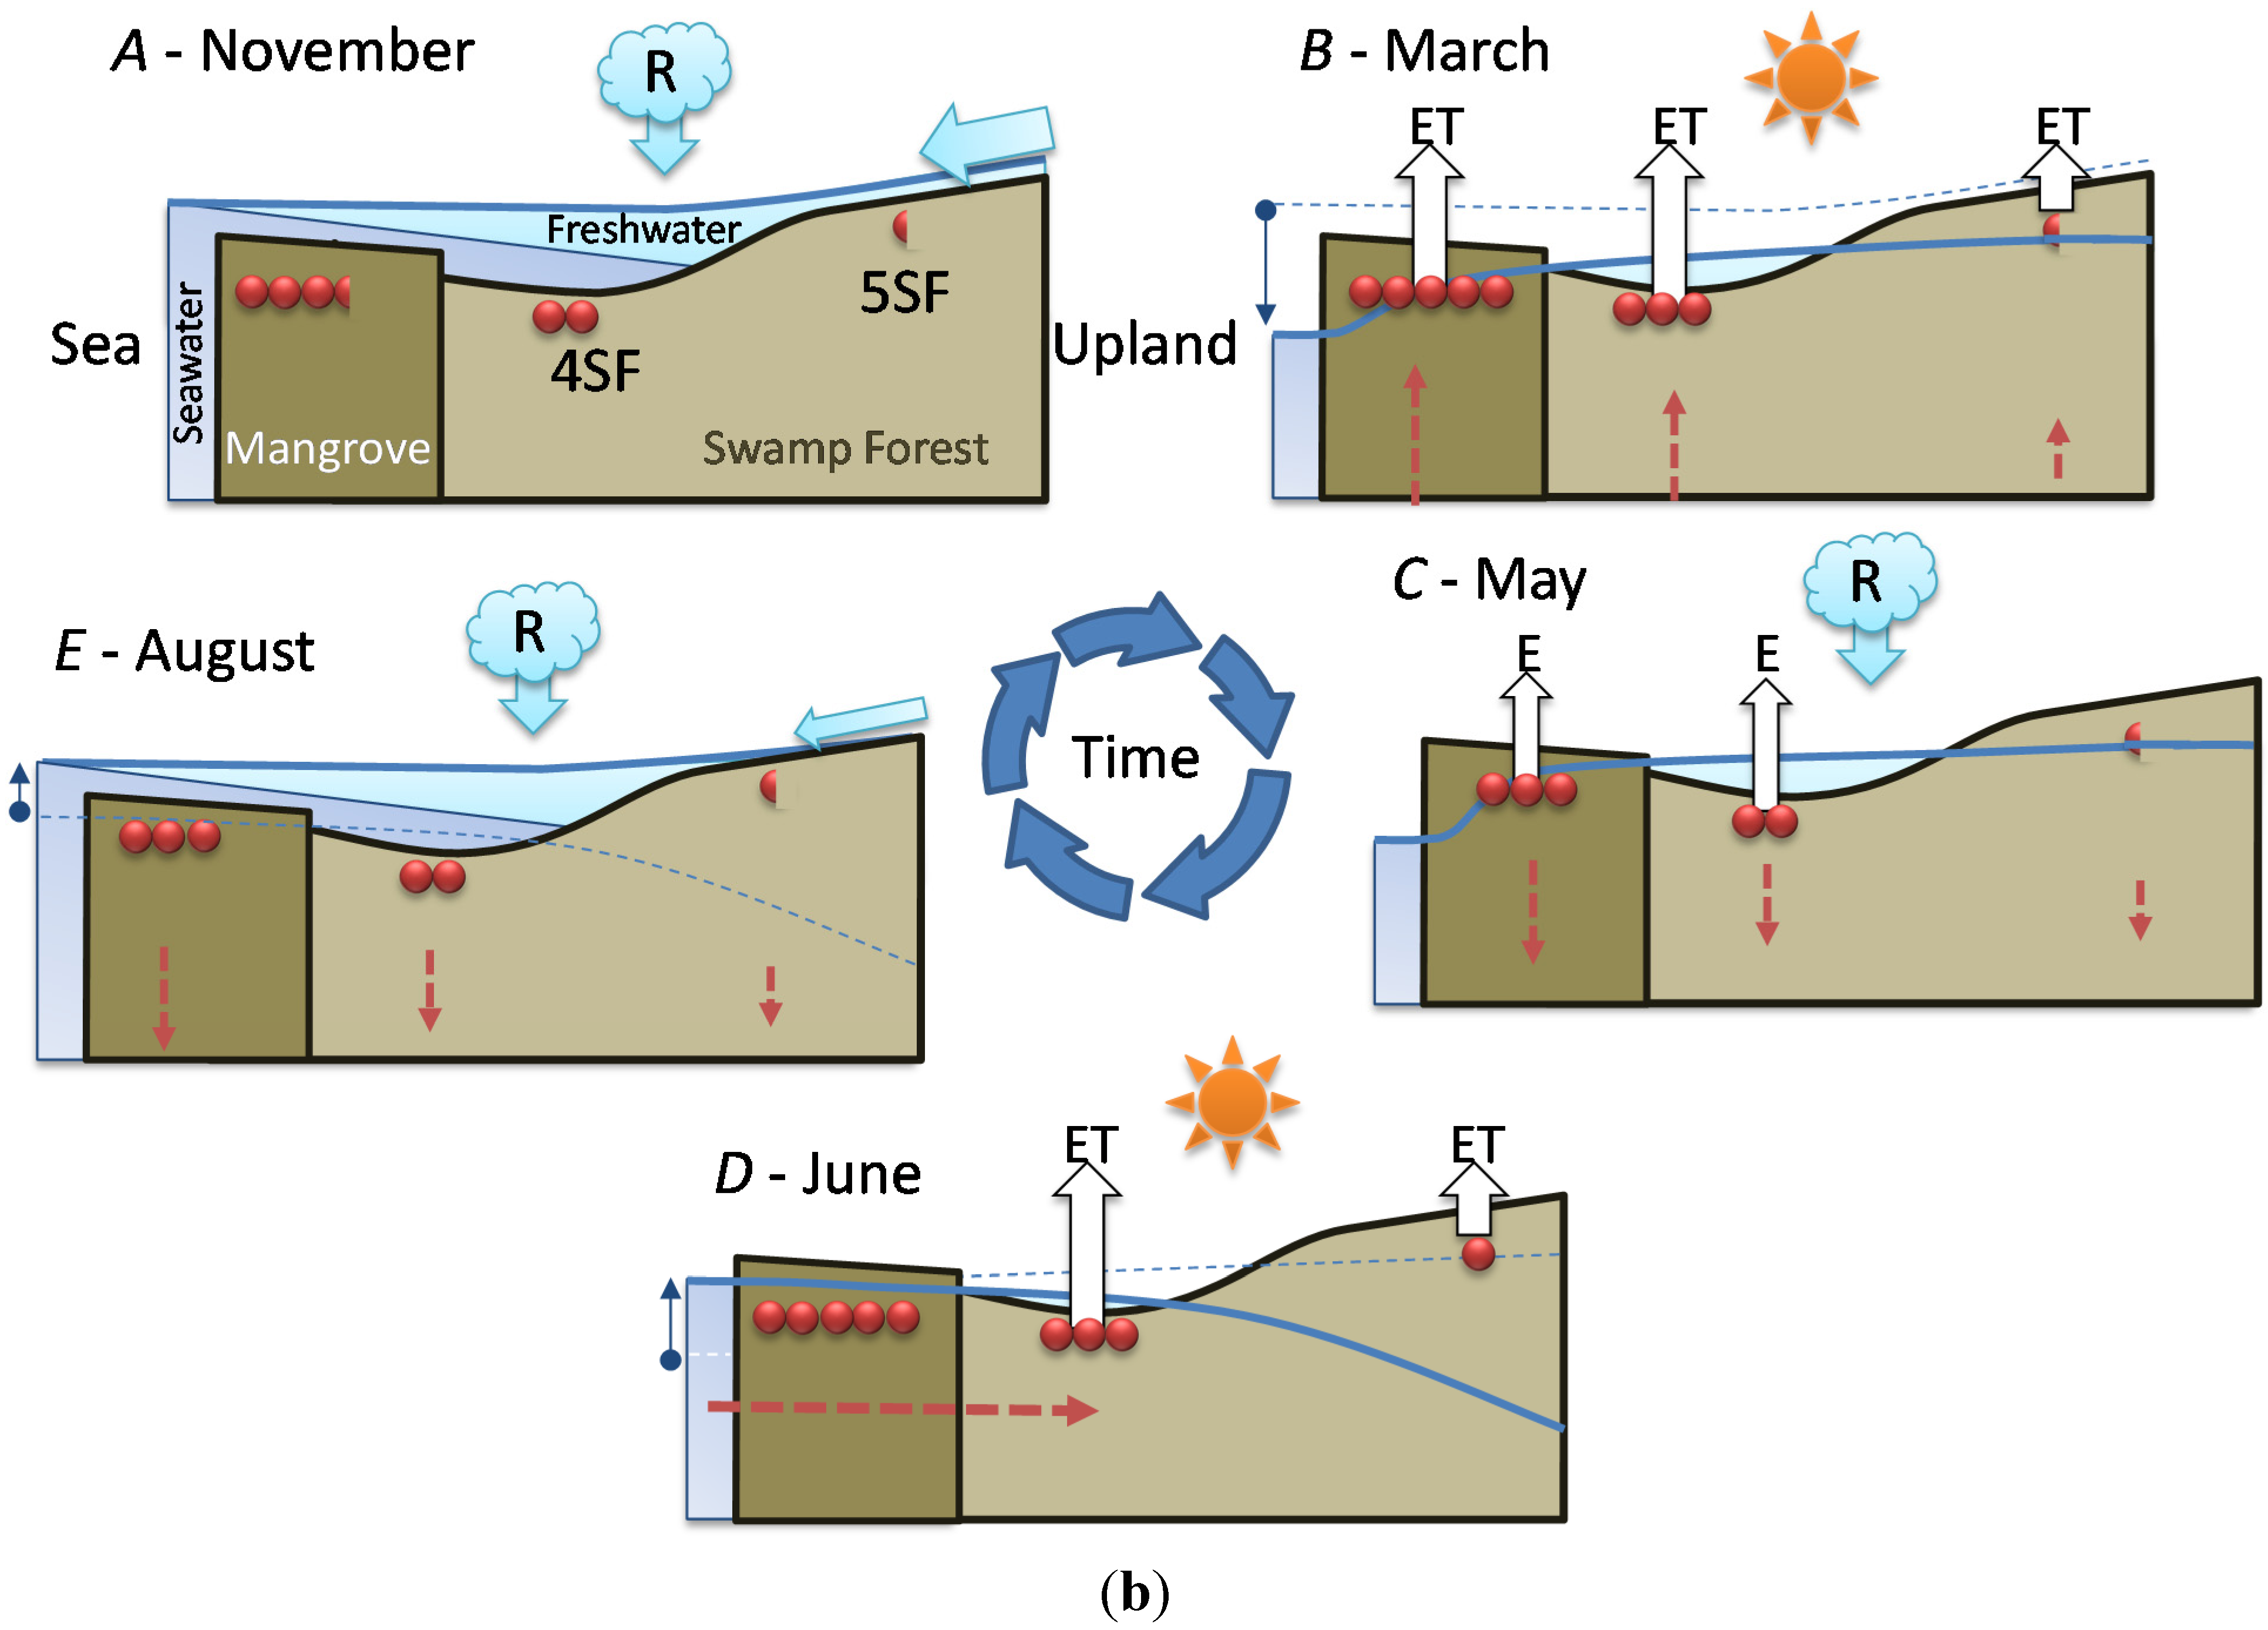
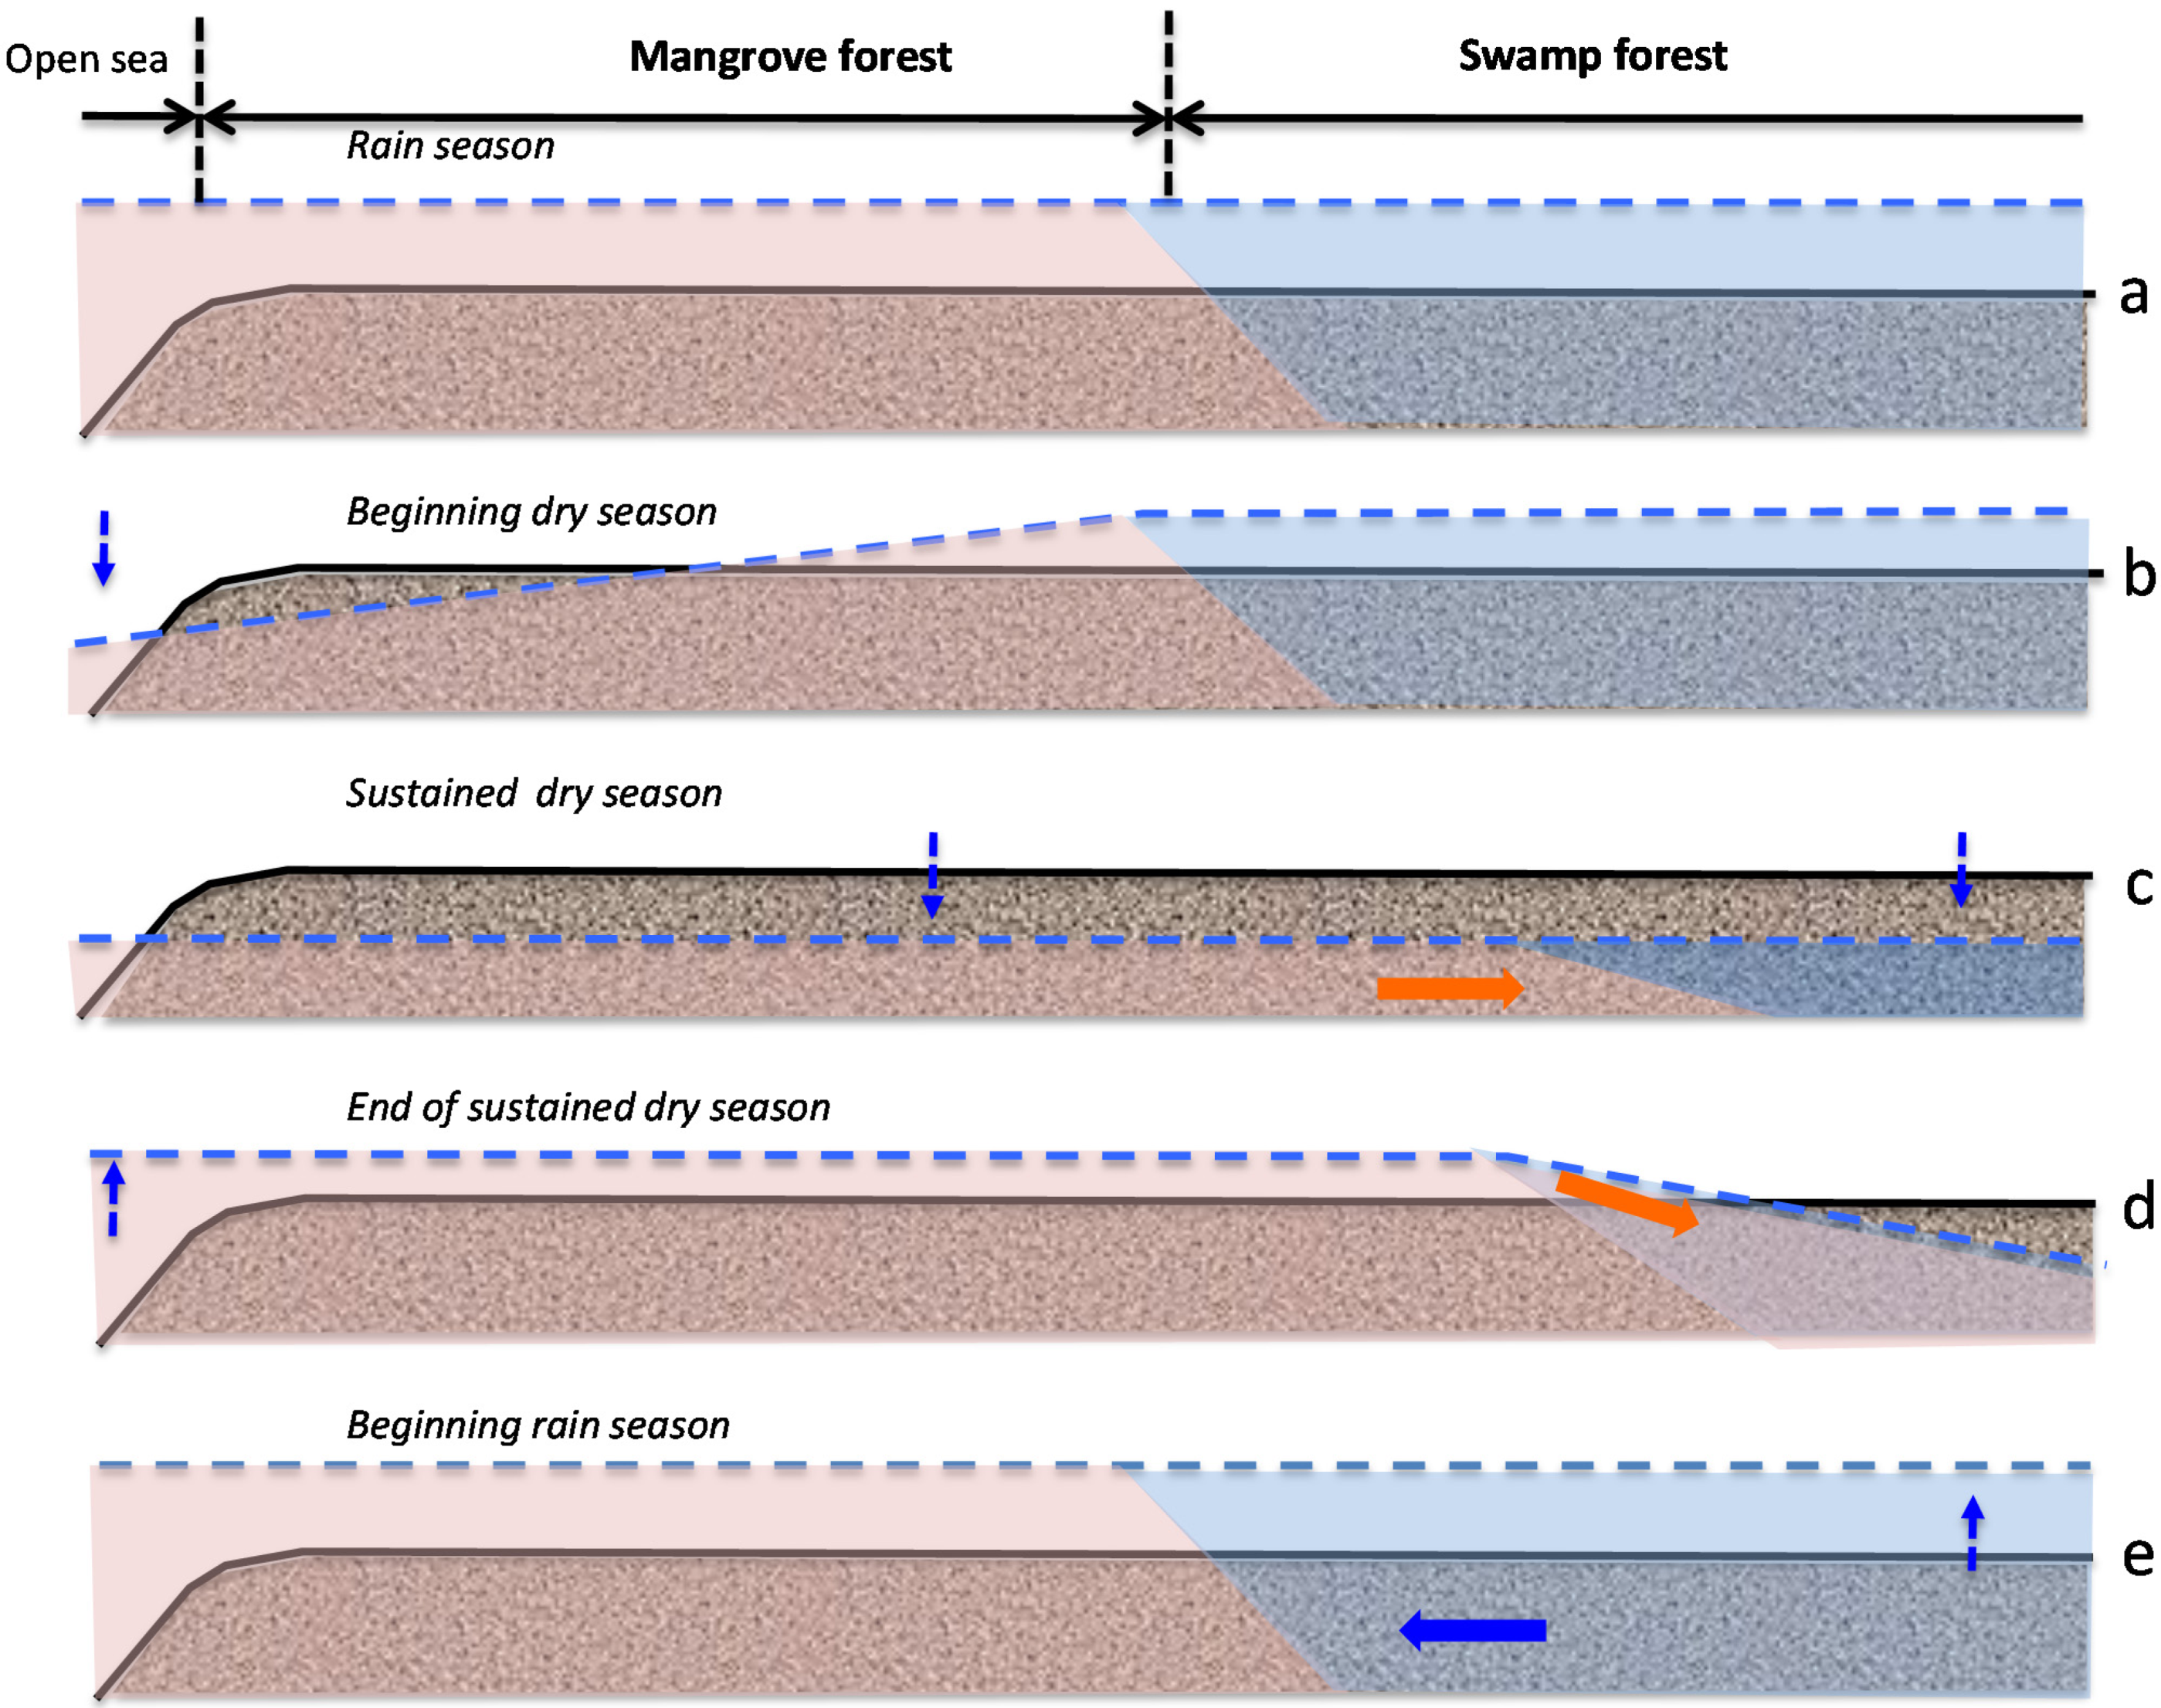
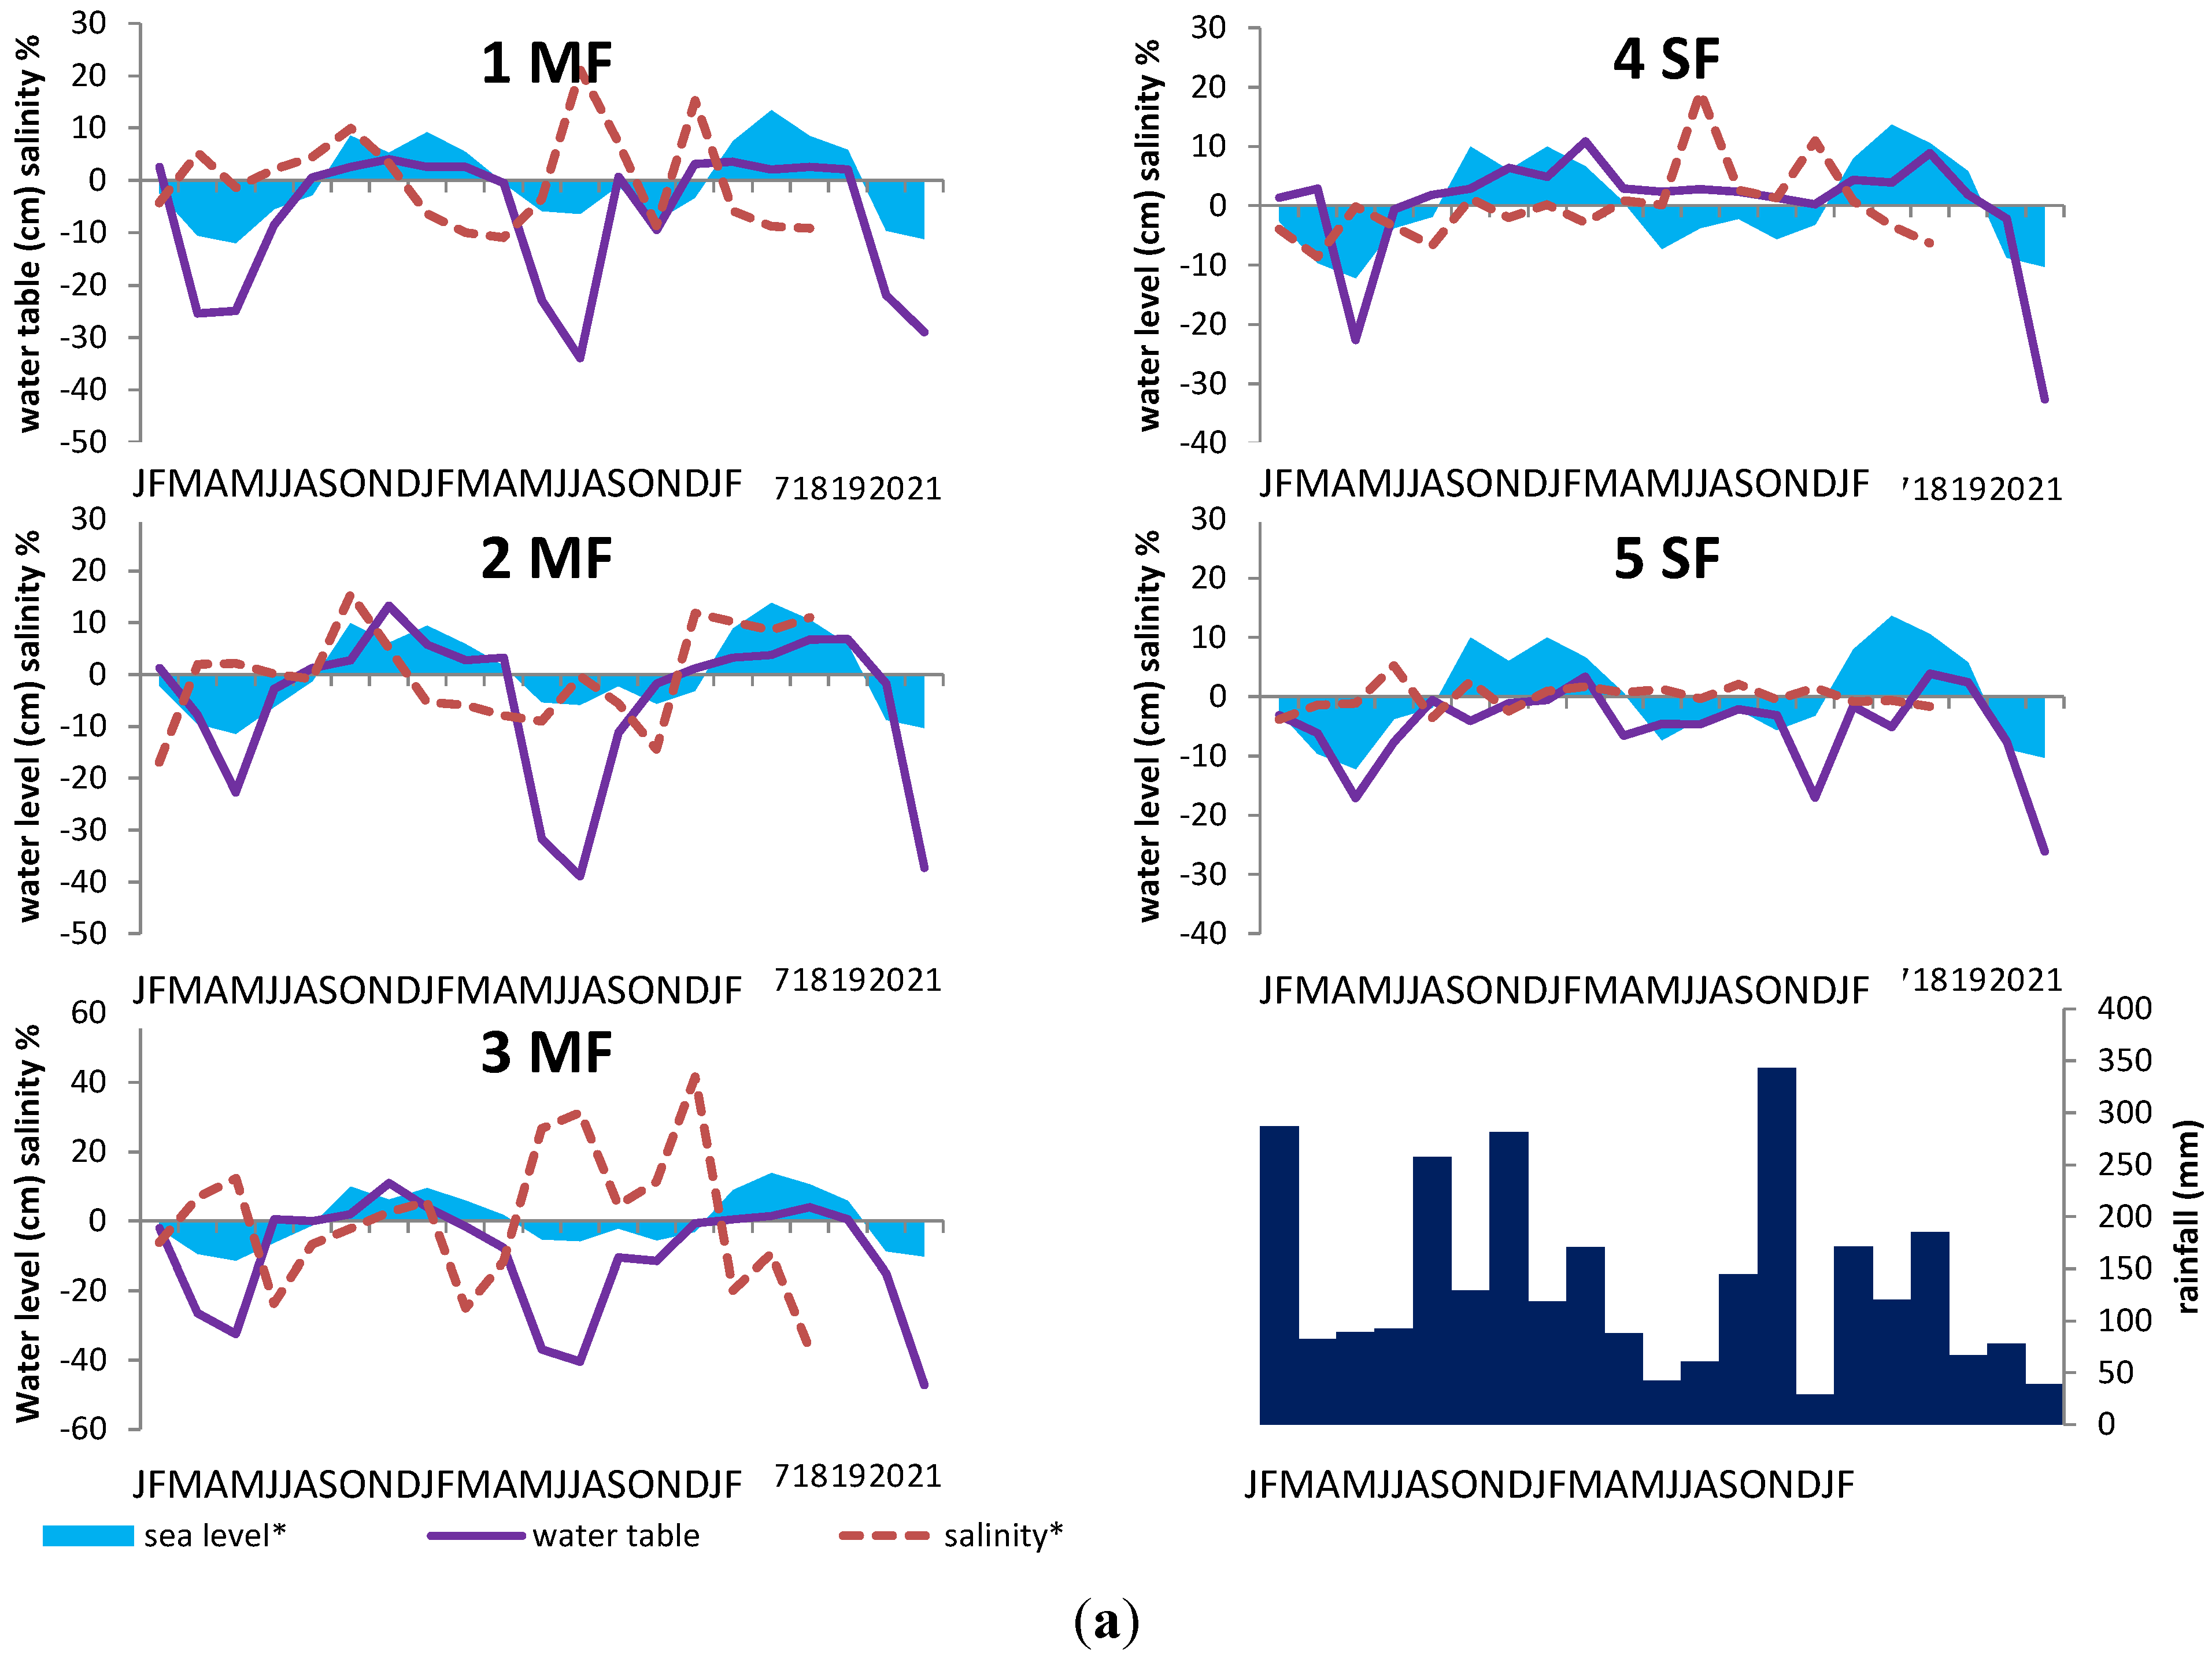
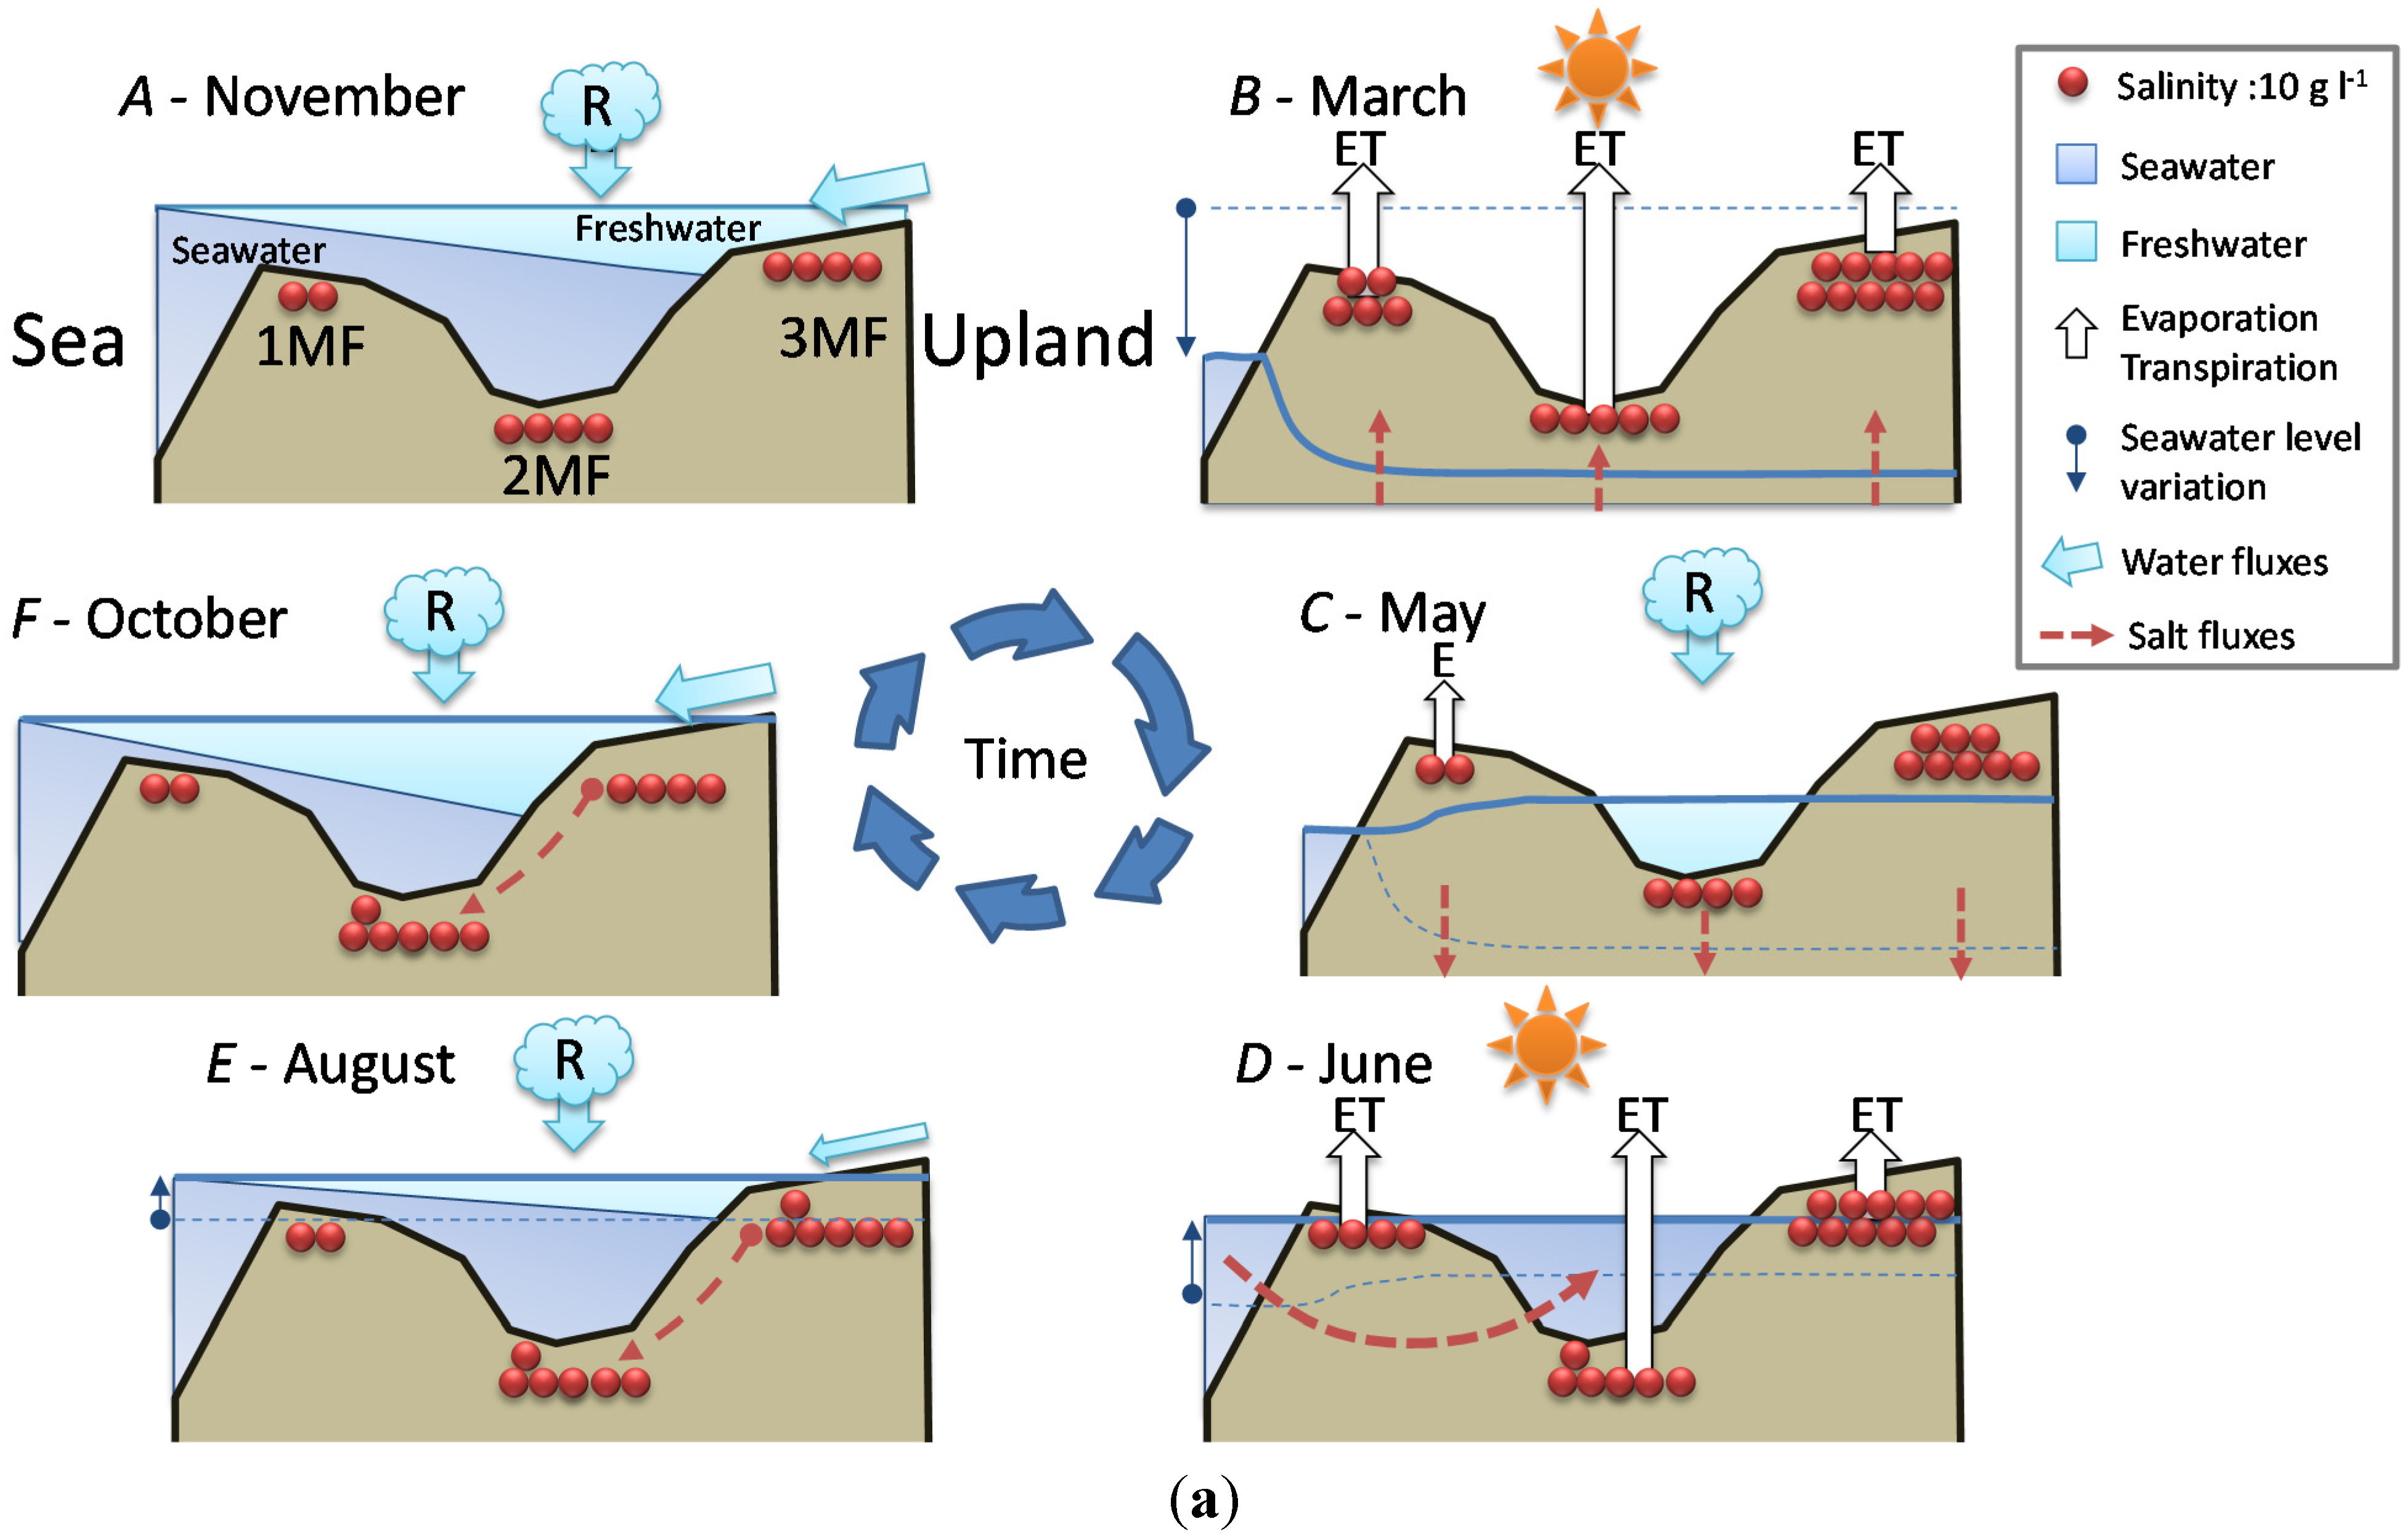
  • Stage A: during the rainy season (November 2011, Figure 5a), high mean sea level and heavy rainfall homogenize soil salinity in all mangrove sites with values close to that of seawater (35 g·L−1). High water levels cause seawater to merge landward with freshwater inflow coming from the watershed through the swamp forest. As a result, soil salinity at site 4SF (located nearby the mangrove/swamp forest ecotone) is moderately brackish, whereas it is almost fresh farther inside the swamp forest (site 5SF).
  • Stage B: during the dry season (March 2012), sea level and water level drop together during several months due to high atmospheric pressure and gravity forces, respectively. Concomitant evapotranspiration processes cause water level to fall even below sea level all over the mangrove forest and groundwater salinity to rise, up to the seaward edge of the swamp forest. At that time, despite lower rainfall amounts, the upland, fresh groundwater discharge is still sufficient to prevent saltwater intrusion inside the swamp forest (site 5SF).
  • Stage C: as the dry season is interrupted by a heavy rainfall episode (April and May 2012), the water level is rising again and salt deposits are re-dissolved. But the sea level still remains low.
  • Stage D: by the end of the dry season (June 2012), rainfall lowers again and evapotranspiration increases, causing soil salinity to rise everywhere. As atmospheric pressure lowers, sea level rises, and saltwater penetrates into the mangrove. This inflow of seawater takes the place of the (fresh) water losses by evapotranspiration, and increases salt concentration in the water table. Beyond the tidal area, the water table drops dramatically due to freshwater shortage, allowing in-depth, brackish groundwater intrusion inside the swamp forest.
  • Stage E: at the beginning of the next rainy season (August 2012), heavy rains wash out topsoil salt from higher elevation sites (1MF, 3MF) onto lower ones (2MF, sea fringe). Thus, soil salinity remains high at site 2MF, whereas water level rises everywhere, especially inside the swamp forest.
  • Stage F: in the middle of a rainy season (November 2011, October 2012), large amounts of freshwater flow through coastal wetlands and dilute mangrove groundwater.
Figure 5. Seasonal relationships between seawater level, rainfall, water level and salinity at the study sites. Red dots figure salt in the topsoil. Solid-line arrows figure freshwater fluxes: R for rainfall, ET for evapotranspiration, R for runoff. Doted arrows figure saltwater fluxes. (a) Mangrove forest sites (1MF, 2MF and 3MF); (b) Swamp forest sites (4SF and 5SF). In order to simplify the schema (b), mangrove sites are figured by a box named “Mangrove” with the salinity of 2MF.
Water 07 04108 g005aWater 07 04108 g005b

4. Discussion

In the Caribbean islands as anywhere else around the world, the zonal organization and floristic composition of coastal forested wetlands are mainly controlled by topography and salinity [9,20]. Despite the small range of variation of soil mean elevation across the study area (about 9 cm on average), soil conditions showed contrasted characteristics related to the different forest types. Seasonal salinity fluctuation resulted both from the balance between seawater and freshwater inputs and from the process of evapotranspiration (Figure 6). The microtidal regime prevailing all-over the Caribbean basin is associated to wide seasonal changes of the atmospheric pressure that cause an annual variation of mean sea level averaging 20 cm [21]. Such characteristics explain why mangrove sites may remain unflooded several weeks long, during the dry season (Figure 6c). As a result, soil salinity of these mangrove sites is less controlled by seawater motion or rainfall than by evaporation processes that cause large freshwater losses and salt concentration especially during the low sea-level and dry season. Therefore, our model combining rainfall amounts and sea level failed to predict accurately topsoil salinity. Other variables such as real evapotranspiration or site history should have been taken into account. Increasing freshwater budget imbalance (i.e., low rainfall/evapotranspiration ratio) may cause tree death and mangrove decline from dwarf forest stands to hypersaline lagoons and salt flats [22,23,24]. Surprisingly, the isotopic measurements undertaken at the mid and end of the dry season, and latter before the heavy rainfall of the wet season, revealed low evaporation process which took place mostly in the 1MF site, and to a lesser extend to 3MF site. The freshwater pool storage in the swamp forest and/or the evapotranspirated vapor from the forest system could buffer the salty-dryness pressure to the nearby mangrove forest. Conversely, during the rainy season (and especially during strong tropical depression events), low atmospheric pressure causes mean sea level to rise while seawater flows far inland and lowers soil salinity (Figure 6d). This hydrological functioning differs strongly from that of other tropical coastal wetlands like mangroves in French Guyana, where the high tidal range (1.5 to 3.5 m) is the major hydrodynamic process [25,26].
Figure 6. Idealized seasonal variations of the water table (dotted lines and dotted arrows) along a mangrove/swamp forest transect in the coastal plain of a Caribbean island. Solid arrows figure lateral mass flow: inland intrusion of seawater (pink) and freshwater recharge (blue). Stages c and d occur only during severe and/or delayed dry seasons.
Water 07 04108 g006
As halophyte plants, mangrove trees have adapted to saltwater by means of various physiological mechanisms [27]. Medina et al. [28] and Dulormne et al. [29] have shown that P. officinalis itself is able to exclude salt not only at the root level but also at leaf level, in the woody rachis. Such mechanisms are especially vital for these species during the dry season as salinity increases dramatically. Leaf renewal and cambial growth restarting occur at the onset of the rainy season and later, in West Indian forested wetlands [21,30,31,32]. Due to their superficial root system, these coastal wetland tree species are able to benefit from seasonal freshwater inputs [33,34] and from the subsequent lower salinity in the upper part of the soil [26,35].
In pre-Columbian times, coastal plains of most Caribbean islands hosted large P. officinalis swamp forests next to mangrove areas [31,36]. Although P. officinalis can be dominant in real freshwater upland swamps [37], most of the remaining forested areas are found on brackish coastal areas. This species is known to cope with seasonal topsoil salinity as high as 25 g·L−1 [38,39]. The annual mean salinity of 21 g·L−1 measured at our study site 4SF (at the mangrove/swamp forest ecotone) encompasses seasonal variations ranging from 10 to 40 g·L−1 which suggests periodic intrusion of seawater. Imbert & Migeot [32] described such an event that occurred in 2007, at the end of a severe dry season: a sudden drop of the atmospheric pressure caused seawater to flow far inside the tidal zone, until the swamp forest where the water table was still 45 cm below ground level [40]. Such a time-lag between seasonal mean sea-level rise and freshwater recharge of the water table seems associated to sustained or delayed dry seasons, when the annual variations of rainfall and atmospheric pressure are out of phase. The resulting tip-up movement of the water table between the beginning and the end of such dry seasons is centered on the mangrove/swamp forest ecotone (Figure 6b,d). This phenomenon may occur more frequently in the near future as the climate of the Caribbean islands is expected to become dryer according to the projections of current climate change models [41]. This may result in an increase of soil salinity at the mangrove/swamp forest ecotone and cause landward migration of the mangrove forest at the expense of the swamp forest.

5. Conclusions

The micro-tidal regime prevailing in the Caribbean basin associated to the seasonal variation of rainfall and atmospheric pressure explain why mangrove forests remain unflooded several weeks long, during the dry season. Intense evapotranspiration induces a groundwater level lower than the sea level and the high salts accumulation in this season. Conversely, at the beginning of the rainy season low atmospheric pressure causes mean sea level to rise while seawater flows far inland, and reduces the desalination effect of rainfall. These particular hydrological conditions enhance the development of different species assemblages from the sea shore toward upland areas. The present study highlights the main hydrological processes that occur in such coastal forested wetlands and explains how the marine and upland water pools interact. Combining rainfall amounts and sea level gives way to a comprehensive model of water level variation among the mangrove-swamp forest continuum, whereas topsoil salinity was more difficult to predict.
The isotopic measurements obtained during the sampling period, show that there was almost no evaporation processes except in the first vegetation belt (1MF). These Rhizophora trees are located on peat, with high hydraulic conductivity which can enhance the evaporation process. On the contrary, the Avicennia trees located on a clay soil, with a similar tree cover (40% light transmitted to the soil) present much lower soil water evaporation. From additional measurements on xylem sap (data not shown), it seems that these trees are able to switch to different water pools to avoid extreme salty conditions and can also use desalinized surface freshwater during heavy rain.
The Pterocarpus swamp forest ecosystem acts as an important fresh water pool that contributes to buffer water level and to reduce the impact of the dry season on the nearby mangrove forest. However, the fate of this endangered Caribbean ecosystem is uncertain as the forecasted climate change for the region, i.e., more intense storms, increasing elevation of the sea level and lower annual rainfall amounts, will accentuate salinity pressure onto freshwater coastal wetlands.

Acknowledgments

This study was in part financially supported by the Total Foundation.

Author Contributions

This work is part of F. Bompy PhD thesis results. D. Imbert and M. Dulormne were the two thesis supervisors, and have designed this study. L. Lambs has brought the isotope technique and has initiated the writing of this paper. D. Corenblit has reviewed this paper and presented this work on the EGU2013 congress in Wien.

Conflicts of Interest
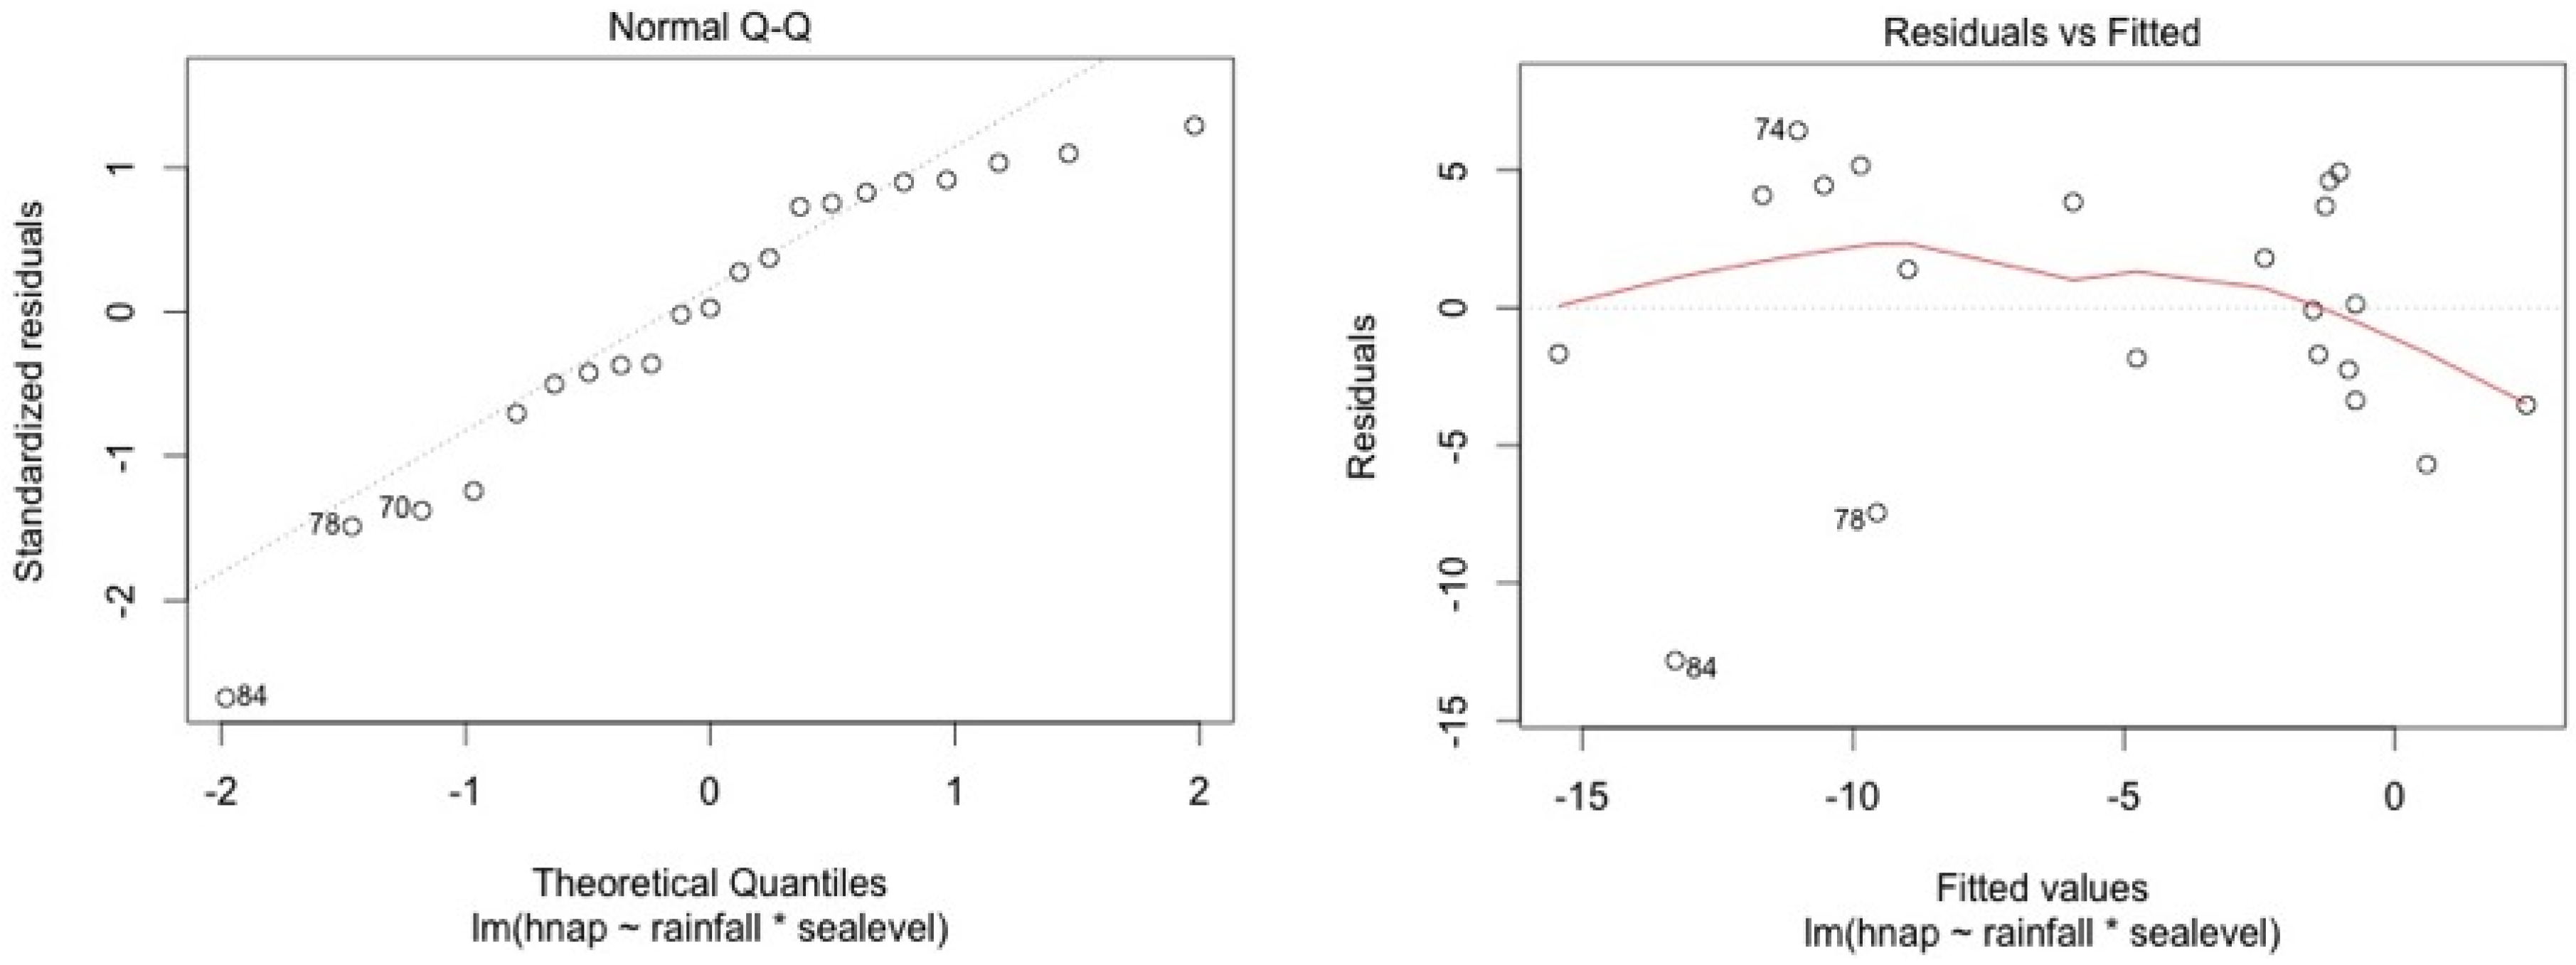
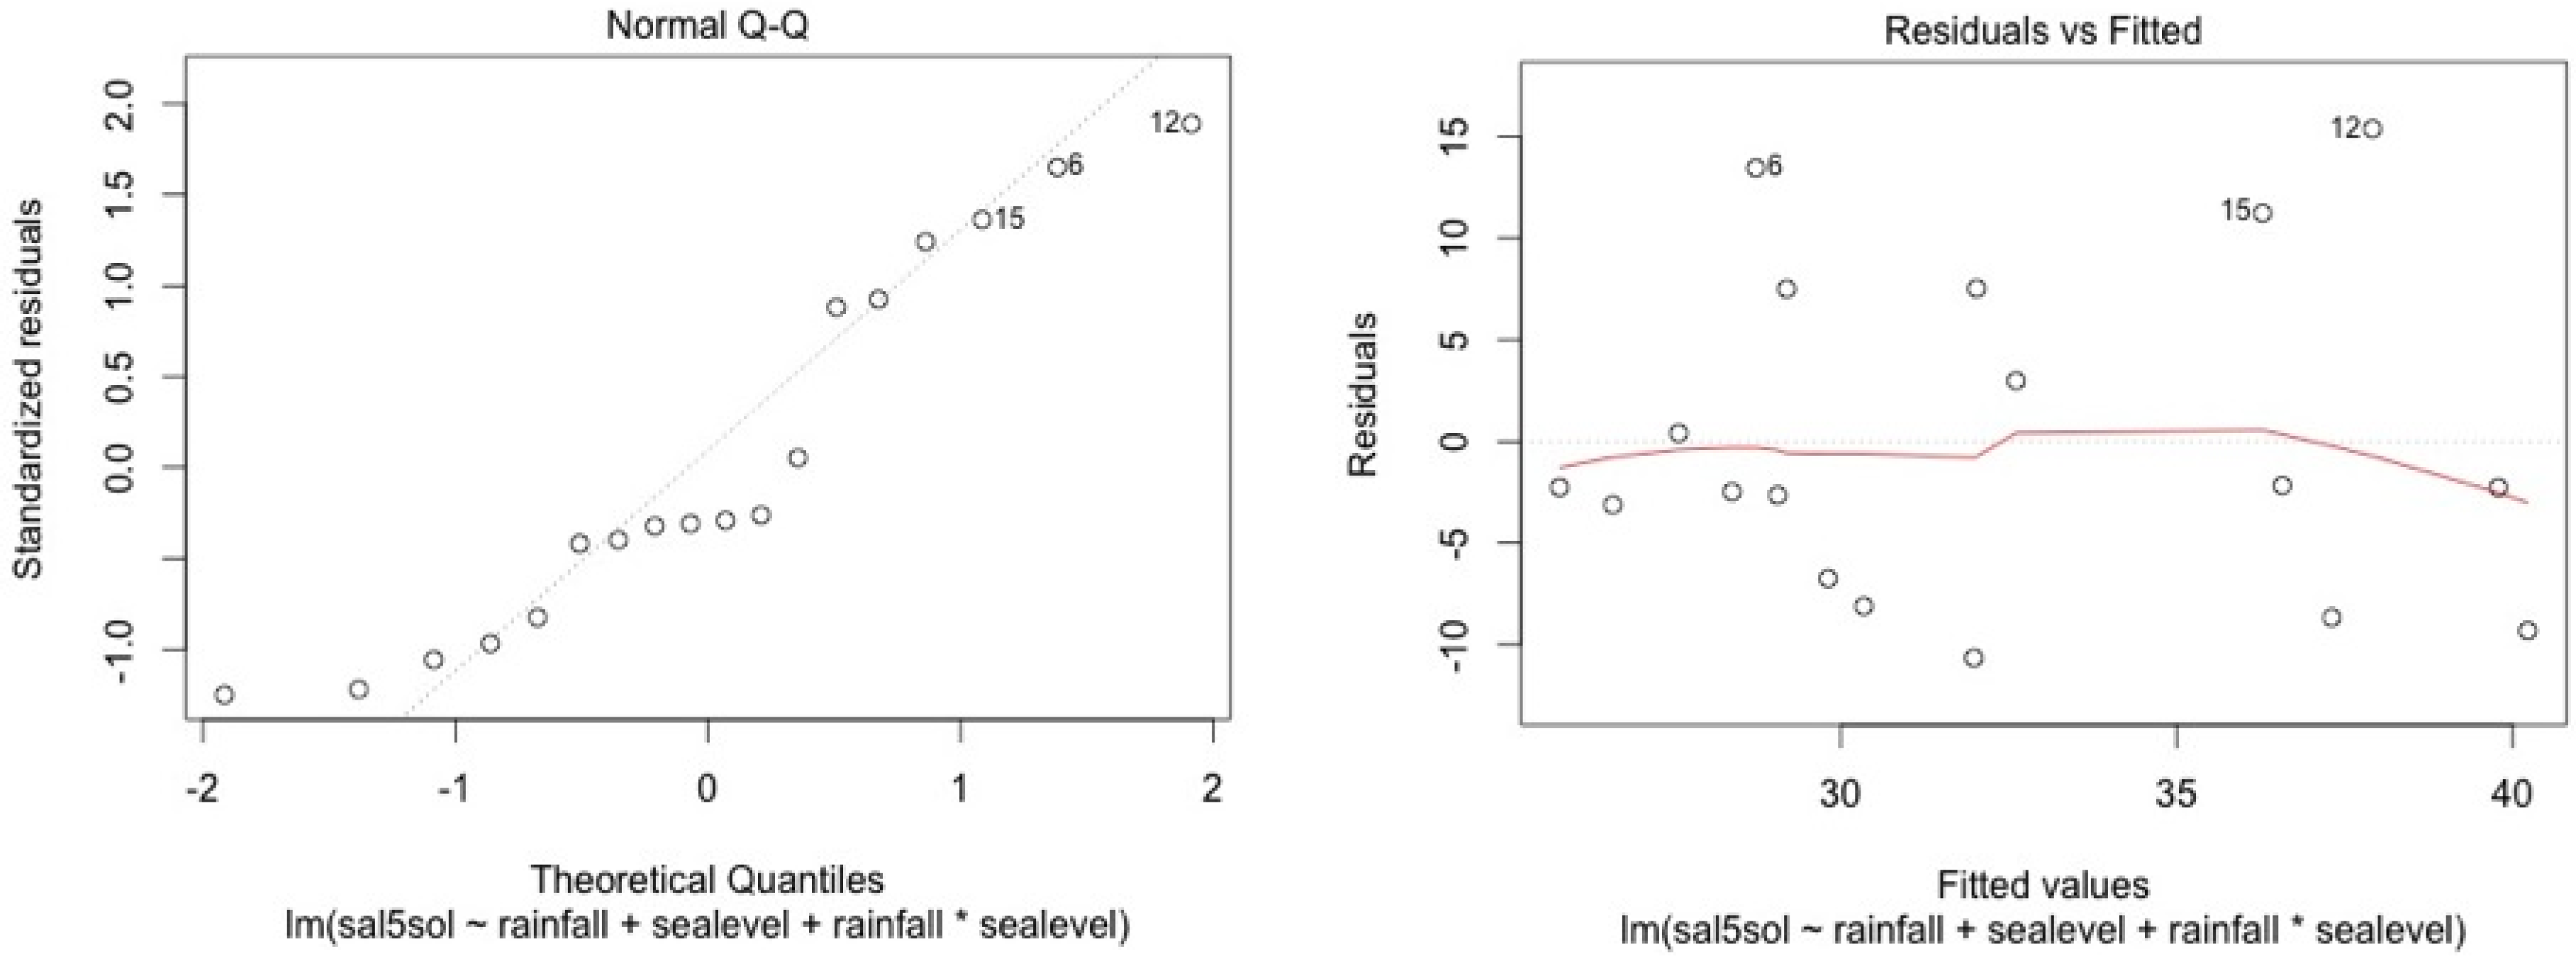
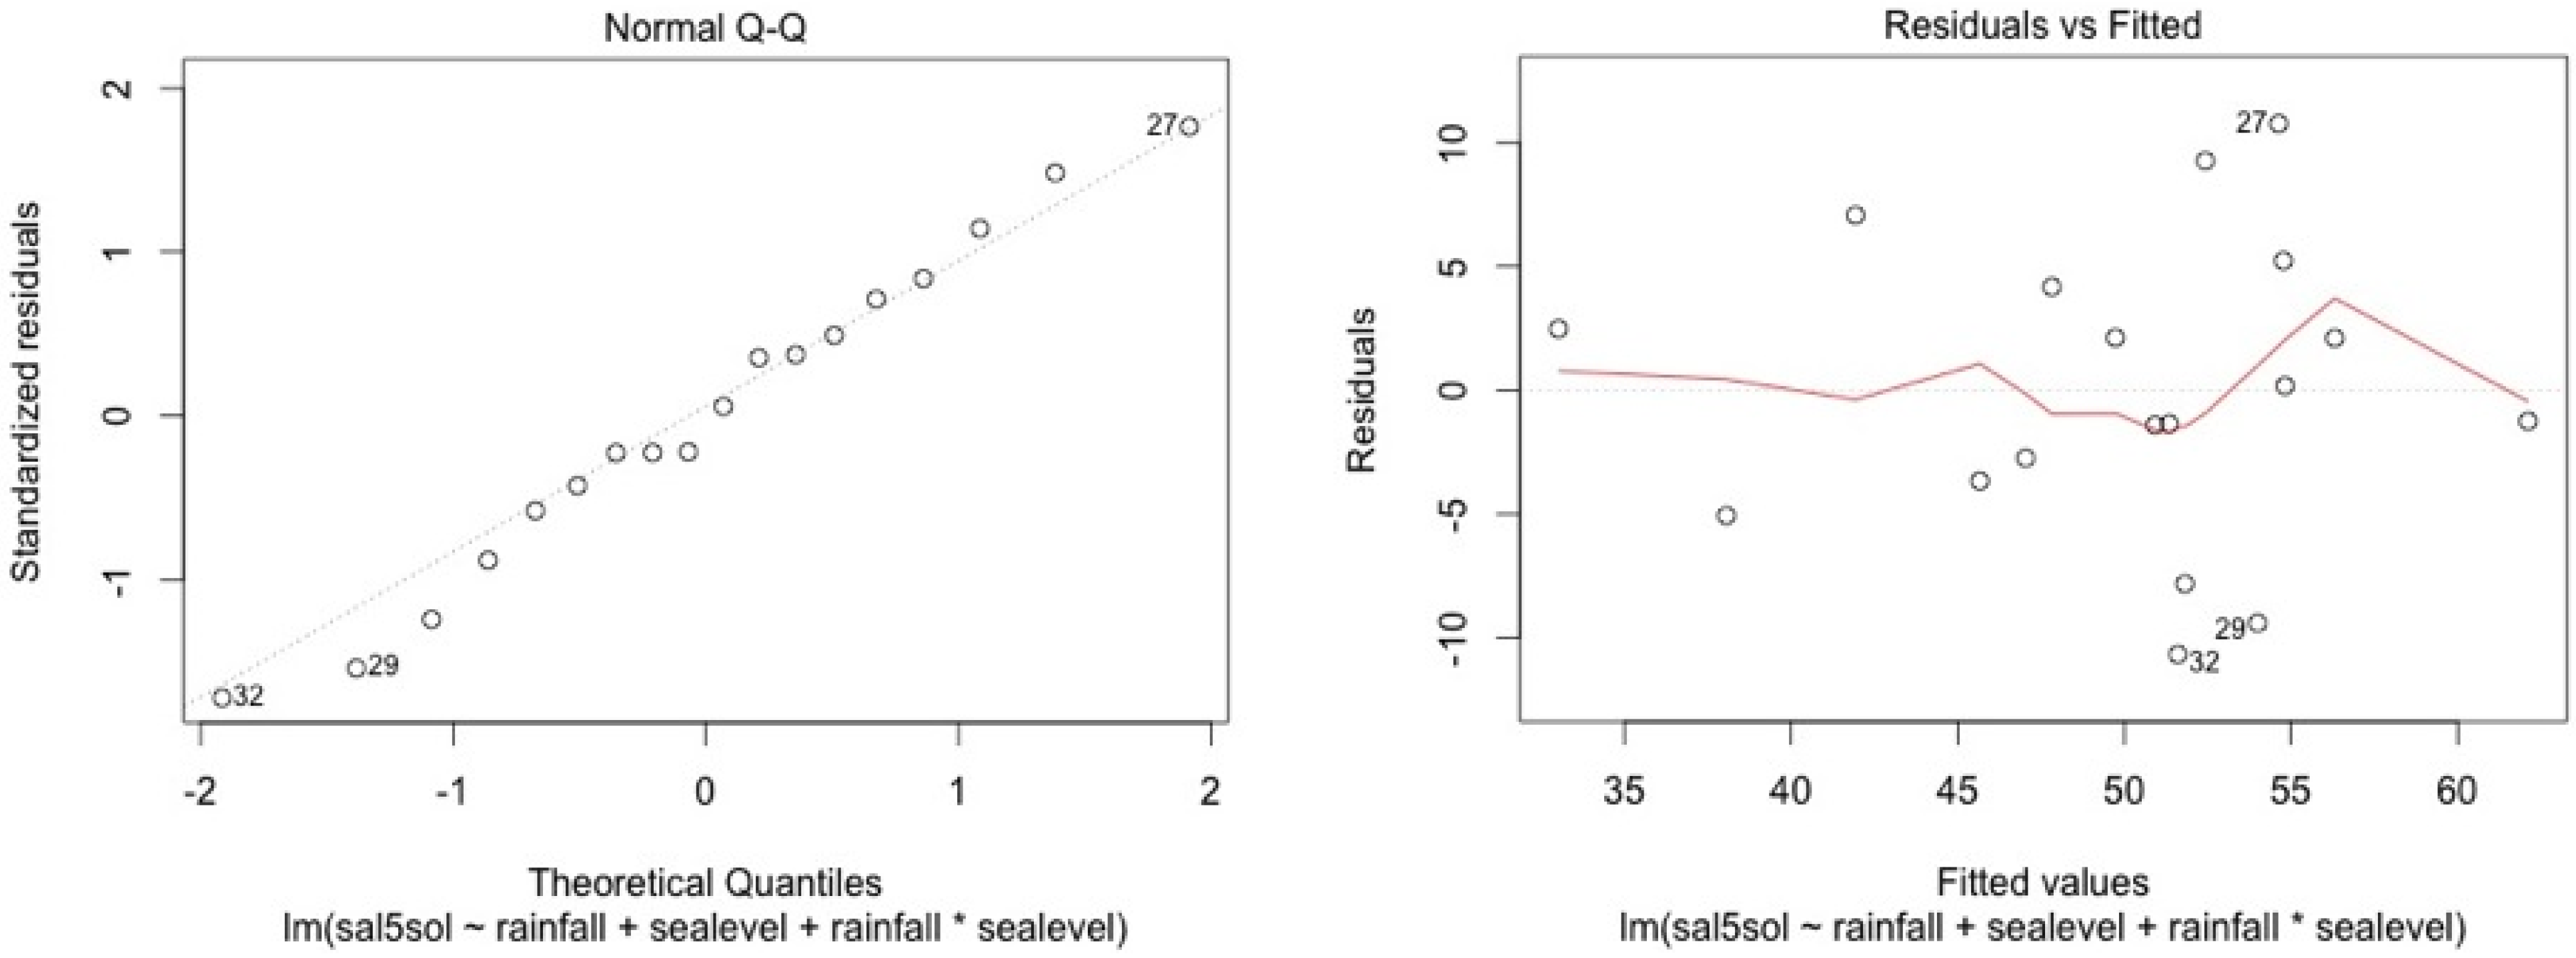
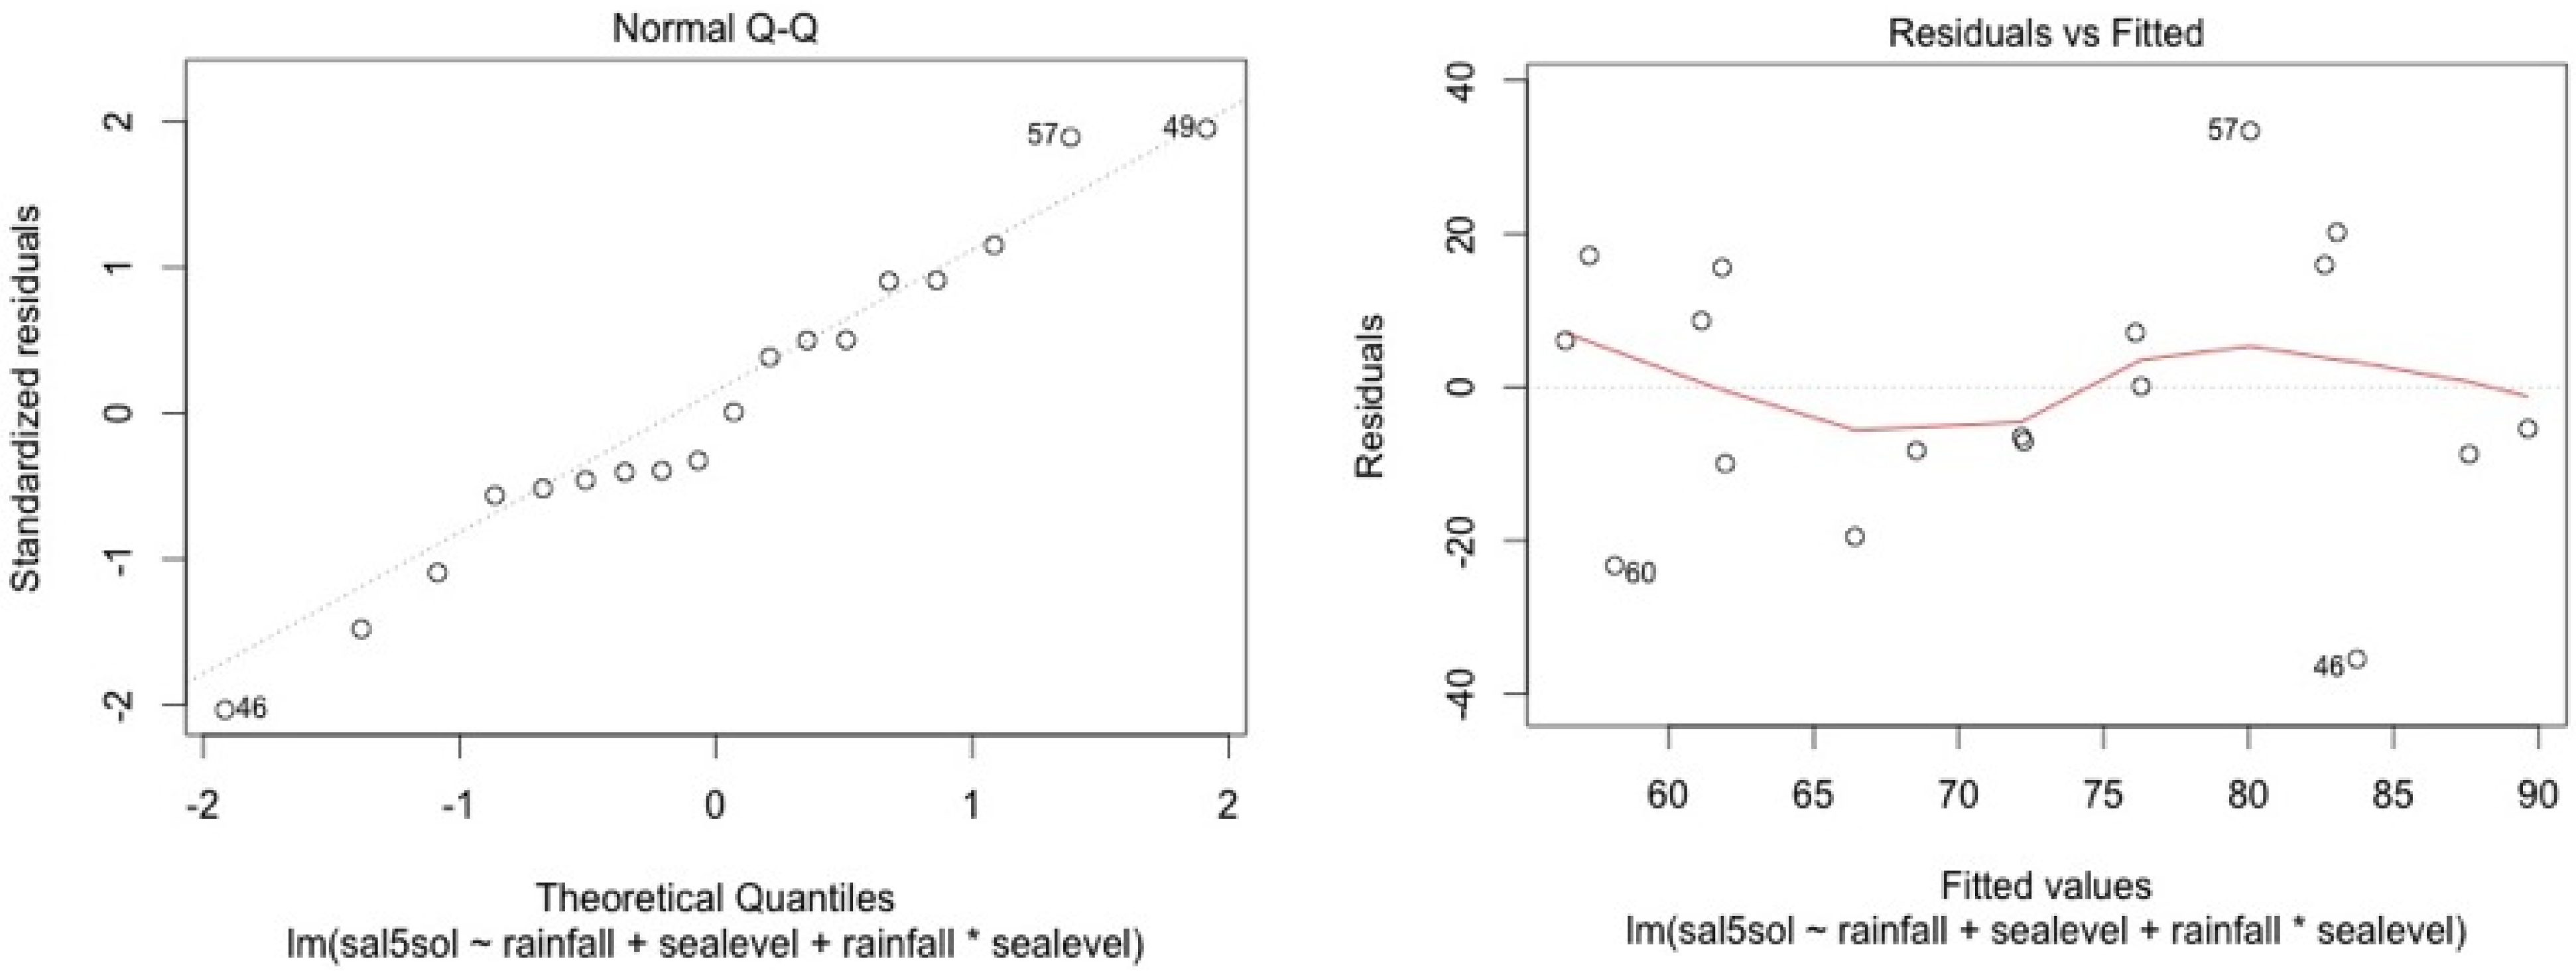
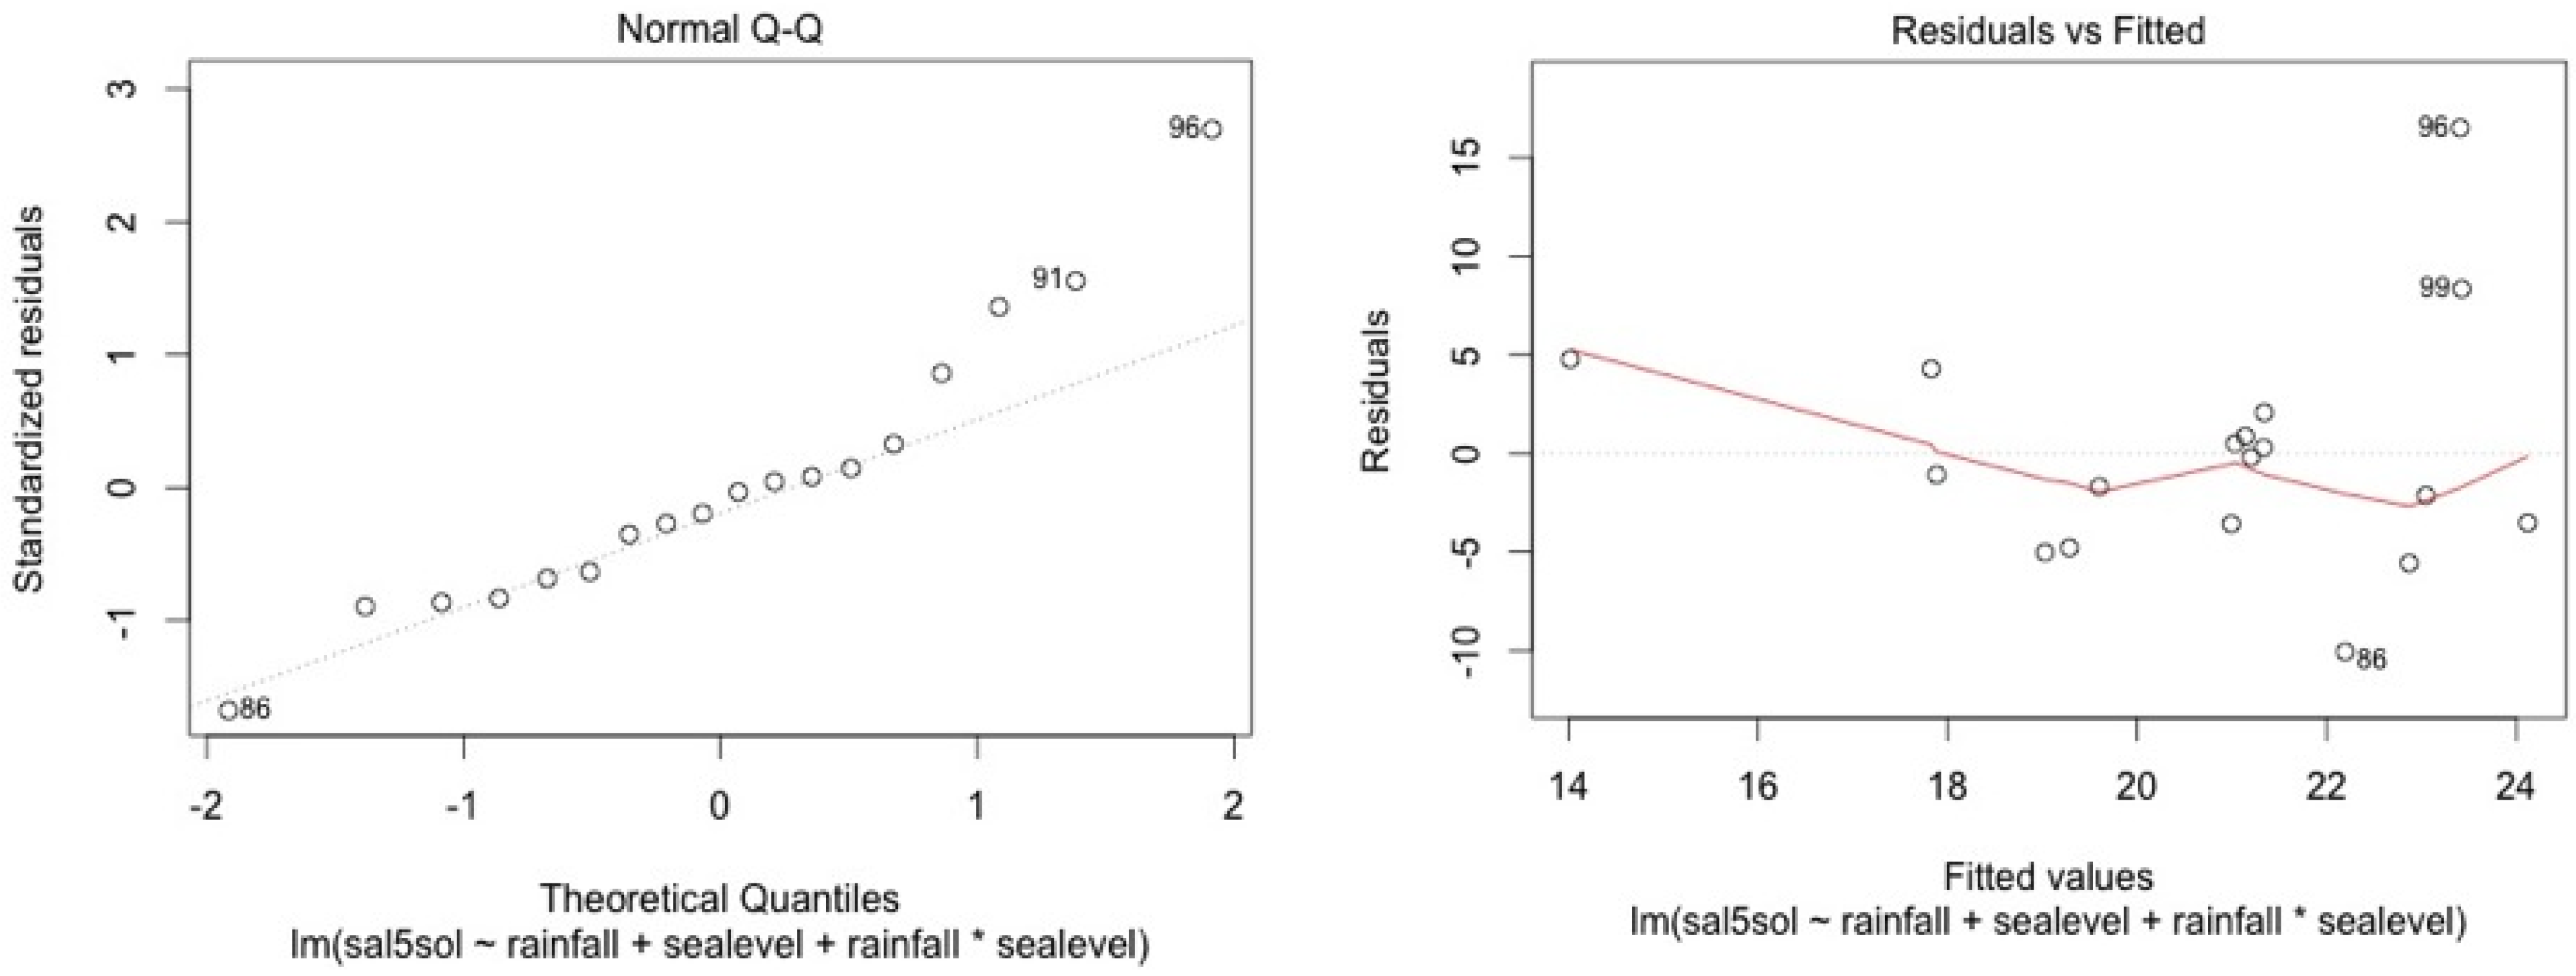
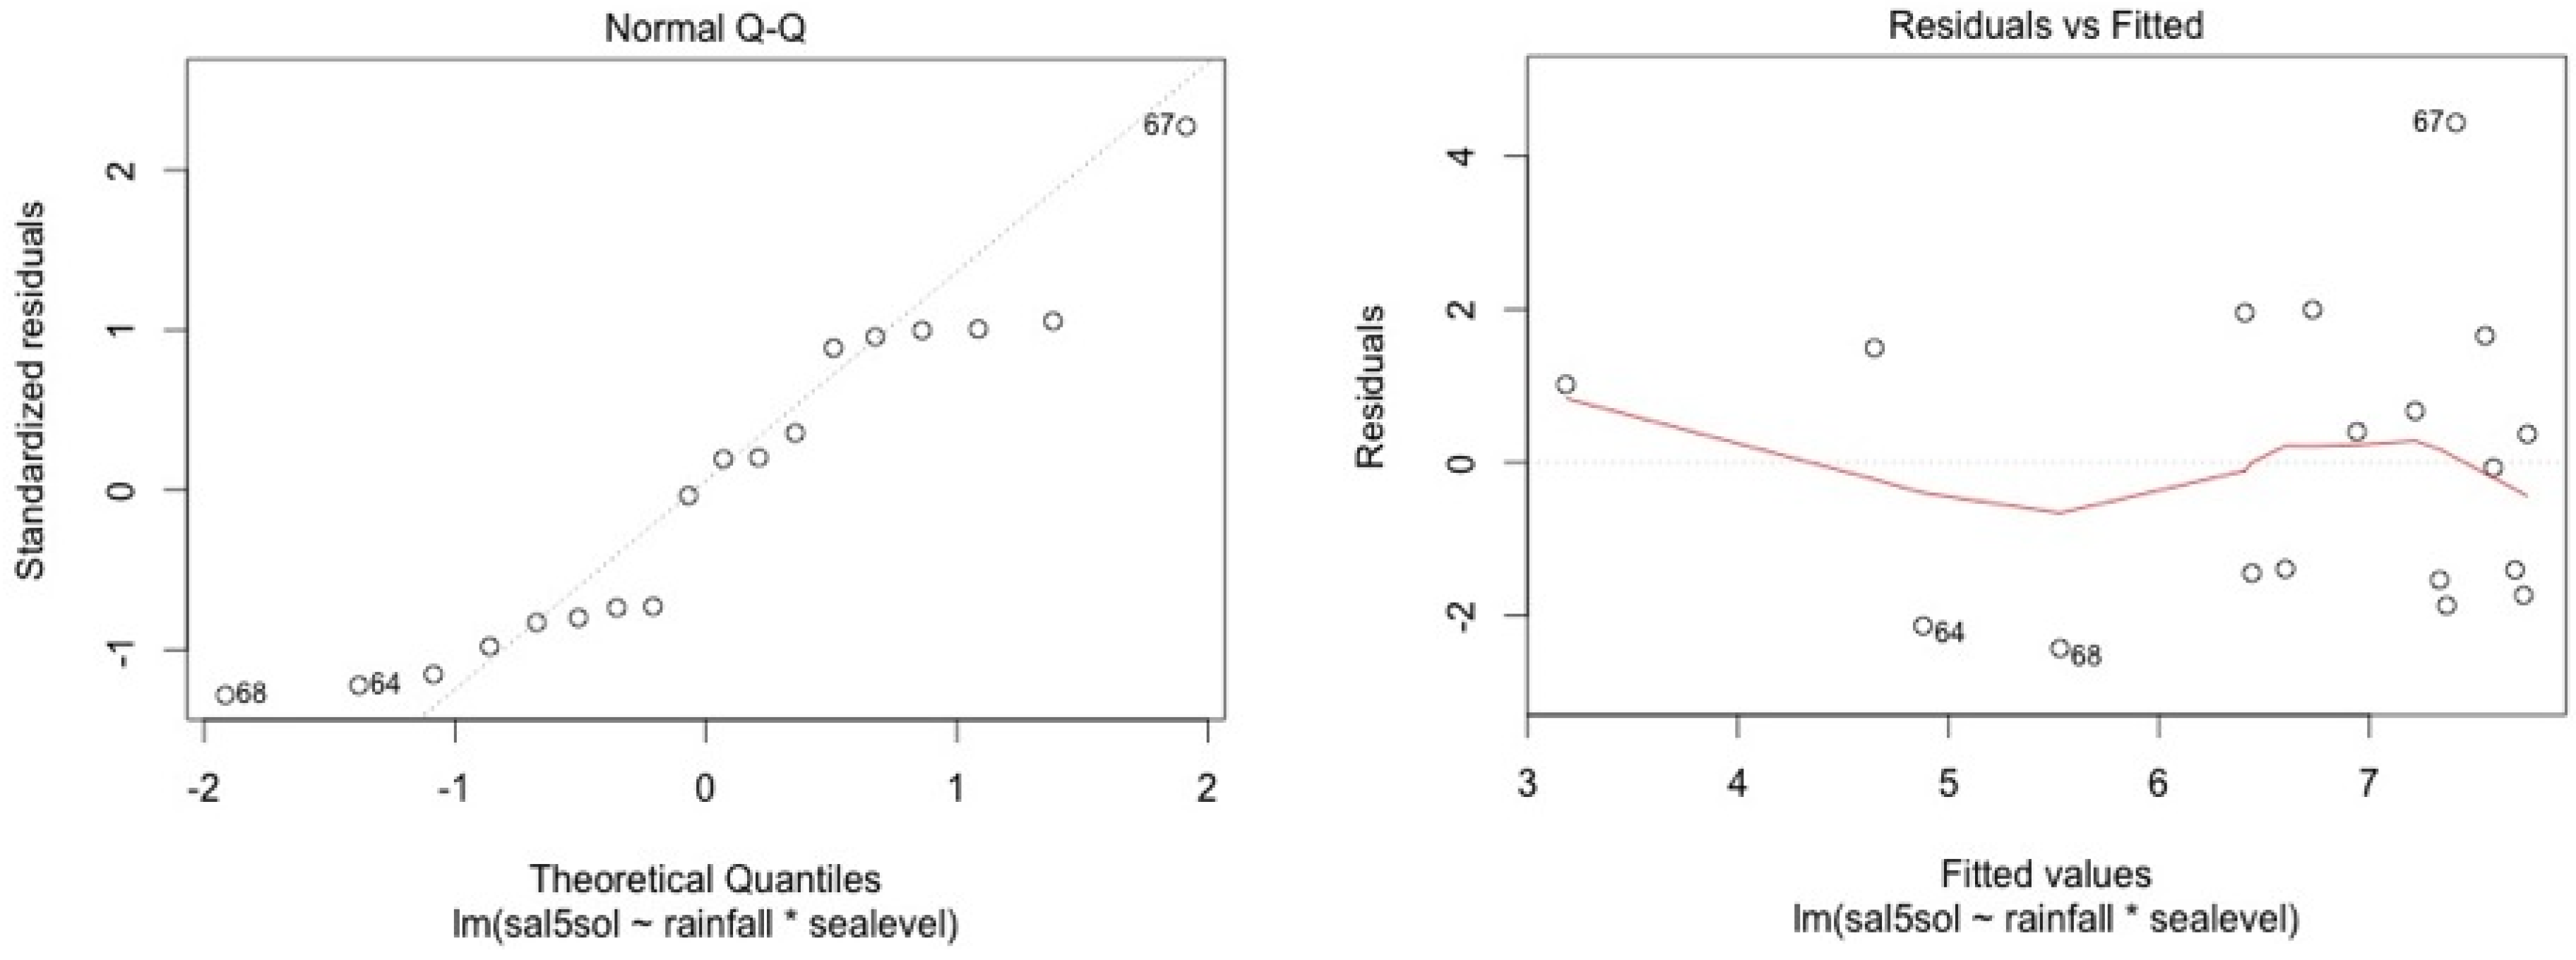
The authors declare no conflict of interest.

Appendix A

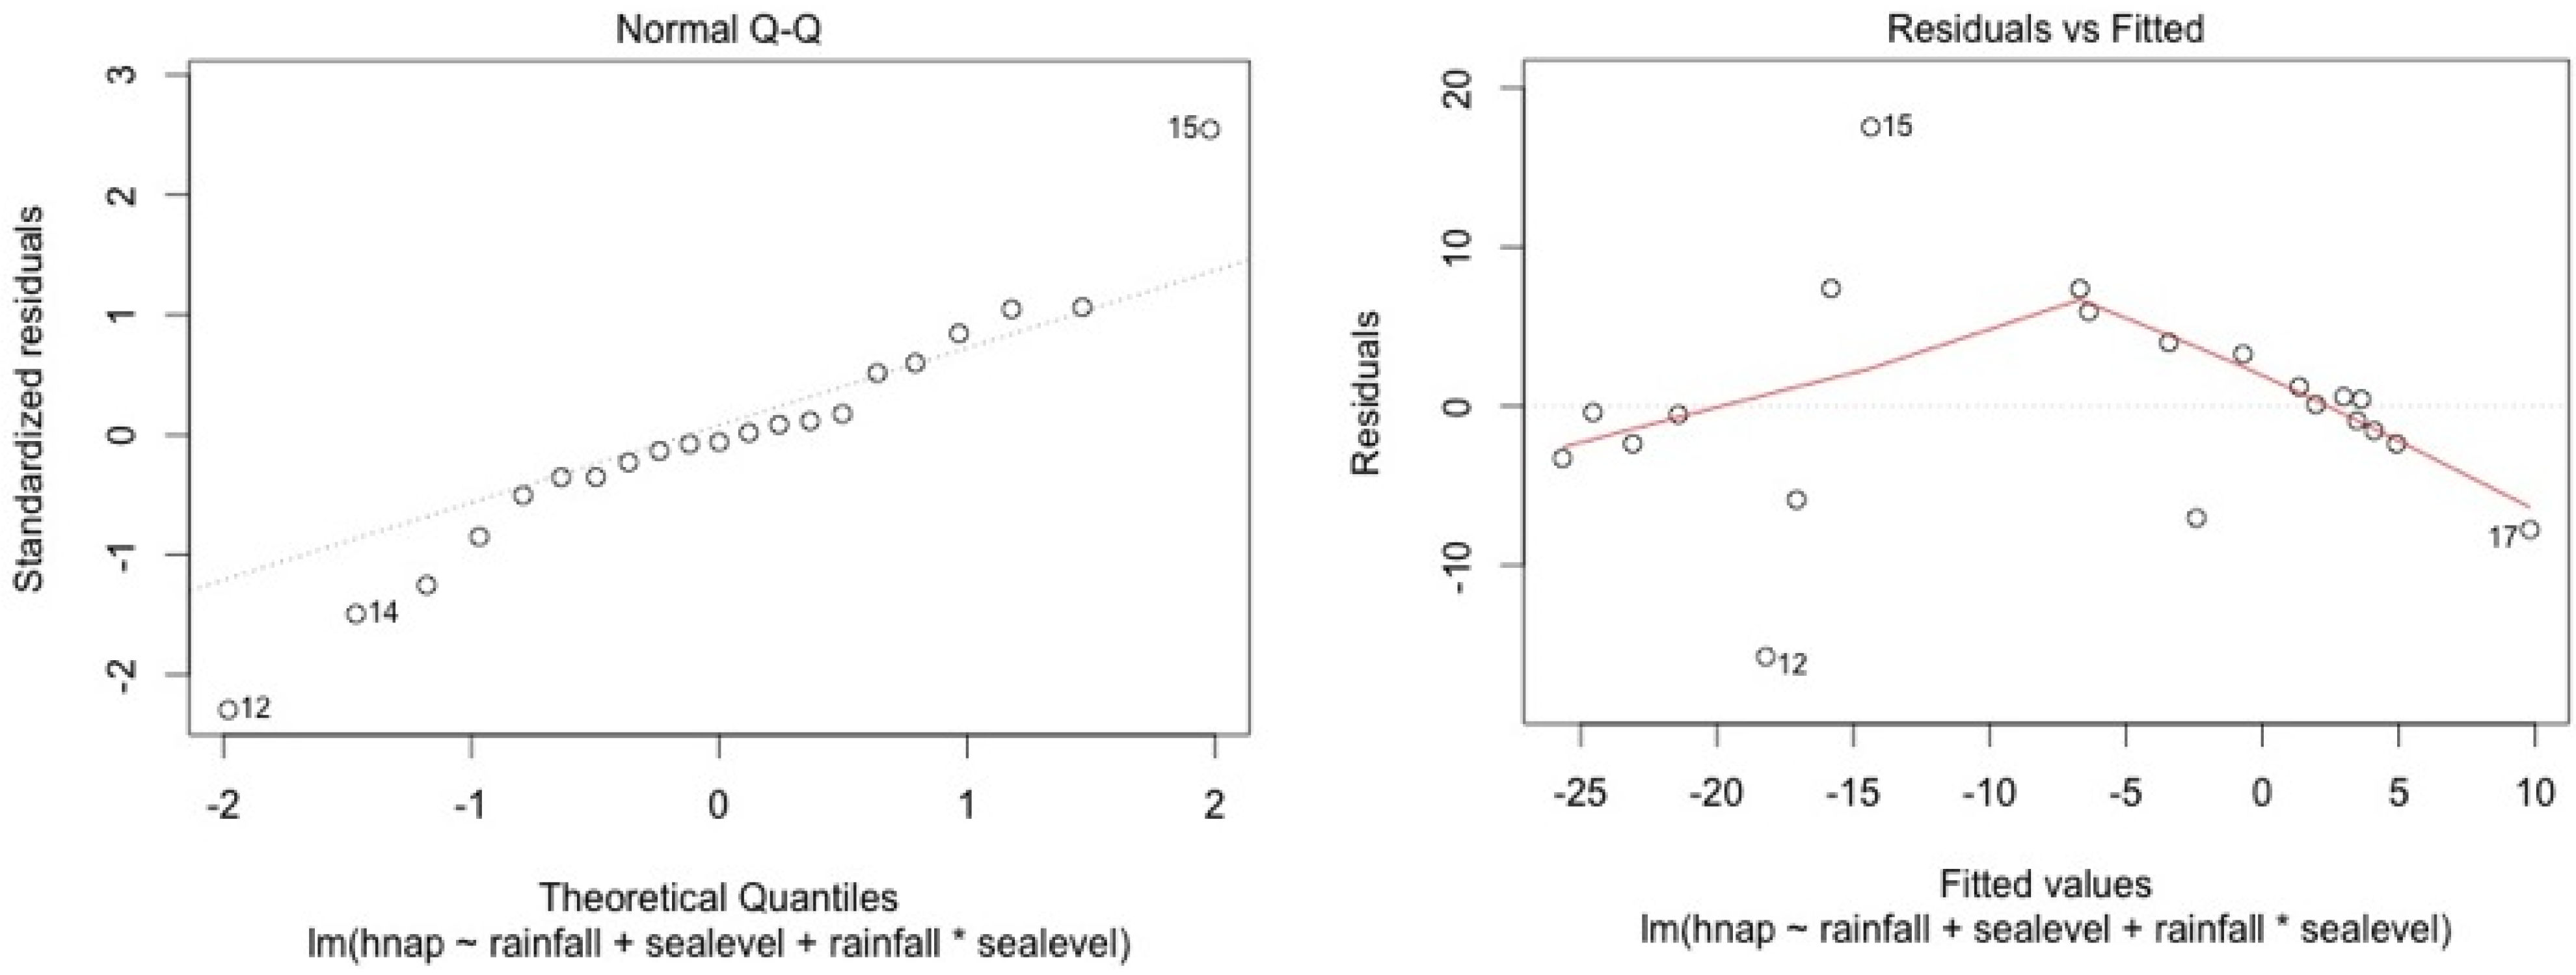
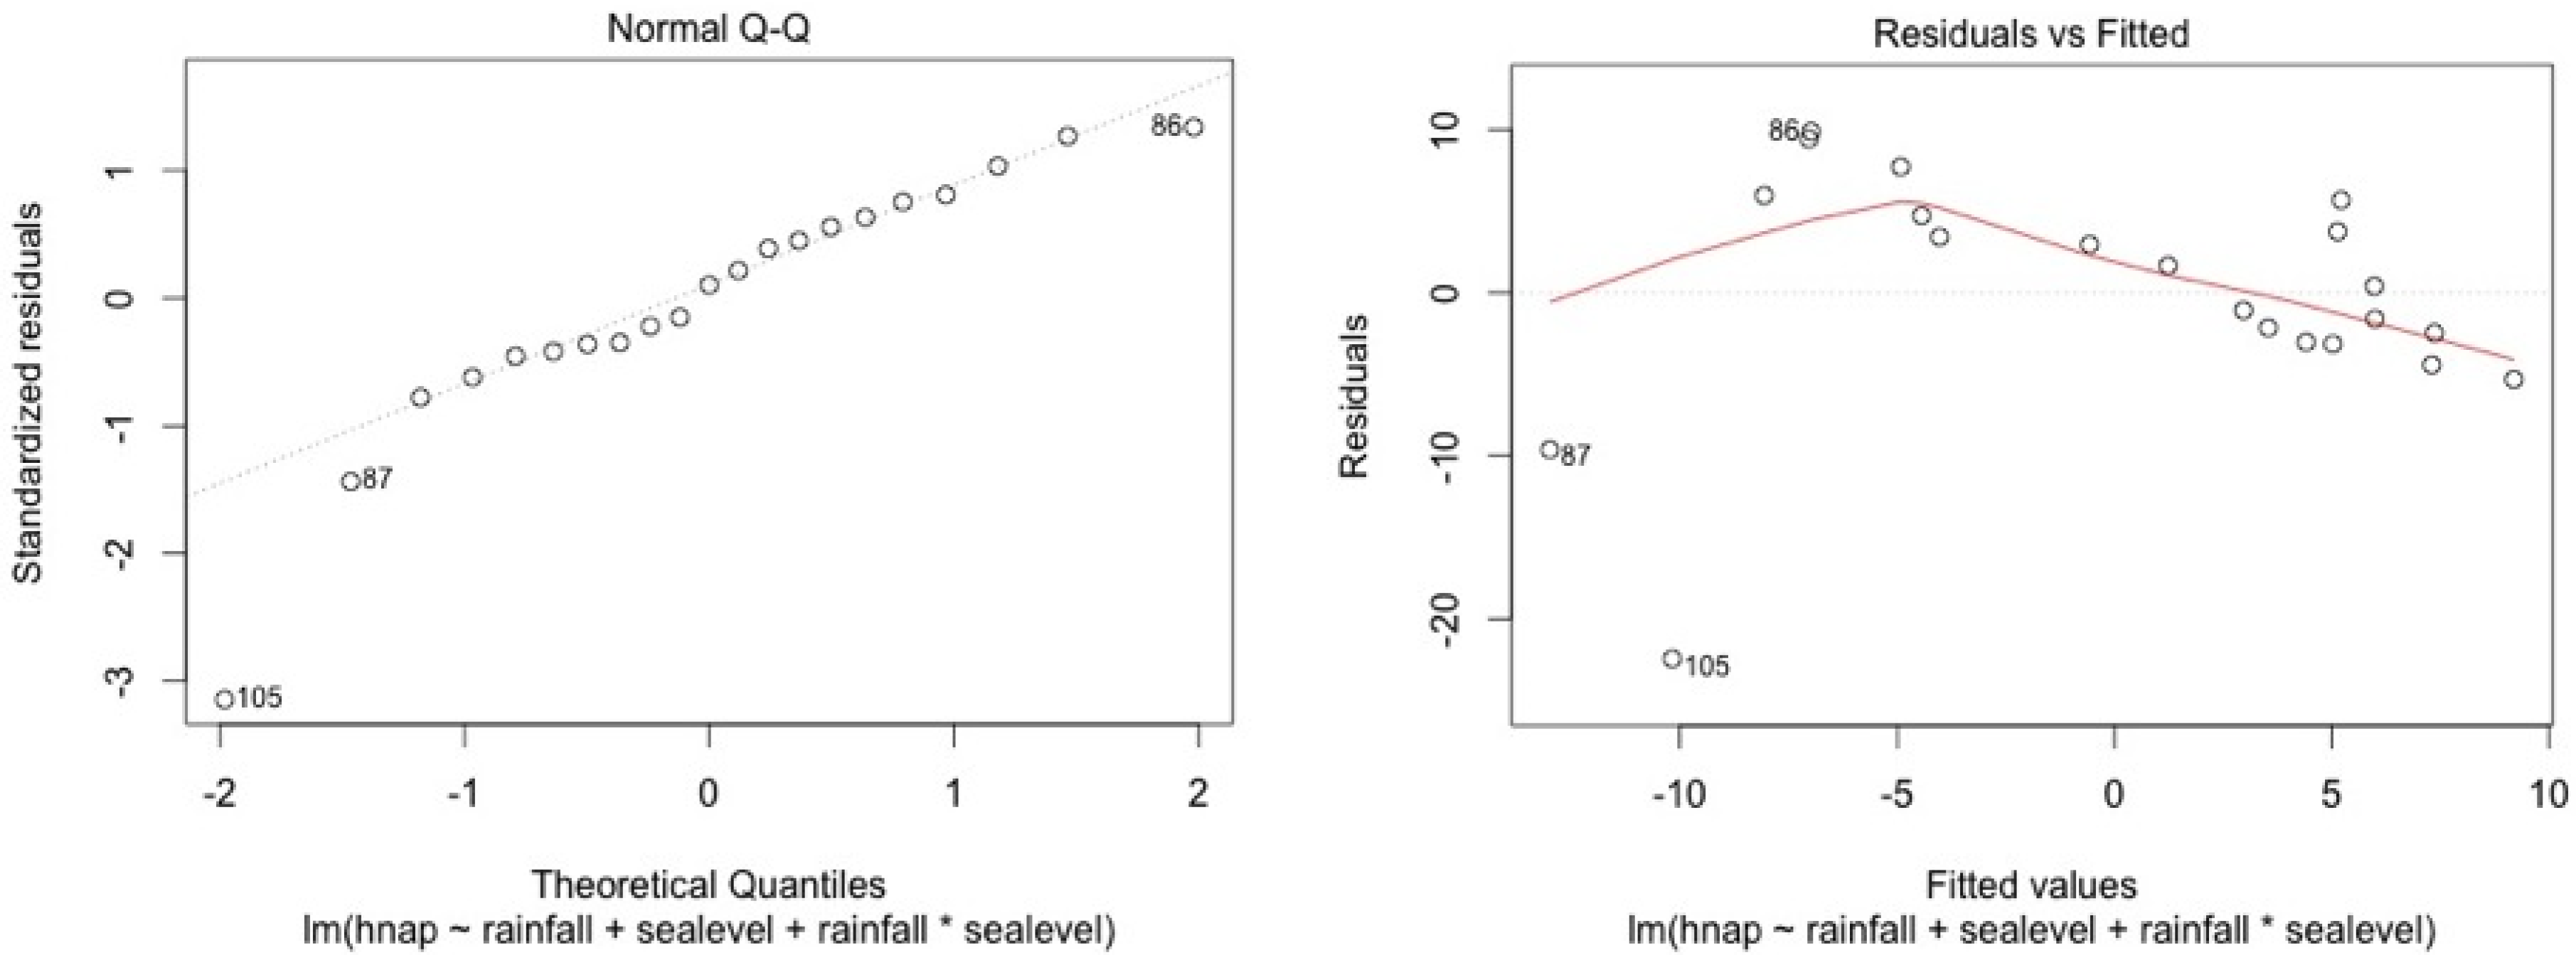
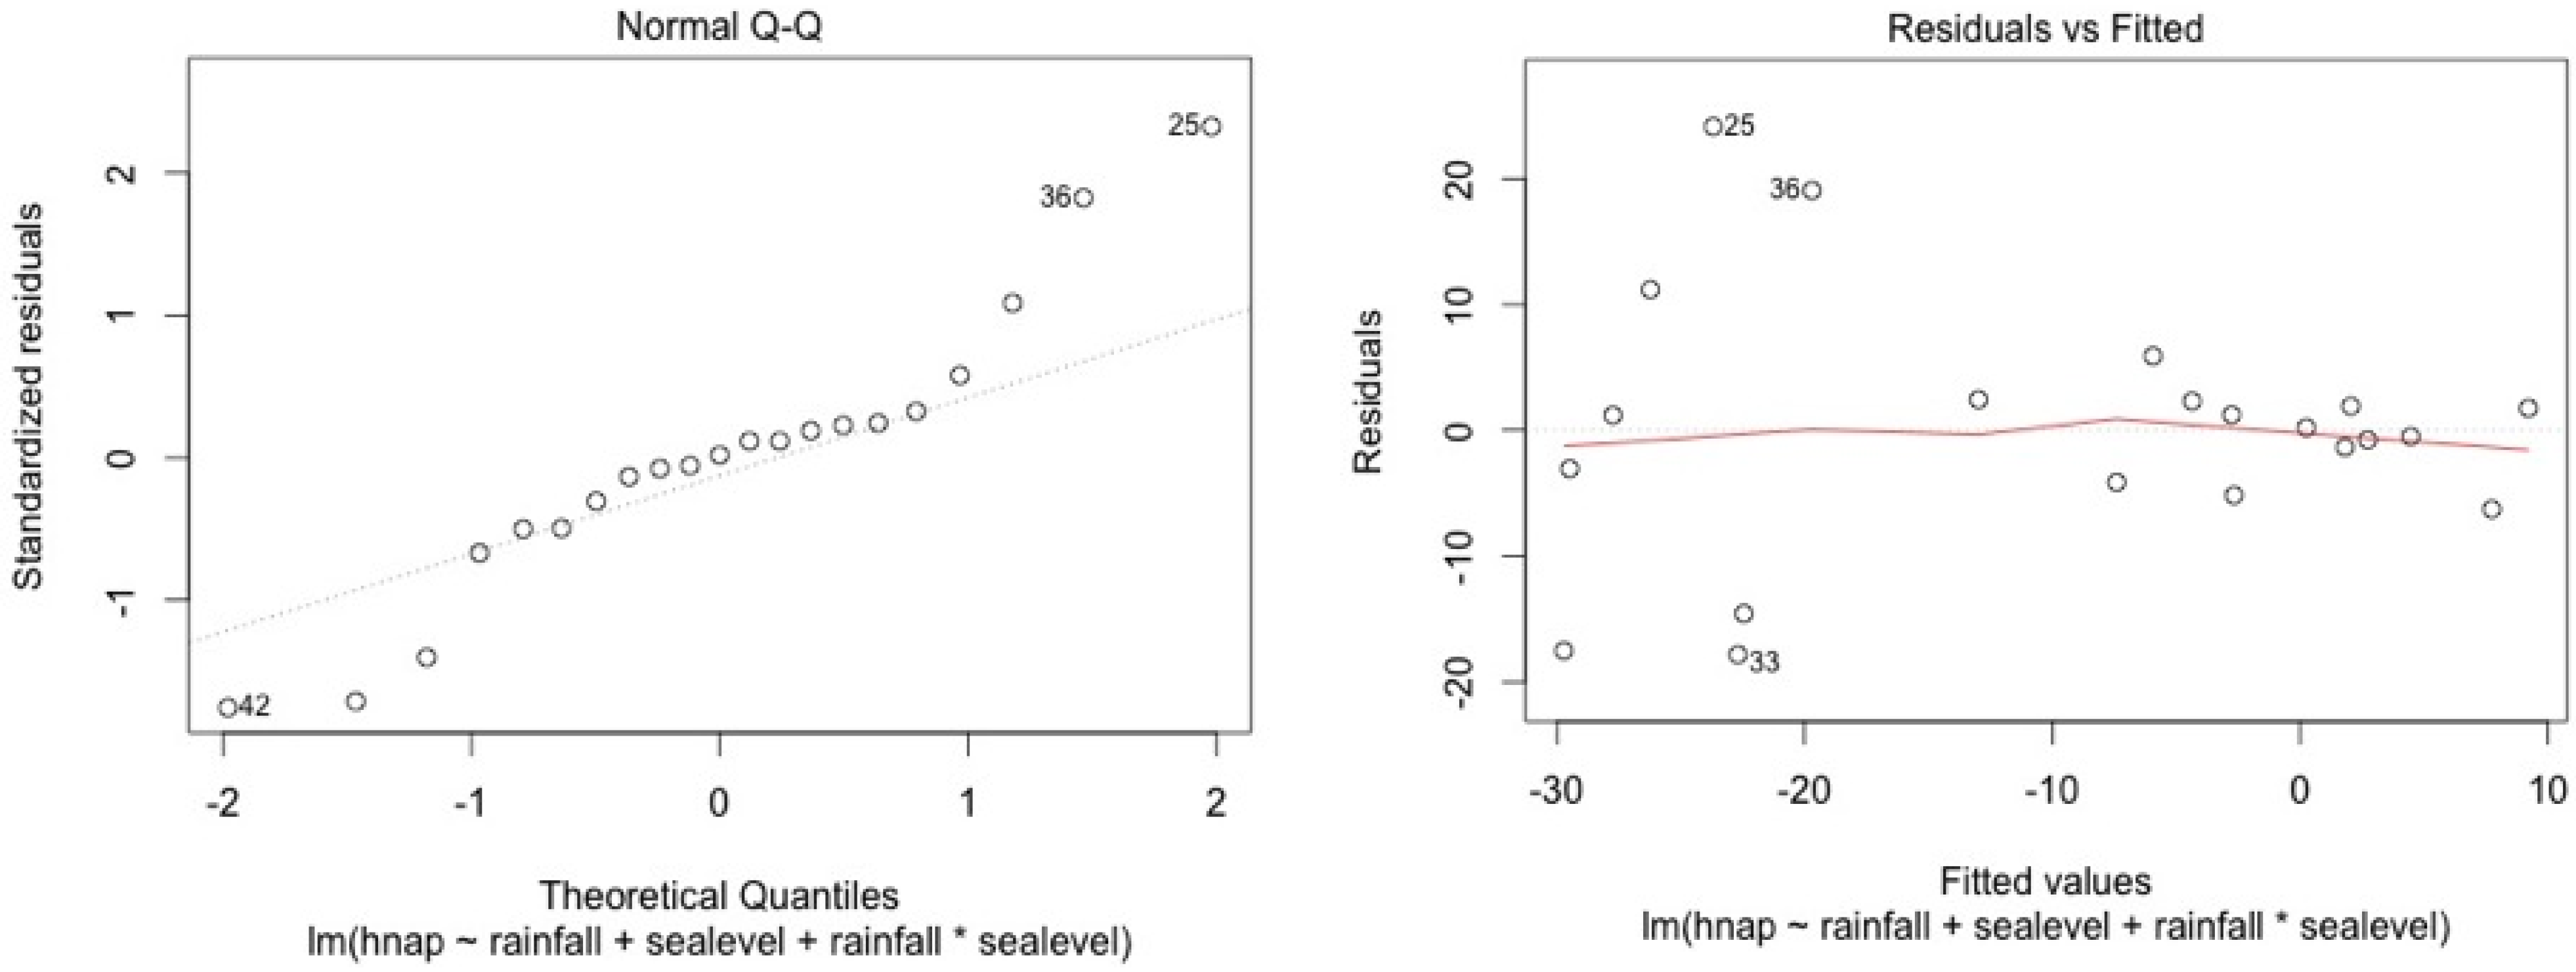
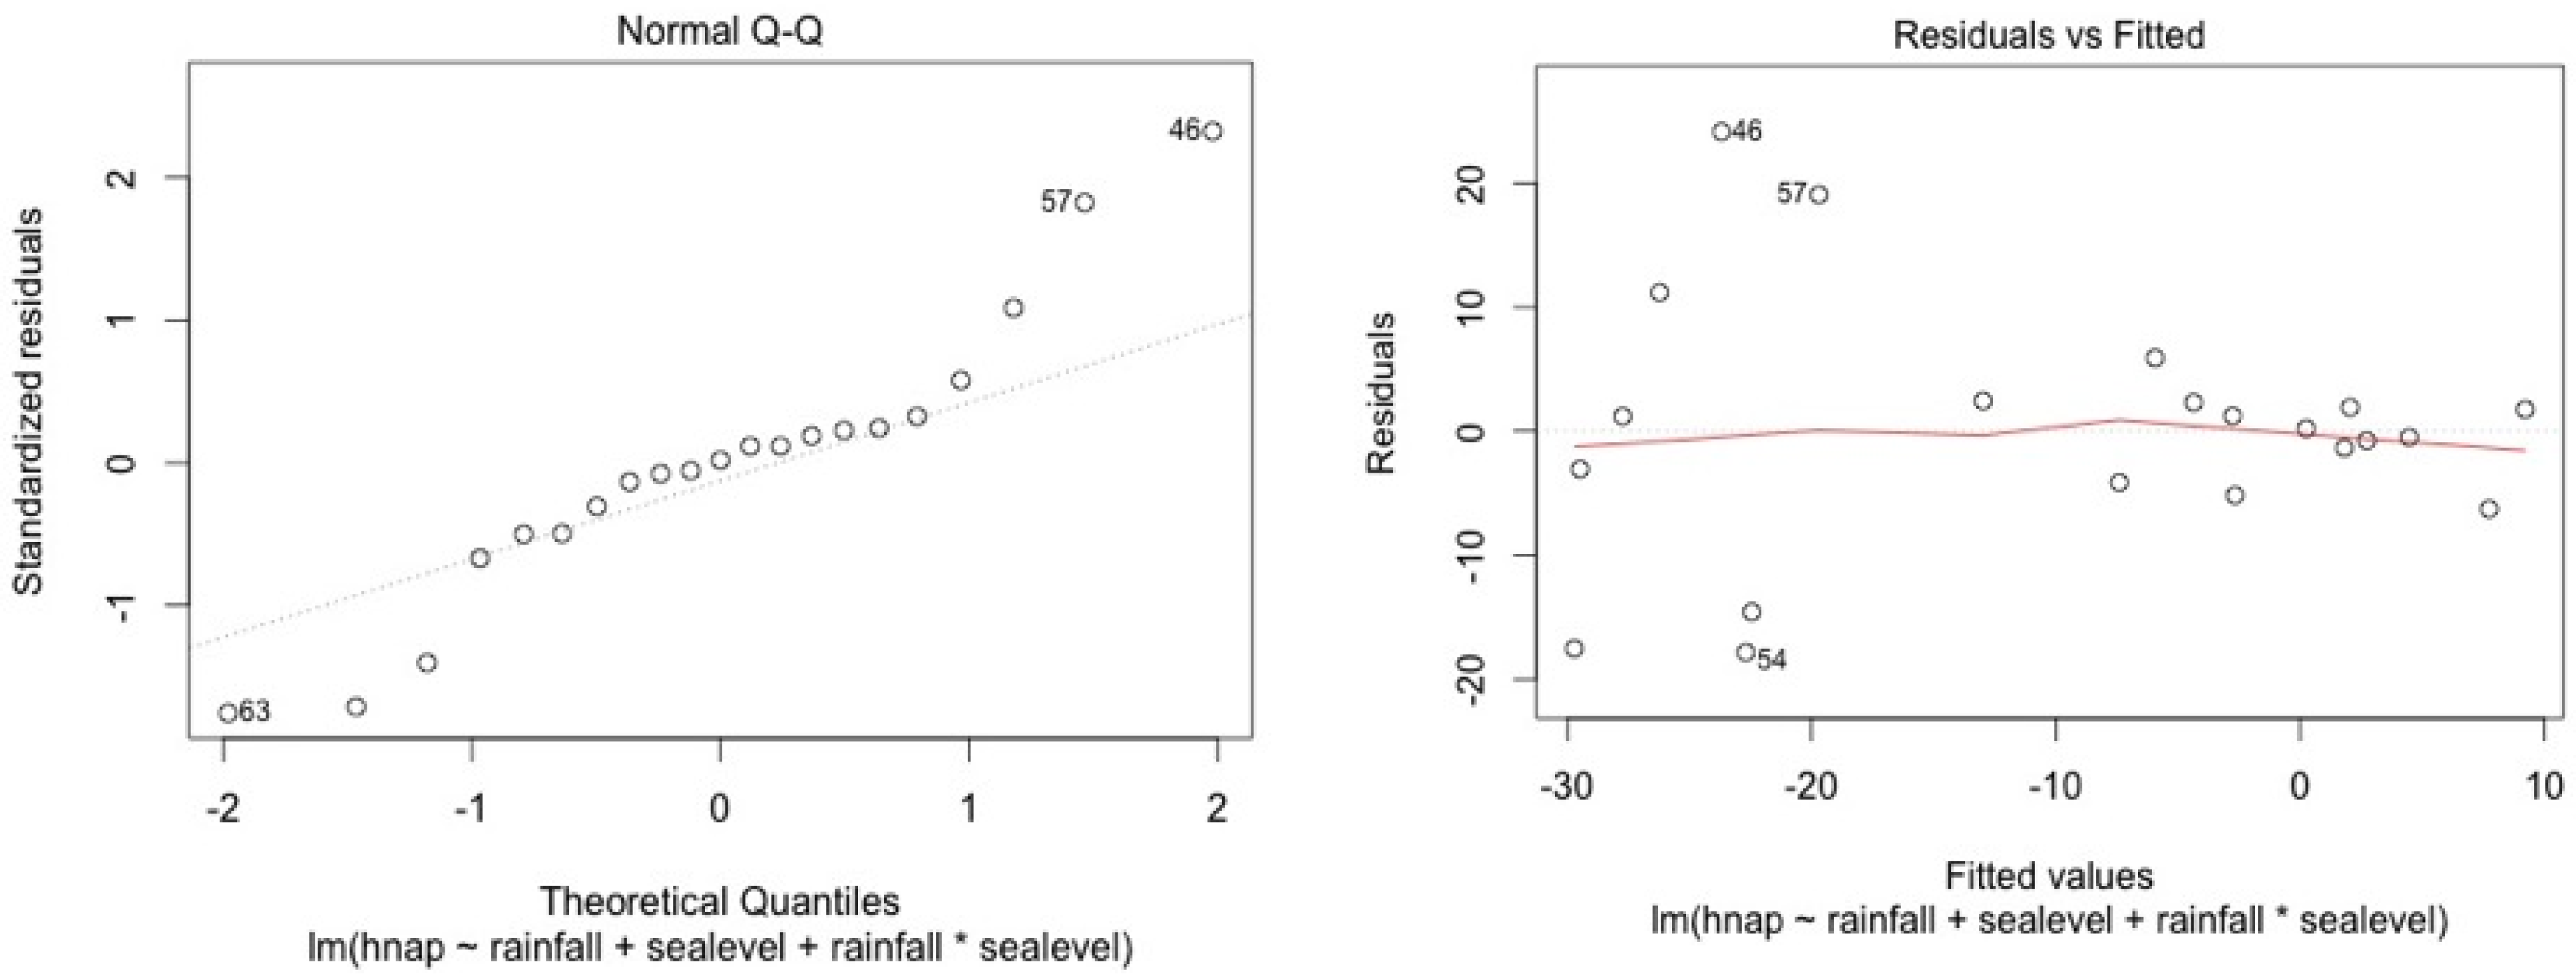
ANCOVA—Residuals’ analysis

Below are figured for each linear model and for each station
  • A table with p-value of normality test of the residuals for each model
  • 2 plots for a graphic analysis of the residuals:
    Standardized residuals vs. Theorical quantiles
    Residuas vs. Predicted values
We also check if Cook’s distance was lower than 1.
Normality test for the two models
Table A1. p-values of Shapiro-Wilk’s test.
StationsWater LevelTop Soil Salinity
5SF0.110.13
4SF0.060.15
2MF0.090.95
1MF0.340.12
3MF0.090.96
Notes: Water level = rainfall + sealevel; Top soil salinity= rainfall + sealevel.
We check for linearity of the residuals vs. the fitted values and for standardized residuals vs. theorical quantiles. Cook’s distance was always lower than 1.
The model shows high residual values for some measurement sessions (dots 12; 15 for MF1, dots 25; 33; 36 for MF2, dots 47; 54; 57 for MF3, dots 87; 105 for SF4 and dots 84; 74 for SF5). They all occurred in dry seasons (from February to May) for low water level values. We also noticed that water table variance was higher for low water table values.
In one hand, our model seems to be able to give a quite good general picture of the interaction between water level and the two selected environmental variables (more than 60% of explained variance), in the other hand our model seems not able to predict correctly the intensity of dry events on the water level in this station.
Figure A1. MF1.
Figure A1. MF1.
Water 07 04108 g007
Figure A2. MF2.
Figure A2. MF2.
Water 07 04108 g008
Figure A3. MF3.
Figure A3. MF3.
Water 07 04108 g009
Figure A4. SF4.
Figure A4. SF4.
Water 07 04108 g010
Figure A5. SF5.
Figure A5. SF5.
Water 07 04108 g011
Graphical analysis show that this model is correct for the mangrove stations. However, heteroscedasticity can be noted for top soil salinity modelisation in the swamp forest stations. This is due to the dry season event. In the swamp forest, our model gives a good picture of the relationship between rainfall, sea level, and salinity during the major part of the year but our model appears not to be accurate in predicting the intensity of dry seasons.
Figure A6. MF1.
Figure A6. MF1.
Water 07 04108 g012
Figure A7. MF2.
Figure A7. MF2.
Water 07 04108 g013
Figure A8. MF3.
Figure A8. MF3.
Water 07 04108 g014
Figure A9. SF4.
Figure A9. SF4.
Water 07 04108 g015
Figure A10. SF5.
Figure A10. SF5.
Water 07 04108 g016

References and Notes

  1. Thom, B.G. Mangrove ecology: A geomorphological perspective. In Mangrove ecosystems in Australia; Clough, B.F., Ed.; Australian National University Press: Camberra, Australia, 1984; pp. 3–17. [Google Scholar]
  2. Lugo, A.E.; Brown, S.; Brinson, M.M. Forested Wetlands. Ecosystems of the World; Elsevier Science Publishers: Amsterdam, The Netherlands, 1989. [Google Scholar]
  3. Watson, J.G. Mangrove Forests of the Malay Peninsula; Fraser and Neave: Singapore, 1928; p. 275. [Google Scholar]
  4. Davis, J.H.J. The Ecology and Geologic Role of Mangroves in Florida; Carnegie Institution of Washington: Washington, DC, USA, 1940. [Google Scholar]
  5. Chapman, V.J. The 1939 Cambridge University expedition to Jamaica. J. Linn. Soc. Lond. 1944, 52, 407–533. [Google Scholar] [CrossRef]
  6. Macnea, W. A general account of the fauna and flora of the mangrove swamps and forests in the Indo-Pacific region. Adv. Mar. Biol. 1968, 6, 73–270. [Google Scholar]
  7. Lugo, A.E.; Snedaker, S.C. The ecology of mangroves. Ann. Rev. Ecol. Syst. 1974, 5, 39–64. [Google Scholar] [CrossRef]
  8. Ball, M. Ecophysiology of mangroves. Trees 1988, 2, 129–142. [Google Scholar] [CrossRef]
  9. Ball, M. Mangrove species richness in relation to salinity and waterlogging: a case study along the Adelaide River floodplain, northern Australia. Glob. Ecol. Biogeogr. Lett. 1998, 7, 73–82. [Google Scholar] [CrossRef]
  10. Santos, I.; Eyre, B.D.; Huettel, M. The driving forces of porewater and groundwater flow in permeable coastal sediments: A review. Estuar. Coast. Shelf Sci. 2012, 98, 1–15. [Google Scholar] [CrossRef]
  11. Anschutz, P.; Smith, T.; Mouret, A.; Deborde, J.; Bujan, S.; Poirier, D.; Lecroart, P. Tidal Sands as Biogeochemical Reactors. Estuar. Coast. Shelf Sci. 2009, 84, 84–90. [Google Scholar] [CrossRef] [Green Version]
  12. Kjerfve, B. Manual for Investigation of Hydrological Processes in Mangrove Ecosystems; UNESCO/UNDP Regional Project “Mangrove Ecosystems in Asia and the Pacific” Report RAS/79/002 and RAS/86/120; United Nations Educational, Scientific, and Cultural Organization (UNESCO): Paris, France, 1990; pp. 1–74. [Google Scholar]
  13. Corenblit, D.; Steiger, J.; Charrier, G.; Darrozes, J.; Dousseau, J.; González, E.; Gurnell, A.M.; Julien, F.; Lambs, L.; Larrue, S.; et al. The biogeomorphological life cycle of poplars during the fluvial biogeomorphological succession: A special focus on Populus nigra L. Earth Surf. Process. Landf. 2014, 39, 546–563. [Google Scholar] [CrossRef] [Green Version]
  14. Imbert, D. Organisation Spatio-Temporelle des Communautés Végétales du Grand Cul-de-sac Marin (Guadeloupe). PhD Thesis, Montpellier, France, 1985. [Google Scholar]
  15. Imbert, D.; Rousteau, A.; Scherrer, P. Ecology of mangrove growth and recovery in the Lesser Antilles: State of knowledge and basis for restoration projects. Restor. Ecology 2000, 8, 230–236. [Google Scholar] [CrossRef]
  16. Schaeffer-Noveli, Y.; Mesquita, H.S.L.; Cintron-Molero, G. The Cananeia Lagoon estuarine system, Sao Paulo, Brazil. Estuaries 1990, 13, 193–203. [Google Scholar] [CrossRef]
  17. Craig, H. Isotopic variations in meteoric waters. Science 1961, 133, 1702–1703. [Google Scholar] [CrossRef] [PubMed]
  18. Dansgaard, W. Stable isotopes in precipitation. Tellus 1964, 16, 436–468. [Google Scholar] [CrossRef]
  19. Wagner, F.; Rossi, V.; Stahl, C.; Bonal, D.; Hérault, B. Water availability is the main climate driver of neotropical tree growth. PLos ONE 2012, 7, 1–11. [Google Scholar] [CrossRef] [PubMed] [Green Version]
  20. Pezeshki, S.R.; DeLaune, R.D.; Patrick, W.H., Jr. Differential response of selected mangroves to soil flooding and salinity: Gas exchange and biomass partitioning. Can. J. For. Res. 1990, 20, 869–874. [Google Scholar] [CrossRef]
  21. Imbert, D.; Portecop, J. Production de litière dans la mangrove du Grand Cul-de-sac Marin (Guadeloupe). Oecol. Plant 1986, 7, 379–396. [Google Scholar]
  22. Cintrón, G.; Lugo, A.E.; Pool, D.J.; Morris, G. Mangroves of arid environments in Puerto Rico and adjacent islands. Biotropica 1978, 10, 110–121. [Google Scholar] [CrossRef]
  23. Flower, J.M.; Imbert, D. Recovery deficiency following tree mortality in mangroves of two Caribbean islands: Field survey and statistical classification. Wetl. Ecol. Manag. 2006, 14, 185–199. [Google Scholar] [CrossRef]
  24. Imbert, D.; Flower, J.M. Les sols et la végétation de la zone côtière inondable au nord de Port-au-Prince (Haïti). Conjonctions Revue franco-haïtienne de l’Institut Français d’Haïti 2006, 213/214, 33–47. (In French) [Google Scholar]
  25. Lambs, L.; Muller, E.; Fromard, F. The Guianese paradox: How can the freshwater outflow from the Amazon increase the salinity of the Guianan shore? J. Hydrol. 2007, 342, 88–96. [Google Scholar] [CrossRef] [Green Version]
  26. Lambs, L.; Muller, E.; Fromard, F. Mangrove trees growing in a very saline condition but not using seawater. Rapid Commun. Mass Spectrom. 2008, 22, 2835–3843. [Google Scholar] [CrossRef] [PubMed] [Green Version]
  27. Tomlinson, P.B. The Botany of Mangroves; Cambridge University Press: Cambridge, UK, 1986; p. 419. [Google Scholar]
  28. Medina, E.; Cuevas, E.; Lugo, A. Nutrient and salt relations of Pterocarpus officinalis L. in coastal wetlands of the Caribbean: Assessment through leaf and soil analyses. Trees 2007, 21, 321–327. [Google Scholar] [CrossRef]
  29. Dulormne, M.; Musseau, O.; Muller, F.; Toribio, A.; Bâ, A. Effects of NaCl on growth, water status, N2 fixation, and ion distribution in Pterocarpus officinalis seedlings. Plant Soil 2010, 327, 23–34. [Google Scholar] [CrossRef]
  30. Imbert, D.; Ménard, S. Structure de la végétation et production primaire dans la mangrove de la Baie de Fort-de-France, Martinique. Biotropica 1997, 29, 413–426. [Google Scholar] [CrossRef]
  31. Eusse, A.M.; Aide, T.M. Patterns of litter production across a salinity gradient in a Pterocarpus officinalis tropical wetland. Plant Ecol. 1999, 145, 307–315. [Google Scholar] [CrossRef]
  32. Migeot, J.; Imbert, D. Phenology and production of litter in a Pterocarpus officinalis (Jacq.) swamp forest of Guadeloupe (Lesser Antilles). Aquat. Bot. 2012, 101, 18–27. [Google Scholar] [CrossRef]
  33. Bompy, F.; Lequeue, G.; Imbert, D.; Dulormne, M. Increasing fluctuations of soil salinity affect seedling growth performances and physiology in three Neotropical mangrove species. Plant Soil 2014, 380, 399–413. [Google Scholar] [CrossRef]
  34. Bompy, F.; Imbert, D.; Dulormne, M. Impact patterns of soil salinity variations on the survival rate, growth performances, and physiology of Pterocarpus officinalis seedlings. Trees 2015, 29, 119–128. [Google Scholar] [CrossRef]
  35. Colón-Rivera, R.J.; Feagin, R.A.; West, J.B.; López, N.B.; Benítez-Joubert, R.J. Hydrological modification, saltwater intrusion, and tree water use of a Pterocarpus officinalis swamp in Puerto Rico. Estuar. Coast. Shelf Sci. 2014, 147, 156–167. [Google Scholar] [CrossRef]
  36. Imbert, D.; Saur, E.; Bonhême, I.; Roseau, V. Traditional Taro (Colocasia esculenta) cultivation in the swamp forest of Guadeloupe (F.W.I.): Impact on forest structure and plant biodiversity. Revue d'Écologie 2004, 59, 181–189. [Google Scholar]
  37. Alvarez-Lopez, M. Ecology of Pterocarpus officinalis forested wetlands in Puerto Rico. In Ecosystems of the Worls 15. Forested Wetlands; Lugo, A.E., Brinson, M., Brown, S., Eds.; Elservier: Amsterdam, The Netherlands, 1990; pp. 251–265. [Google Scholar]
  38. Imbert, D.; Delbé, L. Ecology of fire-influenced Cladium jamaicense marshes in Guadeloupe, Lesser Antilles. Wetlands 2006, 26, 289–297. [Google Scholar] [CrossRef]
  39. Saint-Etienne, L.; Paul, S.; Imbert, D.; Dulormne, M.; Muller, F.; Toribio, A.; Plenchette, C.; Bâ, A.M. Arbuscular mycorrhizal soil infectivity in a stand of the wetland tree Pterocarpus officinalis along a salinity gradient. For. Ecol. Manag. 2006, 232, 86–89. [Google Scholar]
  40. Migeot, J.; Imbert, D. Structural and floristic patterns in tropical swamp forests: A case study from the Pterocarpus officinalis (Jacq.) forest in Guadeloupe, French West Indies. Aquat. Bot. 2011, 94, 1–8. [Google Scholar] [CrossRef]
  41. Stocker, T.F.; Qin, D.; Plattner, G.-K.; Tignor, M.; Allen, S.K.; Boschung, J.; Nauels, A.; Xia, Y.; Bex, V.; Midgley, P.M. (Eds.) Climate Change 2013: The Physical Science Basis—Contribution of Working Group I to the Fifth Assessment Report of the Intergovernmental Panel on Climate Change; Cambridge University Press: Cambridge, UK; New York, NY, USA, 2013; p. 1535.

