
Characterization of the Corrosive Action of Mineral Waters from Thermal Sources: A Case Study at Azores Archipelago, Portugal


Abstract
: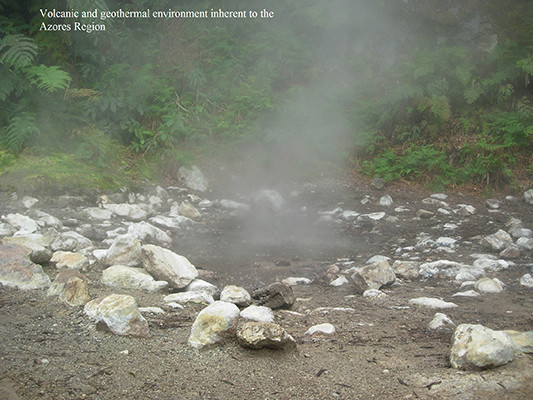
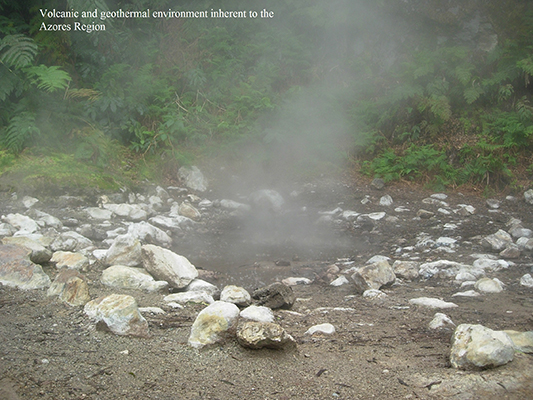
1. Introduction
2. Experimental
2.1. Determination of the Langelier Saturation Index (LSI)
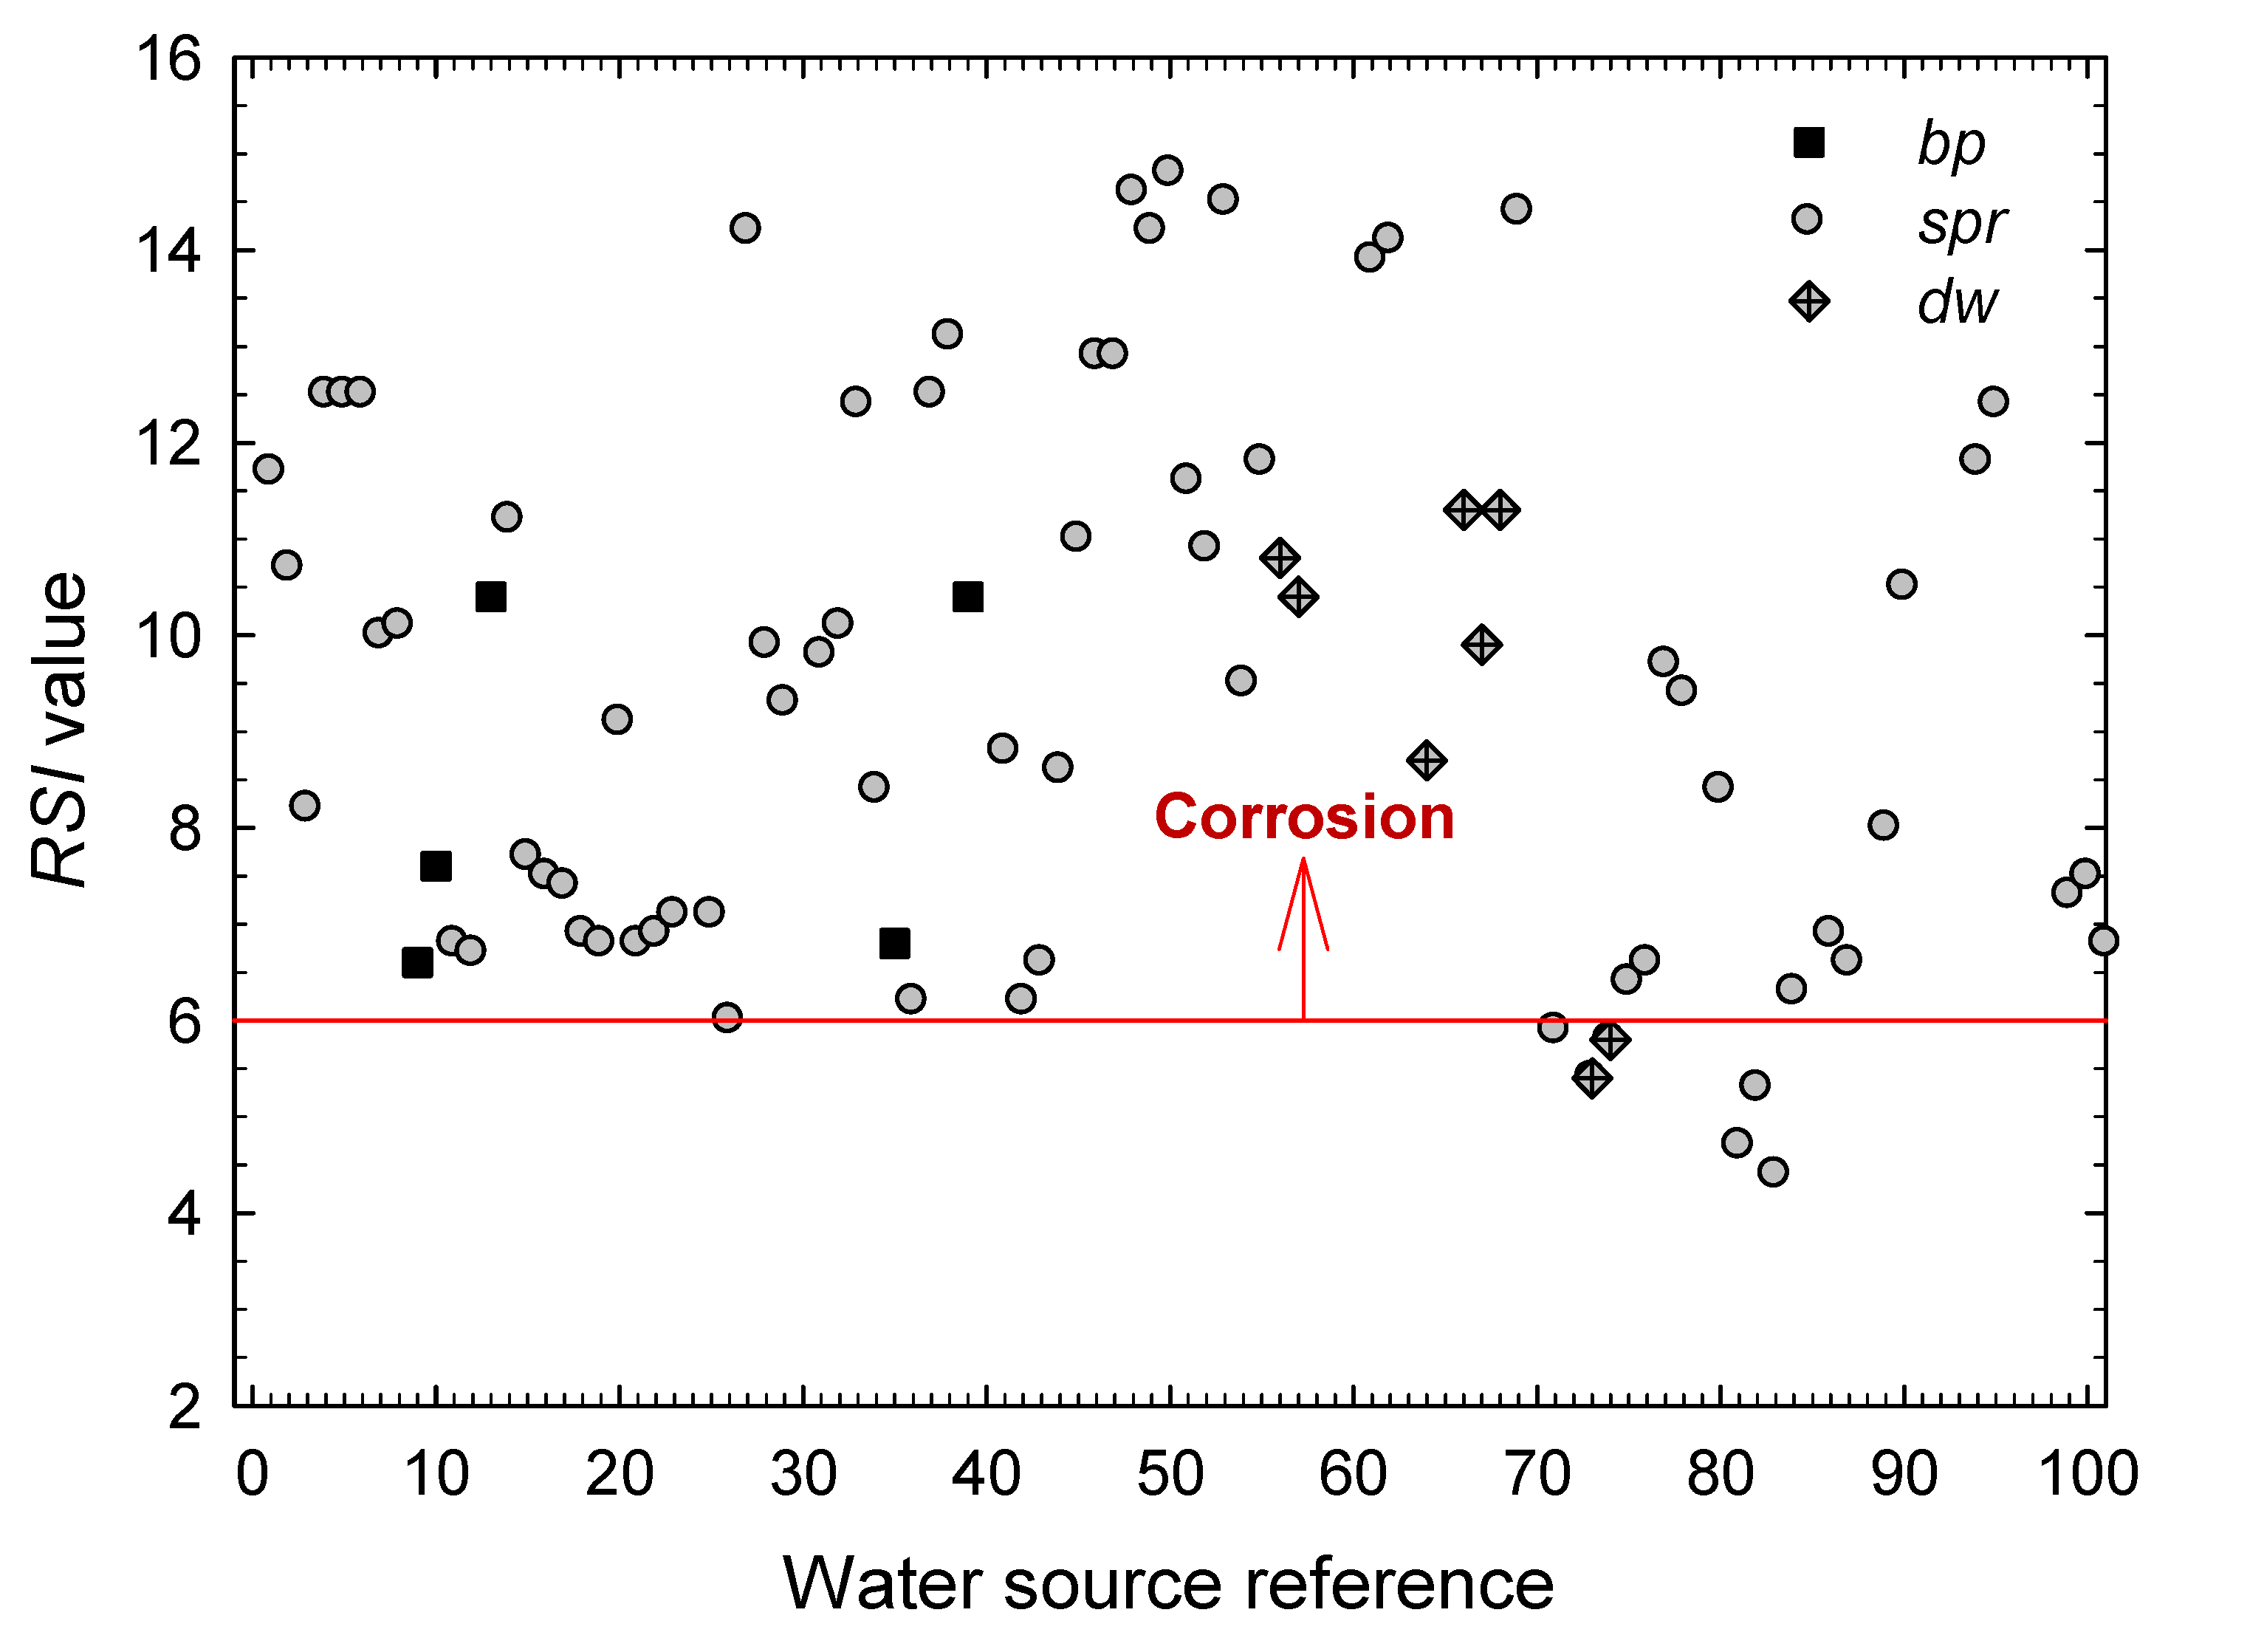
2.2. Determination of the Ryznar Stability Index (RSI)
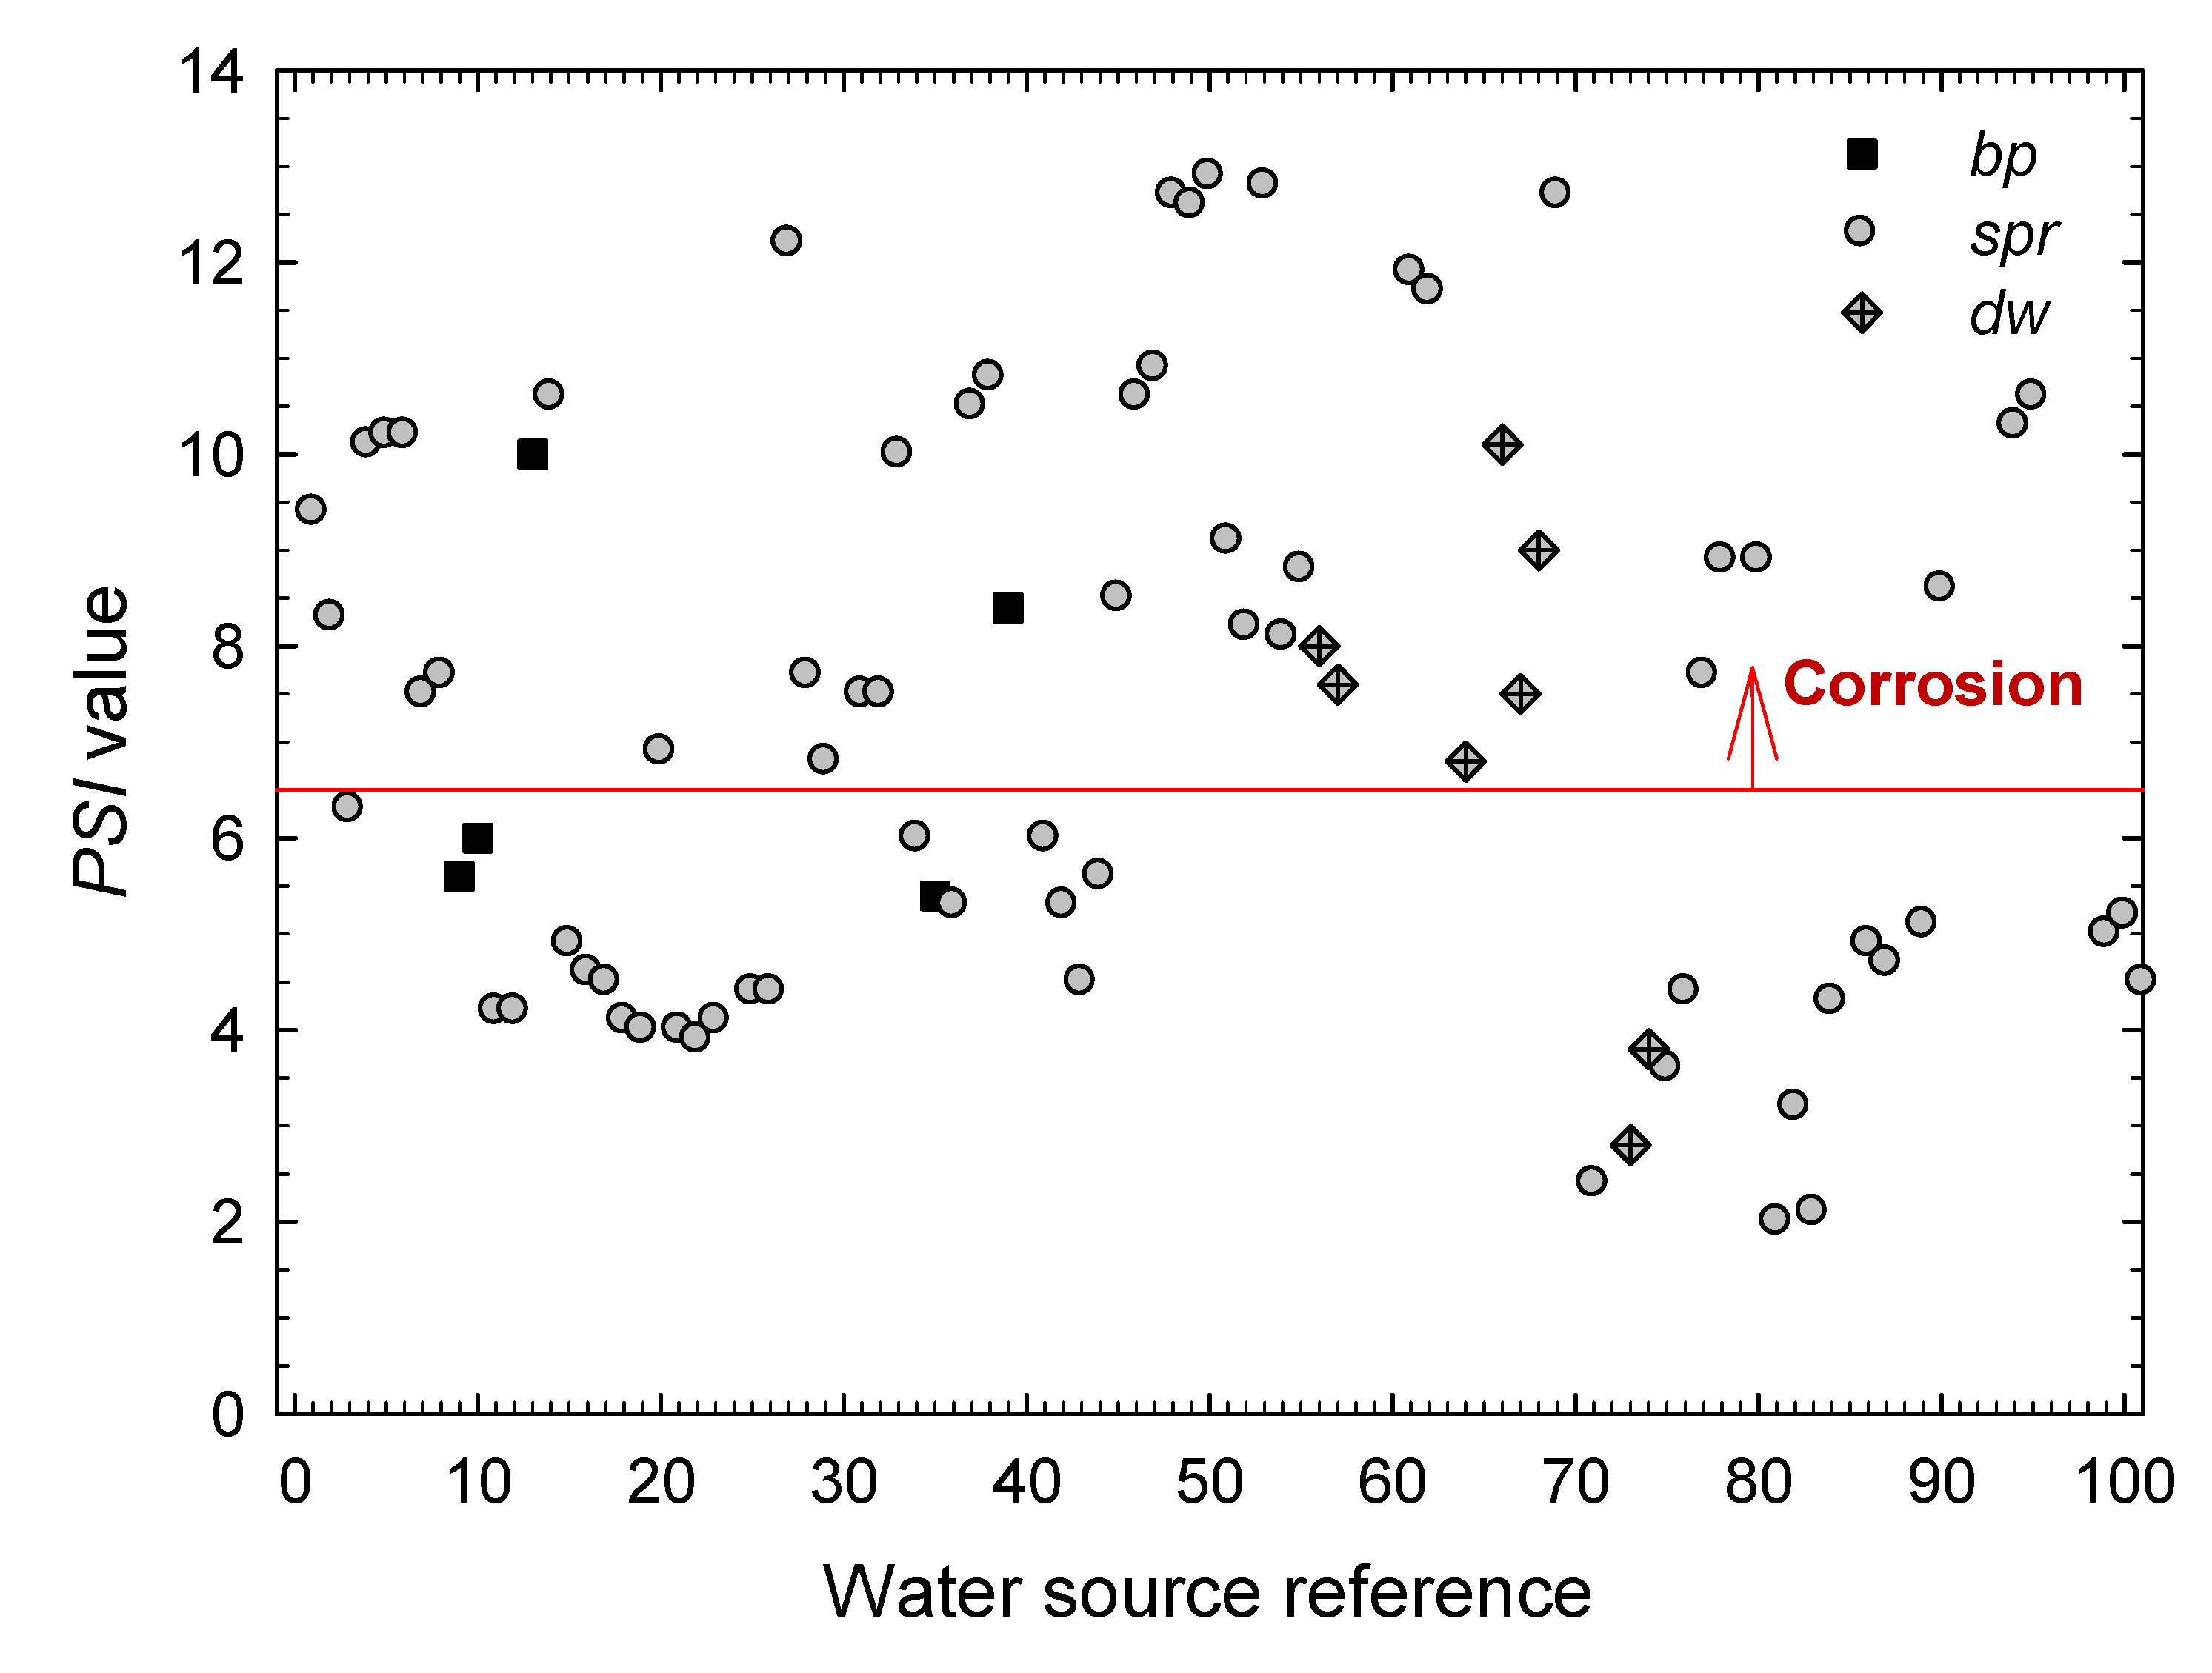
2.3. Determination of the Puckorius Scaling Index (PSI)
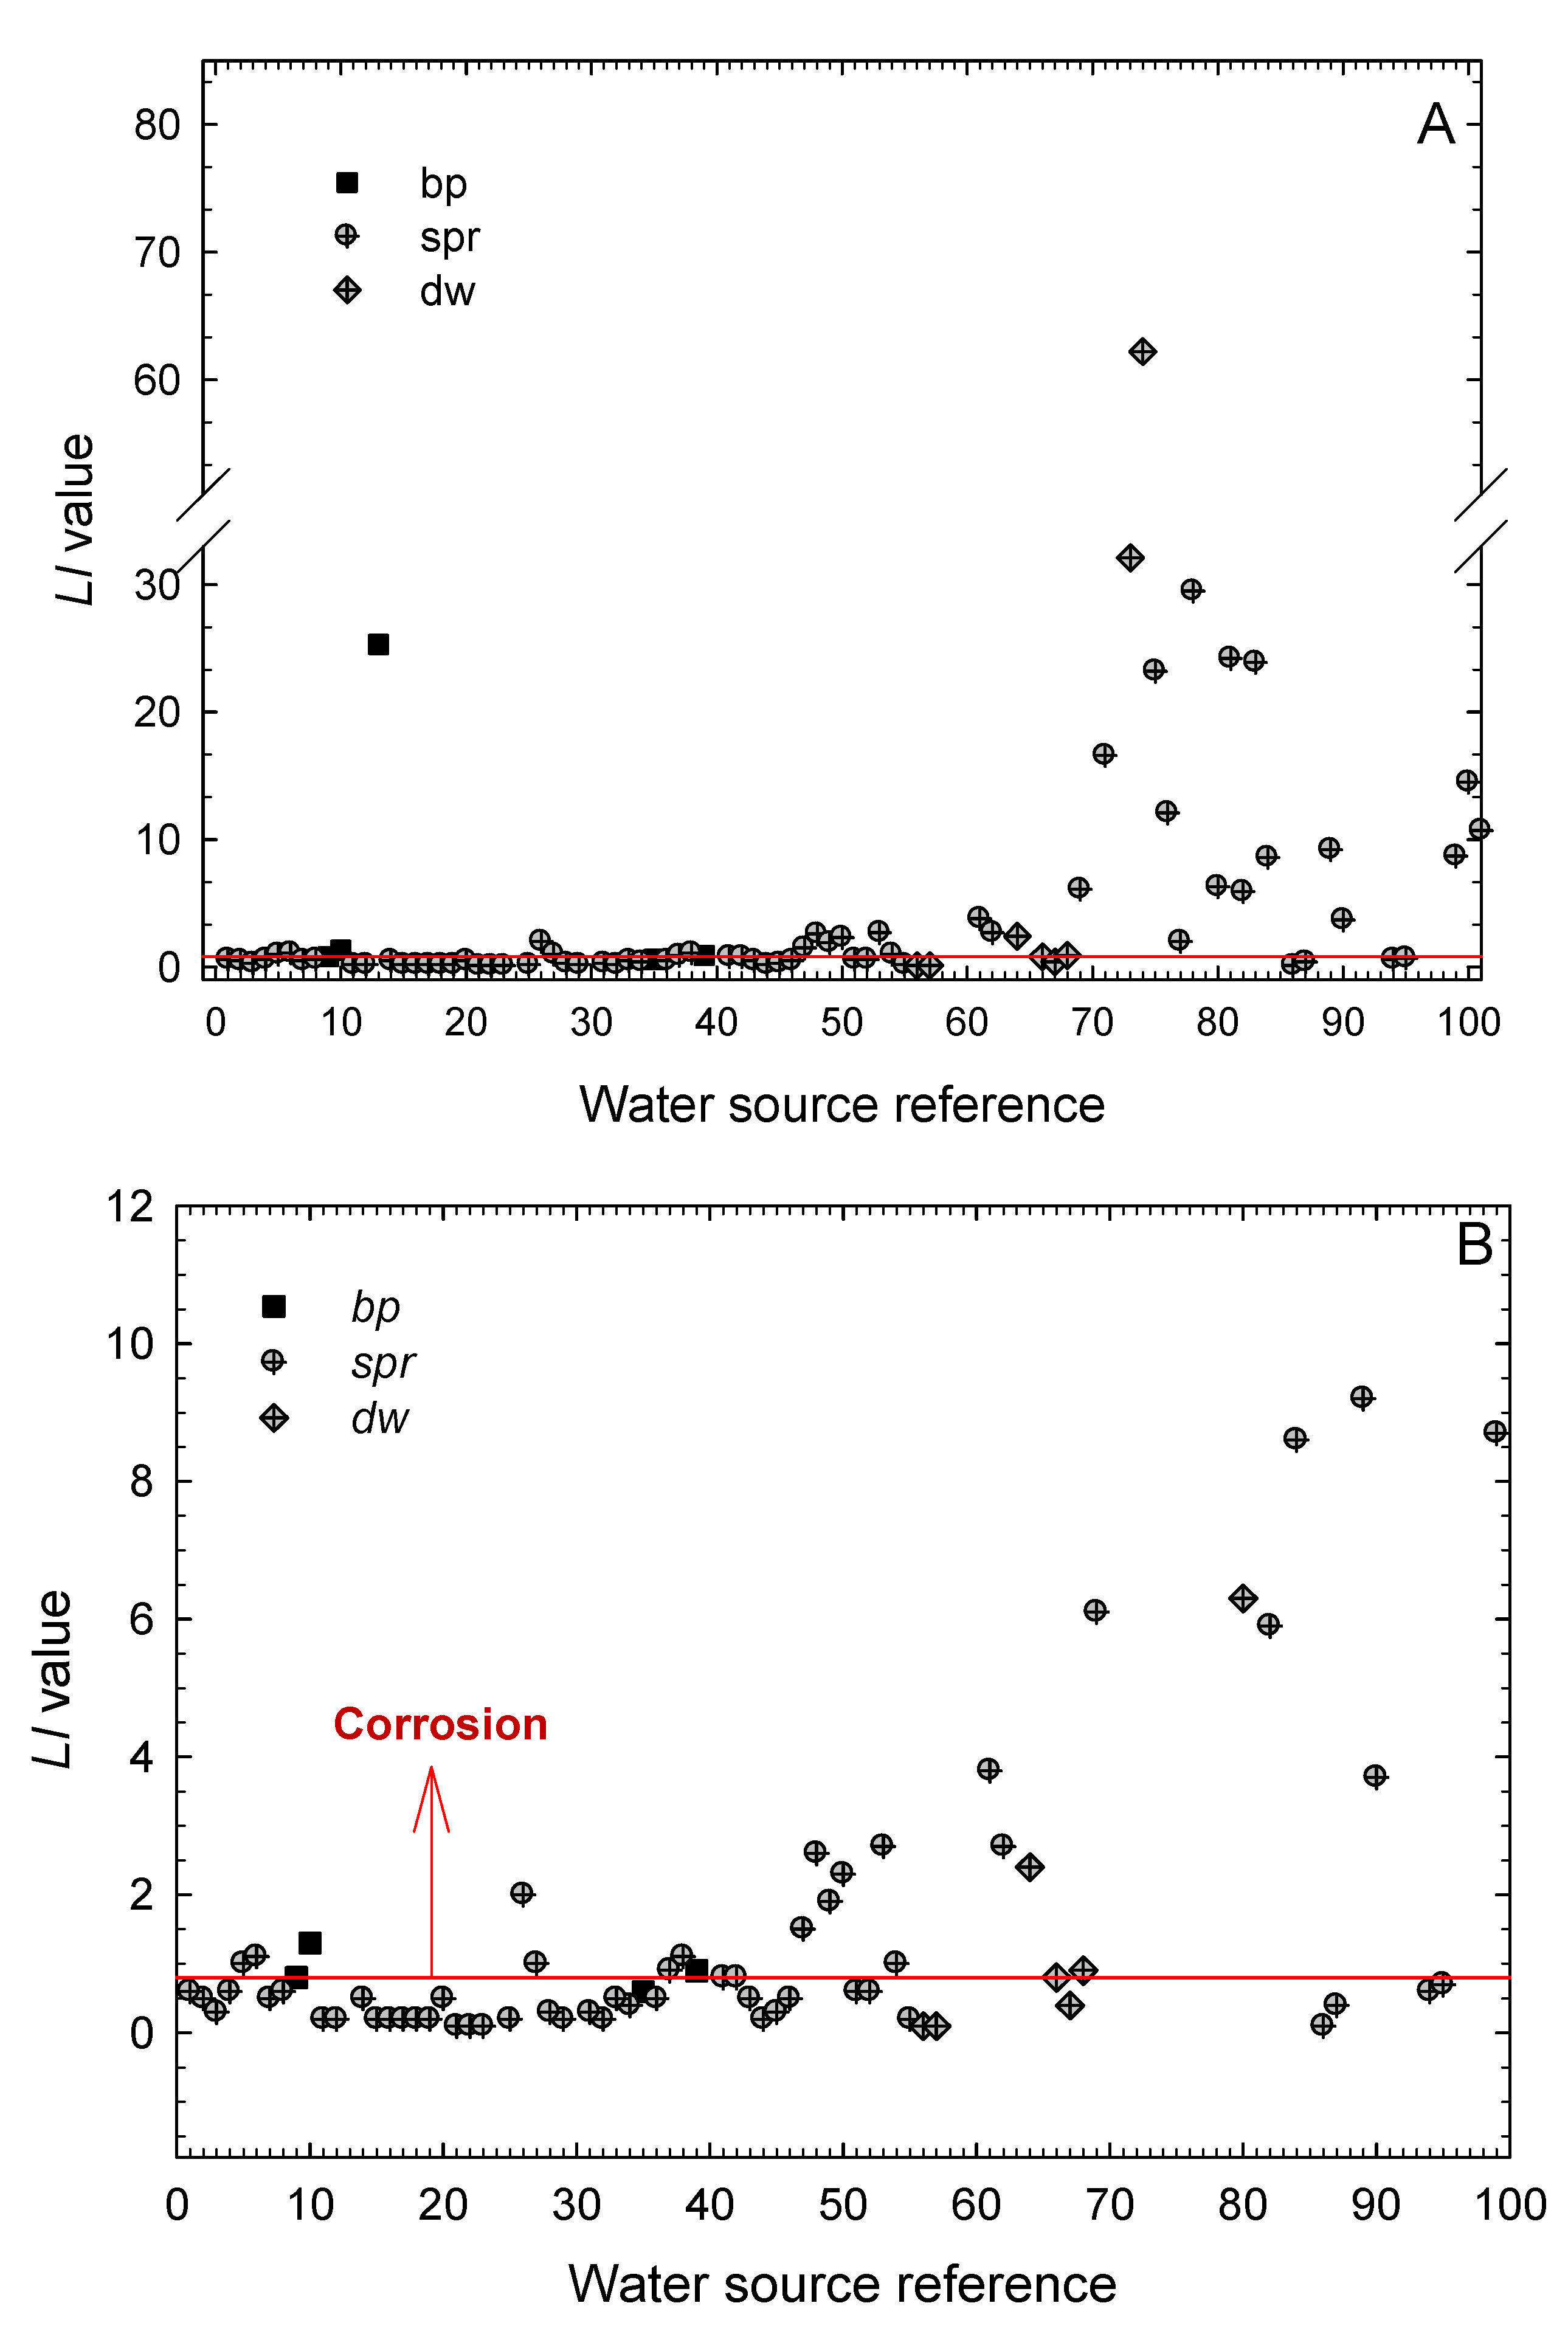
2.4. Determination of the Larson–Skold Index (LI)
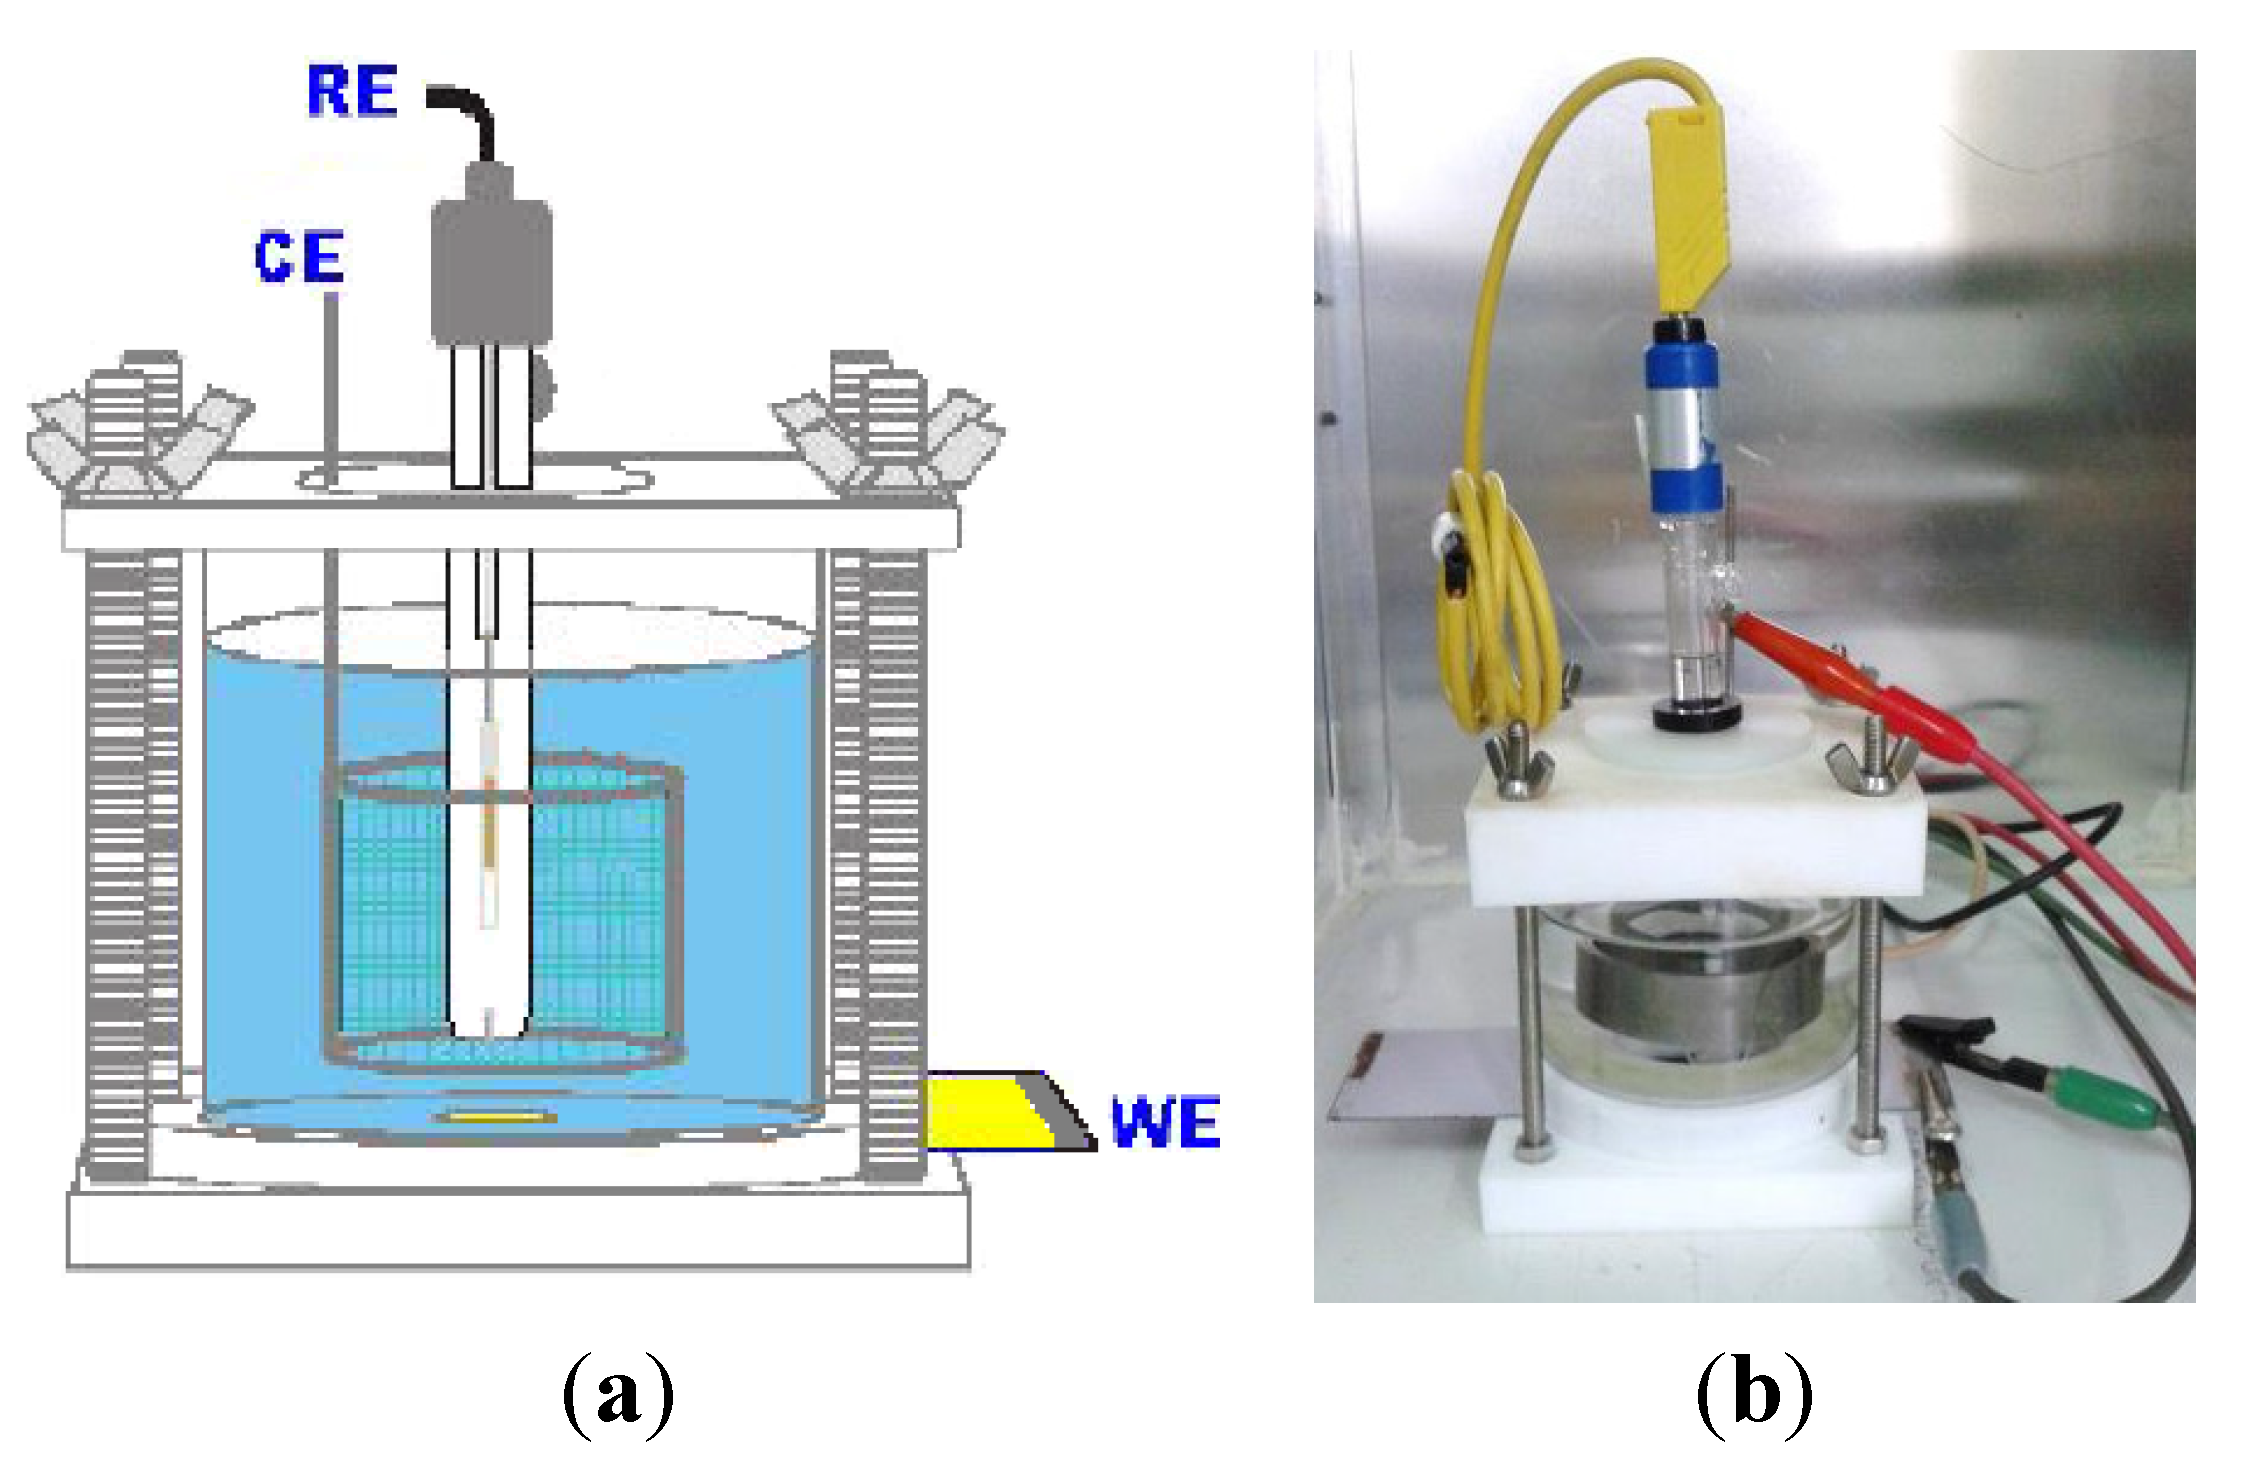
2.5. Electrochemical Characterization

3. Results and Discussion
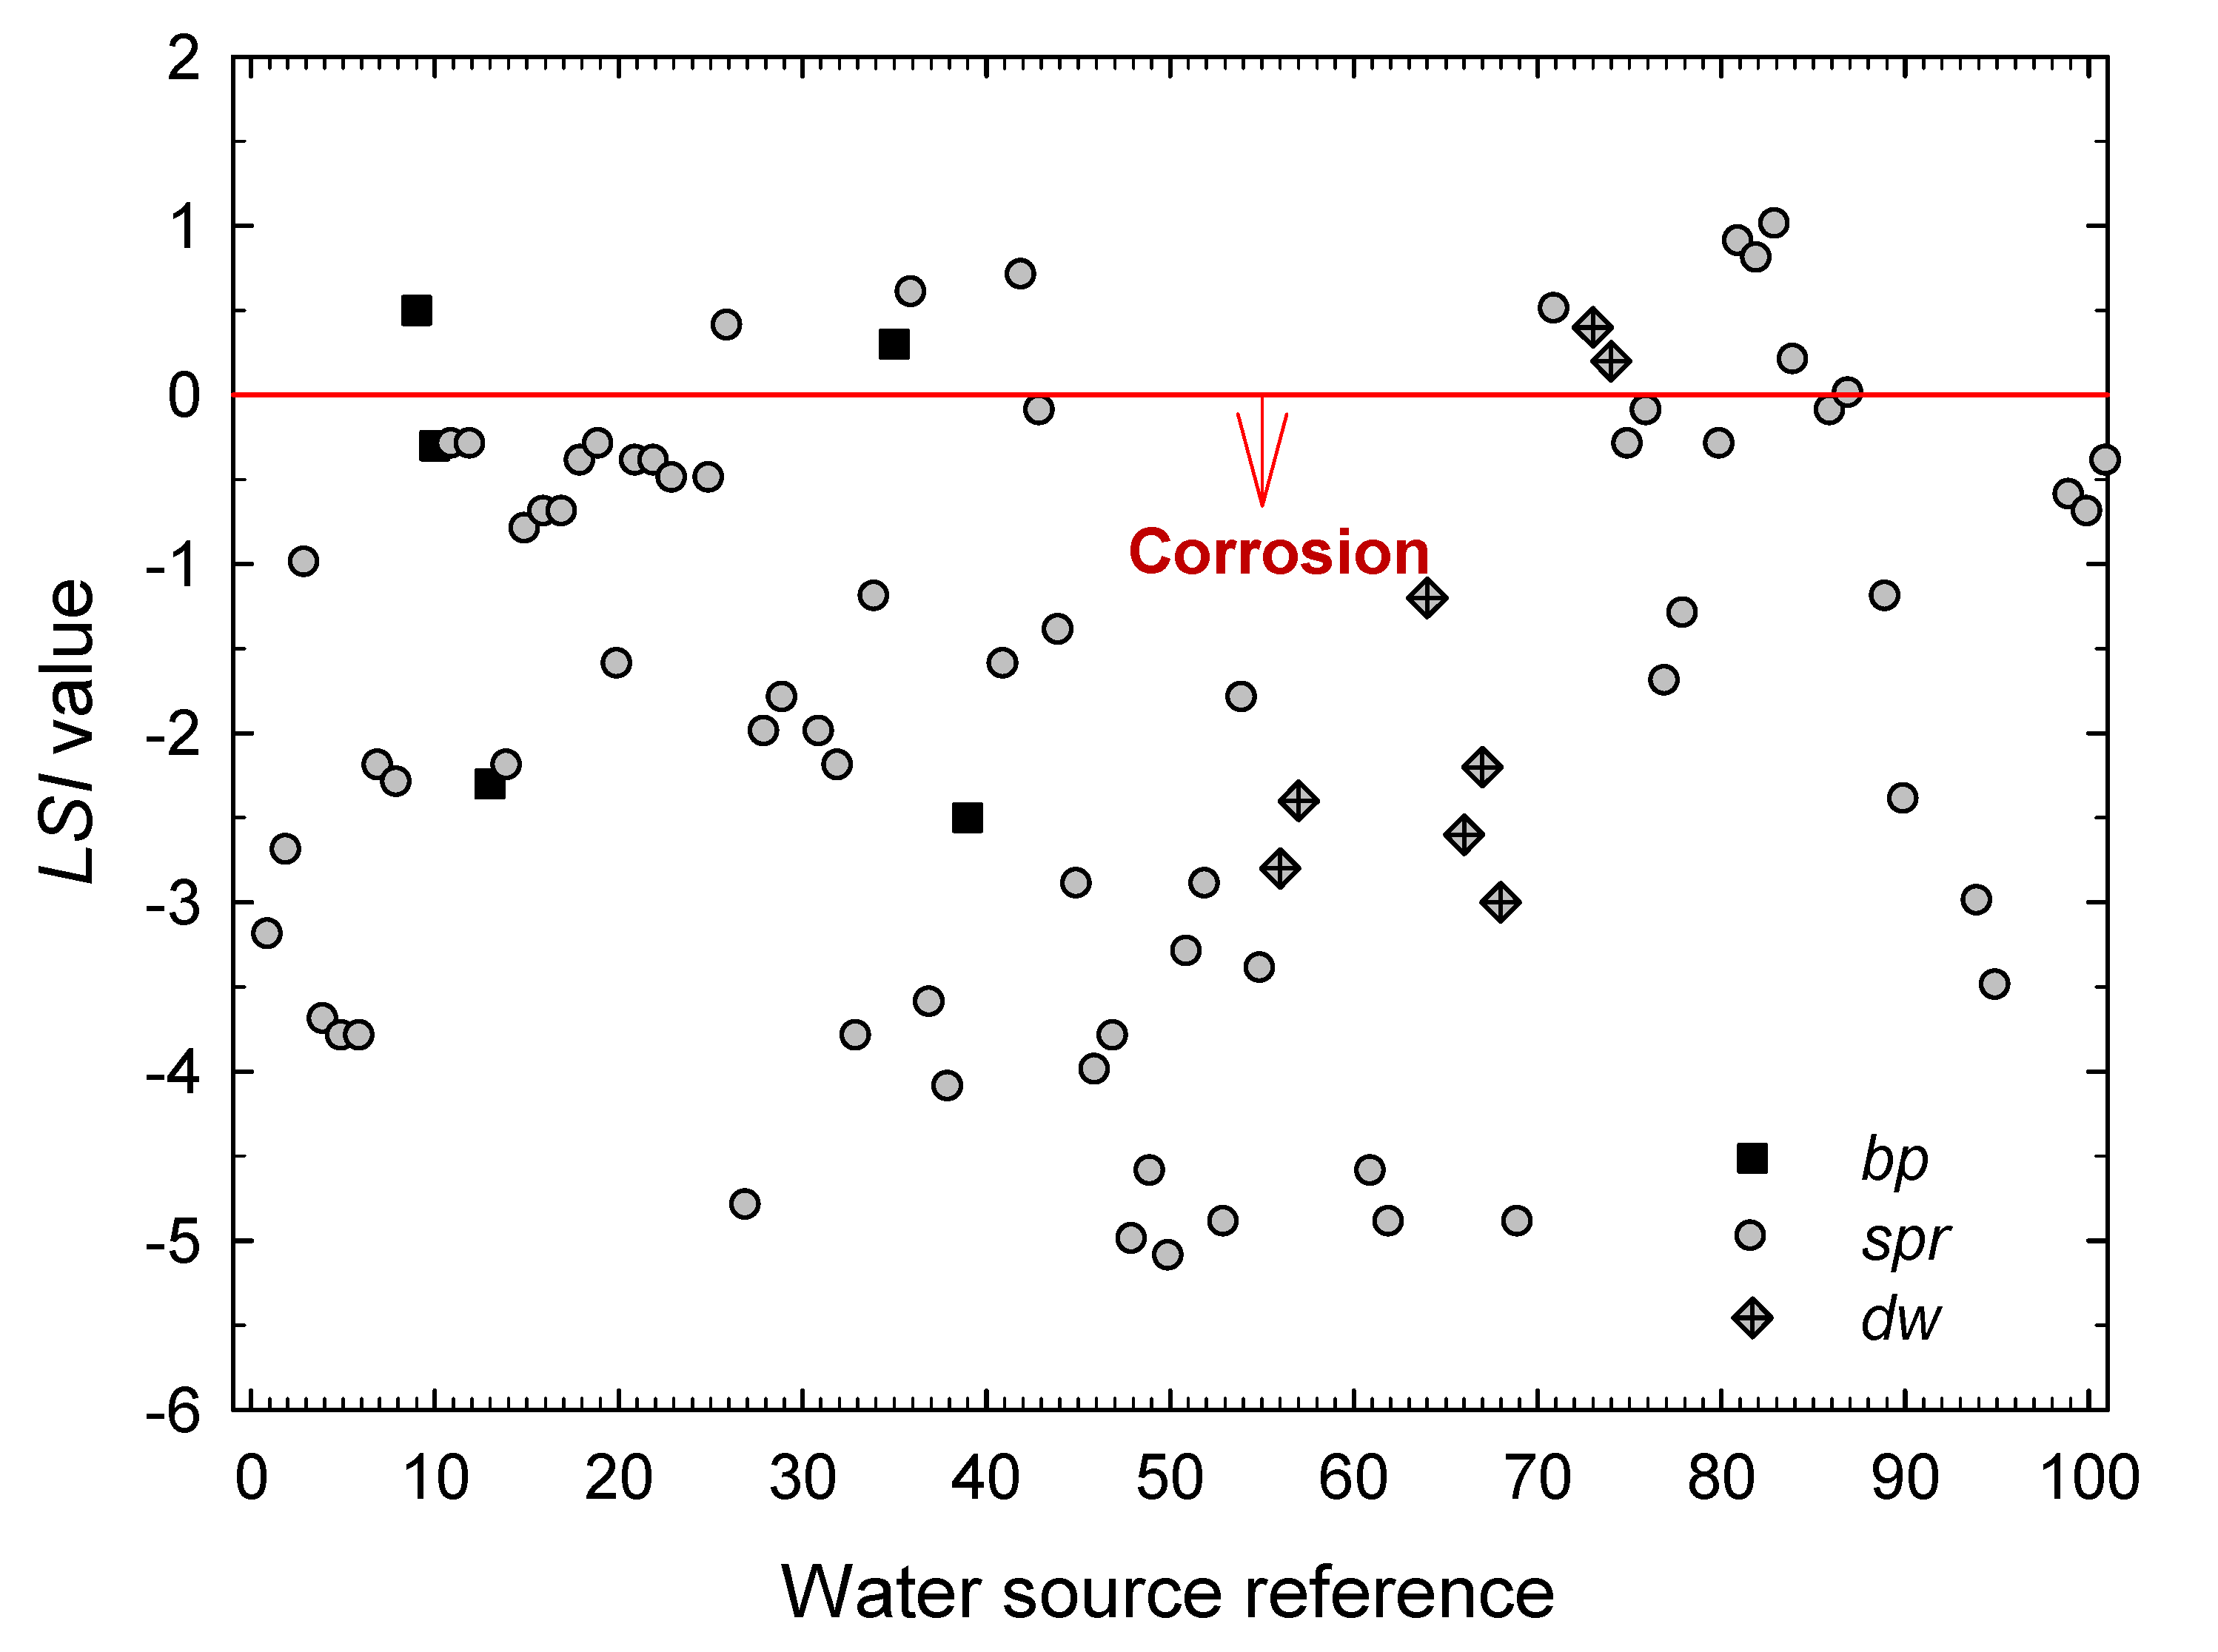
3.1. Estimation of the Corrosive Action of the Natural Waters Using Stability and Scaling Indexes

| Water Source | T/°C | pH | κ/μS·cm−1 | TDS/mg·L−1 | [Ca2+]/mg·L−1 | [SO42−]/mg·L−1 | [Cl−]/mg·L−1 | [HCO3−]/mg·L−1 | LSI | RSI | PSI | LI |
|---|---|---|---|---|---|---|---|---|---|---|---|---|
| AM9 | 99.5 | 7.71 | 2010 | 1274 | 1.4 | 63 | 297.1 | 771 | 0.50 | 6.60 | 5.60 | 0.80 |
| AM10 | 98.8 | 7.06 | 2350 | 1655 | 1.2 | 297 | 303.9 | 679.5 | −0.30 | 7.60 | 6.00 | 1.30 |
| AM13 | 98.5 | 5.76 | 715 | 709 | 10 | 223 | 23.8 | 12.8 | −2.30 | 10.40 | 10.00 | 25.30 |
| AM35 | 98 | 7.29 | 1785 | 1146 | 2.2 | 64 | 219 | 706.4 | 0.30 | 6.80 | 5.40 | 0.60 |
| AM39 | 70 | 5.37 | 301 | 539 | 6.6 | 31 | 22.7 | 89.1 | −2.50 | 10.40 | 8.40 | 0.90 |
| Water Source | T/°C | pH | κ/μS·cm−1 | TDS/mg·L−1 | [Ca2+]/mg·L−1 | [SO42−]/mg·L−1 | [Cl−]/mg·L−1 | [HCO3−]/mg·L−1 | LSI | RSI | PSI | LI |
|---|---|---|---|---|---|---|---|---|---|---|---|---|
| AM1 | 21.1 | 5.27 | 410 | 814 | 9.6 | 46 | 22.7 | 120.8 | −3.20 | 11.70 | 9.40 | 0.60 |
| AM2 | 34.4 | 5.33 | 365 | 619 | 11 | 41 | 19.9 | 159.2 | −2.70 | 10.70 | 8.30 | 0.50 |
| AM3 | 75.1 | 6.16 | 515 | 416 | 8.9 | 7.5 | 36.9 | 256.8 | −1.00 | 8.20 | 6.30 | 0.30 |
| AM4 | 15.9 | 5.09 | 301 | 840.1 | 8.2 | 18 | 20.9 | 92.1 | −3.70 | 12.50 | 10.10 | 0.60 |
| AM5 | 15.6 | 4.95 | 306 | 697.3 | 11 | 33 | 19.5 | 74.4 | −3.80 | 12.50 | 10.20 | 1.00 |
| AM6 | 16.2 | 4.99 | 210 | 767.9 | 11 | 32 | 24.5 | 72 | −3.80 | 12.50 | 10.20 | 1.10 |
| AM7 | 41.3 | 5.57 | 522 | 738.7 | 11 | 13 | 59.3 | 226.9 | −2.20 | 10.00 | 7.50 | 0.50 |
| AM8 | 40.4 | 5.58 | 519 | 728.5 | 9.5 | 11 | 65.3 | 228.1 | −2.30 | 10.10 | 7.70 | 0.60 |
| AM11 | 59.5 | 6.21 | 1356 | 953 | 28 | 16 | 76.3 | 779.6 | −0.30 | 6.80 | 4.20 | 0.20 |
| AM12 | 59.3 | 6.24 | 1271 | 939.8 | 30 | 18 | 76.3 | 767.4 | −0.30 | 6.70 | 4.20 | 0.20 |
| AM14 | 17.5 | 6.77 | 190 | 159.1 | 4.5 | 6.2 | 18.5 | 80.5 | −2.20 | 11.20 | 10.60 | 0.50 |
| AM15 | 41.3 | 6.02 | 1459 | 1117 | 28 | 14 | 91.9 | 786.9 | −0.80 | 7.70 | 4.90 | 0.20 |
| AM16 | 42.7 | 6 | 1490 | 1250 | 30 | 19 | 88.8 | 889.4 | −0.70 | 7.50 | 4.60 | 0.20 |
| AM17 | 42.5 | 6 | 1552 | 1305 | 34 | 16 | 90.1 | 865 | −0.70 | 7.40 | 4.50 | 0.20 |
| AM18 | 47 | 6.14 | 1528 | 1250 | 40 | 9.7 | 96.6 | 932.1 | −0.40 | 6.90 | 4.10 | 0.20 |
| AM19 | 41.2 | 6.25 | 1680 | 1259 | 43 | 12 | 100.8 | 1,091 | −0.30 | 6.80 | 4.00 | 0.20 |
| AM20 | 39 | 5.85 | 587 | 414 | 20.3 | 10.5 | 57.2 | 247.7 | −1.60 | 9.10 | 6.90 | 0.50 |
| AM21 | 34.9 | 6.14 | 1759 | 1551 | 57 | 7 | 66.74 | 1161 | −0.40 | 6.80 | 4.00 | 0.10 |
| AM21 | 34.9 | 6.14 | 1759 | 1551 | 57 | 7 | 66.74 | 1161 | −0.40 | 6.80 | 4.00 | 0.10 |
| AM22 | 39 | 6 | 1,530 | 826.2 | 54 | 8.8 | 62 | 1080 | −0.40 | 6.90 | 3.90 | 0.10 |
| AM23 | 32.9 | 6.02 | 1525 | 1388 | 58 | 14 | 67.1 | 1078 | −0.50 | 7.10 | 4.10 | 0.10 |
| AM25 | 52.3 | 6.06 | 1441 | 1177 | 33 | 9.9 | 73.84 | 780.8 | −0.50 | 7.10 | 4.40 | 0.20 |
| AM26 | 95.8 | 6.88 | 846 | 641.2 | 12.8 | 56 | 26.98 | 485.6 | 0.40 | 6.00 | 4.40 | 2.00 |
| AM27 | 15.4 | 4.69 | 192 | 981 | 5.5 | 2.3 | 16.33 | 29.89 | −4.80 | 14.20 | 12.20 | 1.00 |
| AM28 | 26.5 | 5.85 | 538 | 410.5 | 14.1 | 10 | 38.34 | 247.7 | −2.00 | 9.90 | 7.70 | 0.30 |
| AM29 | 25.9 | 5.8 | 716 | 621.4 | 20 | 9.1 | 40.83 | 378.2 | −1.80 | 9.30 | 6.80 | 0.20 |
| AM31 | 20.4 | 5.78 | 520 | 669.2 | 22 | 8.9 | 31.2 | 253.8 | −2.00 | 9.80 | 7.50 | 0.30 |
| AM32 | 37.5 | 5.61 | 572 | 842 | 8.5 | 7.1 | 33.4 | 294 | −2.20 | 10.10 | 7.50 | 0.20 |
| AM33 | 17.5 | 4.9 | 187 | 681.6 | 11 | 2.4 | 23.1 | 79.3 | −3.80 | 12.40 | 10.00 | 0.50 |
| AM34 | 55.4 | 5.91 | 789 | 747 | 15 | 63 | 35.5 | 377 | −1.20 | 8.40 | 6.00 | 0.40 |
| AM36 | 95.5 | 7.44 | 994 | 733 | 6.1 | 21 | 96.6 | 416 | 0.60 | 6.20 | 5.30 | 0.50 |
| AM37 | 16.1 | 5.28 | 308 | 1353 | 7.8 | 27 | 19.9 | 78.1 | −3.60 | 12.50 | 10.50 | 0.90 |
| AM38 | 16 | 4.89 | 356 | 1196 | 6.3 | 33 | 23.4 | 72 | −4.10 | 13.10 | 10.80 | 1.10 |
| AM41 | 23.4 | 5.48 | 906 | 1524 | 77 | 92 | 80.94 | 336.7 | −1.60 | 8.80 | 6.00 | 0.80 |
| AM42 | 32.8 | 7.58 | 1339 | 801 | 55 | 71 | 177.2 | 483.1 | 0.70 | 6.20 | 5.30 | 0.80 |
| AM43 | 45.9 | 6.46 | 1239 | 895 | 57 | 63 | 133.8 | 599.0 | −0.10 | 6.60 | 4.50 | 0.50 |
| AM44 | 18.6 | 5.71 | 1167 | 1456 | 35 | 15 | 70.65 | 684.4 | −1.40 | 8.60 | 5.60 | 0.20 |
| AM45 | 17.9 | 5.3 | 377 | 979.3 | 16.7 | 2.1 | 26.63 | 170.2 | −2.90 | 11.00 | 8.50 | 0.30 |
| AM46 | 15 | 4.87 | 139 | 949.9 | 8.8 | 6.2 | 16.68 | 67.1 | −4.00 | 12.90 | 10.60 | 0.50 |
| AM47 | 17.4 | 5.2 | 326 | 747.2 | 5.6 | 13 | 47.2 | 65.9 | −3.80 | 12.90 | 10.90 | 1.50 |
| AM48 | 18.1 | 4.66 | 184 | 1010 | 4.1 | 6 | 30.18 | 23.18 | −5.00 | 14.60 | 12.70 | 2.60 |
| AM49 | 15.2 | 4.99 | 158 | 519.8 | 4 | 5.7 | 25.92 | 27.45 | −4.60 | 14.20 | 12.60 | 1.90 |
| AM50 | 18.6 | 4.61 | 179 | 831.3 | 3.6 | 5.6 | 25.2 | 21.96 | −5.10 | 14.80 | 12.90 | 2.30 |
| AM51 | 30 | 5.03 | 295 | 473.2 | 9.5 | 5.6 | 32 | 111 | −3.30 | 11.60 | 9.10 | 0.60 |
| AM52 | 34.7 | 5.12 | 459 | 1077 | 11.1 | 6 | 53.3 | 176.9 | −2.90 | 10.90 | 8.20 | 0.60 |
| AM53 | 19.4 | 4.8 | 194 | 1,070 | 3.7 | 4.6 | 33.02 | 23.18 | −4.90 | 14.50 | 12.80 | 2.70 |
| AM54 | 70.3 | 5.98 | 360 | 386 | 8.9 | 19.5 | 35.14 | 88.45 | −1.80 | 9.50 | 8.10 | 1.00 |
| AM55 | 16.5 | 5.09 | 330 | 1367 | 5.9 | 24 | 18.5 | 275.7 | −3.40 | 11.80 | 8.80 | 0.20 |
| AM61 | 28.8 | 4.66 | 264 | 1041 | 4.6 | 56 | 23.8 | 29.3 | −4.60 | 13.90 | 11.90 | 3.80 |
| AM62 | 36.2 | 4.28 | 182 | 544 | 3.9 | 31 | 20.9 | 28.1 | −4.90 | 14.10 | 11.70 | 2.70 |
| AM69 | 18.5 | 4.65 | 326 | 1061 | 6.5 | 6.7 | 60.4 | 18.3 | −4.90 | 14.40 | 12.70 | 6.10 |
| AM71 | 67.7 | 5.97 | 4,220 | 85,440 | 500 | 1,814 | 4,009 | 553.9 | 0.50 | 5.90 | 2.40 | 16.60 |
| AM75 | 43 | 5.78 | 20,200 | 14,076 | 240 | 797 | 7455 | 596.6 | −0.30 | 6.40 | 3.60 | 23.20 |
| AM76 | 32.8 | 6.36 | 20,140 | 7,953 | 140 | 352 | 4012 | 608.8 | −0.10 | 6.60 | 4.40 | 12.10 |
| AM78 | 16 | 6.86 | 3980 | 2,523 | 44.5 | 184.5 | 1317 | 84.8 | −1.30 | 9.40 | 8.90 | 29.50 |
| AM82 | 39.7 | 6.85 | 10,140 | 6778 | 174 | 228 | 3128 | 963.8 | 0.80 | 5.30 | 3.20 | 5.90 |
| AM83 | 53.2 | 6.37 | 43,100 | 20,932 | 683 | 1,460 | 8821 | 712.5 | 1.00 | 4.40 | 2.10 | 23.90 |
| AM84 | 38.6 | 6.75 | 13,100 | 6754 | 83 | 460 | 3,419 | 754 | 0.20 | 6.30 | 4.30 | 8.60 |
| AM86 | 24.1 | 6.74 | 1234 | 826.7 | 67 | 6.5 | 47.6 | 707.6 | −0.10 | 6.90 | 4.90 | 0.10 |
| AM87 | 46.5 | 6.68 | 1244 | 745.9 | 47 | 50 | 95.8 | 577.1 | 0.00 | 6.60 | 4.70 | 0.40 |
| AM89 | 20.5 | 5.69 | 10,210 | 5,761 | 91 | 435 | 3,220 | 658.8 | −1.20 | 8.00 | 5.10 | 9.20 |
| AM90 | 20.9 | 5.79 | 1334 | 1118 | 16 | 49 | 300.3 | 154.9 | −2.40 | 10.50 | 8.60 | 3.70 |
| AM94 | 15.5 | 5.76 | 203 | 220.9 | 9 | 3.5 | 23.1 | 72.4 | −3.00 | 11.80 | 10.30 | 0.60 |
| AM95 | 15 | 5.35 | 192 | 322.3 | 9.2 | 4 | 21.6 | 61 | −3.50 | 12.40 | 10.6 | 0.70 |
| AM99 | 35.1 | 6.09 | 6570 | 4310 | 111 | 194 | 2,016 | 426.4 | −0.60 | 7.30 | 5.00 | 8.70 |
| AM100 | 18 | 6.05 | 9440 | 6,316 | 195 | 95.94 | 3,337 | 405.0 | −0.70 | 7.50 | 5.20 | 14.50 |
| Water Source | T/°C | pH | κ/μS·cm−1 | TDS/mg·L−1 | [Ca2+]/mg·L−1 | [SO42−]/mg·L−1 | [Cl−]/mg·L−1 | [HCO3−]/mg·L−1 | LSI | RSI | PSI | LI |
|---|---|---|---|---|---|---|---|---|---|---|---|---|
| AM56 | 22.5 | 5.27 | 537 | 1292 | 10.8 | 5 | 18.8 | 279.4 | −2.80 | 10.80 | 8.00 | 0.10 |
| AM57 | 20.3 | 5.48 | 575 | 795.9 | 12.3 | 3.4 | 17.8 | 347.7 | −2.40 | 10.40 | 7.60 | 0.10 |
| AM64 | 31.1 | 6.36 | 2090 | 1395 | 20 | 71 | 446.9 | 361.1 | −1.20 | 8.70 | 6.80 | 2.40 |
| AM66 | 17 | 6.15 | 403 | 400.2 | 8.2 | 9.8 | 32.31 | 87.84 | −2.60 | 11.30 | 10.10 | 0.80 |
| AM67 | 27.5 | 5.6 | 590 | 728.8 | 20 | 5.7 | 55.38 | 229.4 | −2.20 | 9.90 | 7.50 | 0.40 |
| AM68 | 26 | 5.27 | 394 | 949.1 | 12.2 | 13.3 | 51.5 | 117.7 | −3.00 | 11.30 | 9.00 | 0.90 |
| AM73 | 58 | 6.1 | 27,000 | 19,299 | 310 | 1120 | 10.50 | 608 | 0.40 | 5.40 | 2.80 | 32.10 |
| AM74 | 57 | 6.2 | 28,000 | 19,672 | 317 | 1118 | 10.63 | 617 | 0.20 | 5.80 | 3.80 | 62.20 |
| AM80 | 27.5 | 7.82 | 1153 | 564.3 | 25 | 29 | 277.2 | 81.7 | −0.30 | 8.40 | 8.90 | 6.30 |
| AM81 | 36.3 | 6.4 | 42,000 | 29,127 | 630 | 1450 | 16,200 | 1226 | 0.90 | 4.70 | 2.00 | 24.20 |
| AM101 | 39 | 6.04 | 7440 | 5102 | 183 | 226.6 | 2336 | 402.6 | −0.40 | 6.80 | 4.50 | 10.70 |


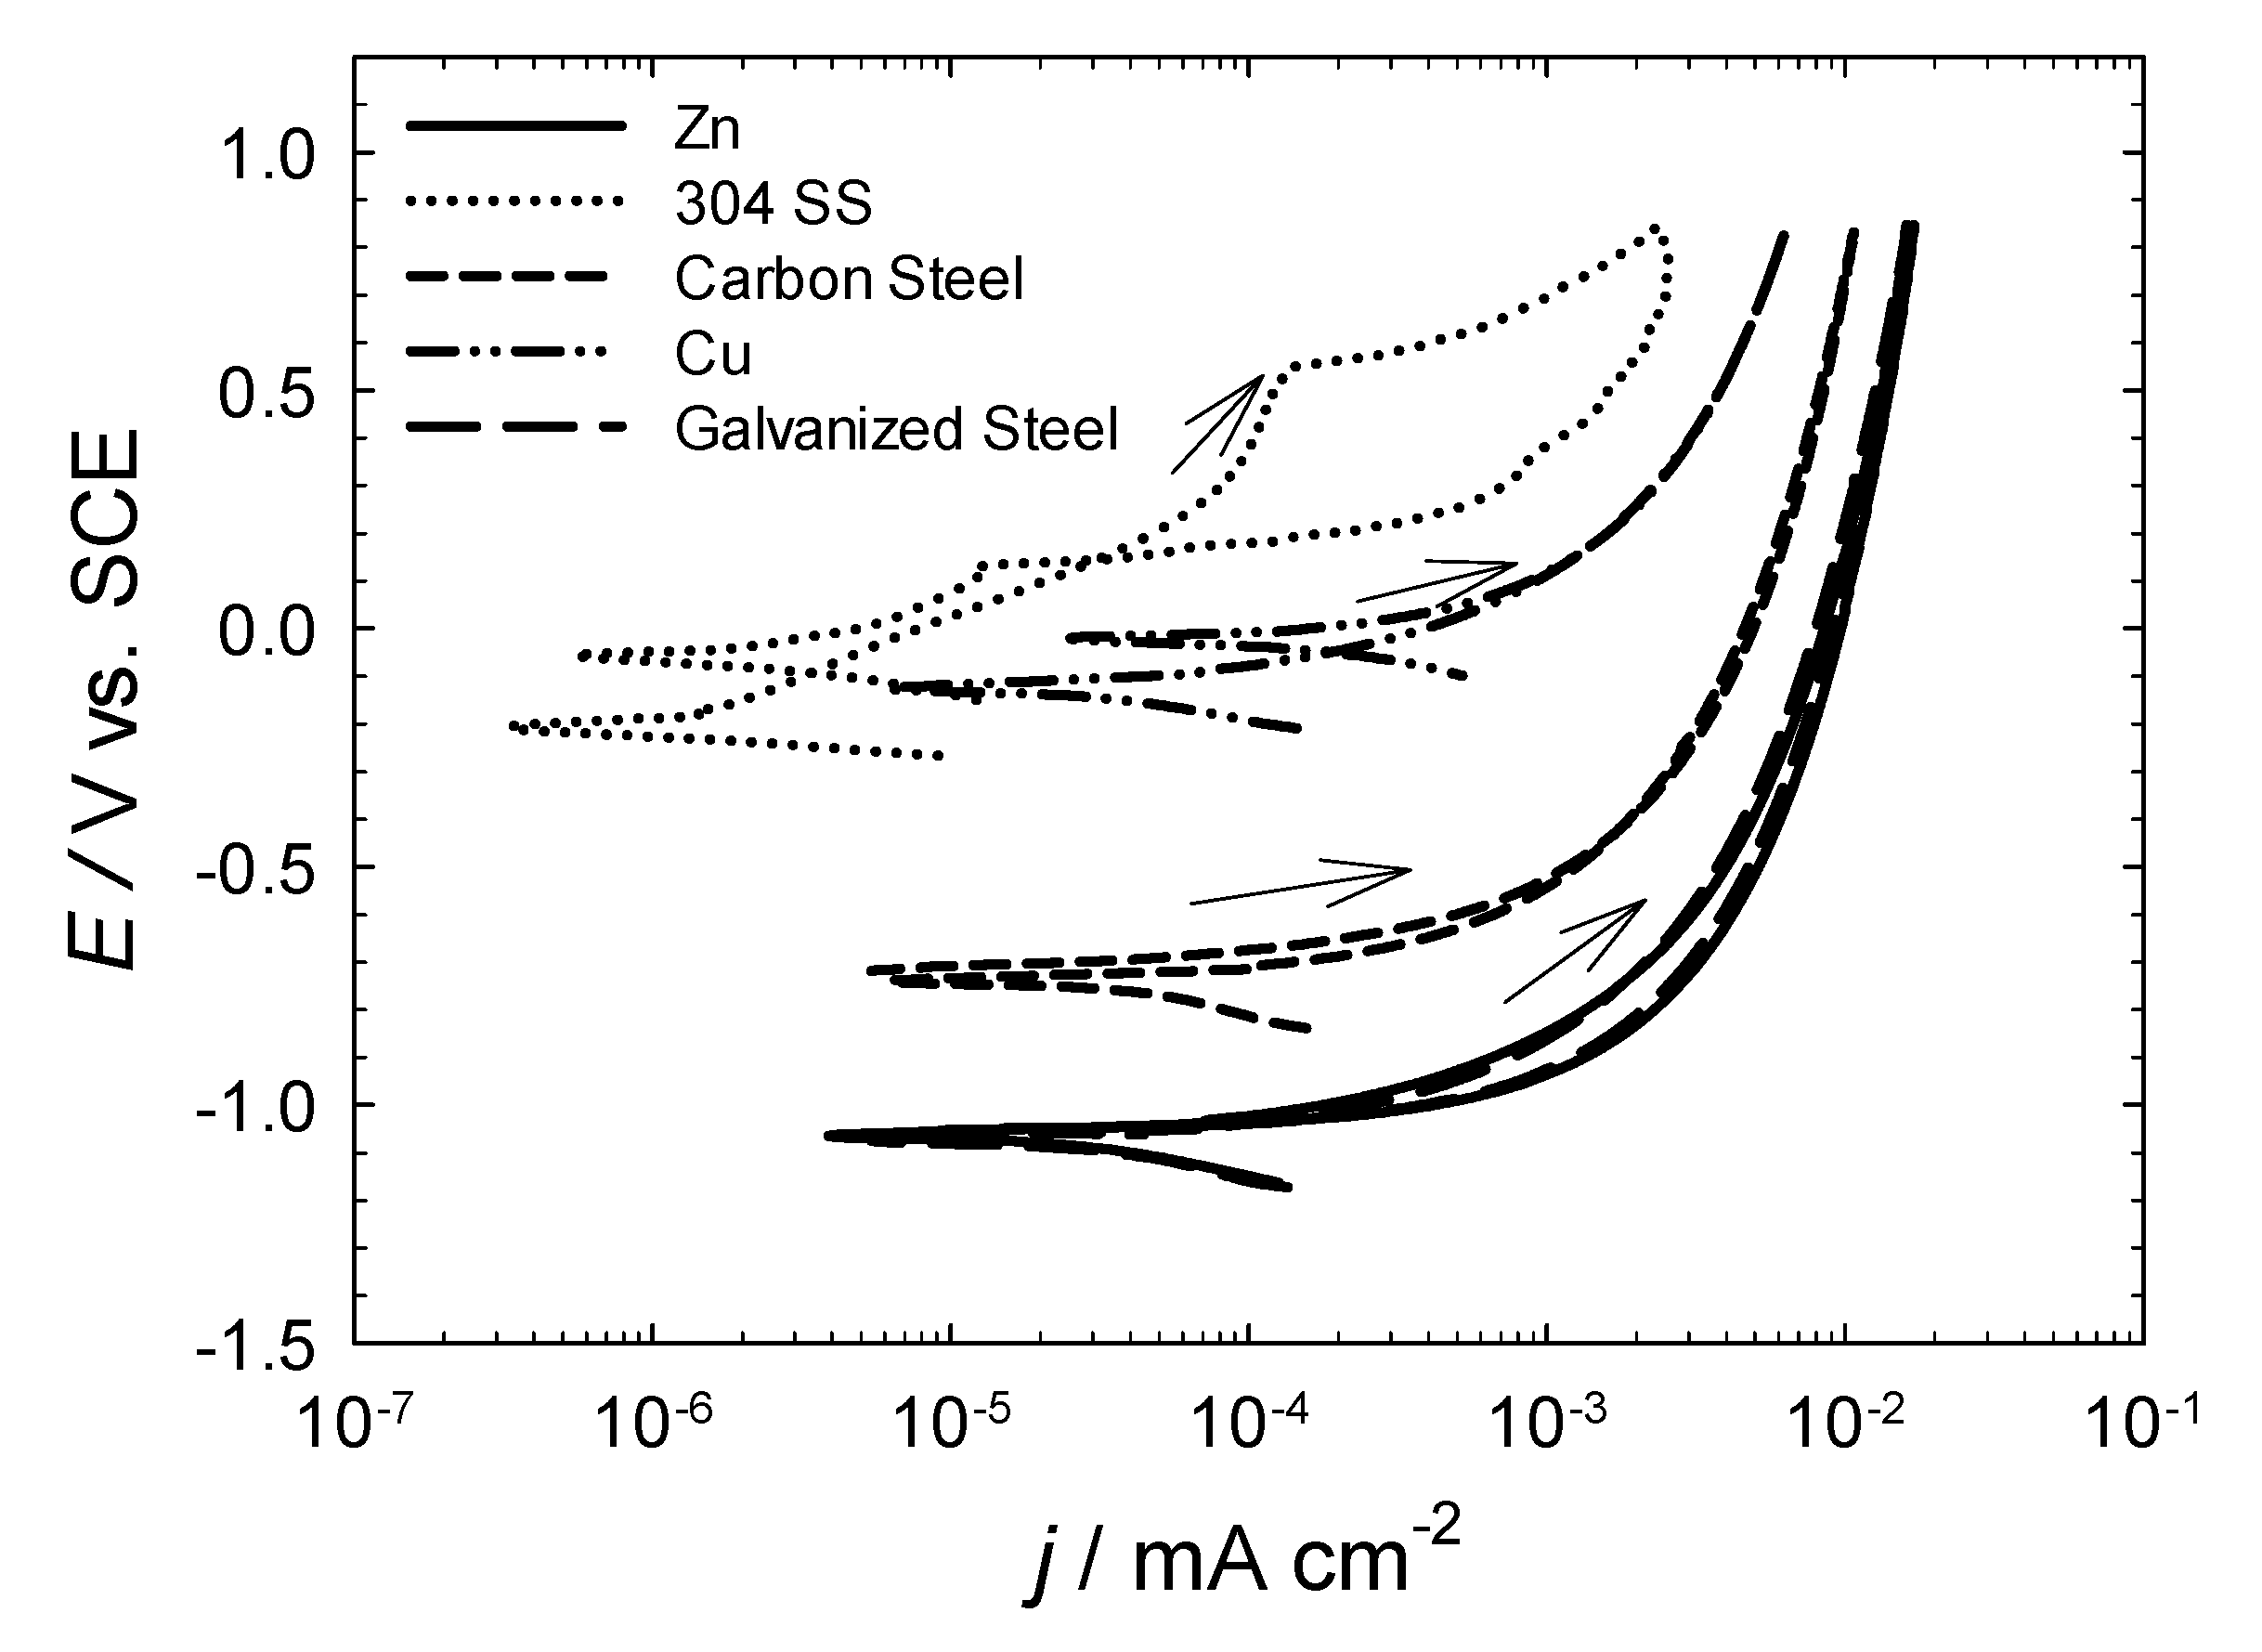
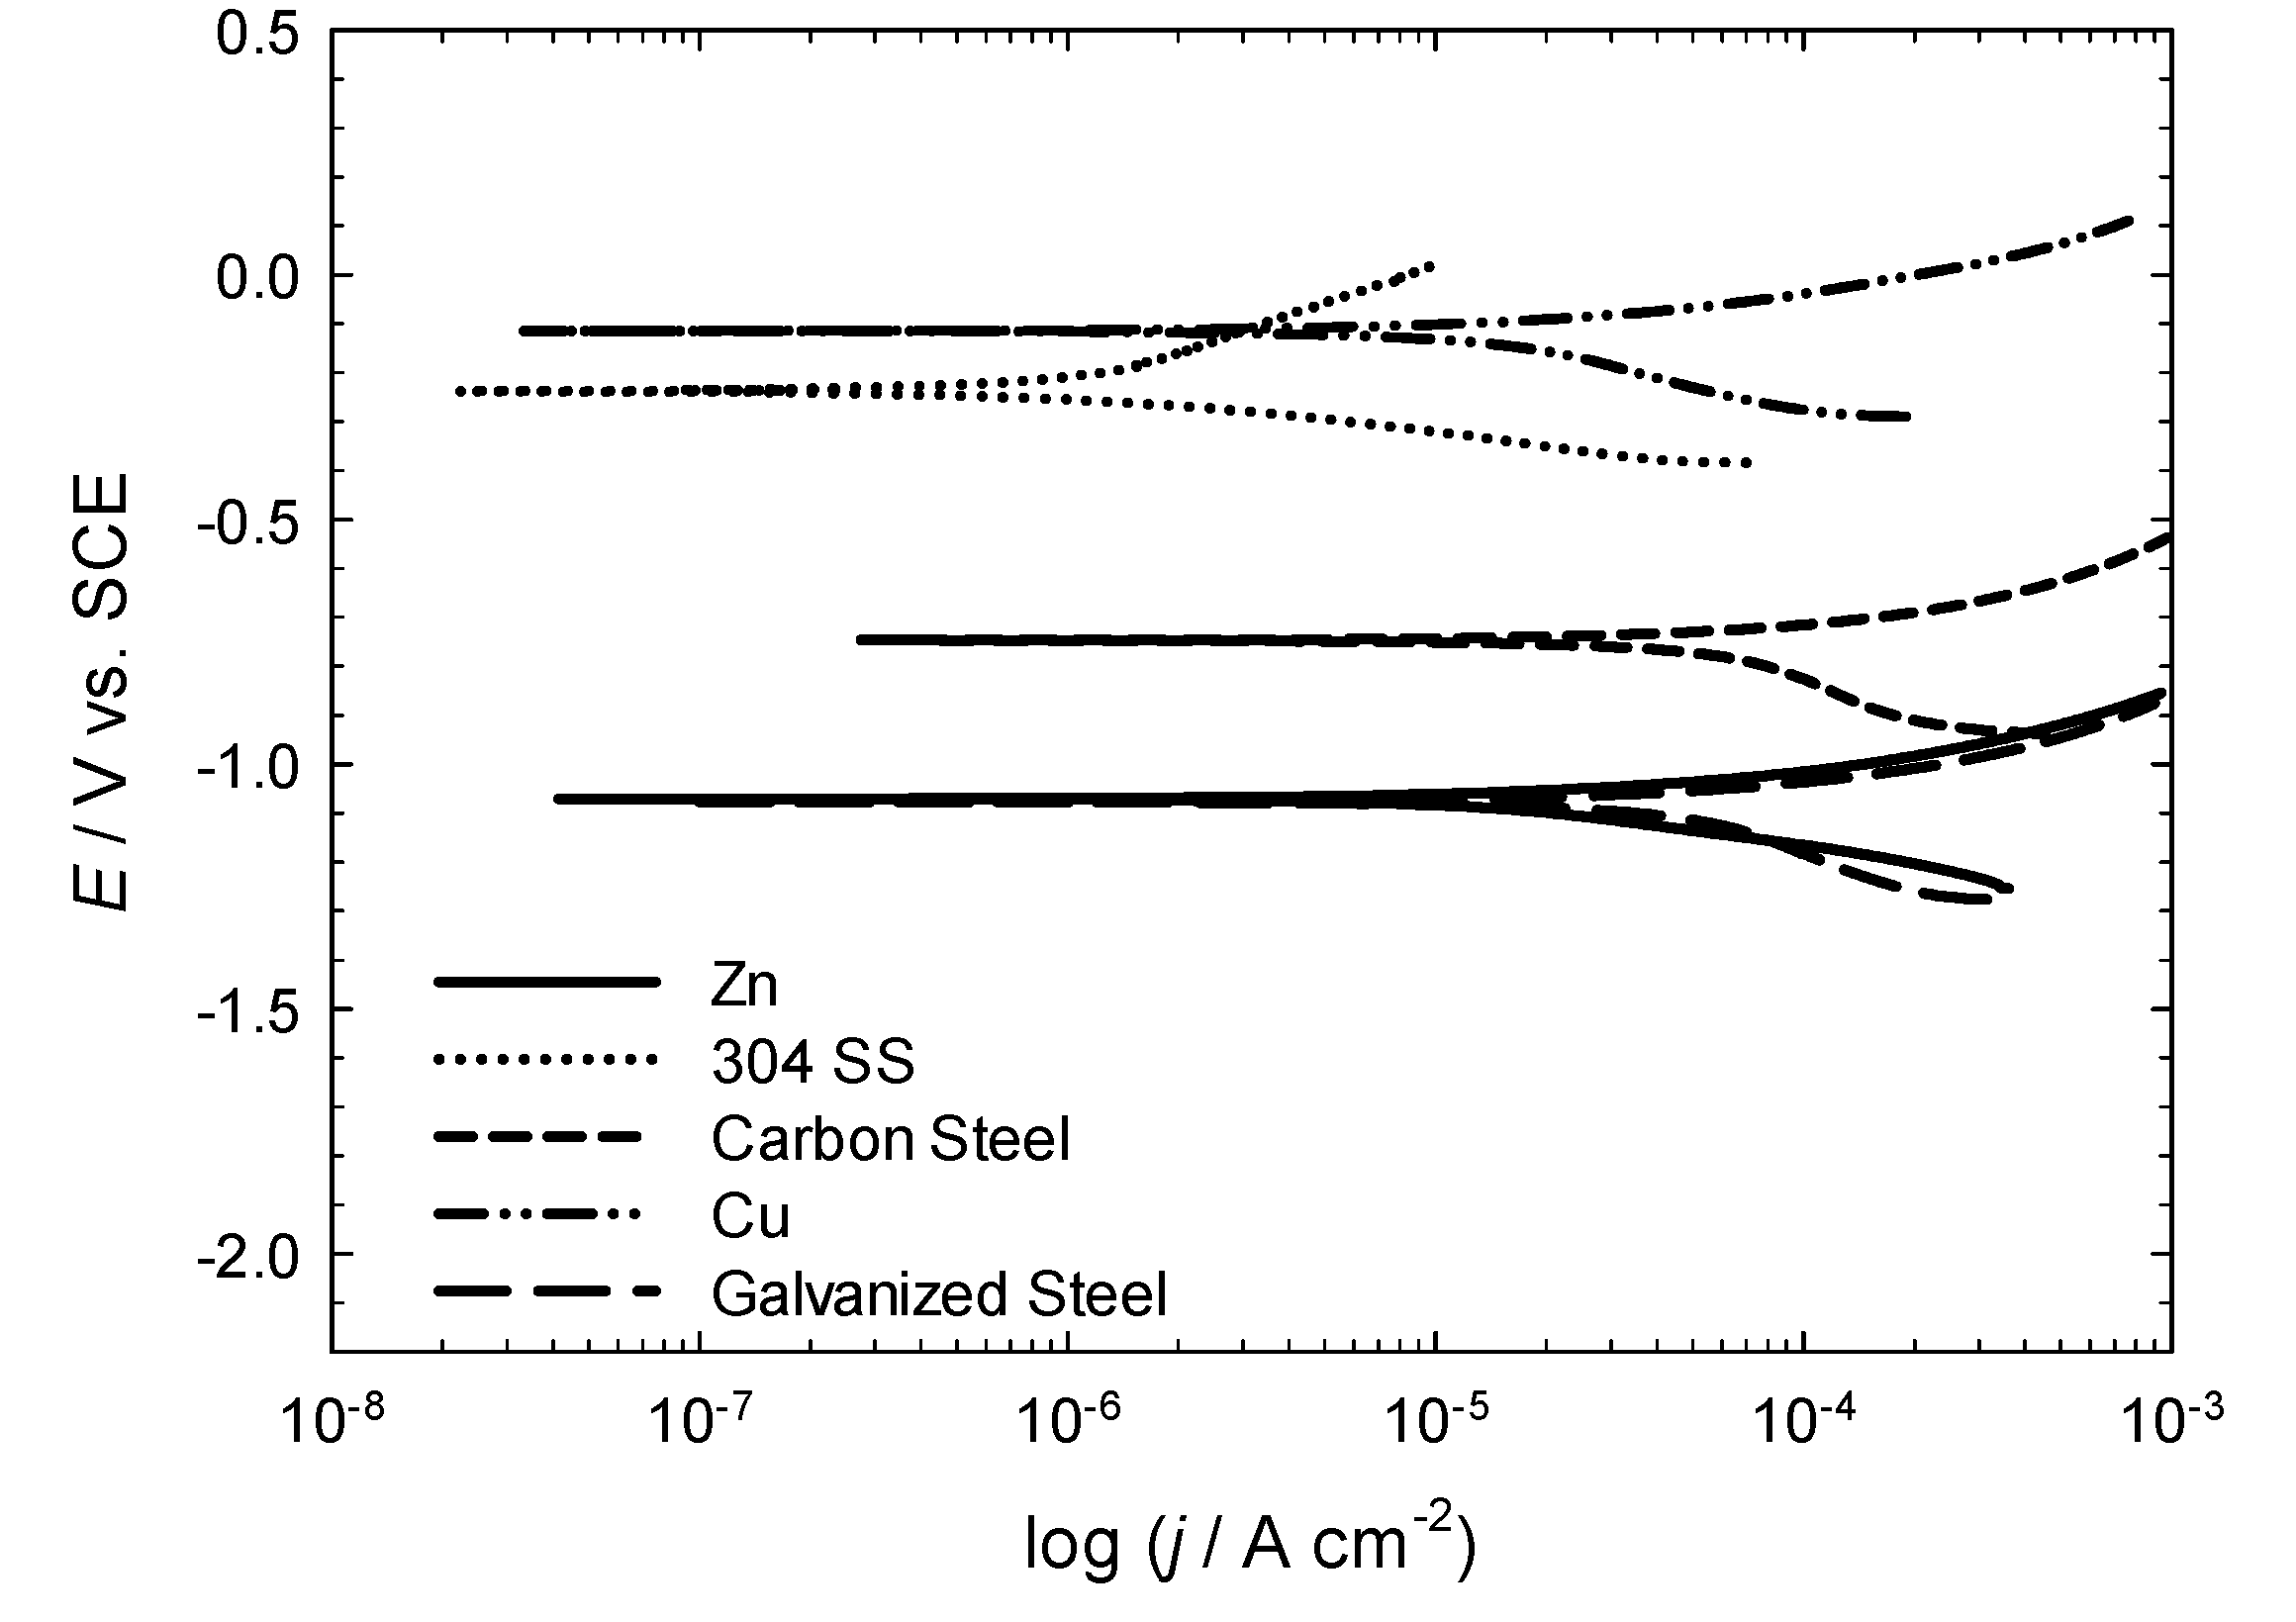
3.2. Determination of the Corrosive Action of the Natural Waters Using Electrochemical Measurements

| Metal | Water Source AM3 | ||||
|---|---|---|---|---|---|
| Ecor/mV vs. SCE | jcor/μA·cm−2 | βa/mV | −βc/mV | rcor/mm·year−1 | |
| Zn | −1097.30 | 47.12 | 124.49 | 169.76 | 0.12 |
| Cu | −107.56 | 5.53 | 68.72 | 142.62 | 1.07 × 10⁻² |
| Cr–Ni | - | - | - | - | - |
| Brass | −118.87 | 5.73 | 54.32 | 112.38 | 1.10 × 10⁻² |
| Carbon Steel | −733.40 | 53.71 | 99.94 | 278.44 | 0.1 |
| Galvanized Steel | −1035.90 | 7.0 | 81.17 | 154.5 | 1.75 × 10⁻² |
| 304 SS | −112.18 | 0.33 | 217.16 | 85.83 | 5.74 × 10⁻⁴ |
| 316L SS | −102.42 | 0.56 | 100.88 | 96.12 | 9.80 × 10⁻⁴ |
| Water source AM9 | |||||
| Zn | −1022.02 | 12.58 | 70.12 | 245.03 | 3.14 × 10⁻² |
| Cu | −142.64 | 10.32 | 83.2 | 271.62 | 1.99 × 10⁻² |
| Cr–Ni | −278.99 | 1.03 | 230.56 | 78.05 | 1.85 × 10⁻³ |
| Brass | −182.76 | 8.28 | 56.03 | 115.62 | 1.59 × 10⁻² |
| Carbon Steel | −777.16 | 34.32 | 62.78 | 335.21 | 6.63 × 10⁻² |
| Galvanized Steel | −1006.10 | 52.04 | 114.0 | 647.54 | 0.13 |
| 304 SS | −276.44 | 0.99 | 304.83 | 72.2 | 1.71 × 10⁻³ |
| 316L SS | −195.30 | 5.37 × 10⁻² | 181.02 | 46.29 | 9.32 × 10⁻⁵ |
| Water source AM34 | |||||
| Zn | −1075.74 | 15.44 | 65.76 | 104.77 | 3.85 × 10⁻² |
| Cu | −112.05 | 10.66 | 60.71 | 136.54 | 2.06 × 10⁻² |
| Cr–Ni | - | - | - | - | - |
| Brass | - | - | - | - | - |
| Carbon Steel | −750.63 | 50.29 | 97.01 | 221.34 | 9.72 × 10⁻² |
| Galvanized Steel | −1078.73 | 30.32 | 71.36 | 140.93 | 7.57 × 10⁻² |
| 304 SS | −228.79 | 1.11 | 257.16 | 92.09 | 1.92 × 10⁻³ |
4. Conclusions
- The extension of the stability and scaling indexes commonly employed in the characterization of cooling waters in the industry to the characterization of natural waters from geothermal origin is satisfactory.
- The boiling pools, springs and drained wells present in the Archipelago of the Azores are mostly corrosive for structural metallic materials, as seen from the values obtained for the Langelier Saturation, Ryznar Stability, Puckorius Scaling, and Larson–Skold Indexes.
- According to the Langelier Saturation Index, more than 83% of the waters promote corrosion. By type of water, it has been found that the ratio of samples with corrosive characteristics amounts 87.7% for waters from springs (spr), 60% for waters from boiling pools (bp), and 72.7% of those from drained wells (dw). Yet, the values obtained for the hot springs (bp) must be taken only as indications because the high temperatures of these waters would require a more detailed study of their aggressiveness against those metals most commonly used for storing and piping.
- The preliminary electrochemical characterization of the corrosion rates of various metals of a wide industrial use in three water sources from São Miguel Island shows that the measured corrosion rates are very high for all the metals except 304 and 316 L stainless steels and the Cr–Ni alloy.
- These results provide a basis to initiate a combined electrochemical investigation of the aggressiveness of these natural waters both at higher temperatures as well as using condensed water collected from the boiling pools.
Acknowledgments
Author Contributions
Conflicts of Interest
References
- Aksoy, N.; Şimşek, C.; Gunduz, O. Groundwater contamination mechanism in a geothermal field: A case study. J. Contam. Hydrol. 2009, 103, 13–28. [Google Scholar] [CrossRef] [PubMed]
- Guo, Q.; Wang, X.; Liu, W. Hydrogeochemistry and environmental impact of geothermal waters from Yangyi of Tibet, China. J. Volcanol. Geotherm. Res. 2009, 180, 9–20. [Google Scholar] [CrossRef]
- Aiuppa, A.; Allard, P.; D’Alessandro, W.; Michel, A.; Parello, F.; Treuil, M.; Valenza, M. Mobility and fluxes of major, minor and trace metals during basalt weathering and groundwater transport at Mt. Etna Volcano (Sicily). Geochim. Cosmochim. Acta 2000, 64, 1827–1841. [Google Scholar] [CrossRef]
- Custódio, E. Groundwater characteristics and problems in volcanic rock terrains. In Isotopic Techniques in the Study of the Hydrology of Fractures and Fissured Rocks; IAEA: Vienna, Austria, 1989; pp. 87–137. [Google Scholar]
- Cruz, J.V.; Silva, M.O. Groundwater salinisation in Pico Island (Azores, Portugal): Origin and mechanisms. Environ. Geol. 2000, 39, 1181–1189. [Google Scholar] [CrossRef]
- Cruz, J.V.; Silva, M.O. Hydrogeologic framework of the Pico Island (Azores, Portugal). Hydrogeol. J. 2001, 9, 177–189. [Google Scholar] [CrossRef]
- Kim, Y.; Lee, K.-S.; Koh, D.-C.; Lee, D.-H.; Lee, S.-G.; Park, W.-B.; Koh, G.-W.; Woo, N.-C. Hydrogeochemical and isotopic evidence of groundwater salinization in a coastal aquifer: A case study in Jeju volcanic island, Korea. J. Hydrol. 2003, 270, 282–294. [Google Scholar] [CrossRef]
- Brusca, L.; Aiuppa, A.; D’Alessandro, W.; Parello, F.; Allard, P.; Michel, A. Geochemical mapping of magmatic gas-water-rock interactions in the aquifer of Mount Etna volcano. J. Volcanol. Geotherm. Res. 2001, 108, 199–218. [Google Scholar] [CrossRef]
- Federico, C.; Aiuppa, A.; Allard, P.; Bellomo, S.; Jean-Baptiste, P.; Parello, F.; Valenza, M. Magma-derived gas influx and water-rock interaction in the volcanic aquifer of Mt. Vesuvius, Italy. Geochim. Cosmochim. Acta 2002, 66, 963–981. [Google Scholar] [CrossRef]
- Cruz, J.V.; Coutinho, R.M.; Carvalho, M.R.; Oskarsson, N.; Gislason, S.R. Chemistry of waters from Furnas volcano, São Miguel, Azores: Fluxes of volcanic carbon dioxide and leached material. J. Volcanol. Geotherm. Res. 1999, 92, 151–167. [Google Scholar] [CrossRef]
- Cruz, J.V.; França, Z. Mineral and thermal waters in the Azores archipelago (Portugal): Geological setting and hydrogeochemical outline. In Proceedings of the XXXI IAH Congress—New Approaches to Characterising Groundwater Flow, Munich, Germany, 10–14 September 2001; Seiler, K.-P., Wohnlich, S., Eds.; Balkema Publishers: Lisse, The Netherlands, 2001; pp. 477–481. [Google Scholar]
- Cruz, J.V. Groundwater and volcanoes: Examples from the Azores archipelago. Environ. Geol. 2003, 44, 343–355. [Google Scholar] [CrossRef]
- Cruz, J.V.; França, Z. Hydrogeochemistry of thermal and mineral springs of the Azores archipelago (Portugal). J. Volcanol. Geotherm. Res. 2006, 151, 382–398. [Google Scholar] [CrossRef]
- Carvalho, M.R.; Forjaz, V.H.; Almeida, C. Chemical composition of deep hydrothermal fluids in the Ribeira Grande geothermal field (São Miguel, Azores). J. Volcanol. Geotherm. Res. 2006, 156, 116–134. [Google Scholar] [CrossRef]
- Morell, I.; Pulido Bosch, A.; Daniele, L.; Cruz, J.V. Chemical and isotopic assessment in volcanic thermal waters: Cases of Ischia (Italy) and São Miguel (Azores, Portugal). Hydrol. Process. 2008, 22, 4386–4399. [Google Scholar] [CrossRef]
- Cruz, J.V.; Freire, P.; Costa, A. Mineral waters characterization in the Azores archipelago (Portugal). J. Volcanol. Geotherm. Res. 2010, 90, 353–364. [Google Scholar] [CrossRef]
- Langelier, W.F. Chemical equilibria in water treatment. J. Am. Water Works Assoc. 1946, 38, 169–178. [Google Scholar]
- Ryznard, J.W. A new index for determining amount of calcium carbonate scale formed by a water. J. Am. Water. Works Assoc. 1944, 36, 472–486. [Google Scholar]
- Puckorius, P.R.; Loretitsch, G.R. Cooling water scale and scale indices: What they mean—How to use them effectively—How they can cut treatment costs, IWC 99–47. In Proceedings of the International Water Conference, Pittsburgh, PA, USA, 18 October 1999; pp. 378–387.
- Puckorius, R.; Brooke, J.M. A new practical index for calcium carbonate scale prediction in cooling systems. Corrosion 1991, 47, 280–284. [Google Scholar] [CrossRef]
- Larson, T.E.; Skold, R.V. Laboratory Studies Relating Mineral Quality of Water to Corrosion of Steel and Cast Iron; ISWS C-71; Illinois State Water Survey: Champaign, IL, USA, 1958; pp. 43–46. [Google Scholar]
- W-index-Spreadsheet, Marvin Silbert and Associates. Available online: http://www.silbert.org/main_msa.html (accessed on 4 March 2015).
- Tait, W.S. An Introduction to Electrochemical Corrosion Testing for Practicing Engineers and Scientists; PairODocs Publications: Racine, WI, USA, 1994; pp. 43–77. [Google Scholar]
© 2015 by the authors; licensee MDPI, Basel, Switzerland. This article is an open access article distributed under the terms and conditions of the Creative Commons Attribution license (http://creativecommons.org/licenses/by/4.0/).
Share and Cite
Vasconcelos, H.C.; Fernández-Pérez, B.M.; González, S.; Souto, R.M.; Santana, J.J. Characterization of the Corrosive Action of Mineral Waters from Thermal Sources: A Case Study at Azores Archipelago, Portugal. Water 2015, 7, 3515-3530. https://doi.org/10.3390/w7073515
Vasconcelos HC, Fernández-Pérez BM, González S, Souto RM, Santana JJ. Characterization of the Corrosive Action of Mineral Waters from Thermal Sources: A Case Study at Azores Archipelago, Portugal. Water. 2015; 7(7):3515-3530. https://doi.org/10.3390/w7073515
Chicago/Turabian StyleVasconcelos, Helena Cristina, Bibiana María Fernández-Pérez, Sergio González, Ricardo Manuel Souto, and Juan José Santana. 2015. "Characterization of the Corrosive Action of Mineral Waters from Thermal Sources: A Case Study at Azores Archipelago, Portugal" Water 7, no. 7: 3515-3530. https://doi.org/10.3390/w7073515
APA StyleVasconcelos, H. C., Fernández-Pérez, B. M., González, S., Souto, R. M., & Santana, J. J. (2015). Characterization of the Corrosive Action of Mineral Waters from Thermal Sources: A Case Study at Azores Archipelago, Portugal. Water, 7(7), 3515-3530. https://doi.org/10.3390/w7073515