3.1. DEM Resolution Effects for Ideal Surfaces
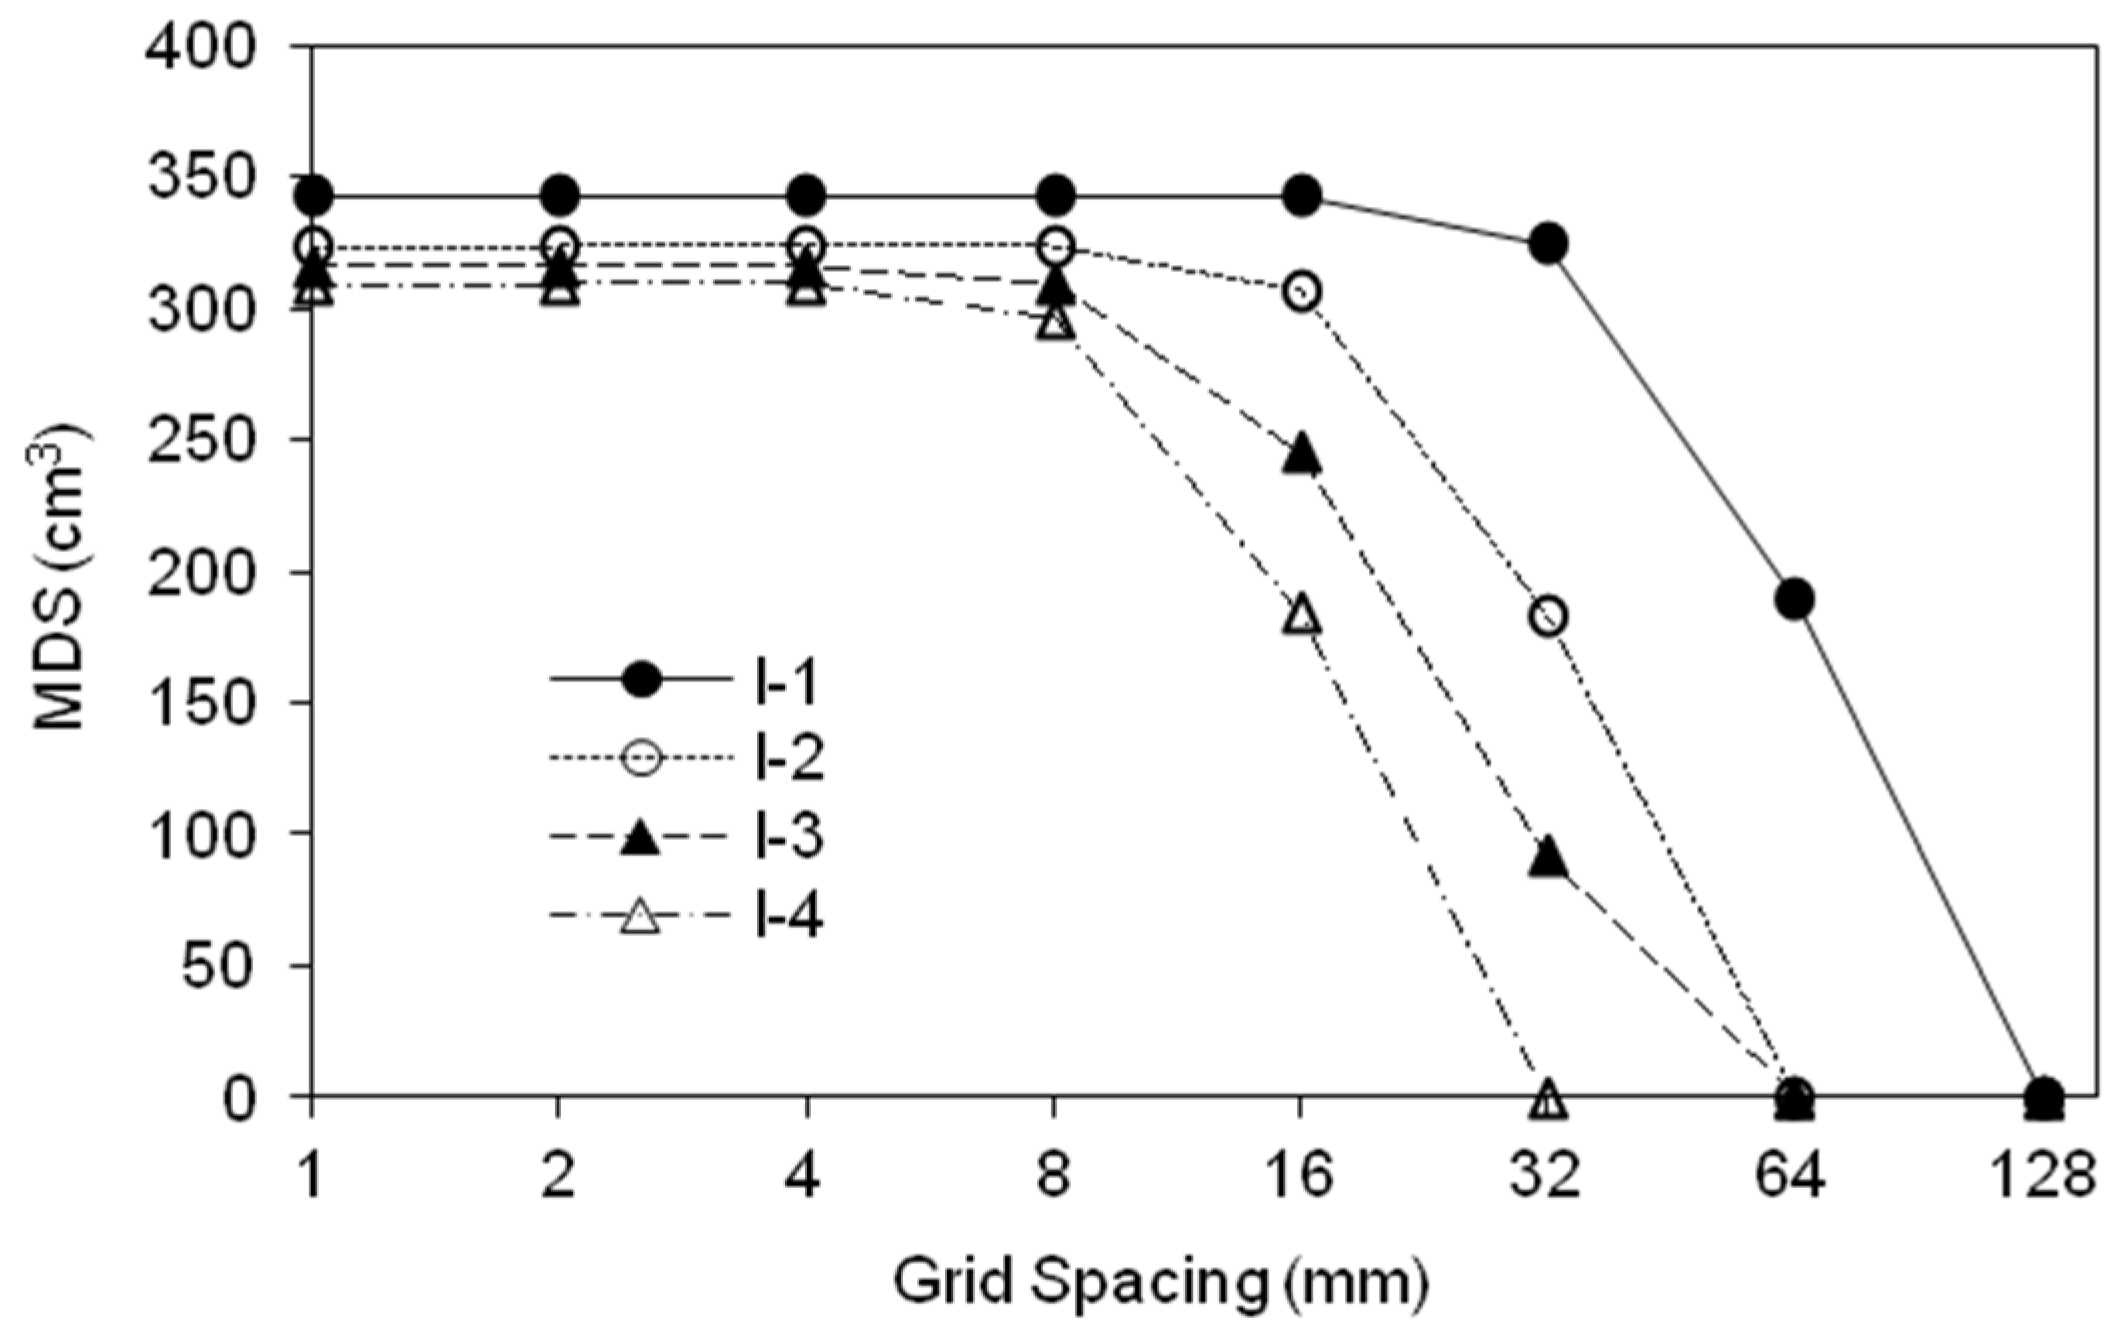
The relationships between grid size and MDS for Surfaces I-1–I-4 are shown in
Figure 4. The MDS values were constant for smaller grid sizes (∆
d < 4 mm) for all four surfaces. That is, there was a range of grid sizes, within which MDS did not change or only had minor changes. Such a range of grid sizes could vary, depending on the surface topographic characteristics. This information can be used to determine the “best” representative DEM resolution for hydrologic modeling and analysis. As the grid size increased, different surfaces exhibited dissimilar MDS decreasing patterns due to the changes in DEM representations and the loss of surface topographic details (
Figure 4). Eventually, the MDS of a surface decreased to zero at a certain grid size (
Figure 4). The grid size corresponding to the zero MDS depended on the surface topographic characteristics (e.g., number, shape and size of puddles). As expected, the surfaces with smaller depressions (e.g., Surface I-4,
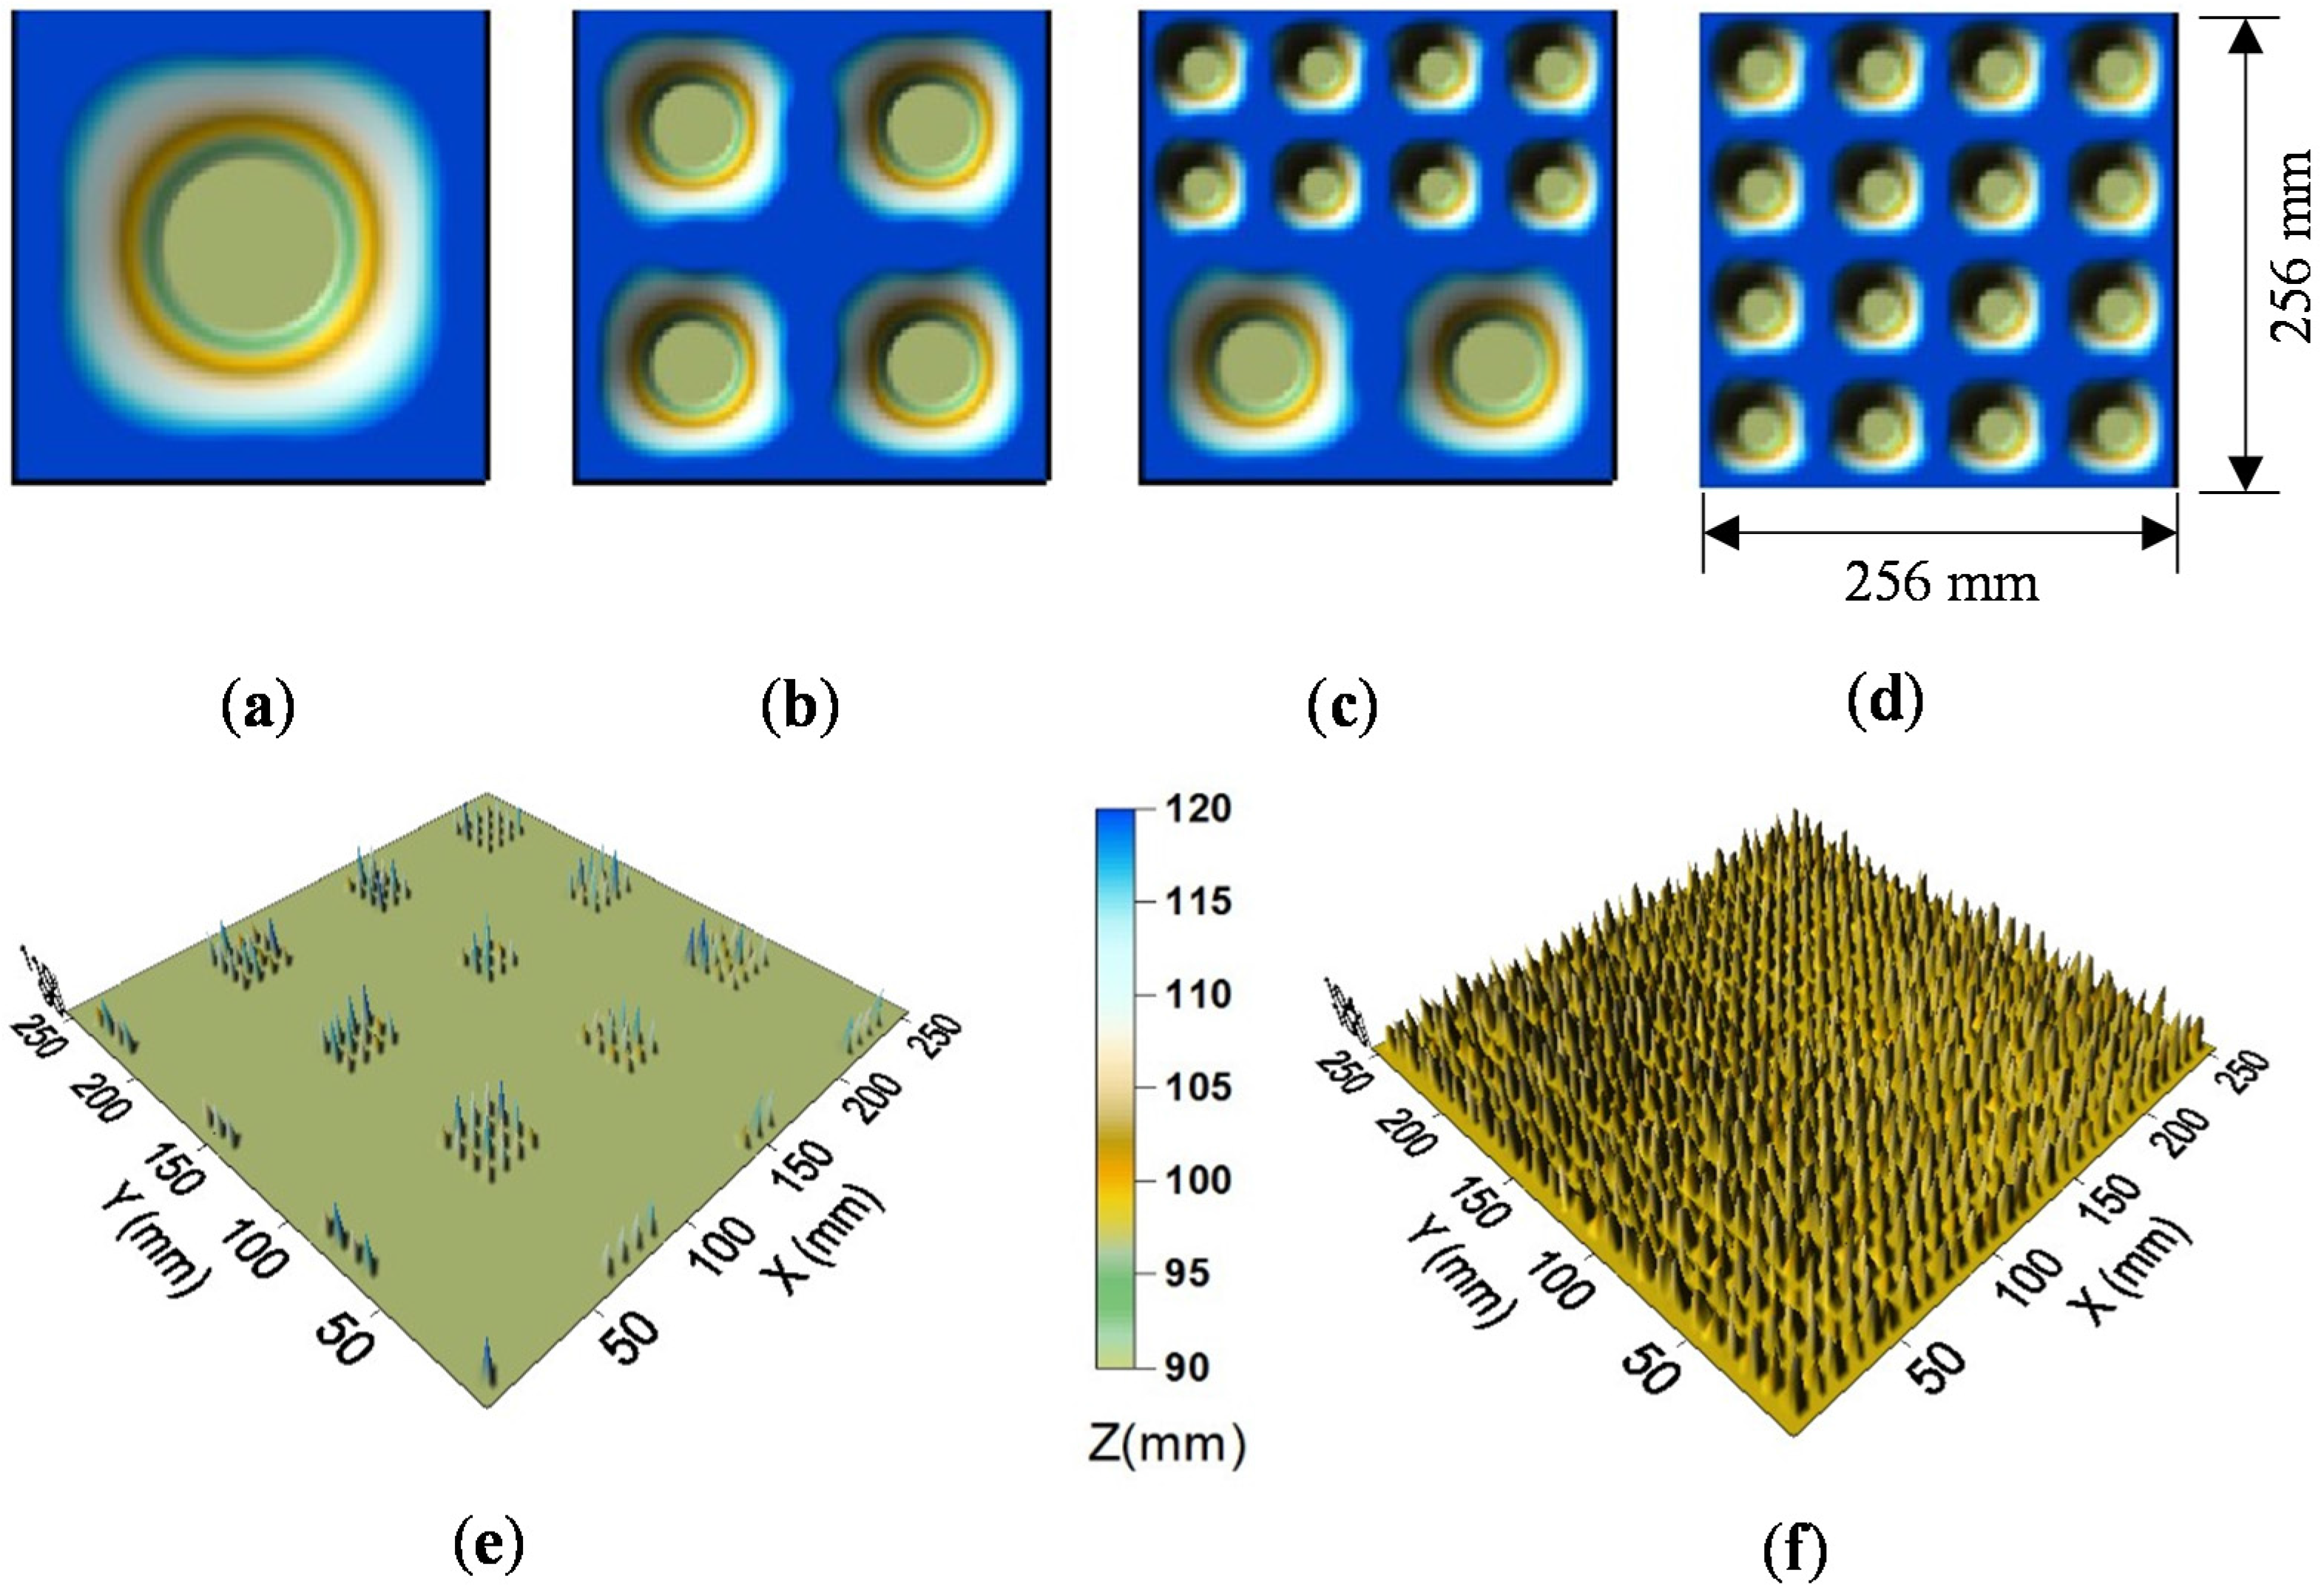
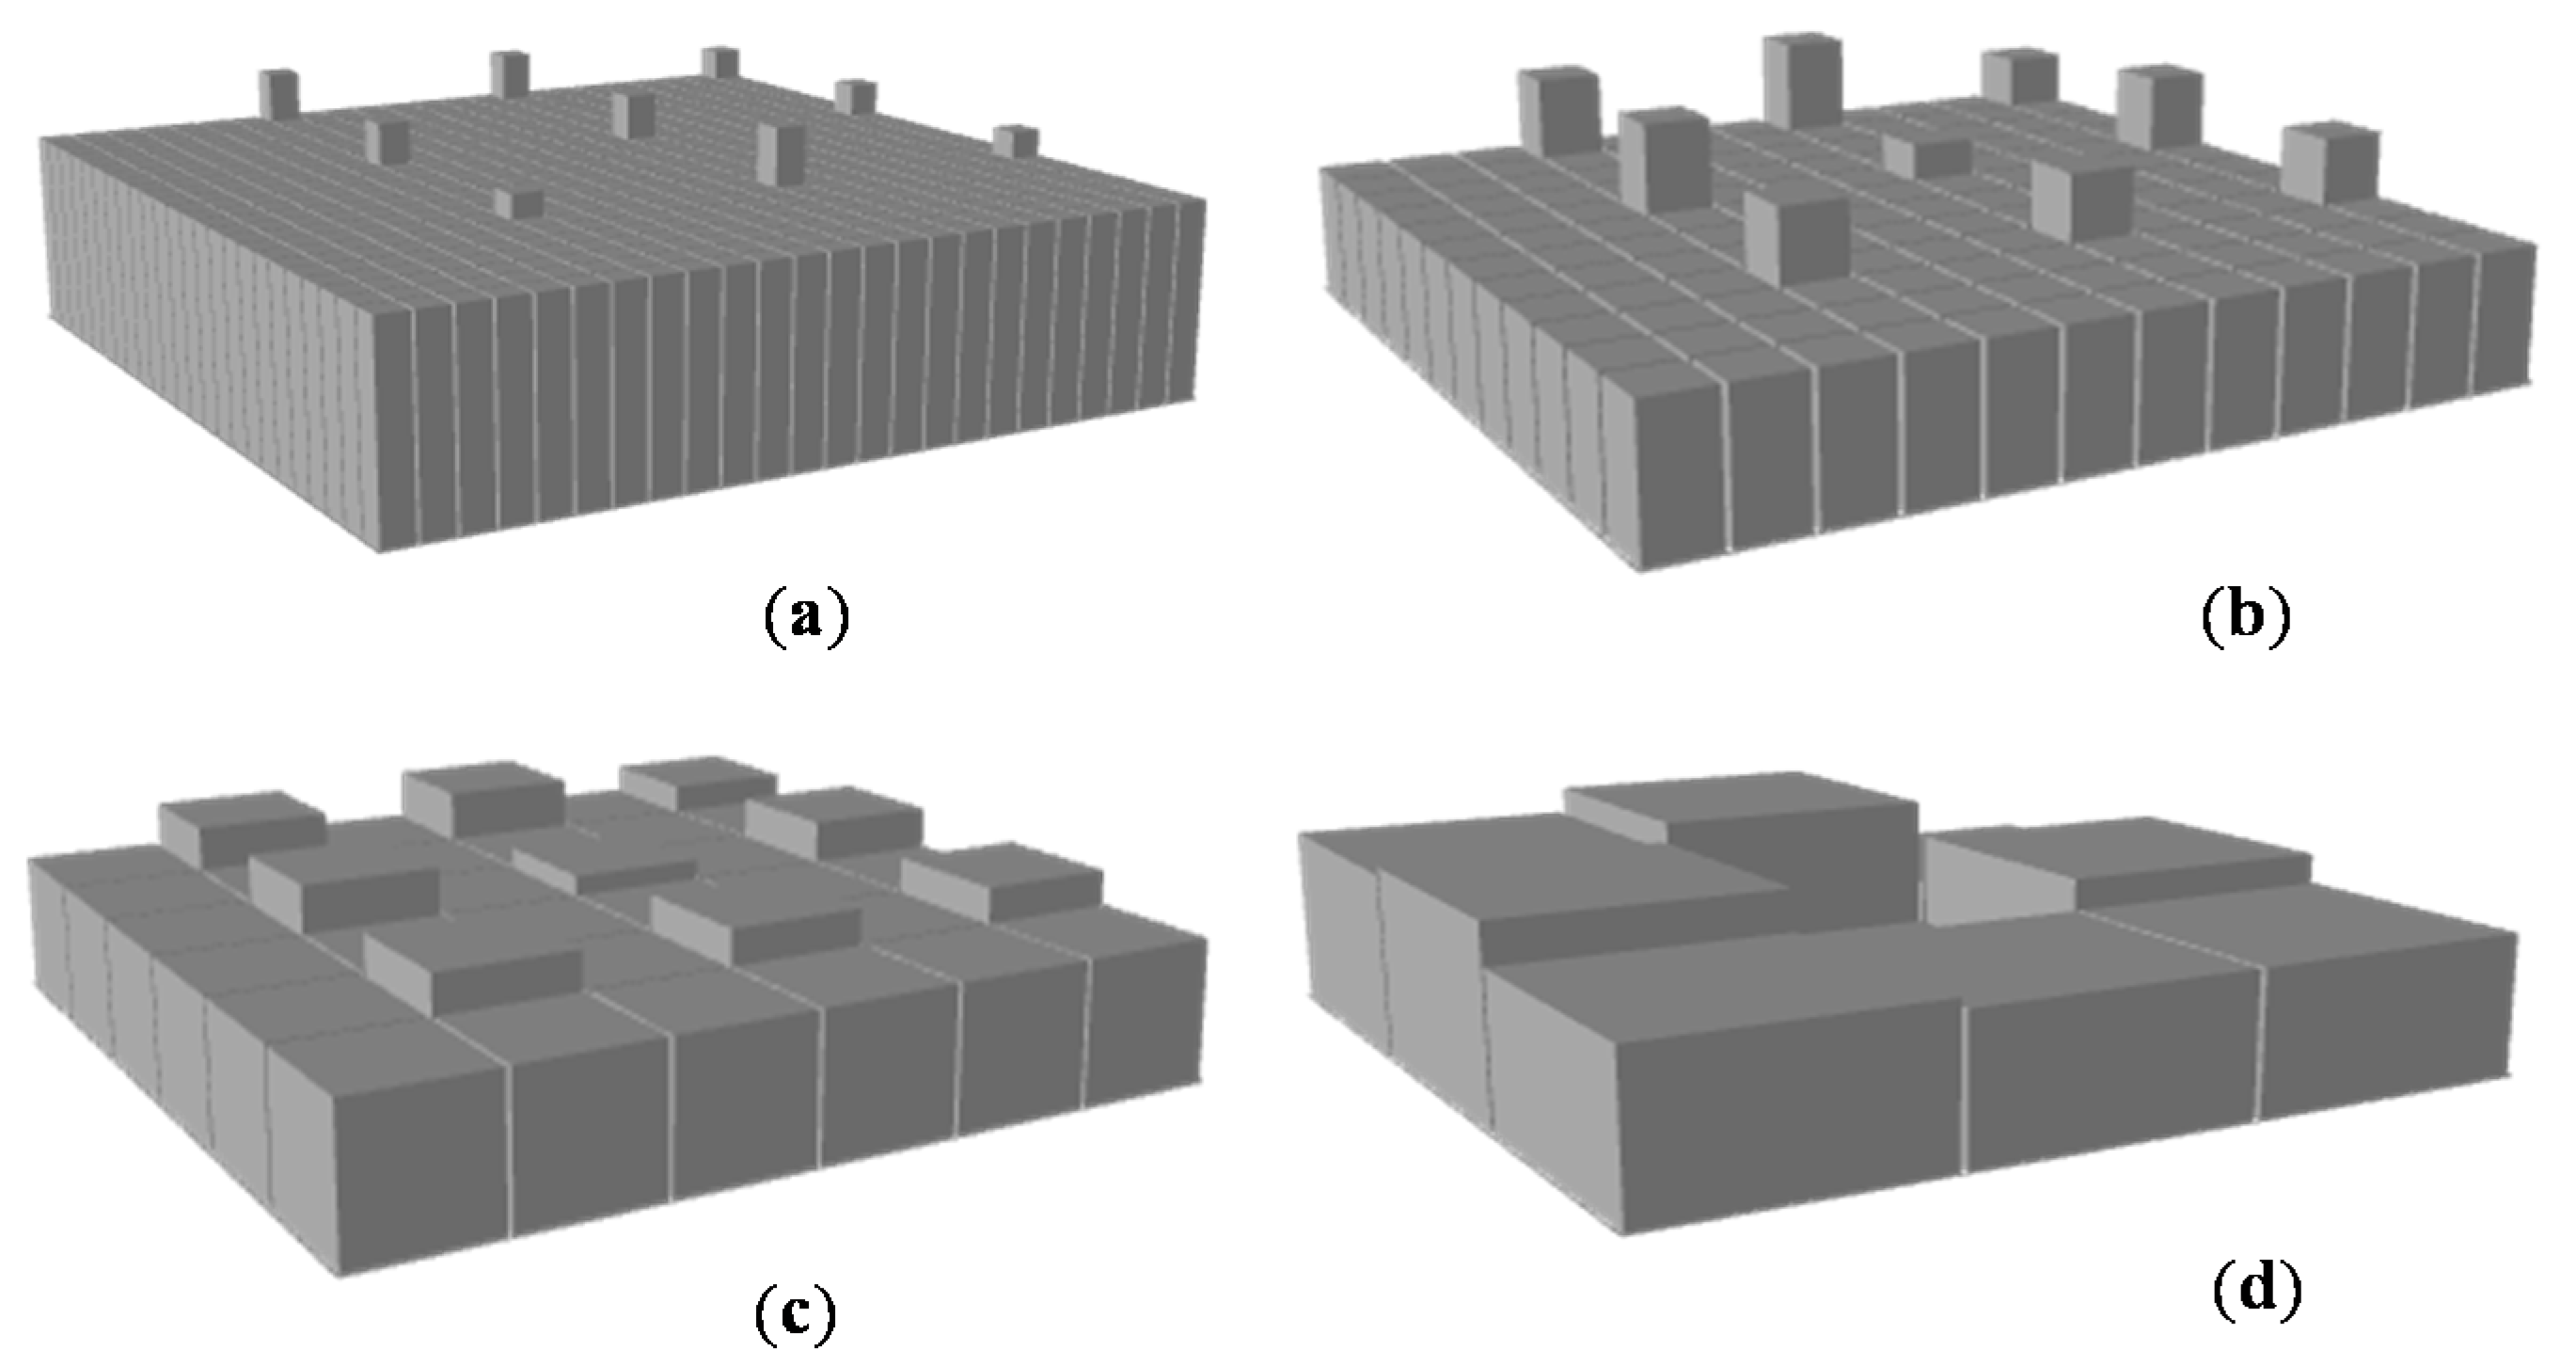
Figure 1d) were more sensitive to the change in grid size, showing an earlier decrease in MDS and a smaller zero-MDS grid size. Surface I-1 with the single largest depression (
Figure 1a) had the greatest zero-MDS grid size (
Figure 4). The maximum grid sizes for Surfaces I-1–I-4 were 128, 64, 64 and 32 mm, respectively (
Figure 4).
Figure 5 shows the changes in DEM representations and the loss of topographic detail for Surface I-4 (
Figure 1d; 16 puddles) induced by the changes in DEM resolution (grid sizes ∆
d increased from 2 to 4, 8, 16 and 32 mm). The depression storage gradually decreased with an increase in grid spacing. As a result, Surface I-4 was smoothened out, eventually resulting in a zero MDS at the largest grid size ∆
d = 32 mm (
Figure 5e). This example demonstrates the significant influence of DEM resolution on the topographic properties of a surface and related parameters (e.g., MDS) that are often used for hydrologic and environmental modeling.
Figure 4.
Relationships of grid spacing and maximum depression storage (MDS) determined by the averaging interpolation method for ideal Surfaces I-1–I-4.
Figure 4.
Relationships of grid spacing and maximum depression storage (MDS) determined by the averaging interpolation method for ideal Surfaces I-1–I-4.
Figure 5.
Demonstration of the loss of surface topographic details determined by the averaging interpolation method for ideal Surface I-4: (a) ∆d = 2 mm; (b) ∆d = 4 mm; (c) ∆d = 8 mm; (d) ∆d = 16 mm; (e) ∆d = 32 mm.
Figure 5.
Demonstration of the loss of surface topographic details determined by the averaging interpolation method for ideal Surface I-4: (a) ∆d = 2 mm; (b) ∆d = 4 mm; (c) ∆d = 8 mm; (d) ∆d = 16 mm; (e) ∆d = 32 mm.
The above analyses revealed that due to the loss of surface topographic detail, MDS decreased with an increase in grid size, and correspondingly, the number of puddles also decreased. This finding is similar to the one from Huang and Bradford [
7], but different from several other researchers [
3,
8,
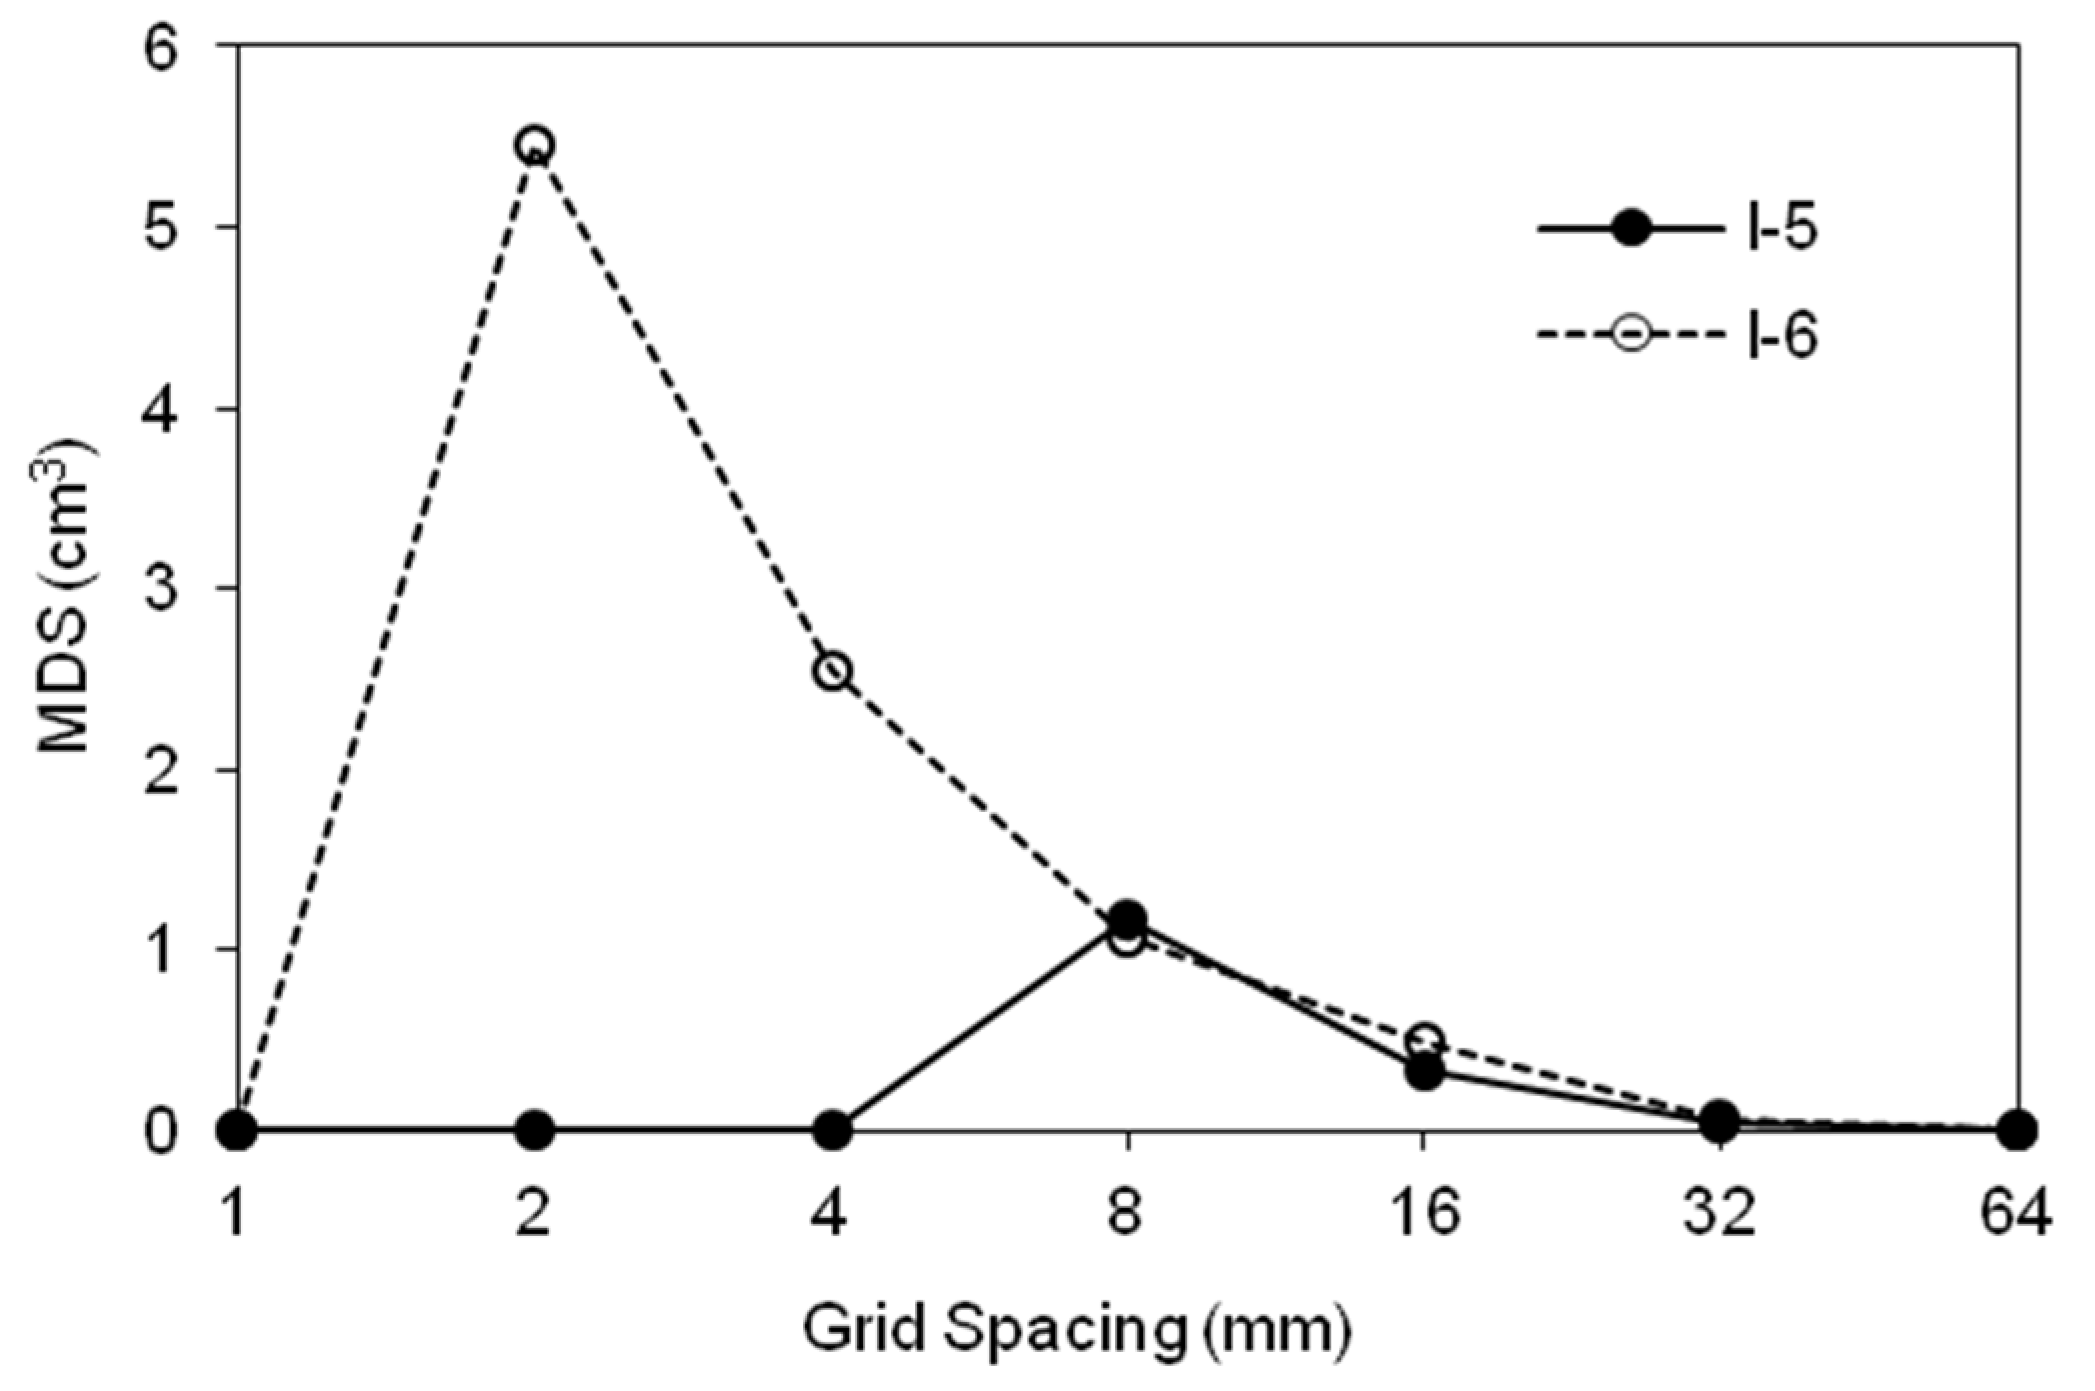
9]. To verify the related conclusions and to better understand the underlying reasons, Surfaces I-5 and I-6 (
Figure 1e,f) were used for further testing. As shown in
Figure 6, MDS increased with an increase in the grid spacing for both surfaces, indicating that certain artificial depressions were created during the interpolation/aggregation process, which further affected the computed depression storage. However, the MDS of Surface I-5 started to increase beyond
∆d = 4 mm. Then, MDS gradually decreased down to zero at
∆d = 64 mm for both surfaces (
Figure 6). Surface I-6 had much greater MDS values than Surface I-5 for smaller grid sizes (e.g.,
∆d = 2 and 4 mm) (
Figure 6). Hence, it can be concluded that the extent of the influence of DEM resolution on the MDS computation also depends on the surface topographic characteristics.
Figure 6.
Relationships of grid spacing and maximum depression storage (MDS) determined by the averaging interpolation method for Surfaces I-5 and I-6.
Figure 6.
Relationships of grid spacing and maximum depression storage (MDS) determined by the averaging interpolation method for Surfaces I-5 and I-6.
To better demonstrate how the “artificial depressions” were generated during the interpolation/aggregation process, the derived DEMs for a small portion of Surface I-5 for
∆d = 2, 4 and 8 mm were compared with the original DEM (
∆d = 1 mm). As shown in
Figure 7, for the grid sizes of 1–4 mm, the surfaces exhibited similar topographic features, such as peaks and a zero MDS, although the peaks were at different elevations for the three surfaces (
Figure 7a–c). However, an artificial puddle was formed when the grid size was increased to 8 mm (
Figure 7d), which resulted in a non-zero MDS. In summary, as DEM grid sizes change, “artificial puddles” can be created, and real small puddles may disappear, which consequently alters the surface topographic characteristics. This helps explain why different researchers (e.g., [
3,
8,
9]) reached distinct conclusions concerning the effects of DEM resolution on MDS.
Figure 7.
Demonstration of the generation of “artificial puddles” using the averaging interpolation method for a portion of Surface I-5: (a) ∆d = 1 mm; (b) ∆d = 2 mm; (c) ∆d = 4 mm; (d) ∆d = 8 mm.
Figure 7.
Demonstration of the generation of “artificial puddles” using the averaging interpolation method for a portion of Surface I-5: (a) ∆d = 1 mm; (b) ∆d = 2 mm; (c) ∆d = 4 mm; (d) ∆d = 8 mm.
3.3. DEM Resolution Effects for Watershed-Scale Surfaces
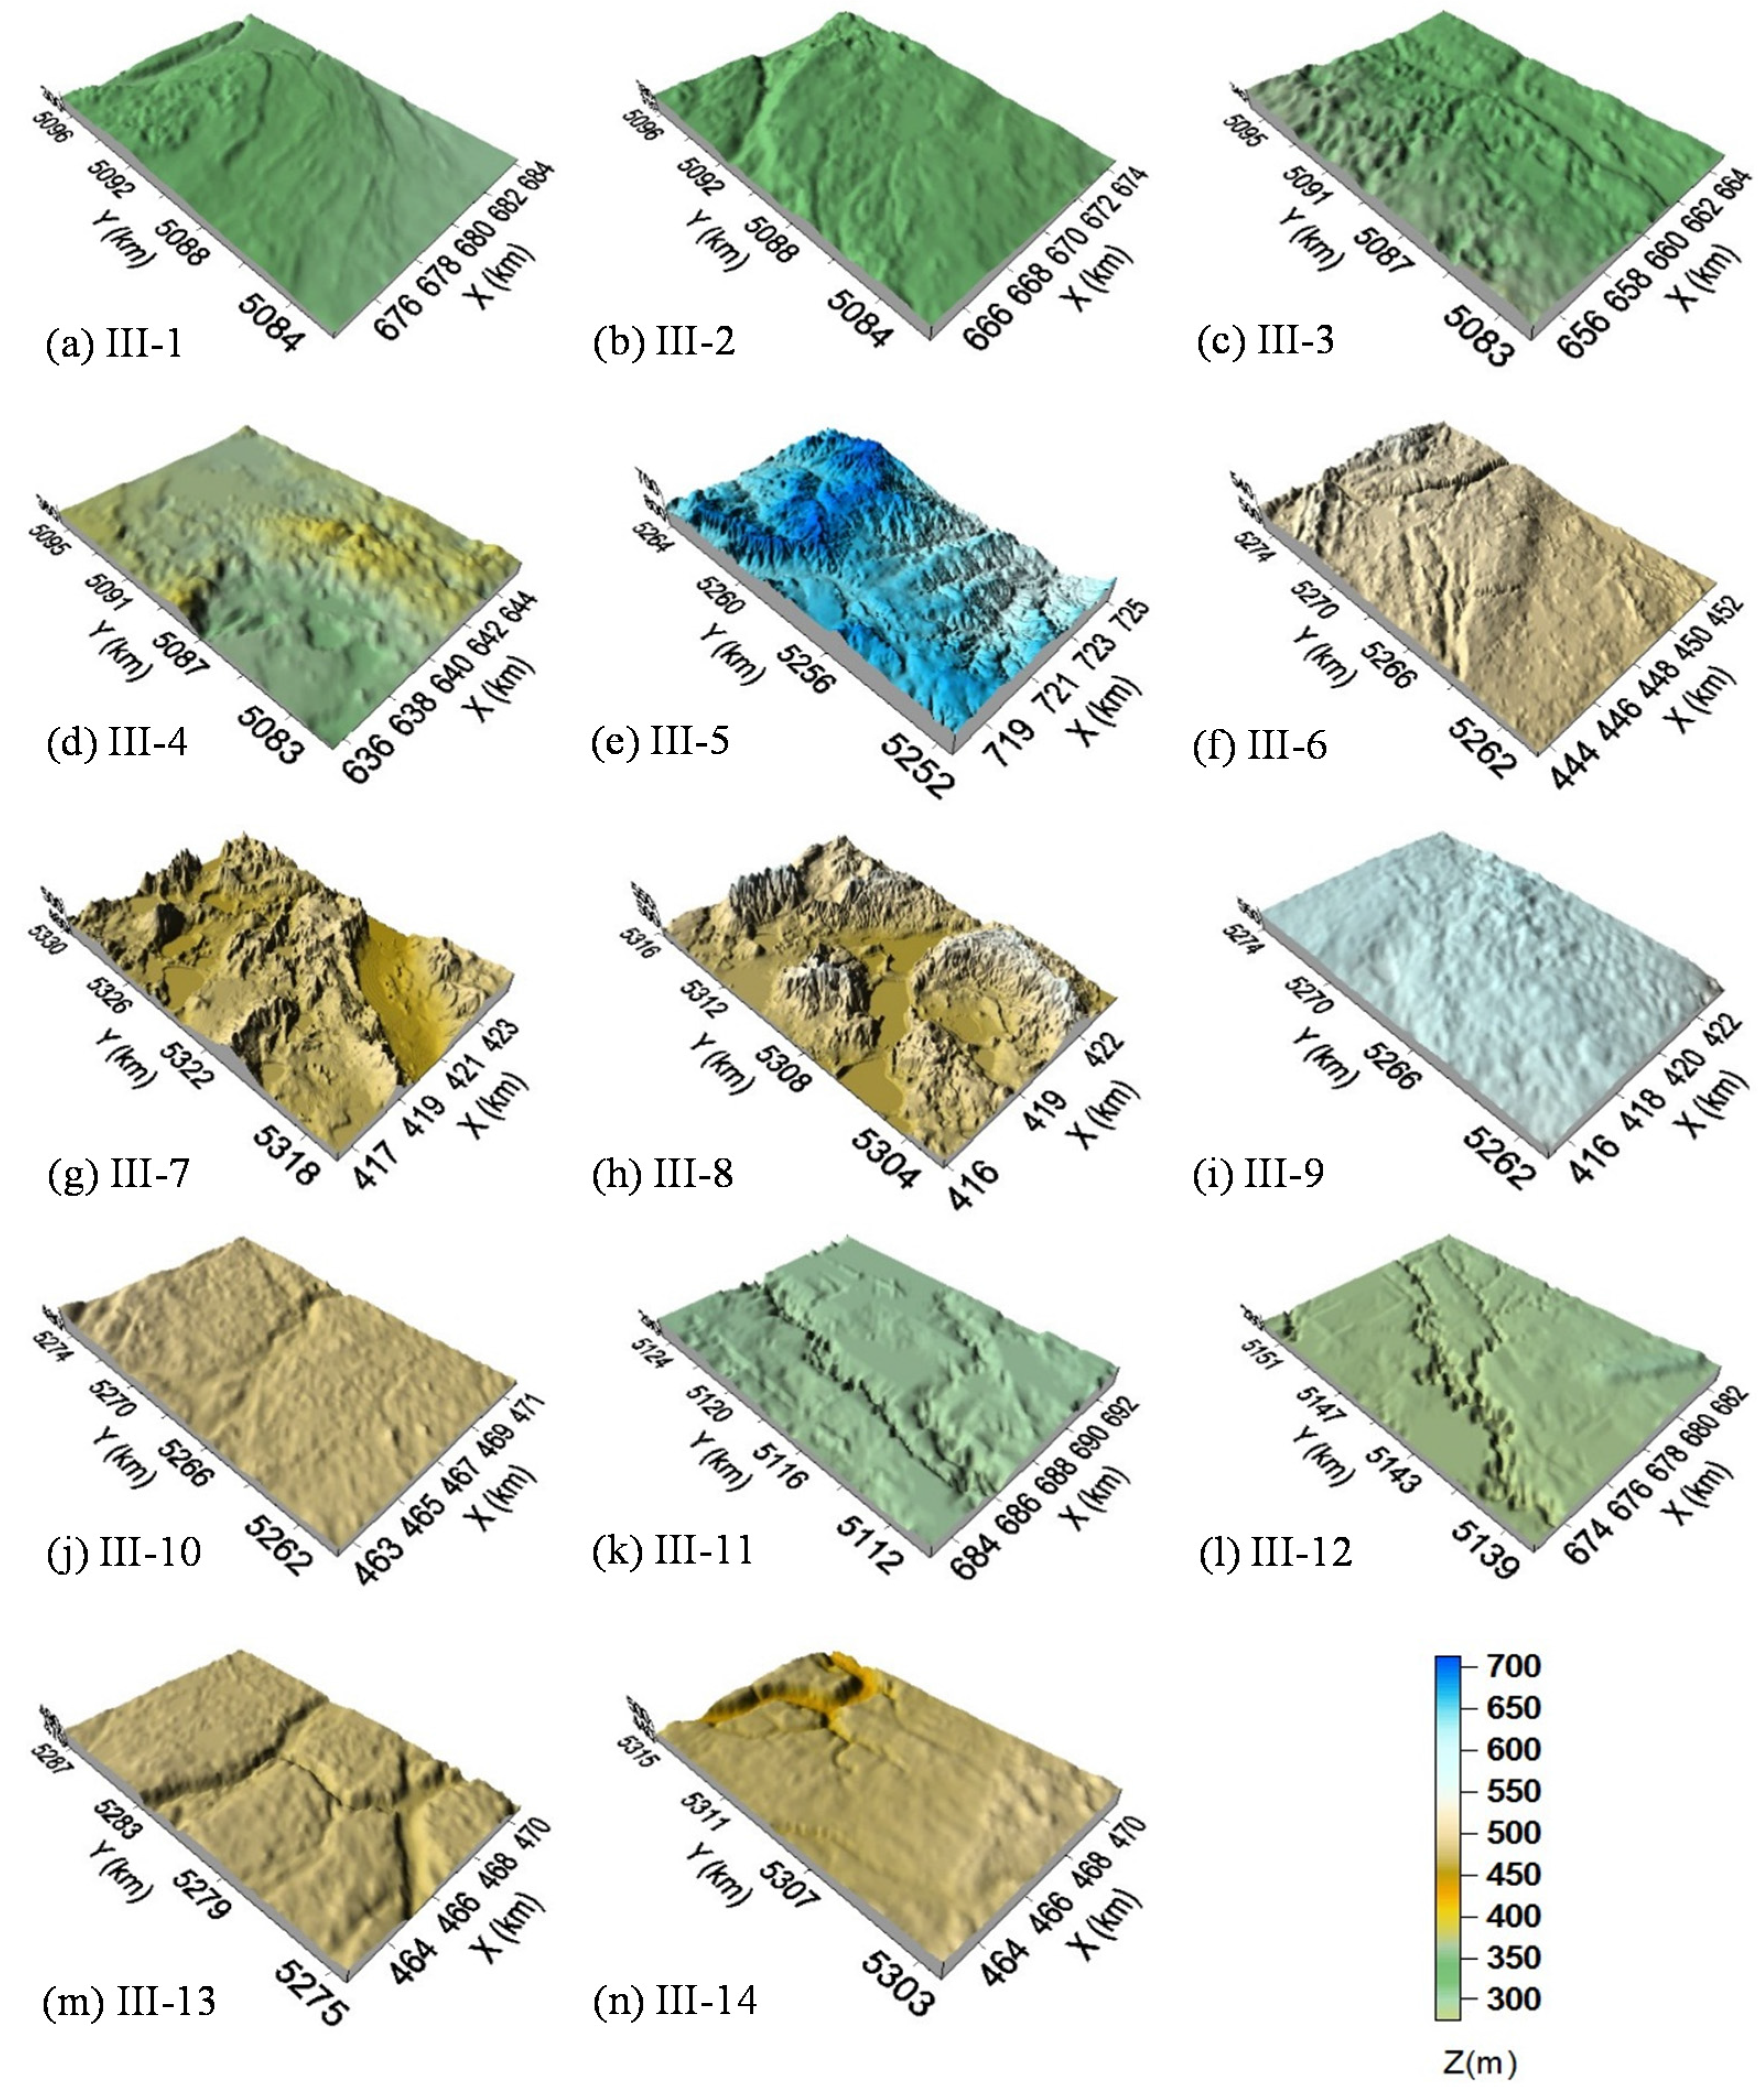
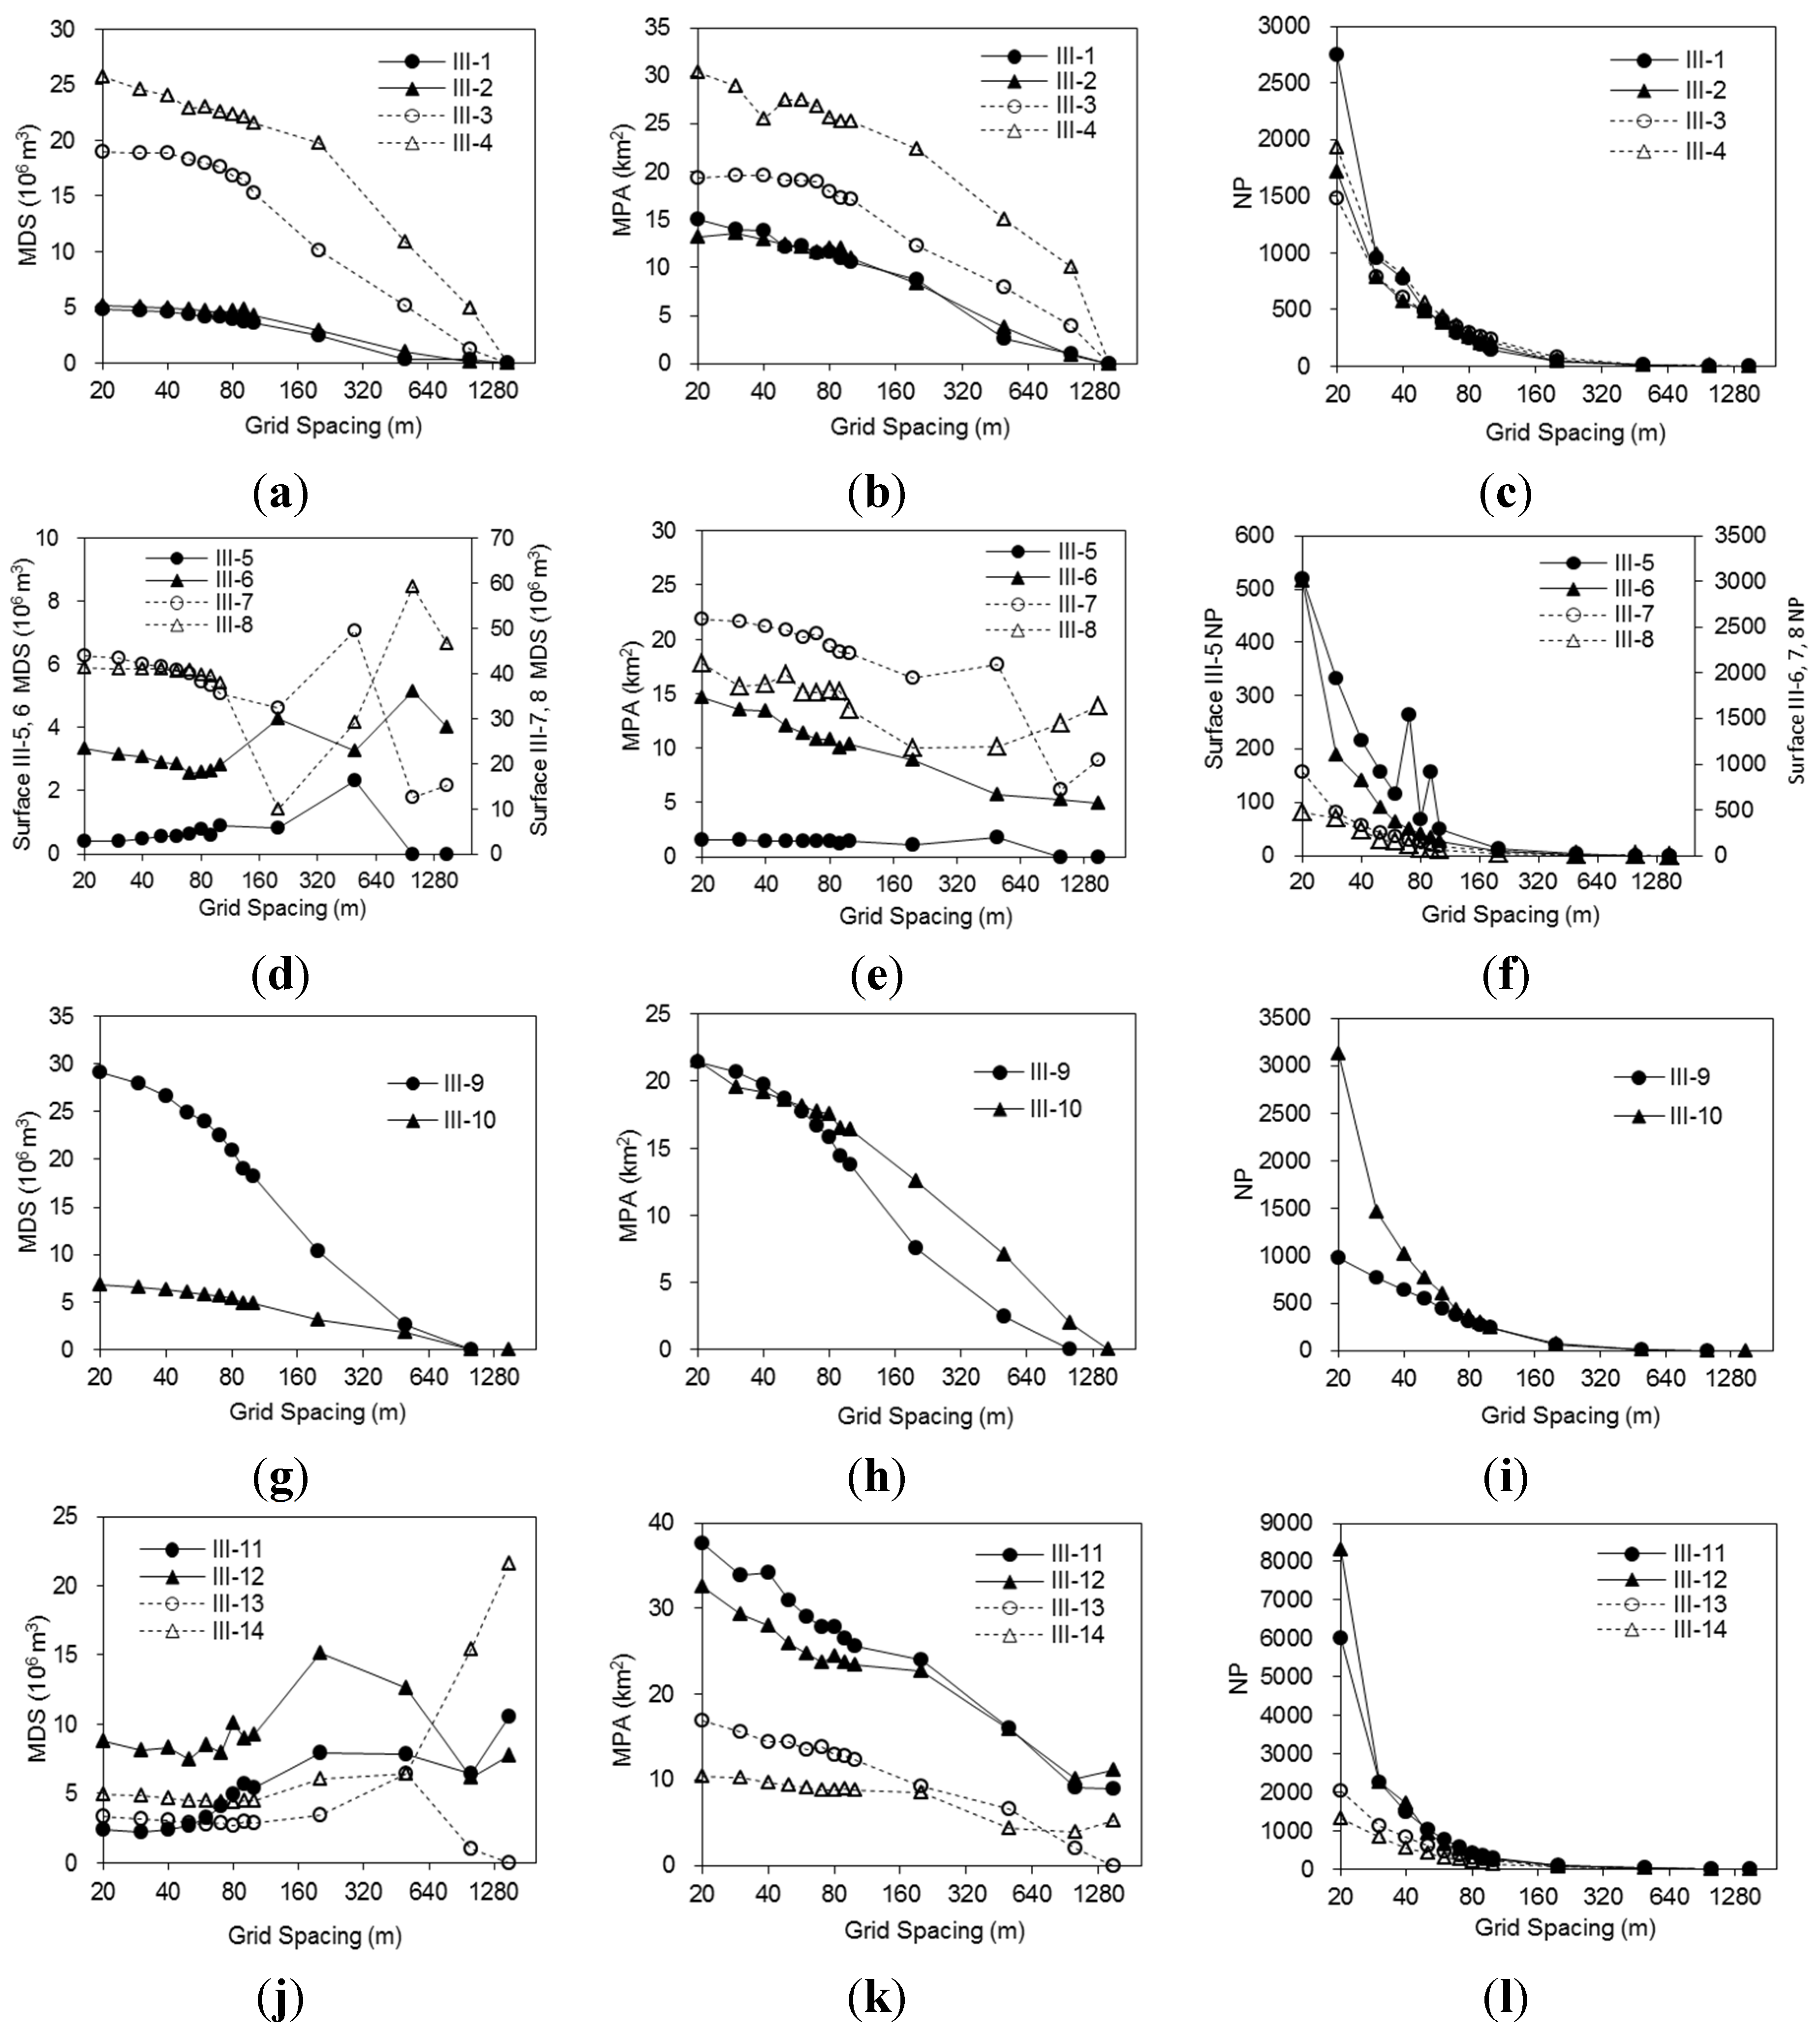
Figure 9 shows the comparison between grid spacing and MDS, MPA and NP for the watershed-scale Surfaces III-1–III-14 (
Figure 3). Dissimilar changing patterns of MDS, MPA and NP can be observed for these fourteen surfaces (
Figure 9). For Surfaces III-1–III-4, MDS and MPA decreased with increasing grid spacing and approached zero at
∆d = 1280 m (
Figure 9a,b). As expected, the rougher Surfaces III-3 and III-4 had greater MDS and MPA values. The NP values of Surfaces III-1–III-4 decreased rapidly with an increase in grid spacing (
Figure 9c). These findings were similar to the results for the laboratory-scale soil surfaces shown in
Figure 8.
Figure 9.
Relationships of grid spacing and maximum depression storage (MDS), maximum ponding area (MPA) and number of puddles (NP) determined by using the kriging method and the PD software for Surfaces III-1–III-14.
Figure 9.
Relationships of grid spacing and maximum depression storage (MDS), maximum ponding area (MPA) and number of puddles (NP) determined by using the kriging method and the PD software for Surfaces III-1–III-14.
For Surfaces III-5–III-8, however, their MDS and MPA values varied with an increase in the grid size (
Figure 9d,f). The MDS and MPA of Surface III-5 increased initially, reached the maximum values at
∆d = 500 m and then decreased to zero at
∆d = 1000 m (
Figure 9d,e). The MDS of Surface III-6 varied with grid spacing (
Figure 9d), while its MPA exhibited a decreasing pattern (
Figure 9e). Surfaces III-7a and III-8 displayed significant variations in both MDS and MPA as the grid size changed. The NP curves of Surfaces III-5–III-8 showed an overall decreasing pattern as the grid size increased. However, the NP of Surface III-5 displayed some variations at
∆d = 70–90 m (
Figure 9f). This can be attributed to the “unreal” depressions induced during the interpolation/aggregation process. Comparisons of the MDS, MPA and NP between the four plain surfaces (III-1–III-4) (
Figure 9a–c) and the four mountain-type surfaces (III-5–I III-8) (
Figure 9d–f) suggested that the changing patterns of these topographic parameters with grid spacing were different, primarily depending on their topographic characteristics.
Comparison between Surfaces III-9 (
Figure 3i) and III-10 (
Figure 3j) revealed some interesting results. The elevations of Surface III-9 varied in a greater range from 511.4 to 620.3 m (
i.e., the difference was 108.9 m), while the elevations of Surface III-10 ranged from 475.3 to 508.5 m (the difference was only 33.2 m). As expected, the MDS of Surface III-9 was much greater than that of Surface III-10 (
Figure 9g). However, both surfaces had very comparable MPA curves (both quantity and distribution) (
Figure 9h). Like Surfaces III-1–III-4 (
Figure 9c), the NP curves of Surfaces III-9 and III-10 also showed a decreasing trend with increasing grid spacing, even though Surface III-10 included more depressions (
Figure 9i).
Similar to Surfaces III-7 and III-8 (
Figure 9d), Surfaces III-11–III-12 also showed substantial variability in their MDS (
Figure 9j). The changing pattern of MDS for Surface III-13 (
Figure 9j) was similar to that of Surface III-5 (
Figure 9d), and its MDS reached zero at
∆d = 1500 m. In contrast, Surface III-14 showed a significant increase in MDS, especially for
∆d > 500 m, and eventually reached the highest MDS at the coarsest resolution (
∆d = 1500 m) (
Figure 9j). The MPA values of Surfaces III-11–III-12 were greater than those of Surfaces III-13 and III-14, and the four MPA curves exhibited an overall decreasing trend with increasing grid spacing (
Figure 9k). Similar to Surfaces III-1–III-4 (
Figure 9c), substantial decreases can be observed in the NP curves of Surfaces III-11–III-14, as the grid size increased (
Figure 9l).
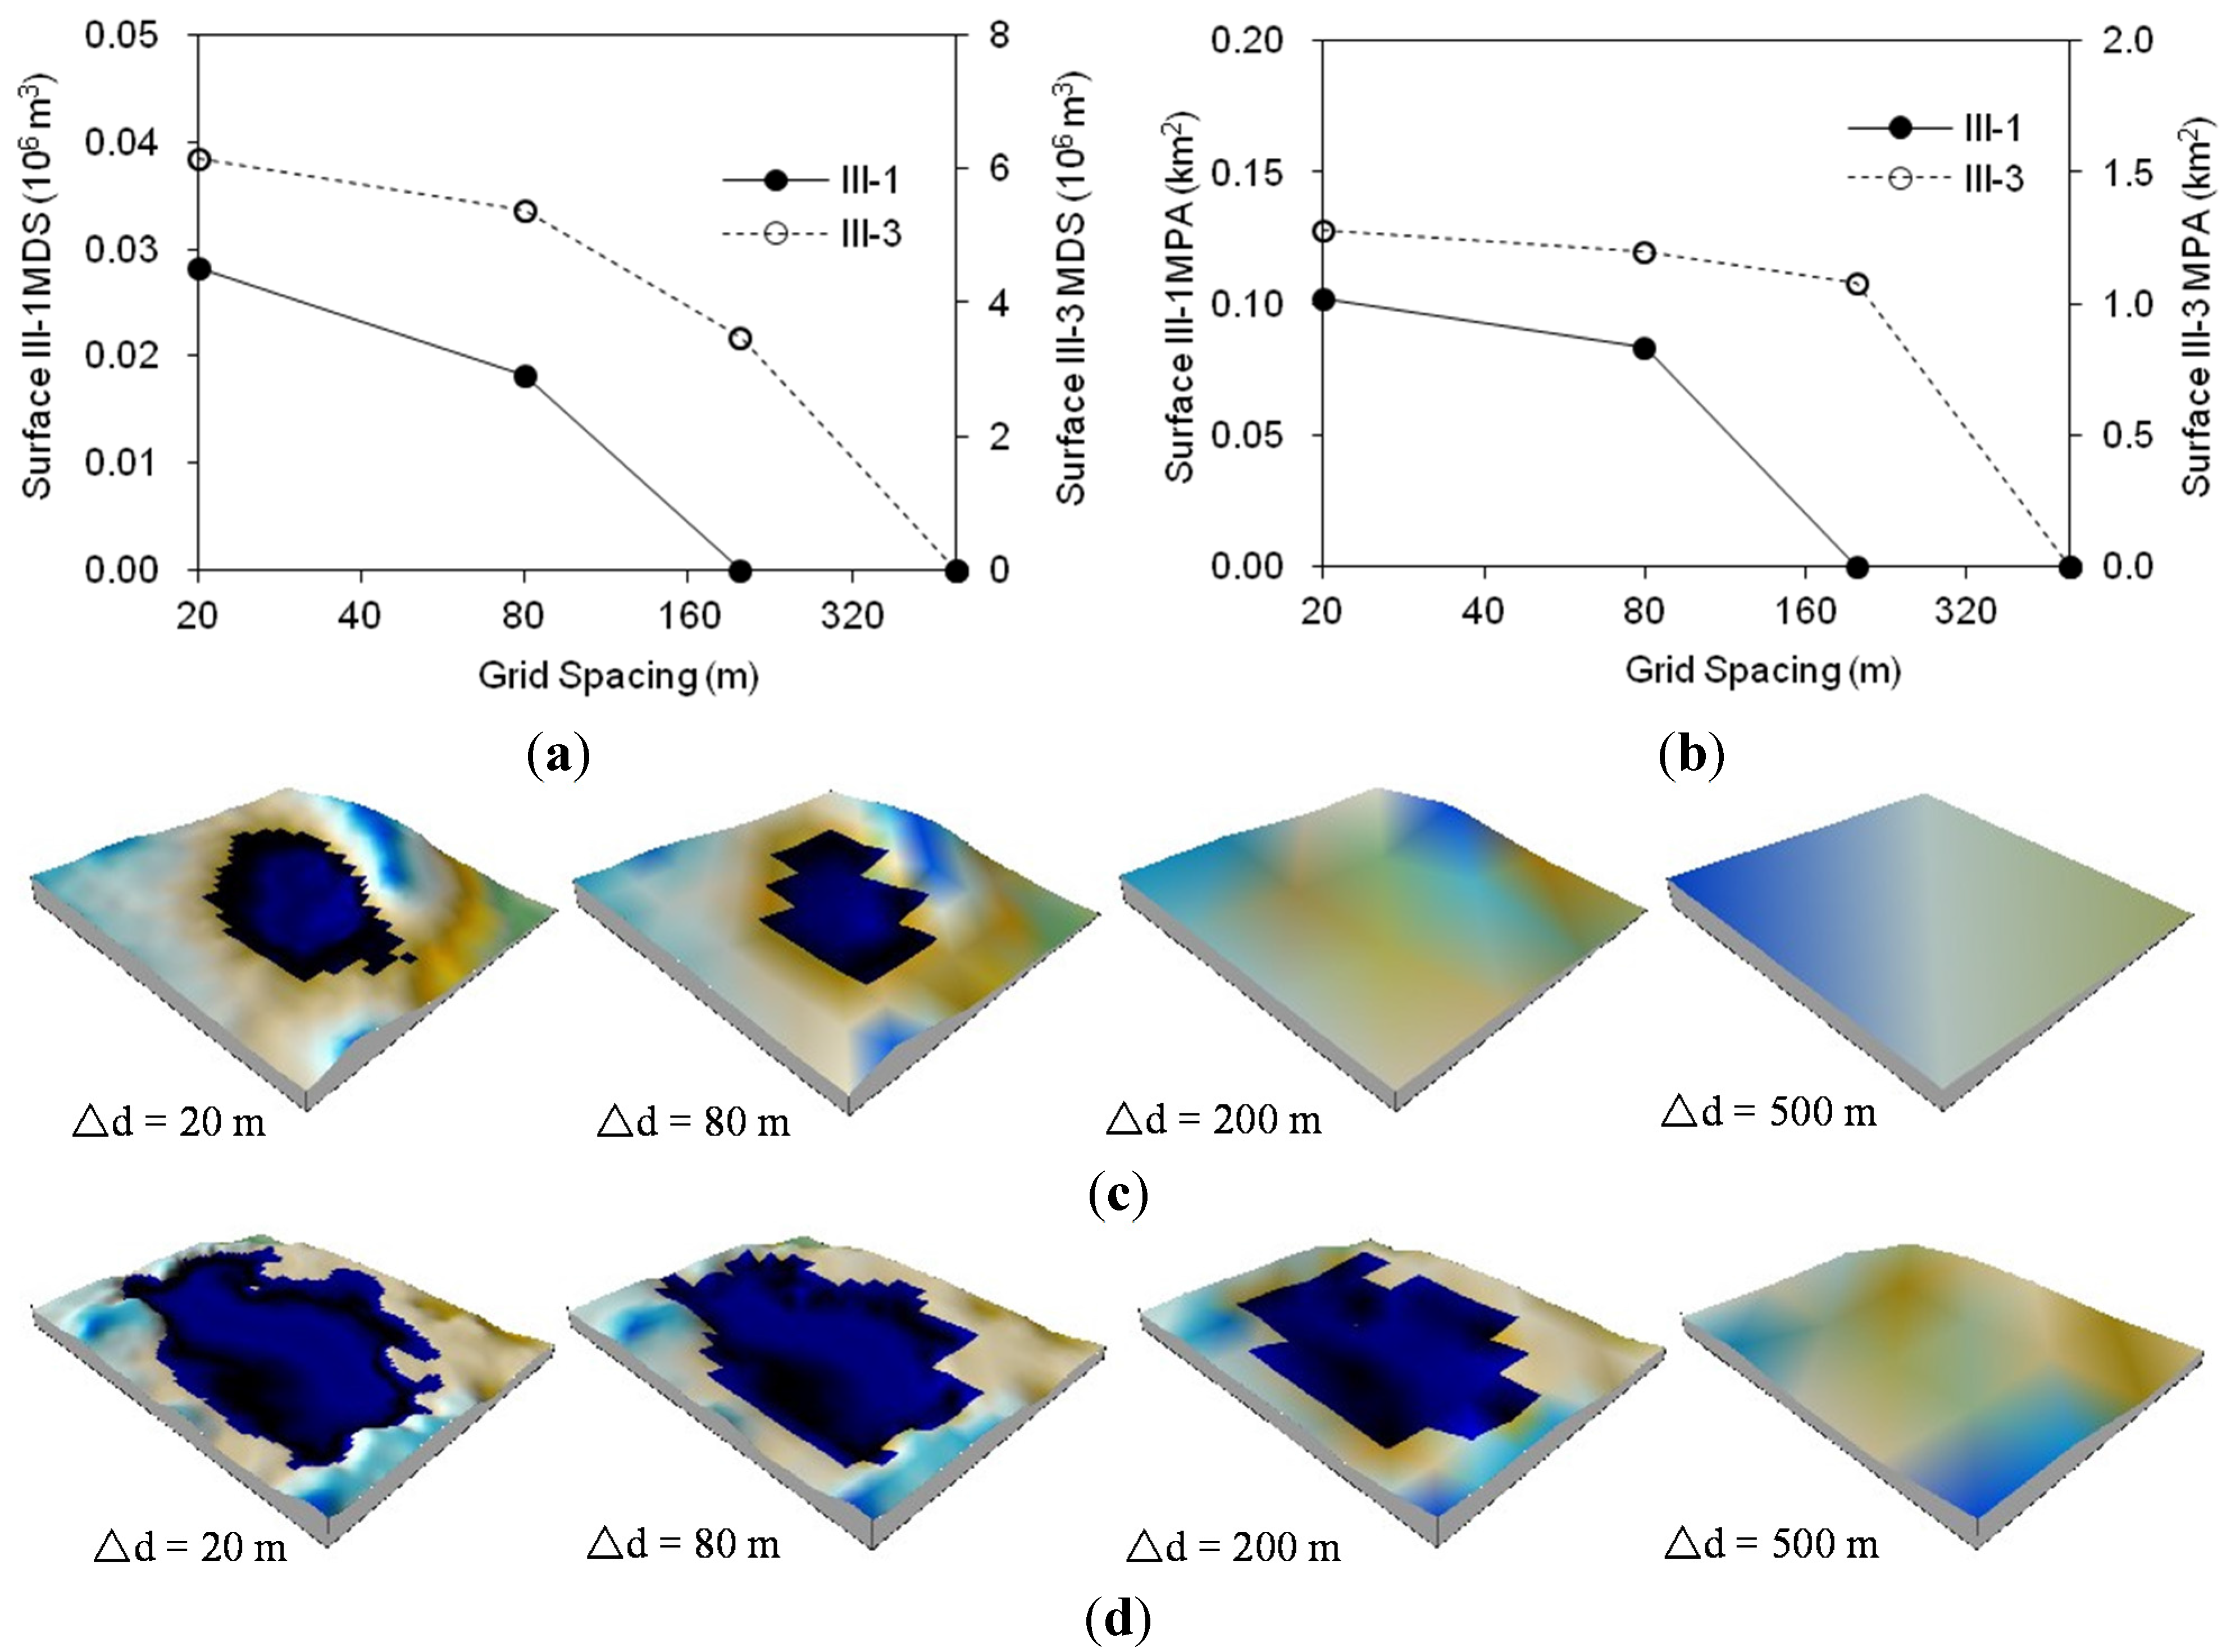
To look into more detail at the alteration of DEM representations and the loss of topographic detail due to the changes in DEM resolution, a portion of the plain-type Surfaces III-1 and III-3 (zoomed-in areas) and four different grid sizes (
∆d = 20, 80, 200 and 500 m) were selected, and the changes in their MDS and MPA values were analyzed.
Figure 10a,b respectively show the changes in their MDS and MPA. Basically, both MDS and MPA decreased with increasing grid size. As a result, the puddles/depressions on Surfaces III-1 and III-3 were smoothened out, eventually resulting in a zero depression storage (
Figure 10c,d). The MDS and MPA became zero (
i.e., no depression/puddle) at
∆d = 200 m for Surface III-1 (
Figure 10a–c) and at
∆d = 500 m for Surface III-3 (
Figure 10a,b,d). The above analyses revealed that due to the loss of surface topographic detail, MDS and MPA decreased with an increase in grid size, and correspondingly, the number of depressions/puddles also decreased. Similar to the small-scale surfaces (
Figure 4), MDS and MPA appeared to be changed insignificantly for smaller grid sizes (∆
d < 80 m). Again, this finding can be useful for multi-scale hydrologic modeling and analysis.
Figure 10.
Demonstration of the loss of surface topographic details (maximum depression storage MDS and maximum ponding area MPA) determined by the kriging method and the PD software for Surfaces III-1 and III-3: (a) MDS; (b) MPA; (c) Surface III-1; (d) Surface III-3.
Figure 10.
Demonstration of the loss of surface topographic details (maximum depression storage MDS and maximum ponding area MPA) determined by the kriging method and the PD software for Surfaces III-1 and III-3: (a) MDS; (b) MPA; (c) Surface III-1; (d) Surface III-3.
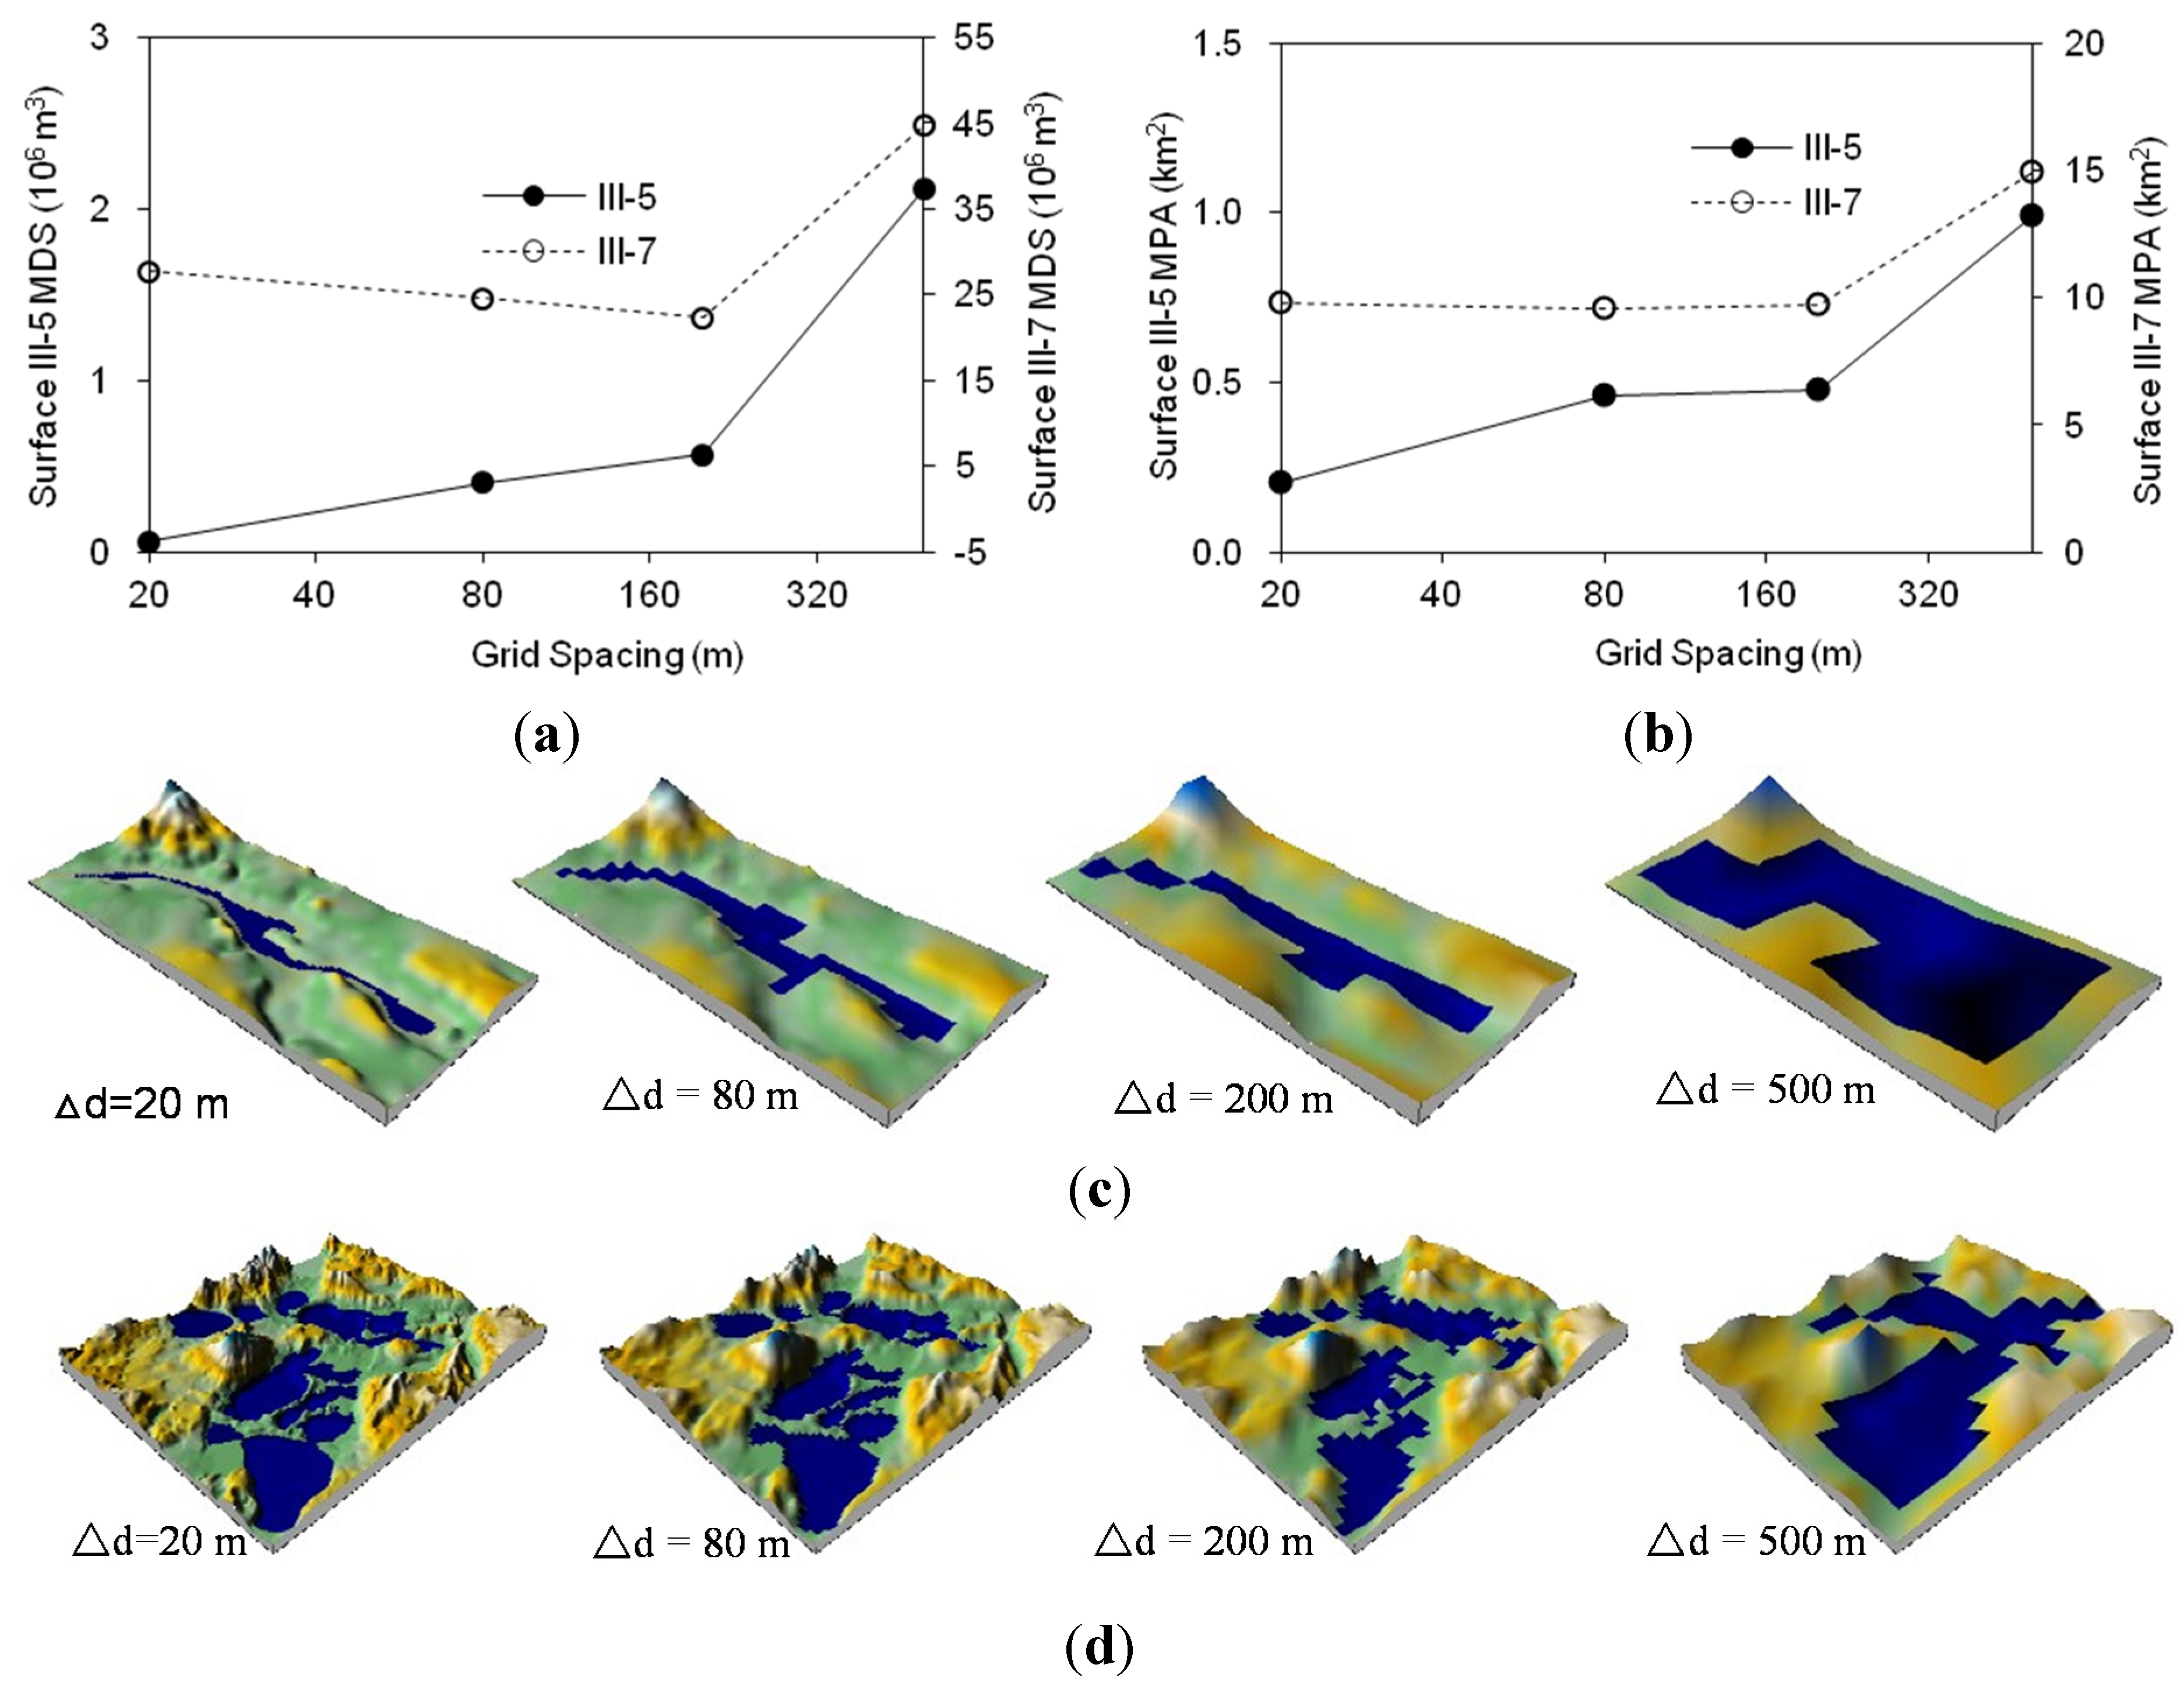
Figure 11a and
Figure 11b respectively show the changes in MDS and MPA for a selected portion of the mountain-type Surfaces III-5 and III-7, while
Figure 11c and
Figure 11d display the delineated surfaces and puddle distributions for the four different resolutions (
∆d = 20, 80, 200 and 500 m). Different from the selected plain Surfaces III-1 and III-3 (
Figure 10a,b), as the grid size increased from 20 to 500 m, the MDS and MPA of the small piece of Surface III-5 increased from 0.06 × 10
6 to 2.11 × 10
6 m
3 and from 0.20 to 0.99 km
2, respectively (
Figure 11a,b).
Figure 11c also shows increases in the MDS and MPA. The MDS and MPA of the small piece of Surface III-7 displayed slight decreases for smaller grid sizes (
∆d ≤ 200 m) and then increased to 44.68 × 10
6 m
3 and 14.89 km
2, respectively (
Figure 11a,b). Such changing trends of MDS and MPA also can be observed in
Figure 11d. This result suggested that the computation of MDS was strongly affected by DEM resolution and the complexity of surface topography. The changes in the computed topographic parameters can be attributed to the introduced artificial depressions and the smoothing effects.
Figure 11.
Demonstration of the changes of surface topographic characterization (maximum depression storage MDS and maximum ponding area MPA) determined by the kriging method and the PD software for Surfaces III-5 and III-7: (a) MDS; (b) MPA; (c) Surface III-5; (d) Surface III-7.
Figure 11.
Demonstration of the changes of surface topographic characterization (maximum depression storage MDS and maximum ponding area MPA) determined by the kriging method and the PD software for Surfaces III-5 and III-7: (a) MDS; (b) MPA; (c) Surface III-5; (d) Surface III-7.
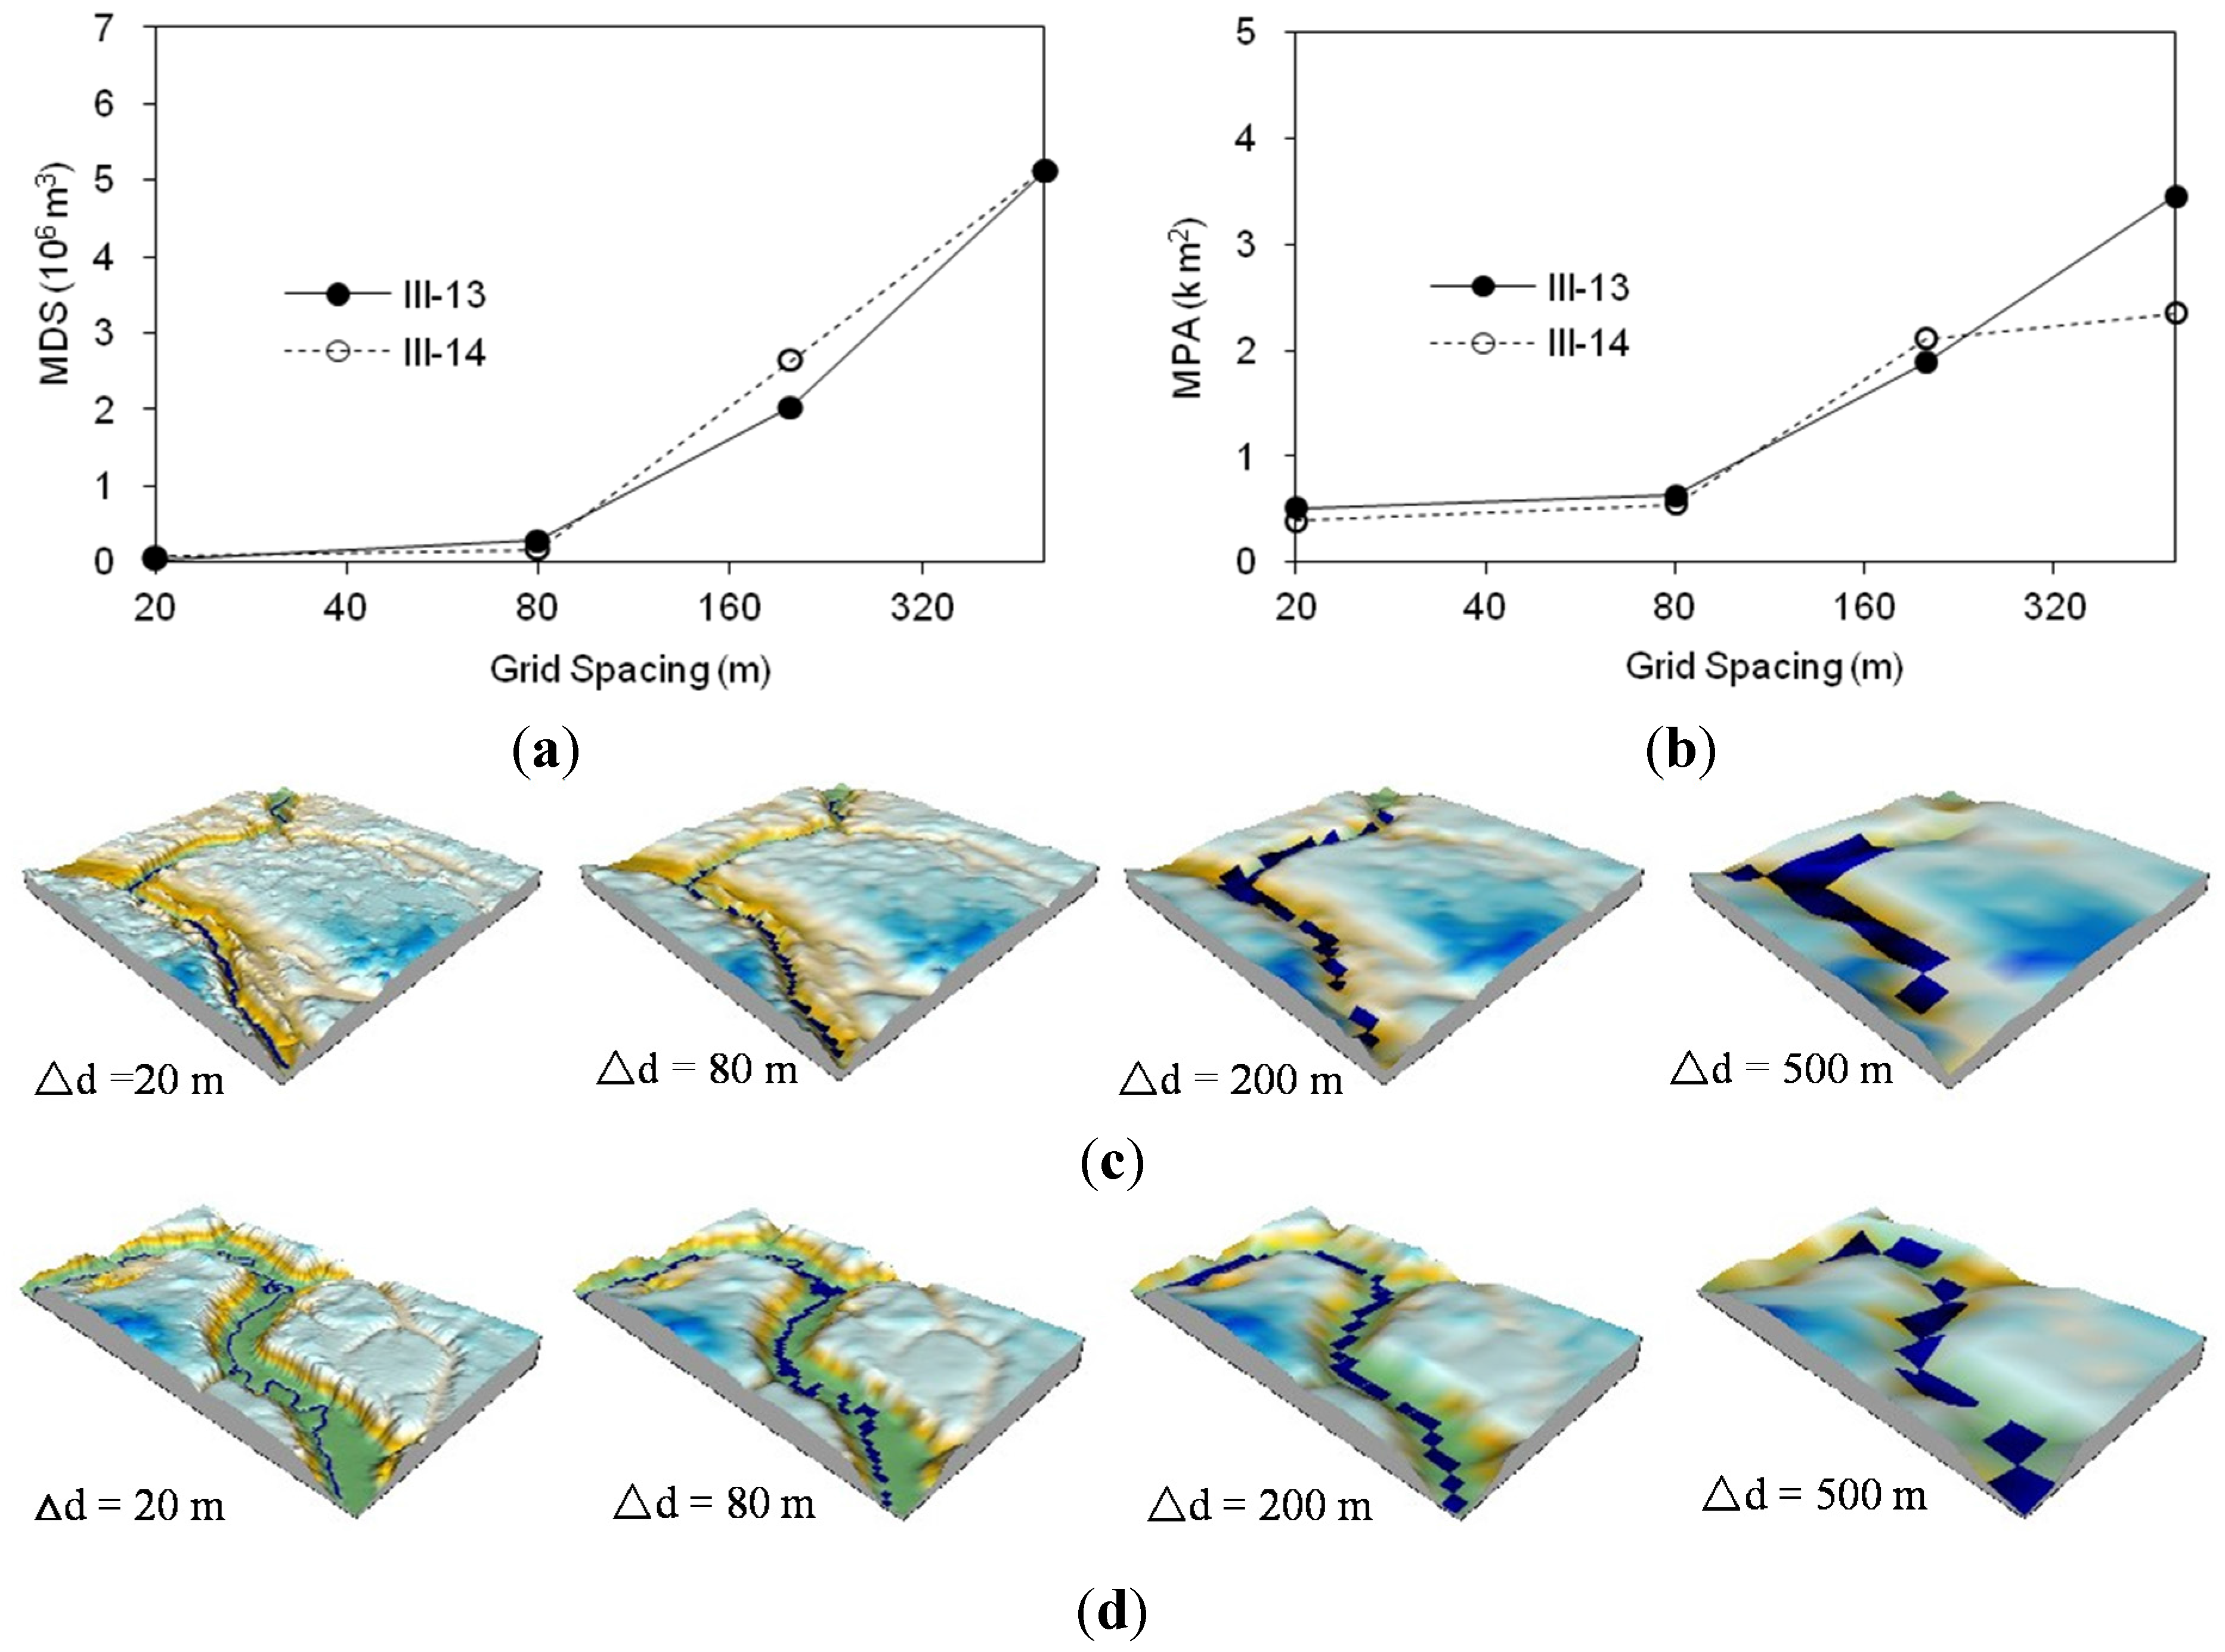
Figure 12a,b shows the changes in the MDS and MPA of the selected pieces of Surfaces III-13 and III-14 that were characterized by river channels. As the grid size increased from 20 to 500 m, the MDS and MPA of the small piece of Surface III-13 increased from 0.04 × 10
6 to 5.11 × 10
6 m
3 and from 0.51 to 3.46 km
2, respectively (
Figure 12a,b). Such increases in the MDS and MPA also can be observed in
Figure 12c. The MDS and MPA of the selected piece of Surface III-14 also increased from 0.07 × 10
6 to 5.13 × 10
6 m
3 and from 0.39 to 2.35 km
2, respectively (
Figure 12a,b,d). This analysis, again, demonstrates the dominant role of surface topography and DEM resolution in the computation of topographic parameters.
3.4. Influences of Different Delineation Methods
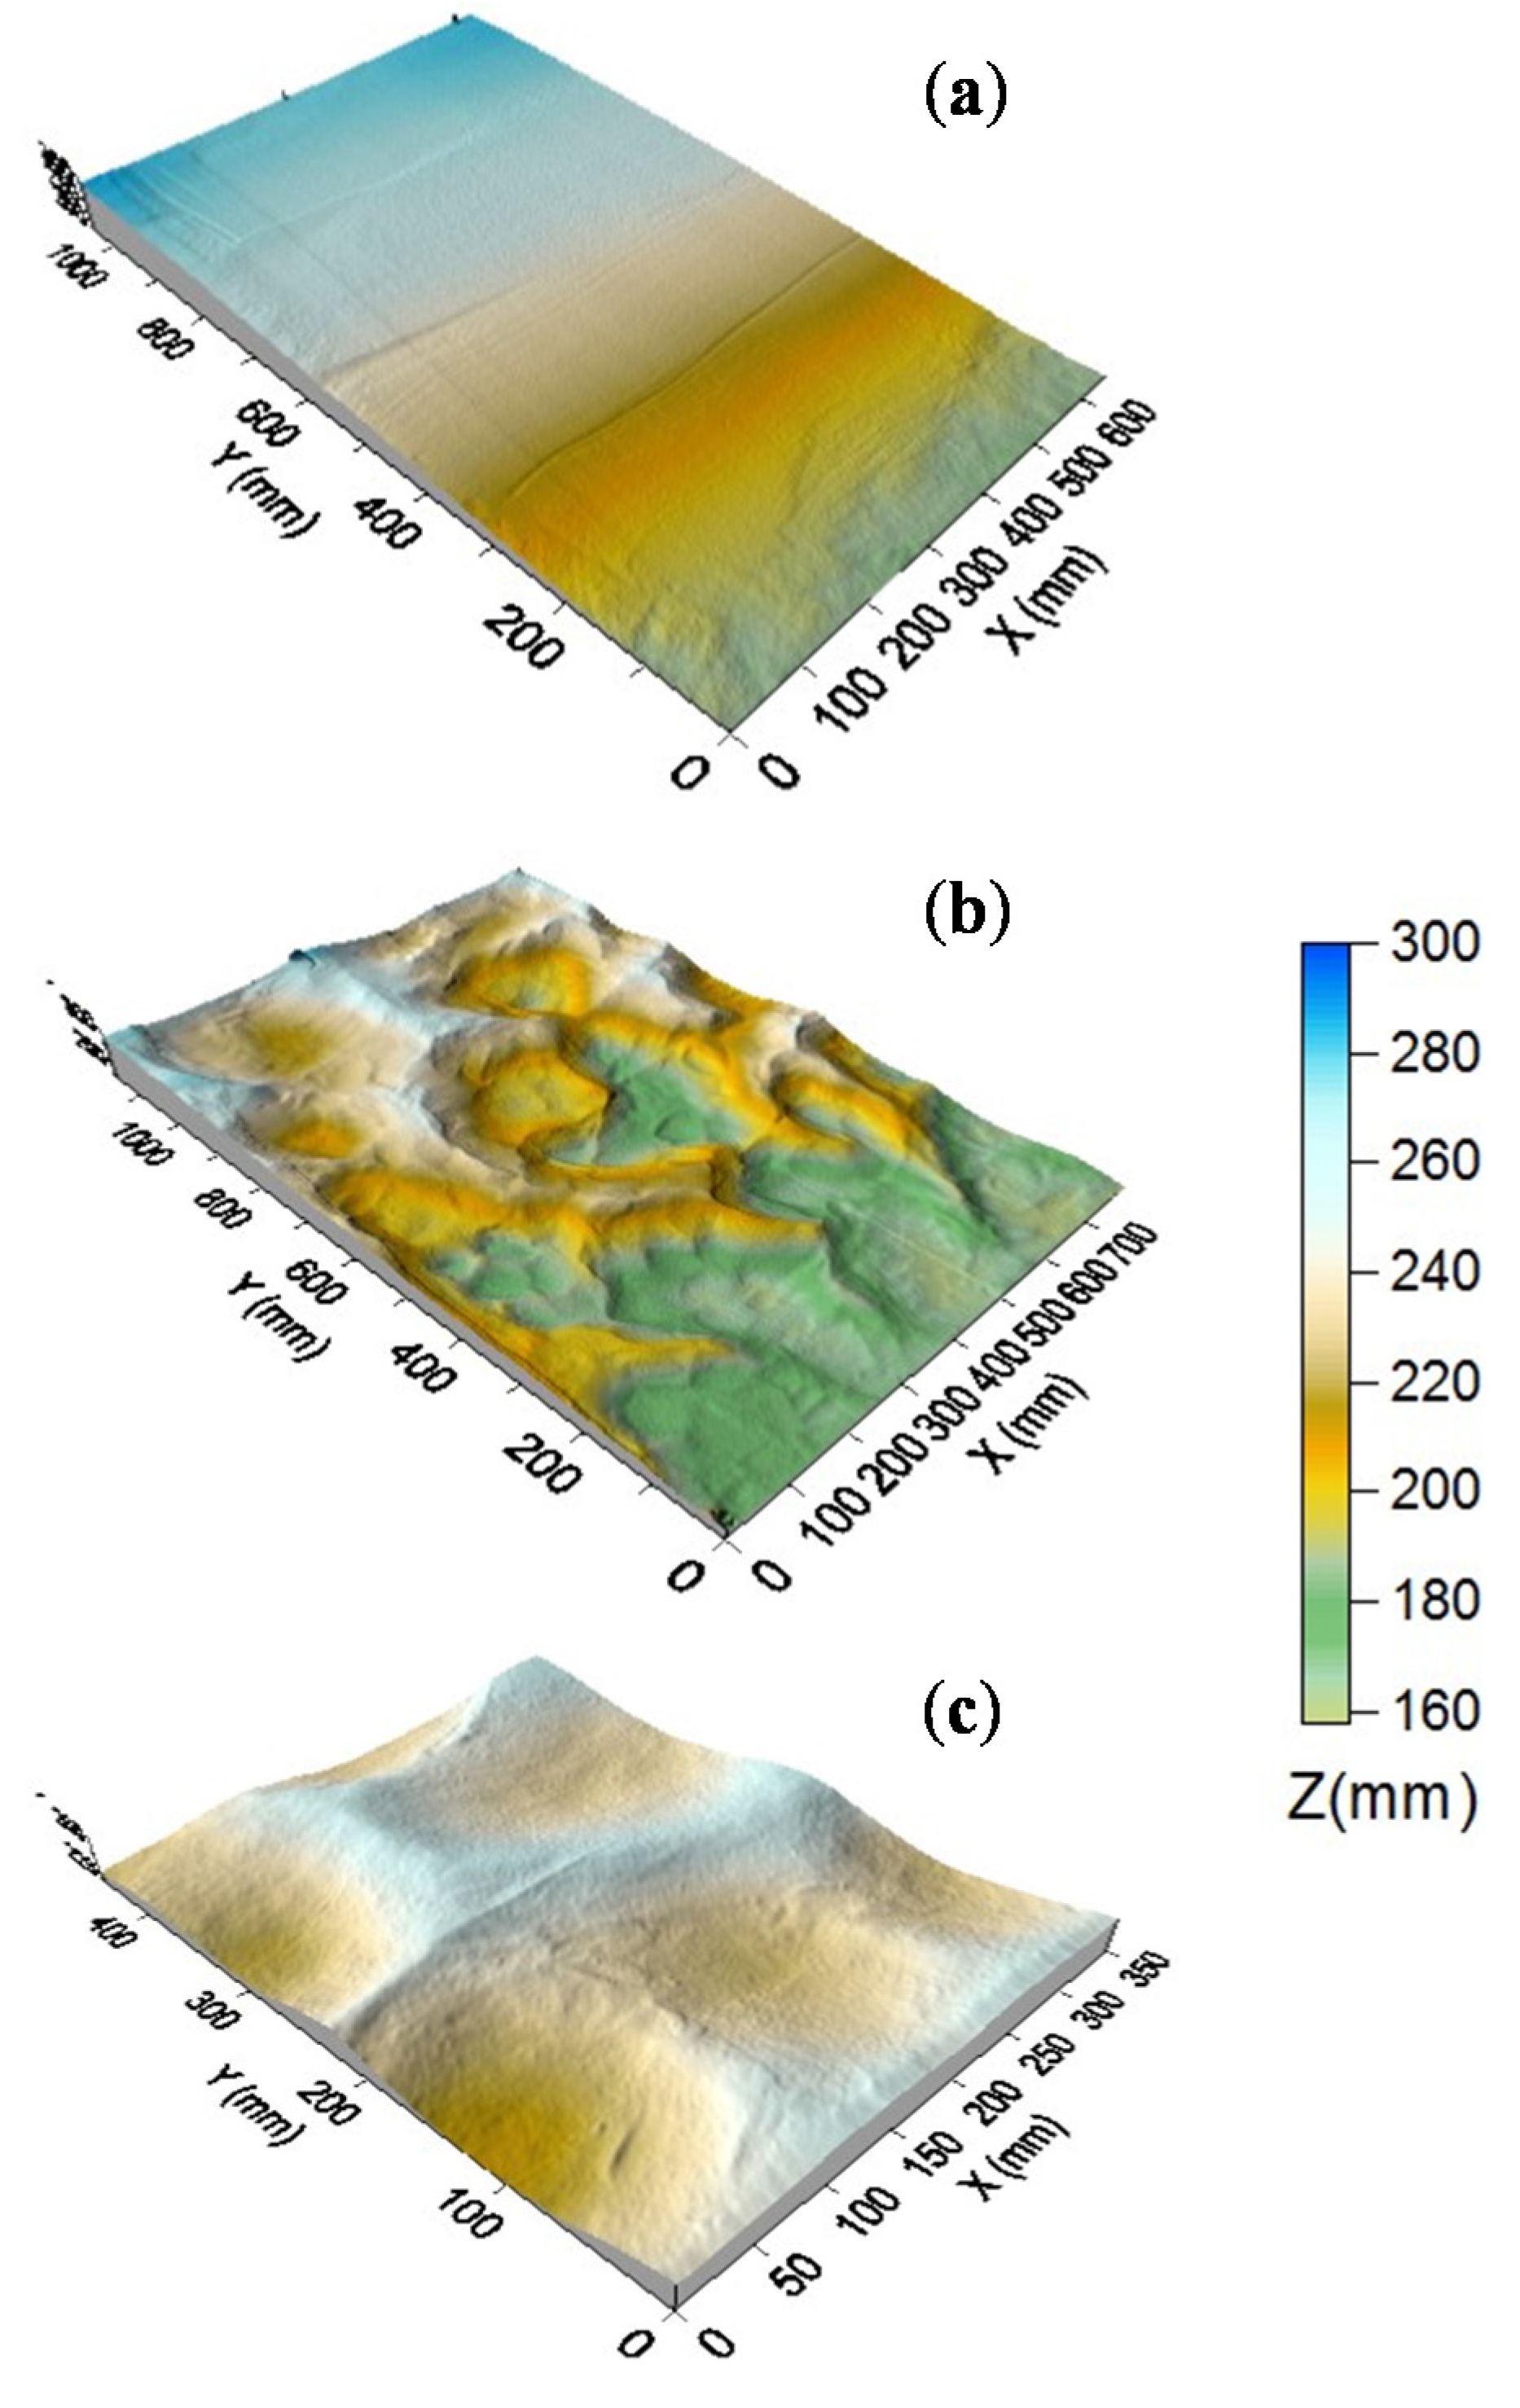
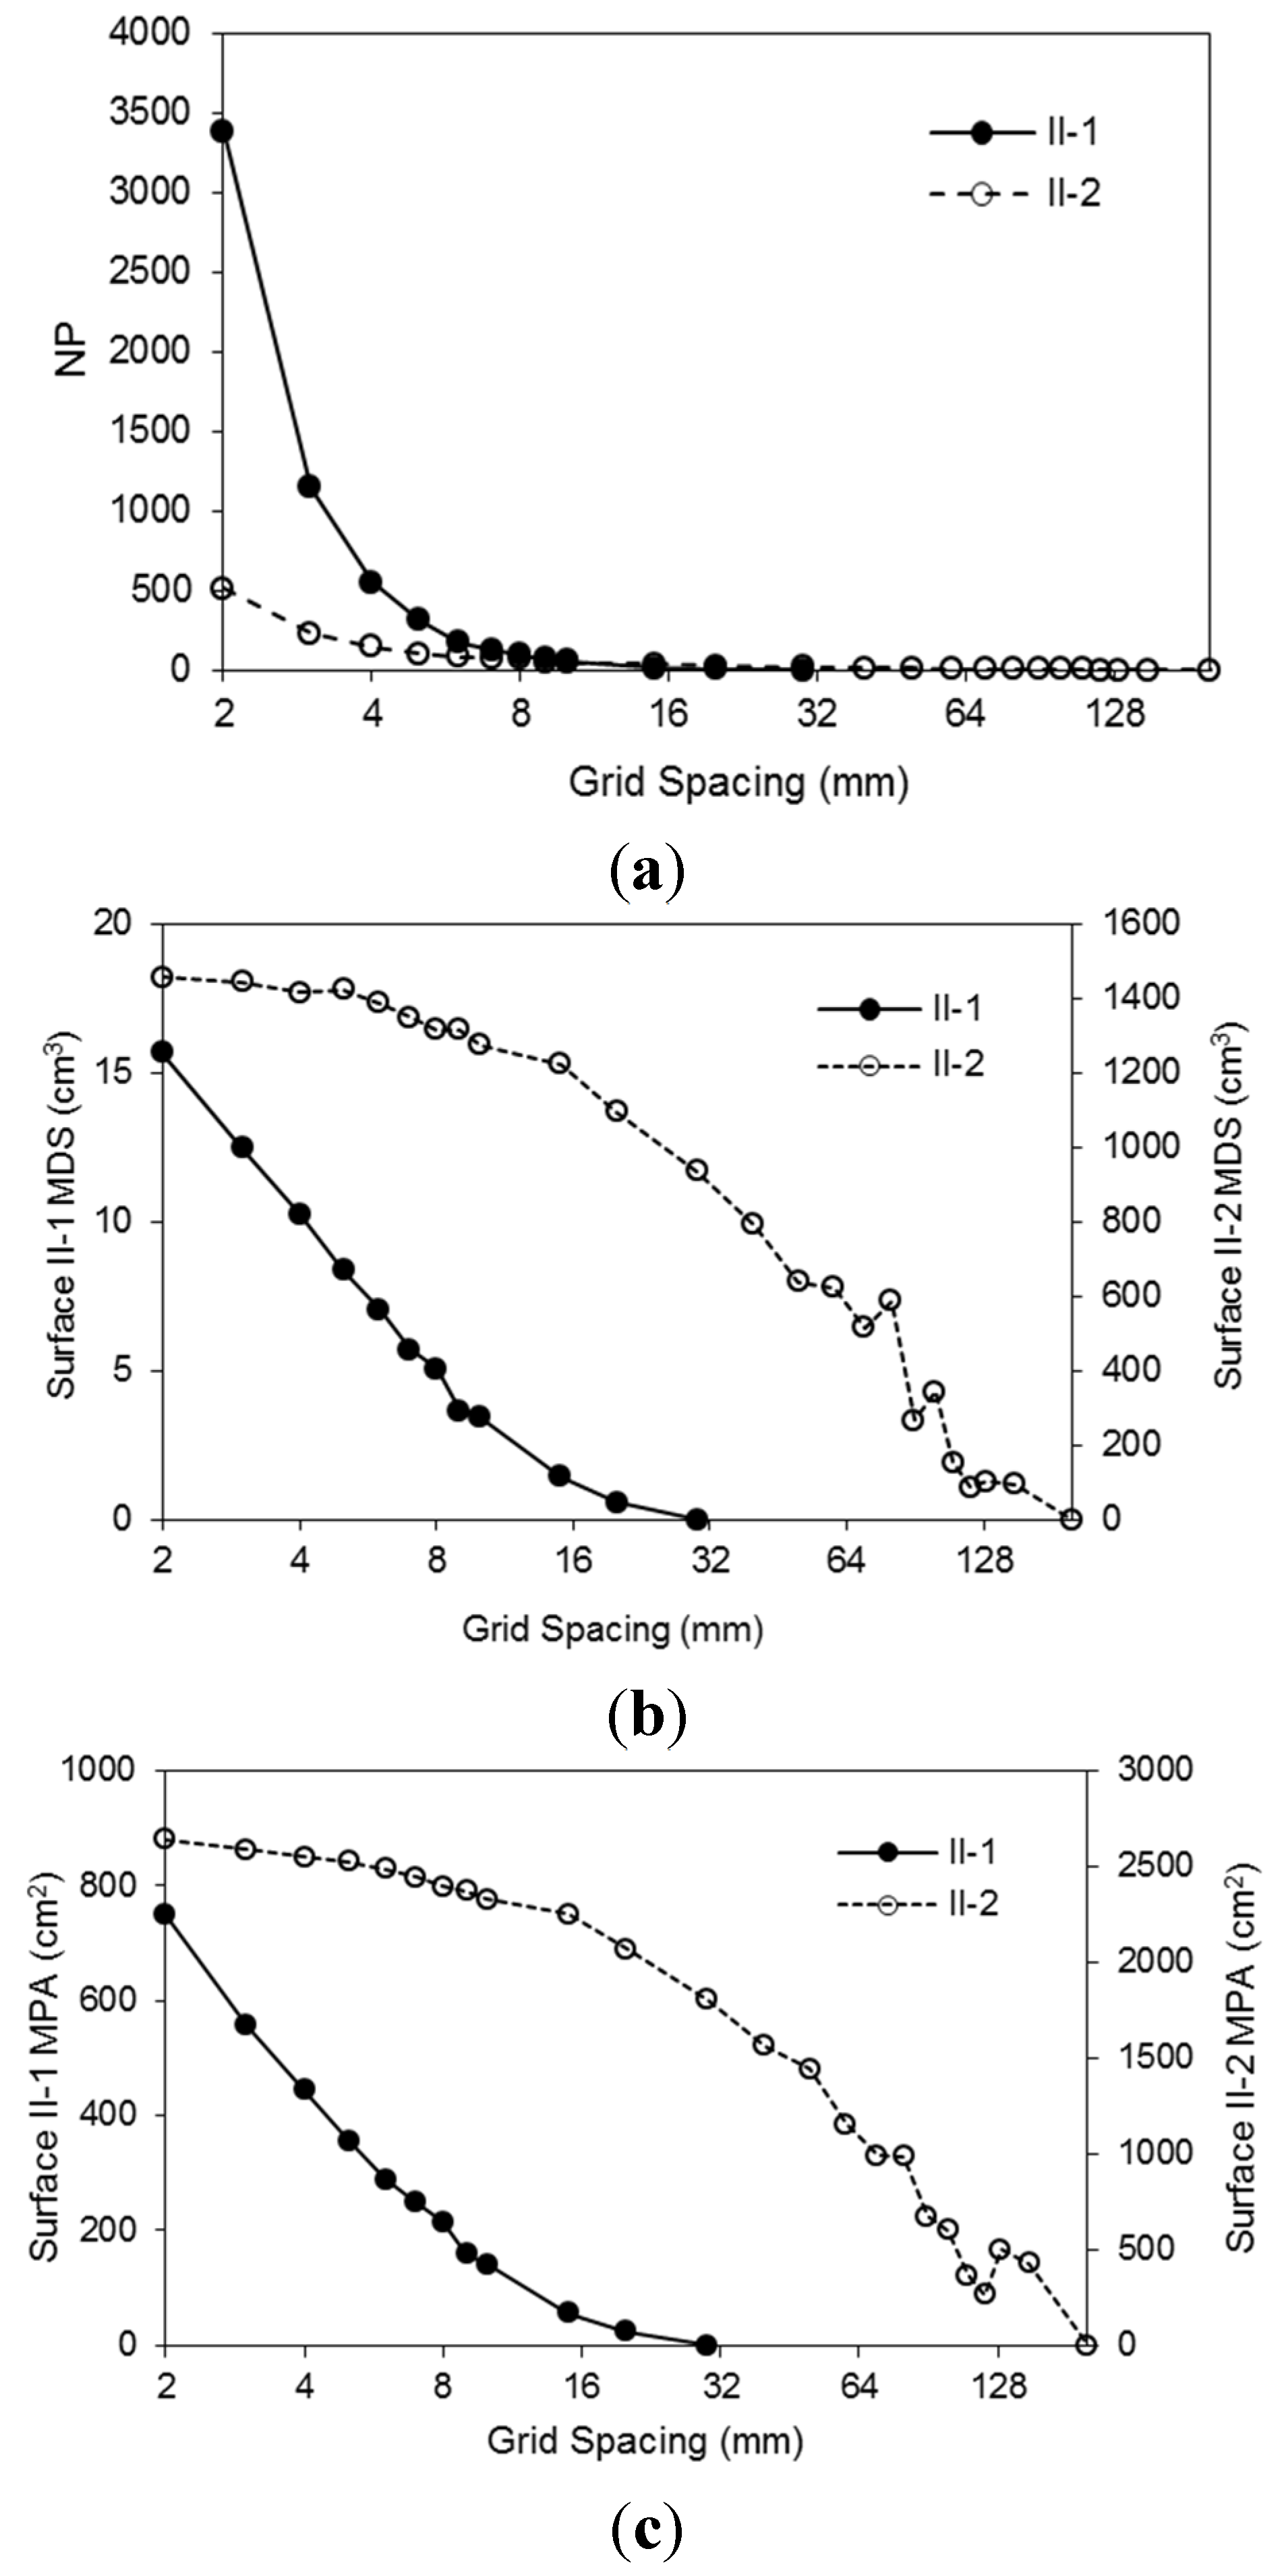
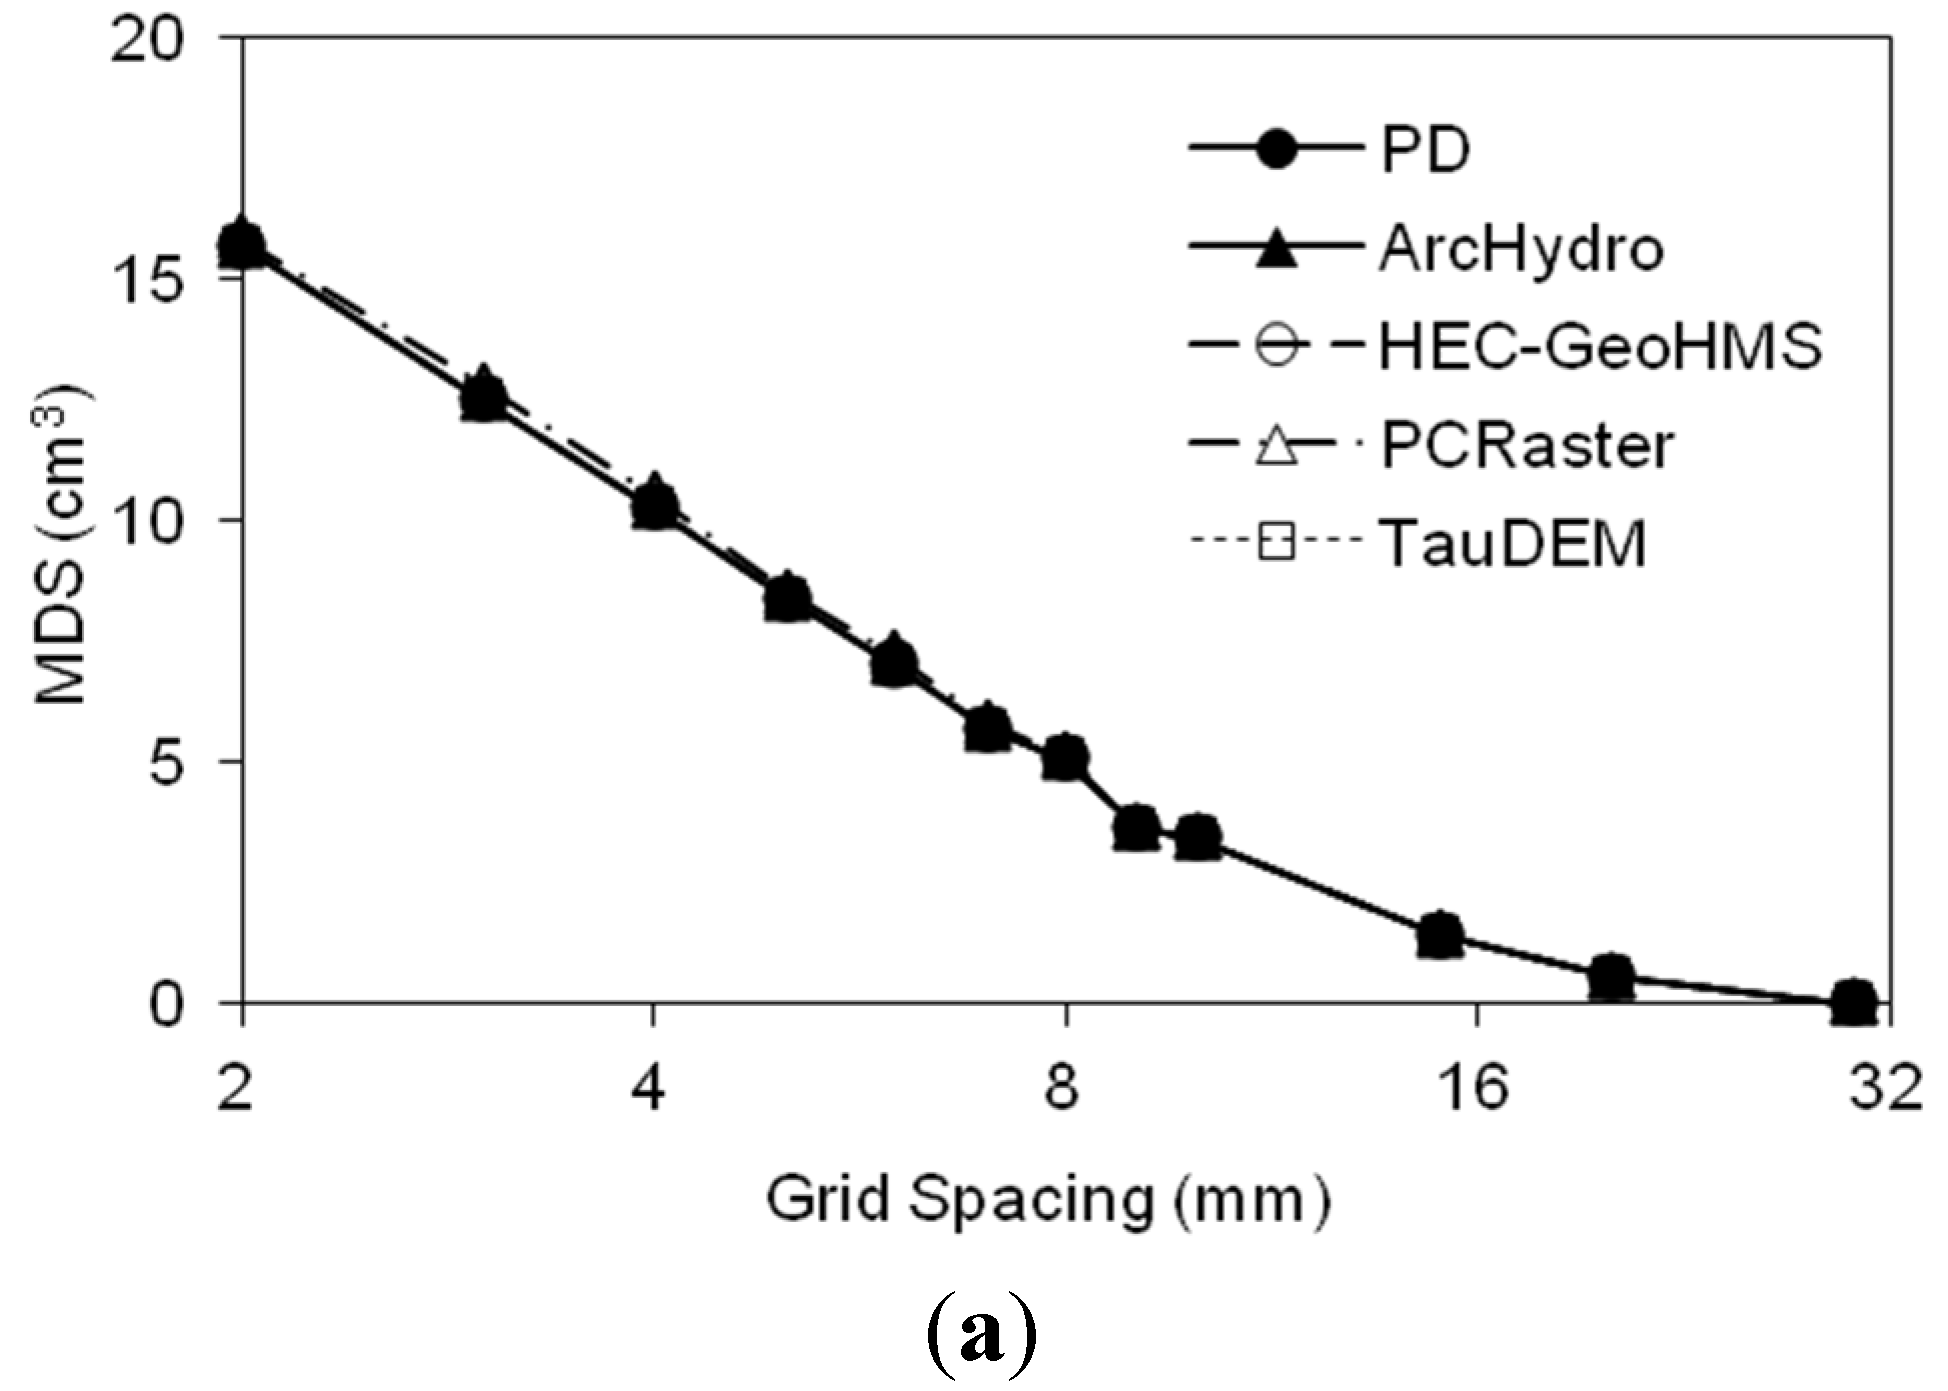
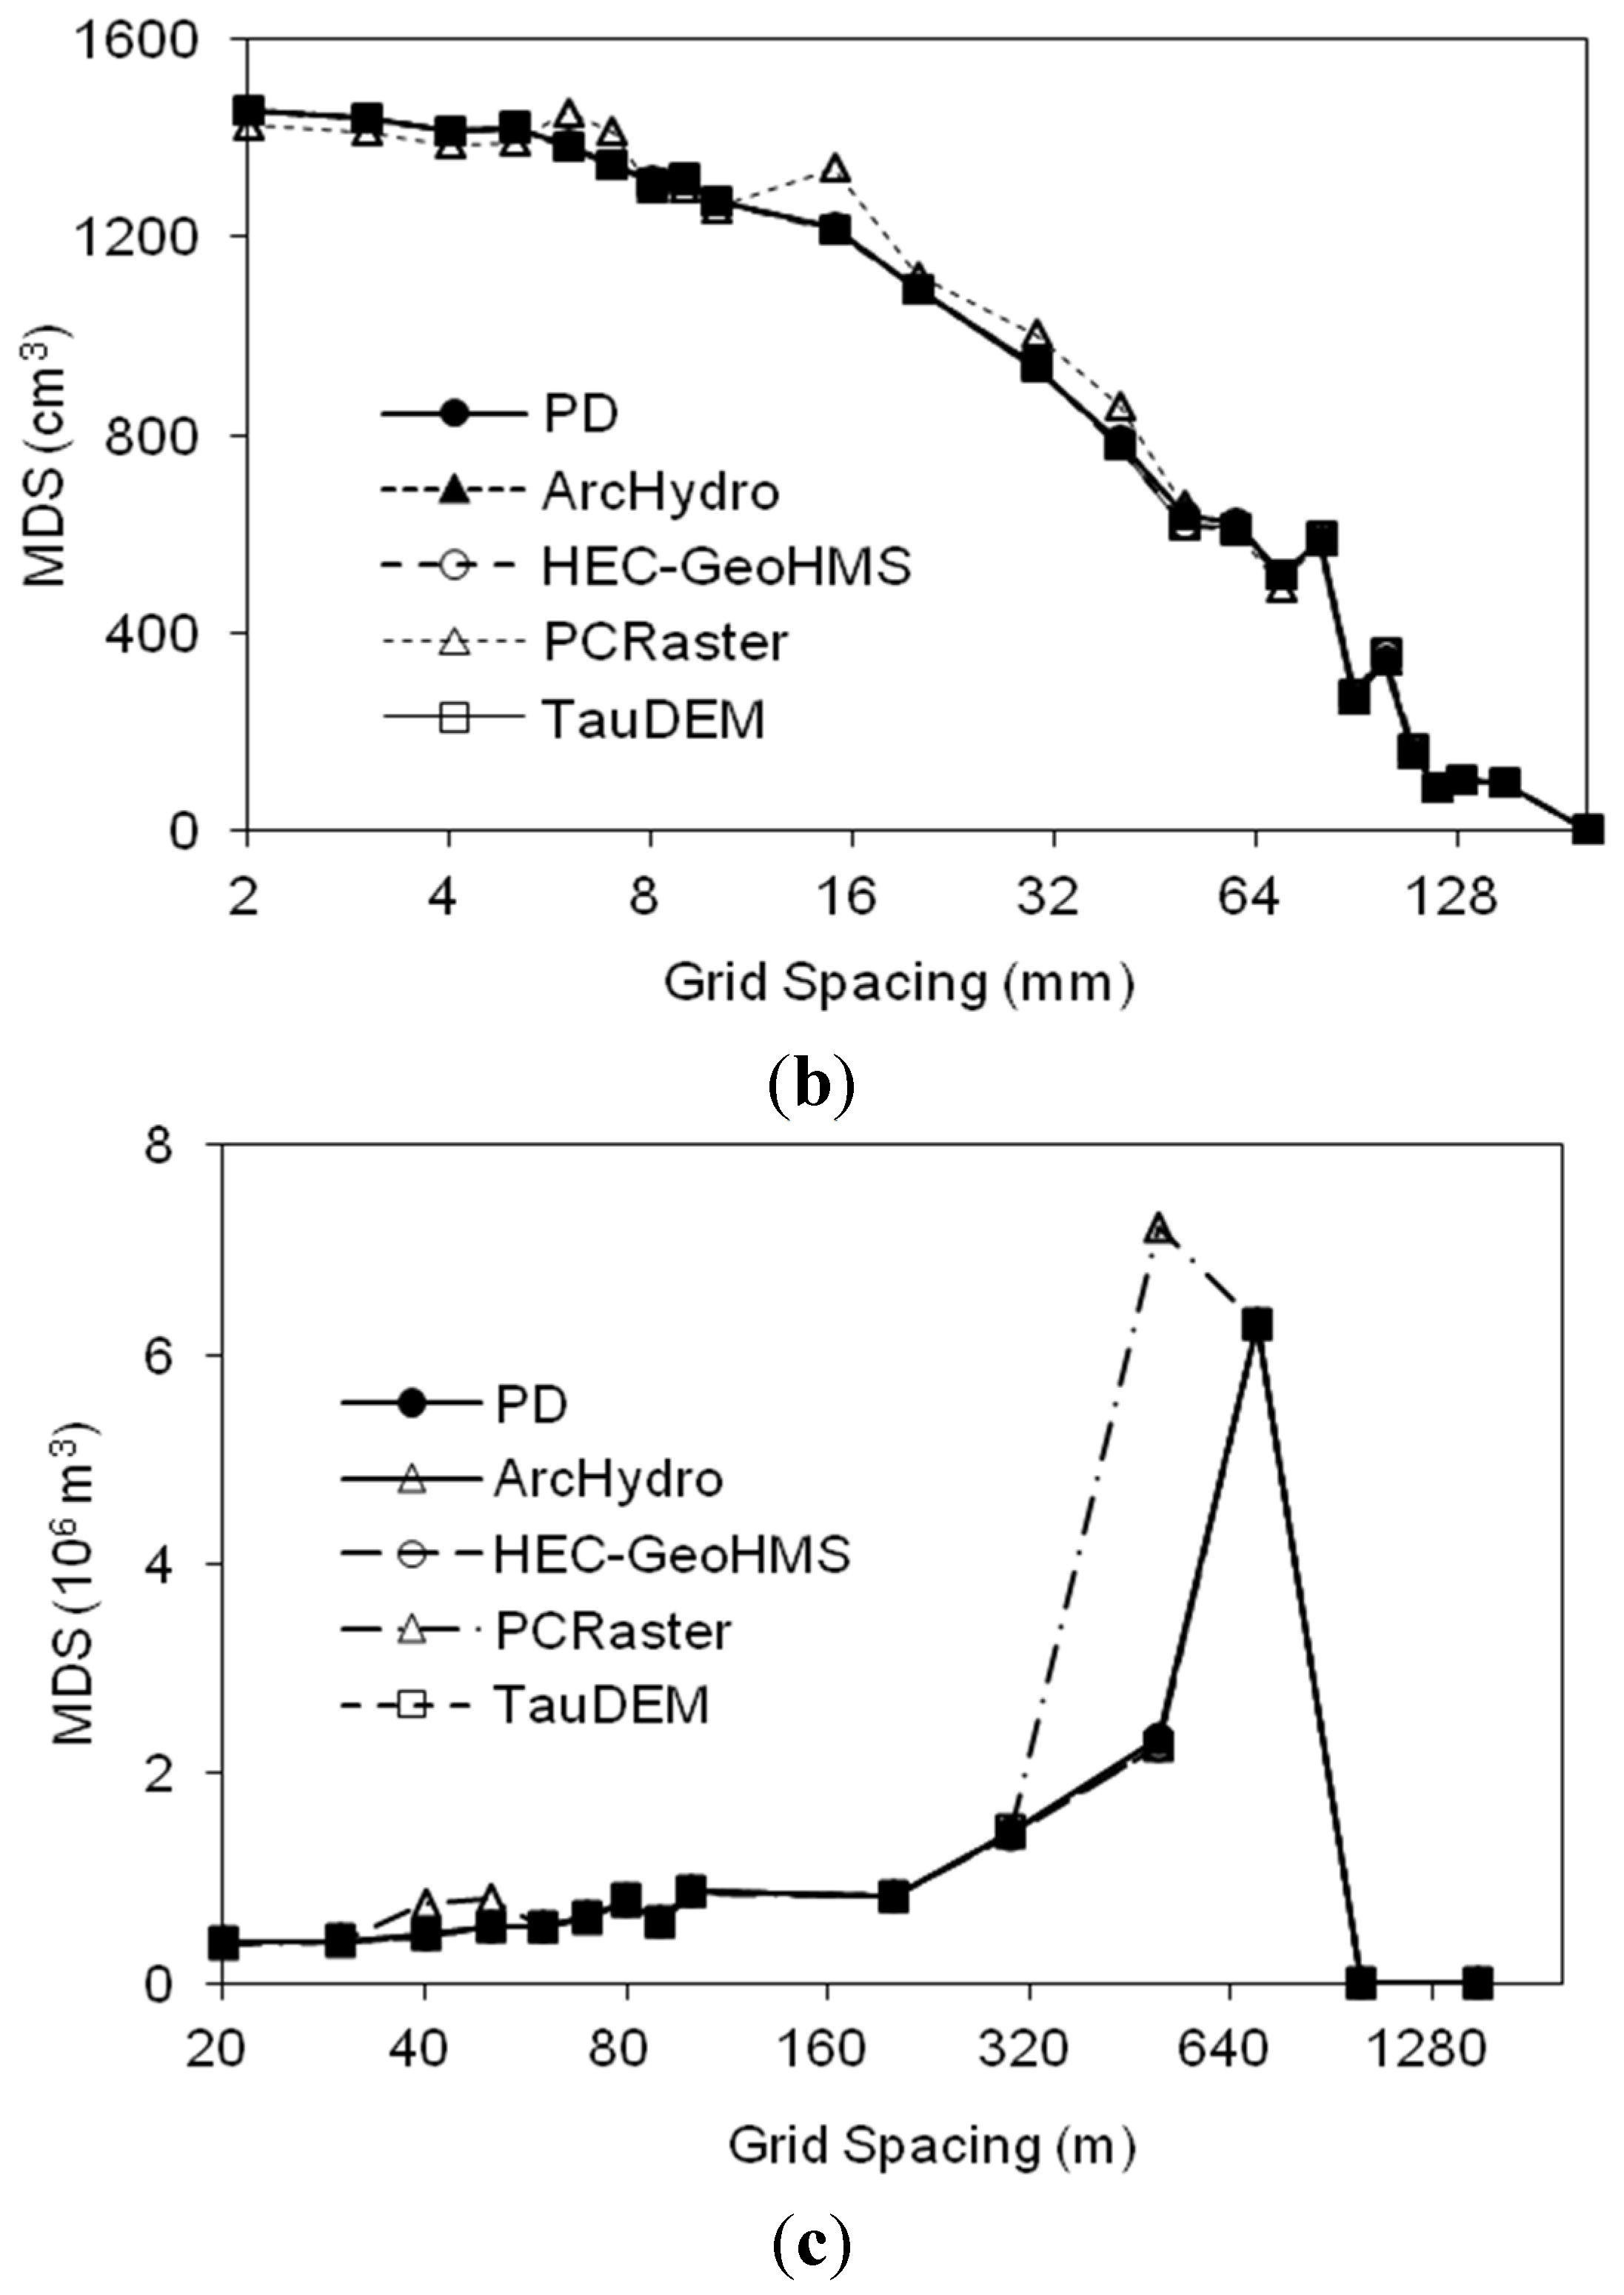
Figure 13 shows the comparison of MDS values calculated by the PD, ArcHydro, HEC-GeoHMS, PCRaster and TauDEM software packages for varying resolution DEMs of the laboratory Surfaces II-1 and II-2 (
Figure 2a,b), as well as the watershed-scale Surface III-5 (
Figure 3e). For the laboratory-scale smooth Surface II-1 (
Figure 2a), the five programs yielded almost identical MDS values for all grid sizes (
Figure 13a), showing that the MDS values decreased with increasing DEM grid size. For the laboratory-scale rough Surface II-2, the MDS values from the five programs followed similar decreasing patterns with an increase in the grid size. However, the MDS curve from PCRaster exhibited minor differences at certain grid size points (
Figure 13b). The MDS values were close to zero at
∆d = 200 mm for all five methods (
Figure 13b). For the watershed-scale Surface III-5, a significant difference in MDS can be observed at
∆d = 500 m (
Figure 13c). For Surface III-5, PCRaster yielded a peak MDS (7.23 × 10
6 m
3) at
∆d = 500 m, while the four other programs reached a peak MDS (6.29 × 10
6 m
3) at
∆d = 700 m (
Figure 13c).
Figure 12.
Demonstration of the changes of surface topographic characterization (maximum depression storage MDS and maximum ponding area MPA) determined by the kriging method and the PD software for Surfaces III-13 and III-14: (a) MDS; (b) MPA; (c) Surface III-13; (d) Surface III-14.
Figure 12.
Demonstration of the changes of surface topographic characterization (maximum depression storage MDS and maximum ponding area MPA) determined by the kriging method and the PD software for Surfaces III-13 and III-14: (a) MDS; (b) MPA; (c) Surface III-13; (d) Surface III-14.
Figure 13.
Relationships of grid spacing and maximum depression storage (MDS) determined by the PD, ArcHydro, HEC-GeoHMS, PCRaster and TauDEM software packages for: (a) Surface II-1; (b) Surface II-2; (c) Surface III-5.
Figure 13.
Relationships of grid spacing and maximum depression storage (MDS) determined by the PD, ArcHydro, HEC-GeoHMS, PCRaster and TauDEM software packages for: (a) Surface II-1; (b) Surface II-2; (c) Surface III-5.
Boundary conditions (e.g., closed or open boundaries) often affect the computation of MDS in a surface delineation program [
8]. This boundary-related issue involves how to deal with the depressions adjacent to surface boundaries and computation of related depression storages. Surface II-3 (
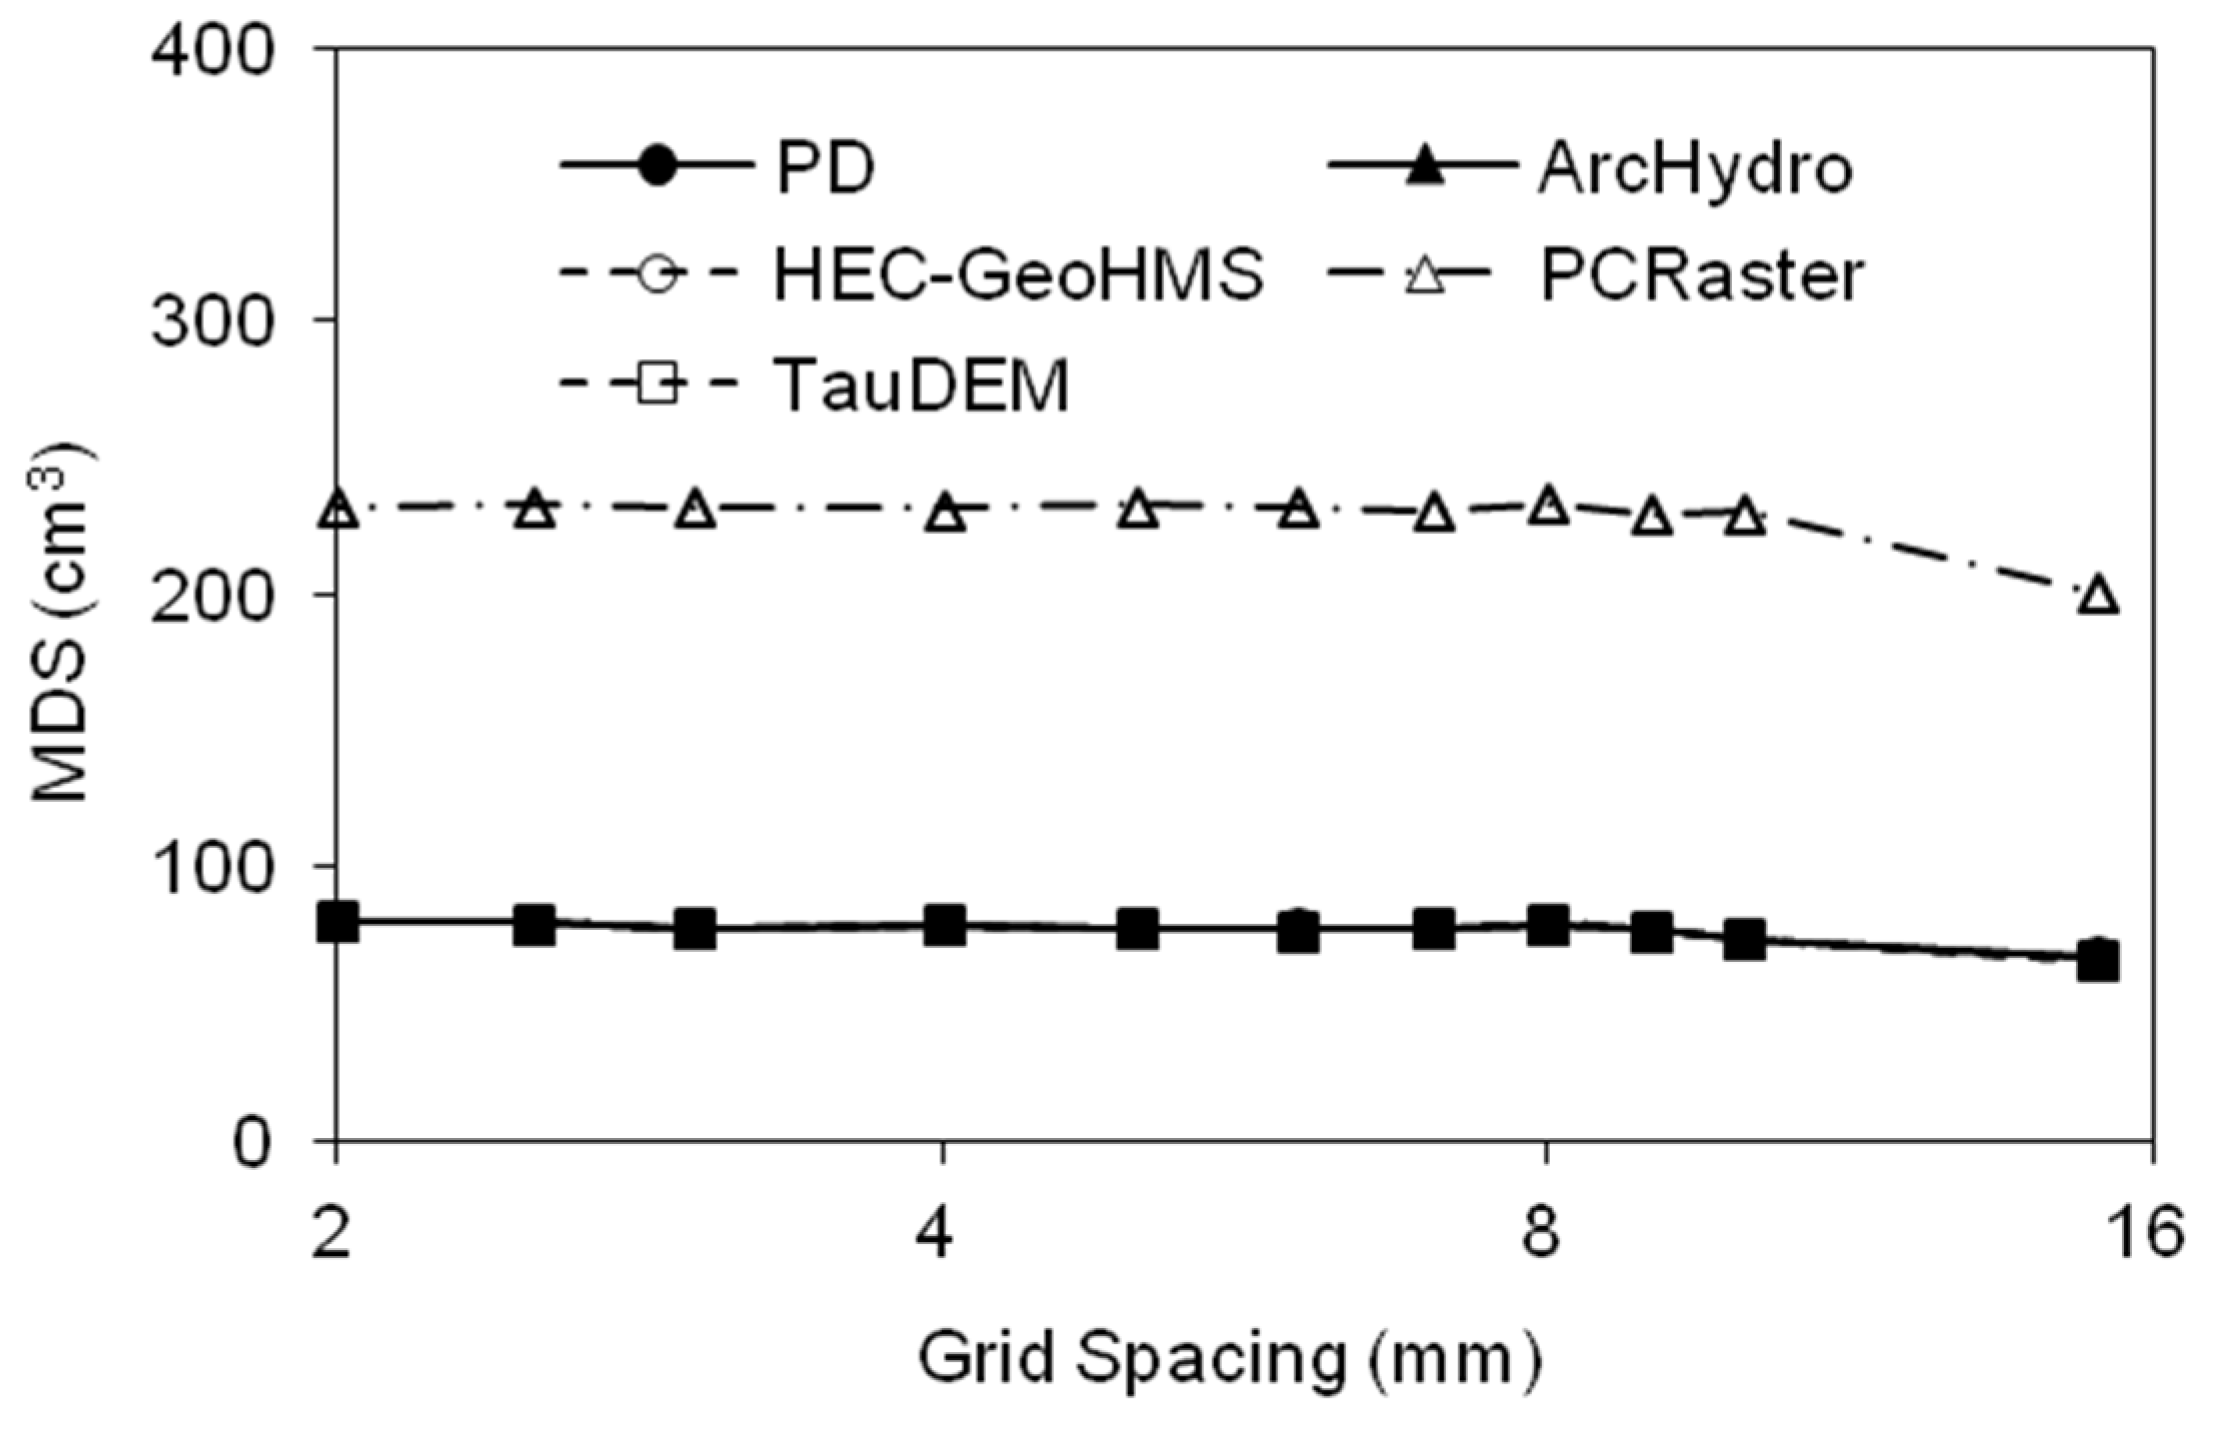
Figure 2c), featuring four major boundary depressions/puddles, was used to address this issue. Based on the original DEM of Surface II-3, eleven coarser resolution DEMs (
∆d = 2–15 mm) were generated for this study. PD, ArcHydro, PCRaster, HEC-GeoHMS and TauDEM were applied to compute the MDS of this laboratory surface. As shown in
Figure 14, PCRaster yielded much higher MDS values for all grid sizes, and the MDS remained nearly steady (
Figure 14). This can be attributed to the fact that a closed boundary condition was assumed in PCRaster. The four other programs provided similar MDS values, which were nearly constant for all grid sizes (
Figure 14). The aforementioned results suggest that different methods can be utilized in the surface delineation programs to deal with the boundary depressions or incomplete depressions/puddles, which could lead to different results. It is critical to fully understand the underlying assumptions in the programs.
Figure 14.
Relationships of grid spacing and maximum depression storage (MDS) determined by the PD, ArcHydro, HEC-GeoHMS, PCRaster and TauDEM software packages for Surface II-3 with boundary puddles.
Figure 14.
Relationships of grid spacing and maximum depression storage (MDS) determined by the PD, ArcHydro, HEC-GeoHMS, PCRaster and TauDEM software packages for Surface II-3 with boundary puddles.
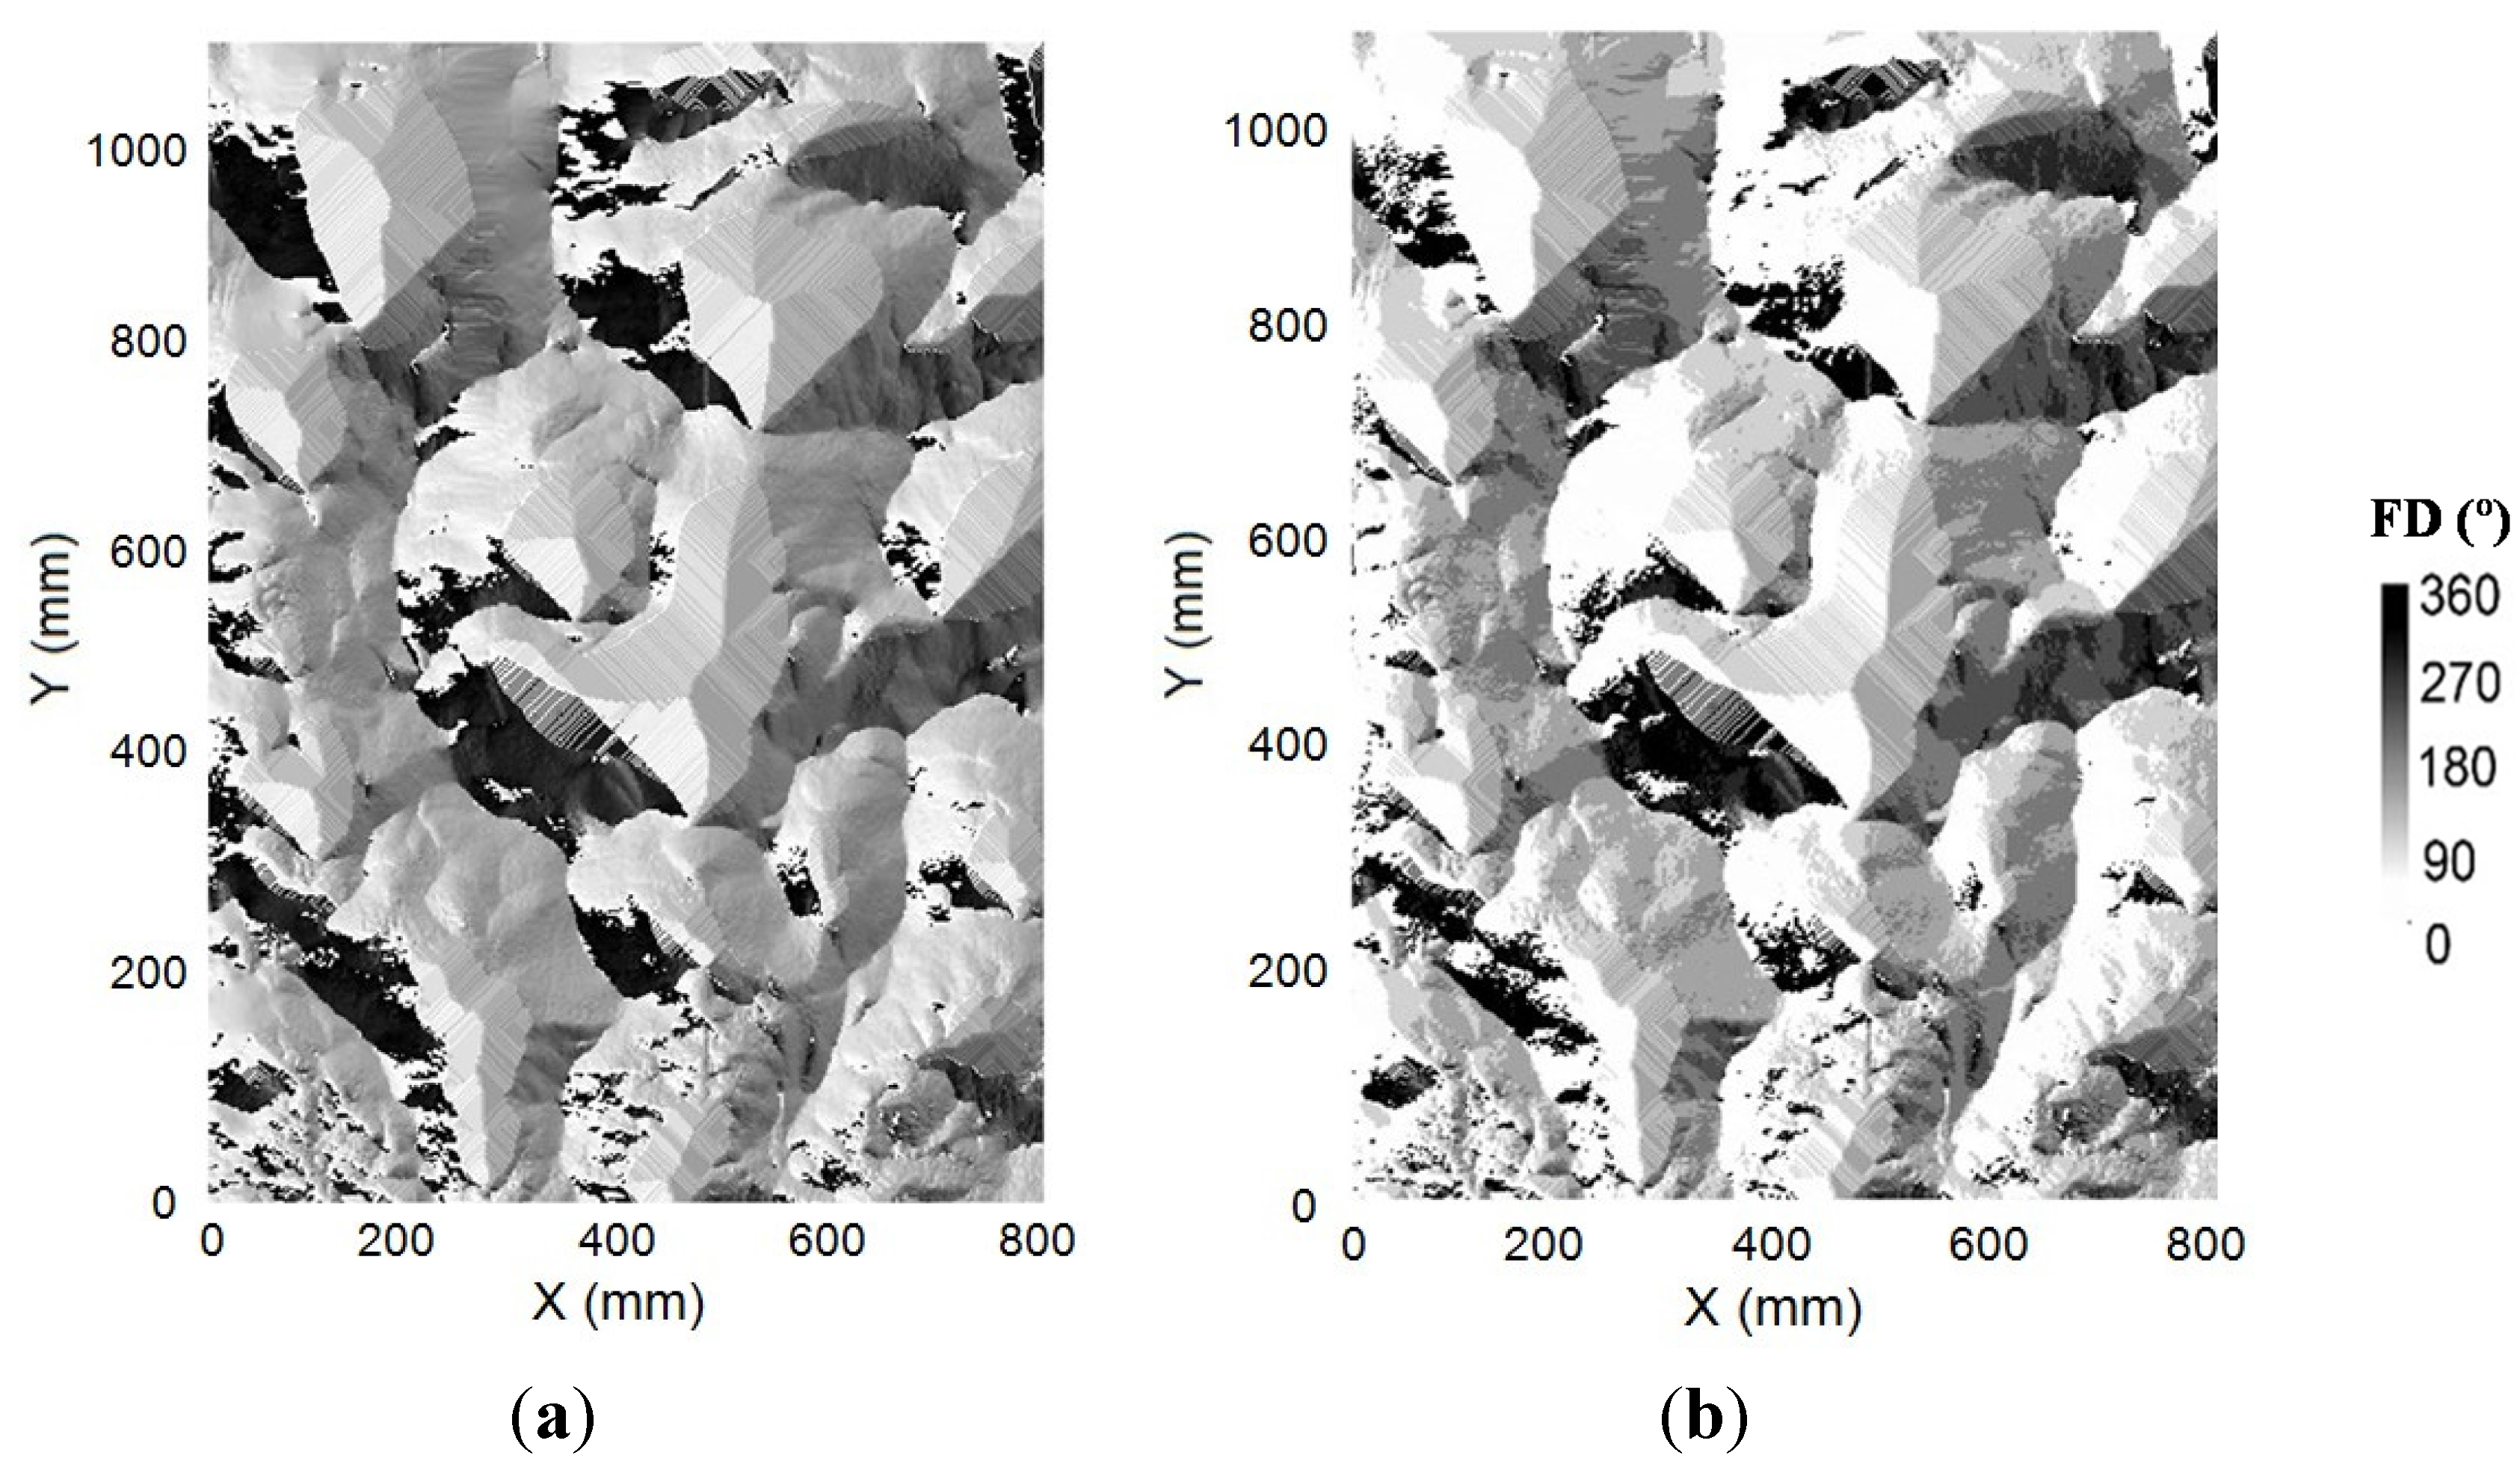
For various DEM resolutions, TauDEM yielded MDS values similar to those from PD, ArcHydro and HEC-GeoHMS. However, the D8 and D-infinity methods resulted in dissimilar flow directions. For comparison purposes, the eight flow directions from the D8 method were converted to angles (east: 0°; northeast: 45°; north: 90°; northwest: 135°; west: 180°; southwest: 225°; south: 270°; southeast: 315°).
Figure 15 shows the comparison of flow directions determined by the D-infinity and D8 methods for the laboratory Surface II-2 (
Figure 2b) and the watershed Surface III-5 (
Figure 3e). Although the overall distributions and changing patterns of flow directions from the two methods were similar for both surfaces (II-2 and III-5), the D-infinity method did provide more grey scales (
i.e., more flow directions). Additionally, certain discrepancies in flow directions at many local areas can be observed for both laboratory and watershed surfaces (
Figure 15). These differences and variations in flow directions would potentially alter flow accumulations and hydrologic connectivity and further affect watershed modeling.
Figure 15.
Comparison of flow directions computed by the D8 and D-infinity methods for laboratory Surface II-2 and watershed Surface III-5: (a) Surface II-2, D-infinity; (b) Surface II-2, D8; (c) Surface III-5, D-infinity; (d) Surface III-5, D8.
Figure 15.
Comparison of flow directions computed by the D8 and D-infinity methods for laboratory Surface II-2 and watershed Surface III-5: (a) Surface II-2, D-infinity; (b) Surface II-2, D8; (c) Surface III-5, D-infinity; (d) Surface III-5, D8.
