3.1. Flow Structures
For establishing the comparative reference results, the flow structures in the test gully without SGV are detected against which the flow structures detected from the test gully with SGV are compared to disclose the SGV impacts on the hydrodynamic performances. The basic flow structures identified from the flow snapshots detected at all the tested flow rates (
Q) of 10, 20, 30 and 40 L/min with single and twin entry flows remain similar for each type of test gullies. The basic flow structures in the test gullies without and with SGV are comparatively presented in
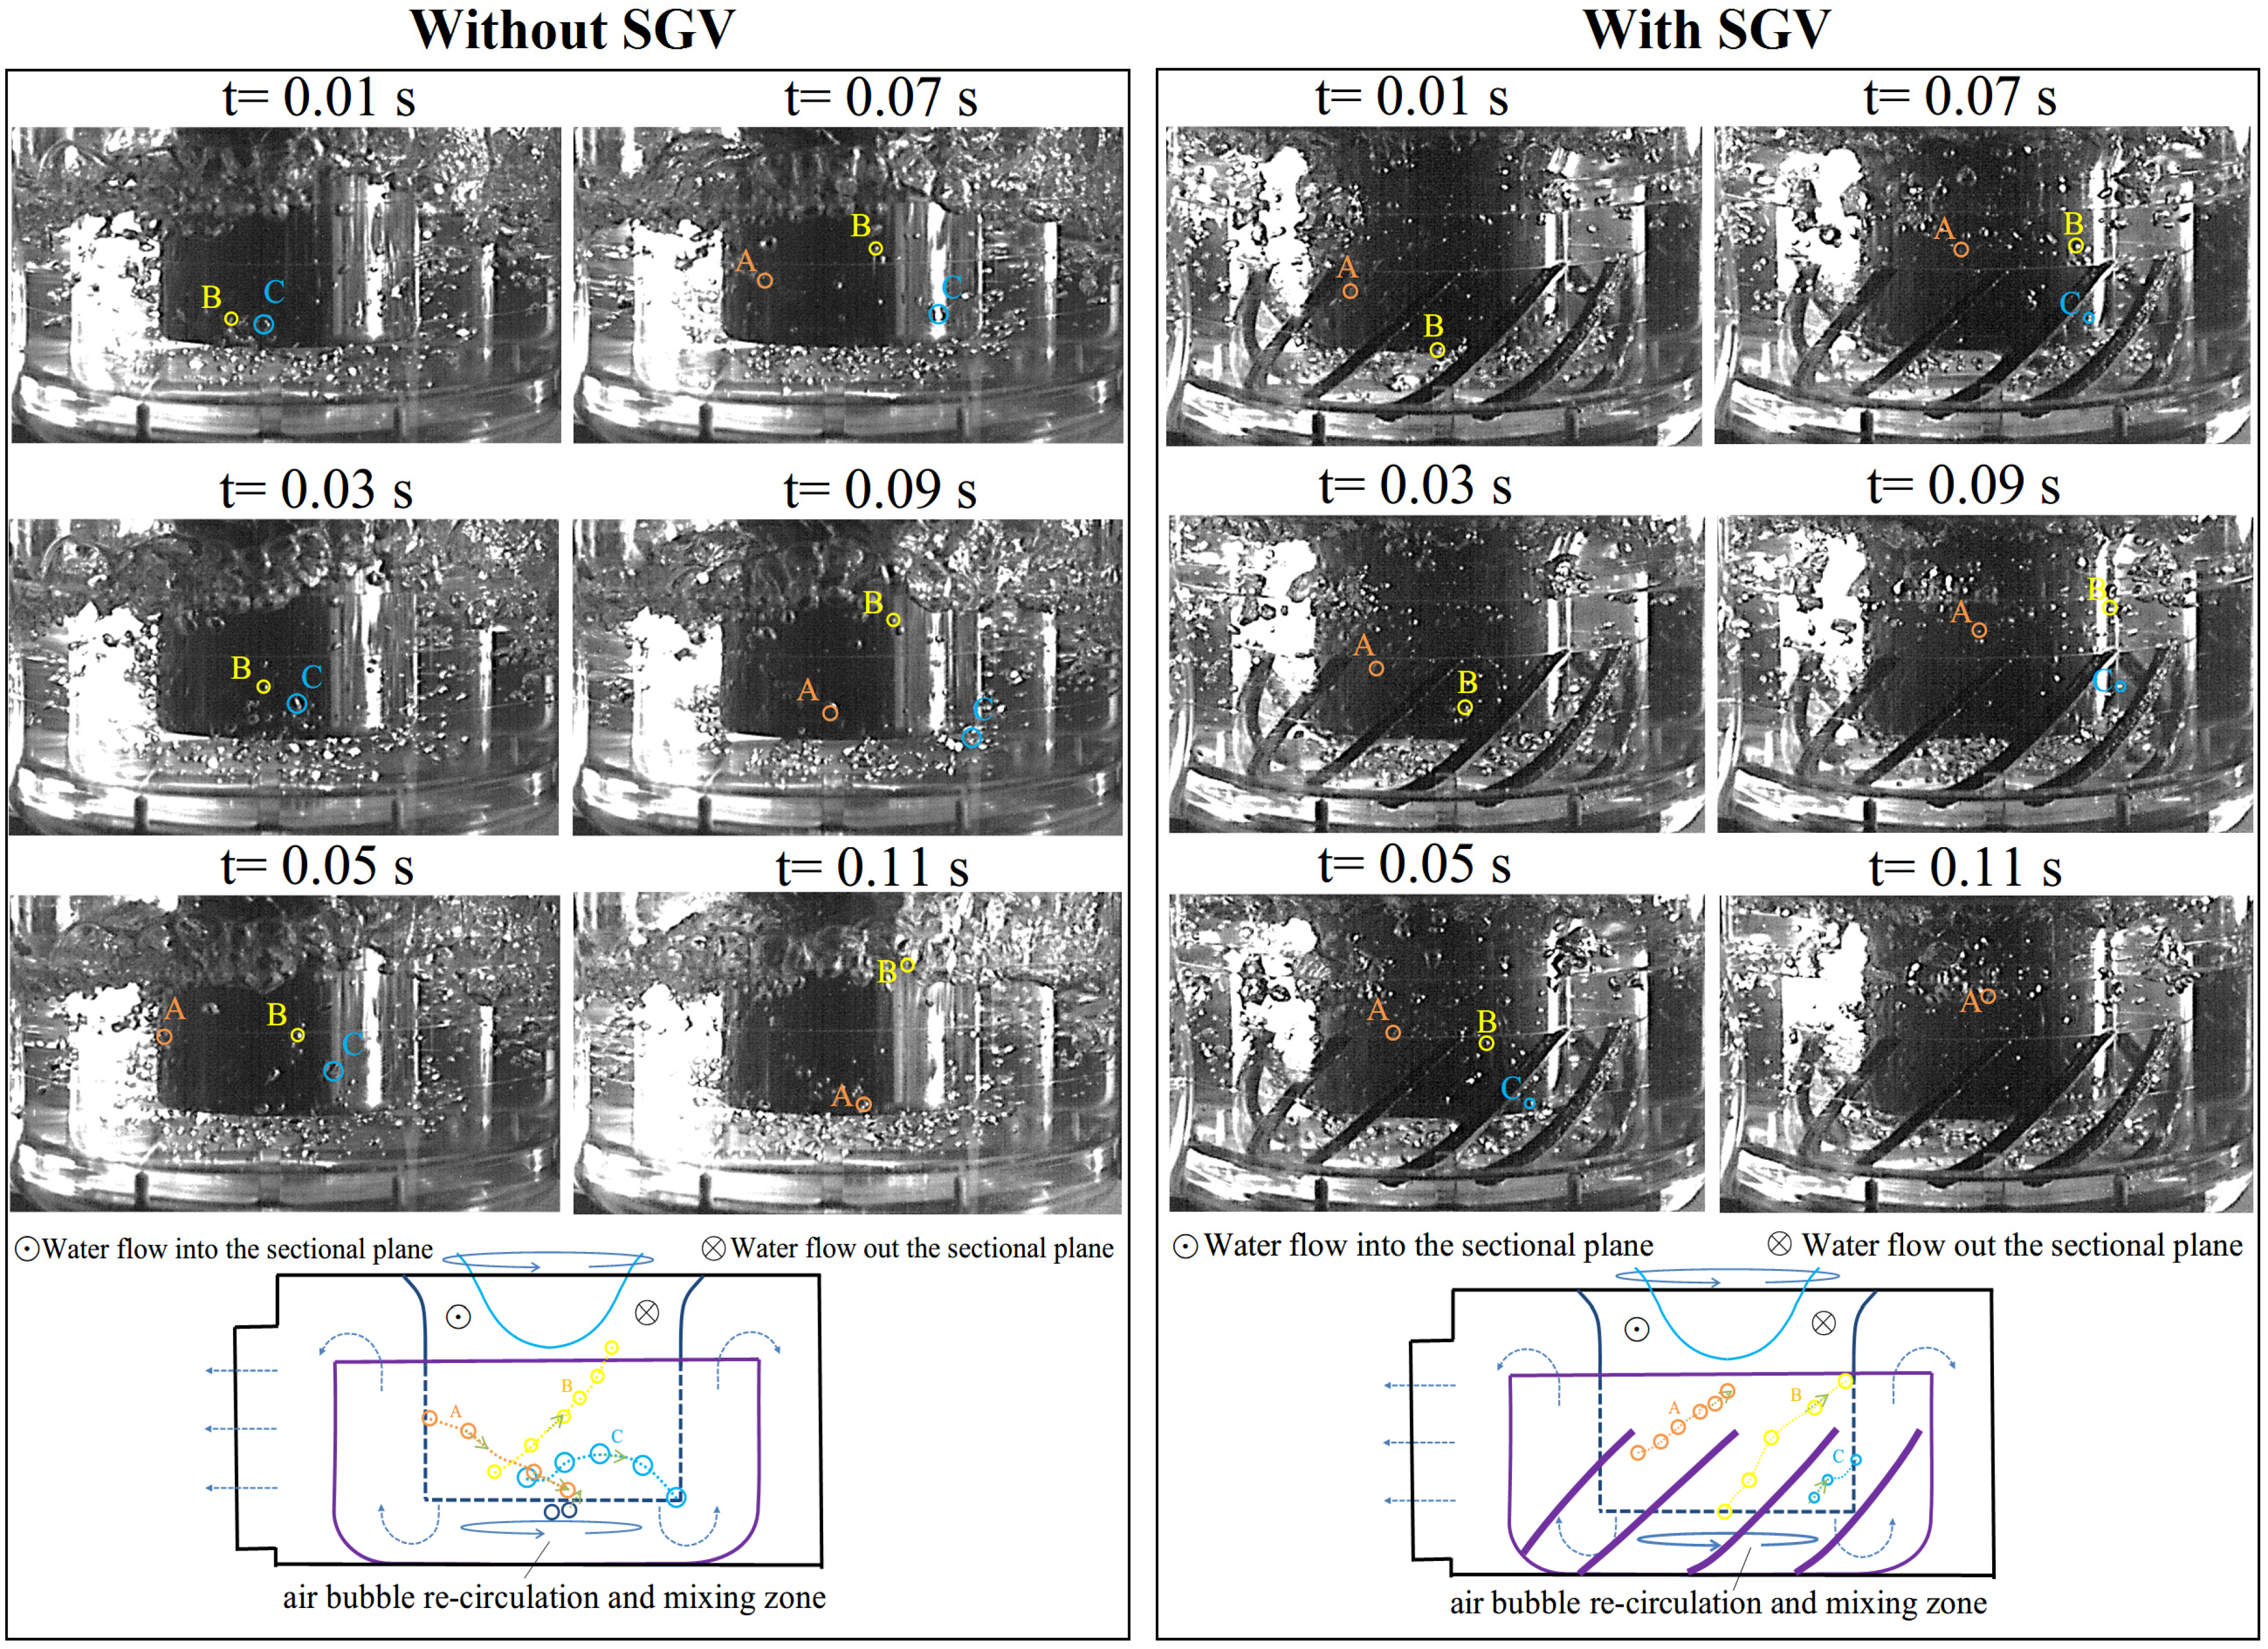
Figure 2 at the maximum discharging rates. Having charged the mixed water from the twin entry ports, an entry vortex is formulated to convect the downward air-water stream into the primary drum. Justified by the convex curvature along the free surface of the entry vortex, the regional hydrodynamic performances for this type of test gullies are governed by the free vortex flow. However, near the center of the entry vortex, the contour of vortex reverts to be concave, featuring the forced vortex. The entry vortex in the primary drum is thus a mixed vortex. After the downward vortical air-water stream impinging onto the base plate of the test gully, the radially spreading air-water flow turns to be up-lifted through the 180°. sharp bend into the annular pathway between primary and secondary drums. Air bubbles entrained by the entry vortex are formed and drifting in this annular flow pathway, emerging the noticeably differential air-water interfacial activities between the tested gullies without and with SGV as compared by
Figure 2. Clearly, the near-wall flows tripped by the angled SGV stratify the air bubbles to drift in the direction along the SGV orientation. In the test gully without SGV, the chaotic interactions among the up-drifting air bubbles take place in the annular passage, triggering considerable flow instabilities to amplify the air-pressure oscillations above the free surface between the primary and secondary drums. With the stabilized air-bubbles drift in the annular pathway among the upward flows for the test gully with SGV, the maximum discharging rates at present pressure potentials tested are increased more than 7% from those through the test gully without SGV.
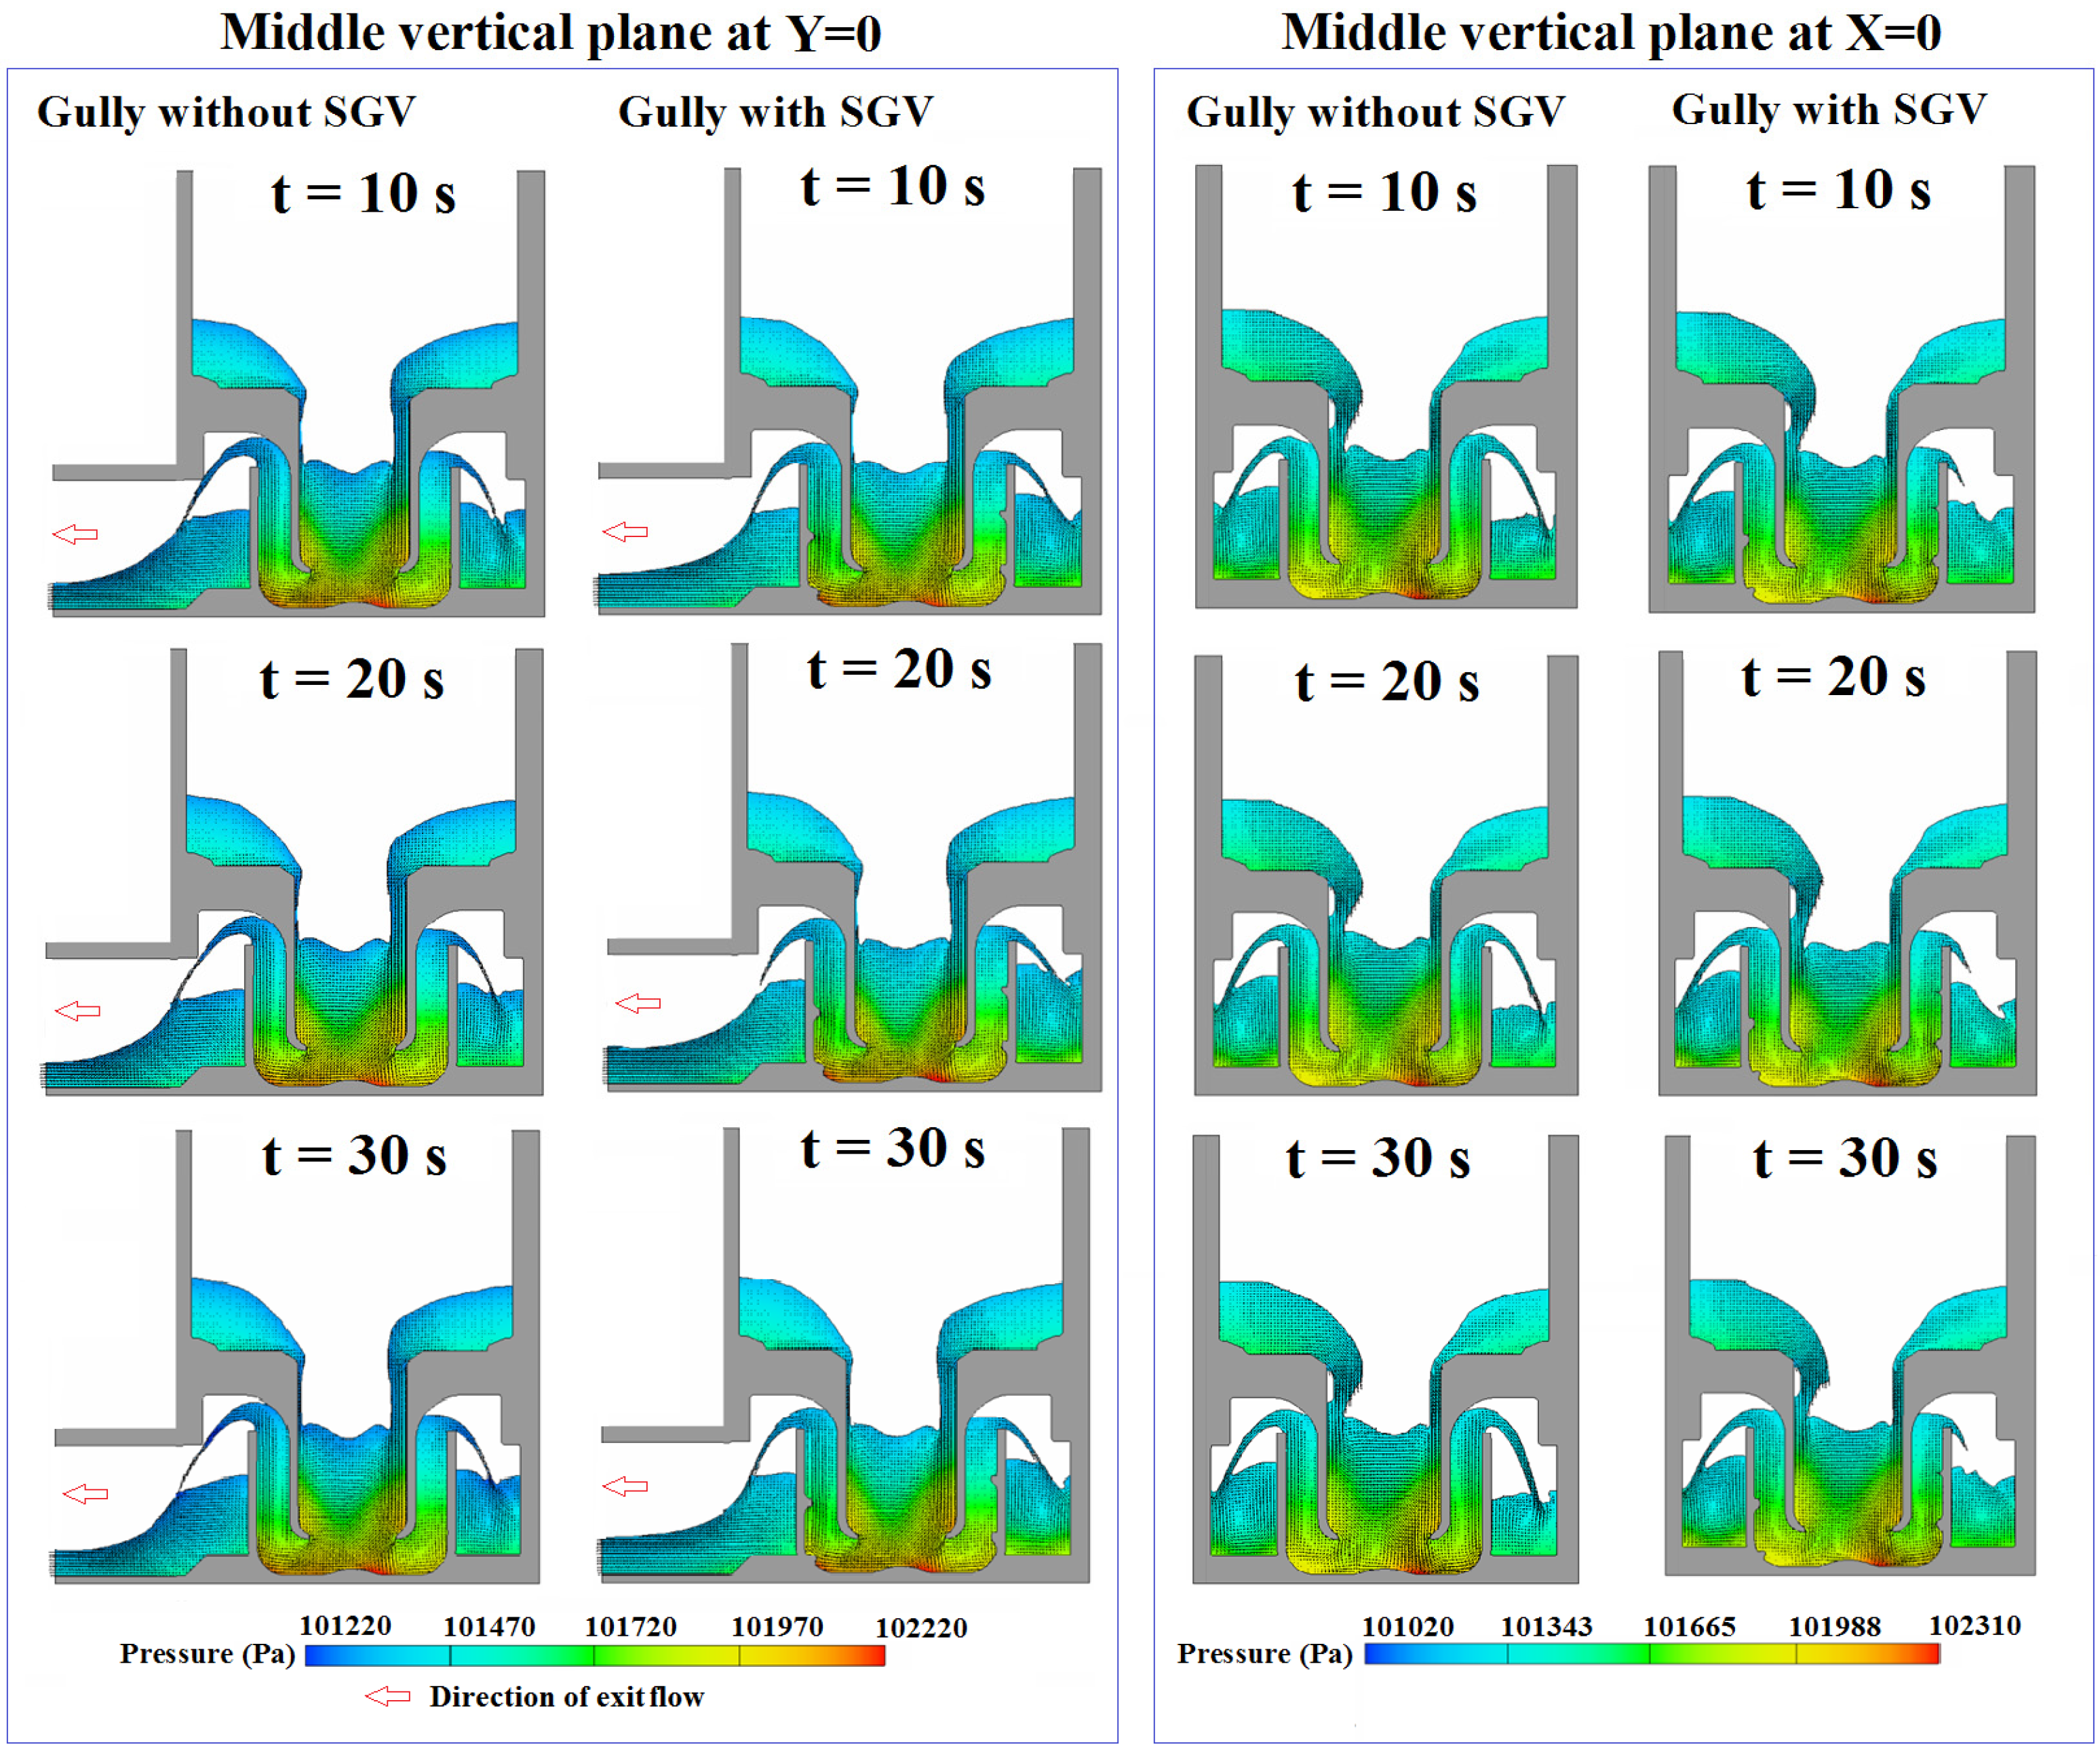
Numerical simulations successfully capture all the dominant flow structures detected by the experimental study for the test gullies with and without SGV. The numerical test results obtained at water inflow rate for each entry port at 15 L/min show favorable agreements with the experimental measurements, thus confirming the calculated flow and pressure fields at the air-water flow conditions. The distributions of instant fluid velocity and pressure over the middle vertical planes of
Y = 0 and
X = 0 at
t = 10, 20 and 30 s with
QA =
QB = 15 L/min are collected in
Figure 3. In primary drum and the annular pathway between primary and secondary drums, the typical gravity-driven hydrostatic pressure variations are observed. When the upward air-water stream spills out of the annular pathway, the radial spreading water screen emitted from the top rim of the secondary drum envelops air bubbles. The free surface surrounding the outer wall of the secondary drum takes the unsteady wavy pattern for both gullies as shown by
Figure 3. In the annular pathway between the primary and secondary drums and at the wavy free surface outside the secondary drum, the agitating bubbly air-water flows formulate the unstable flow region in this type of gully. Except in the agitating bubbly air-water flow region among which the air-bubble drifts are considerably affected by SGV as seen in
Figure 2, the air-water flows in the gullies with and without SGV as shown by
Figure 3 share the similar pattern. Many small-scale vortices with short life cycles are intermittently developed and resolved in both gullies with and without SGV.
Figure 2.
Air-water flow structures in test gully without SGV at QA + QB = 65 L/min andin test gully with SGV at QA + QB = 70 L/min.
Figure 2.
Air-water flow structures in test gully without SGV at QA + QB = 65 L/min andin test gully with SGV at QA + QB = 70 L/min.
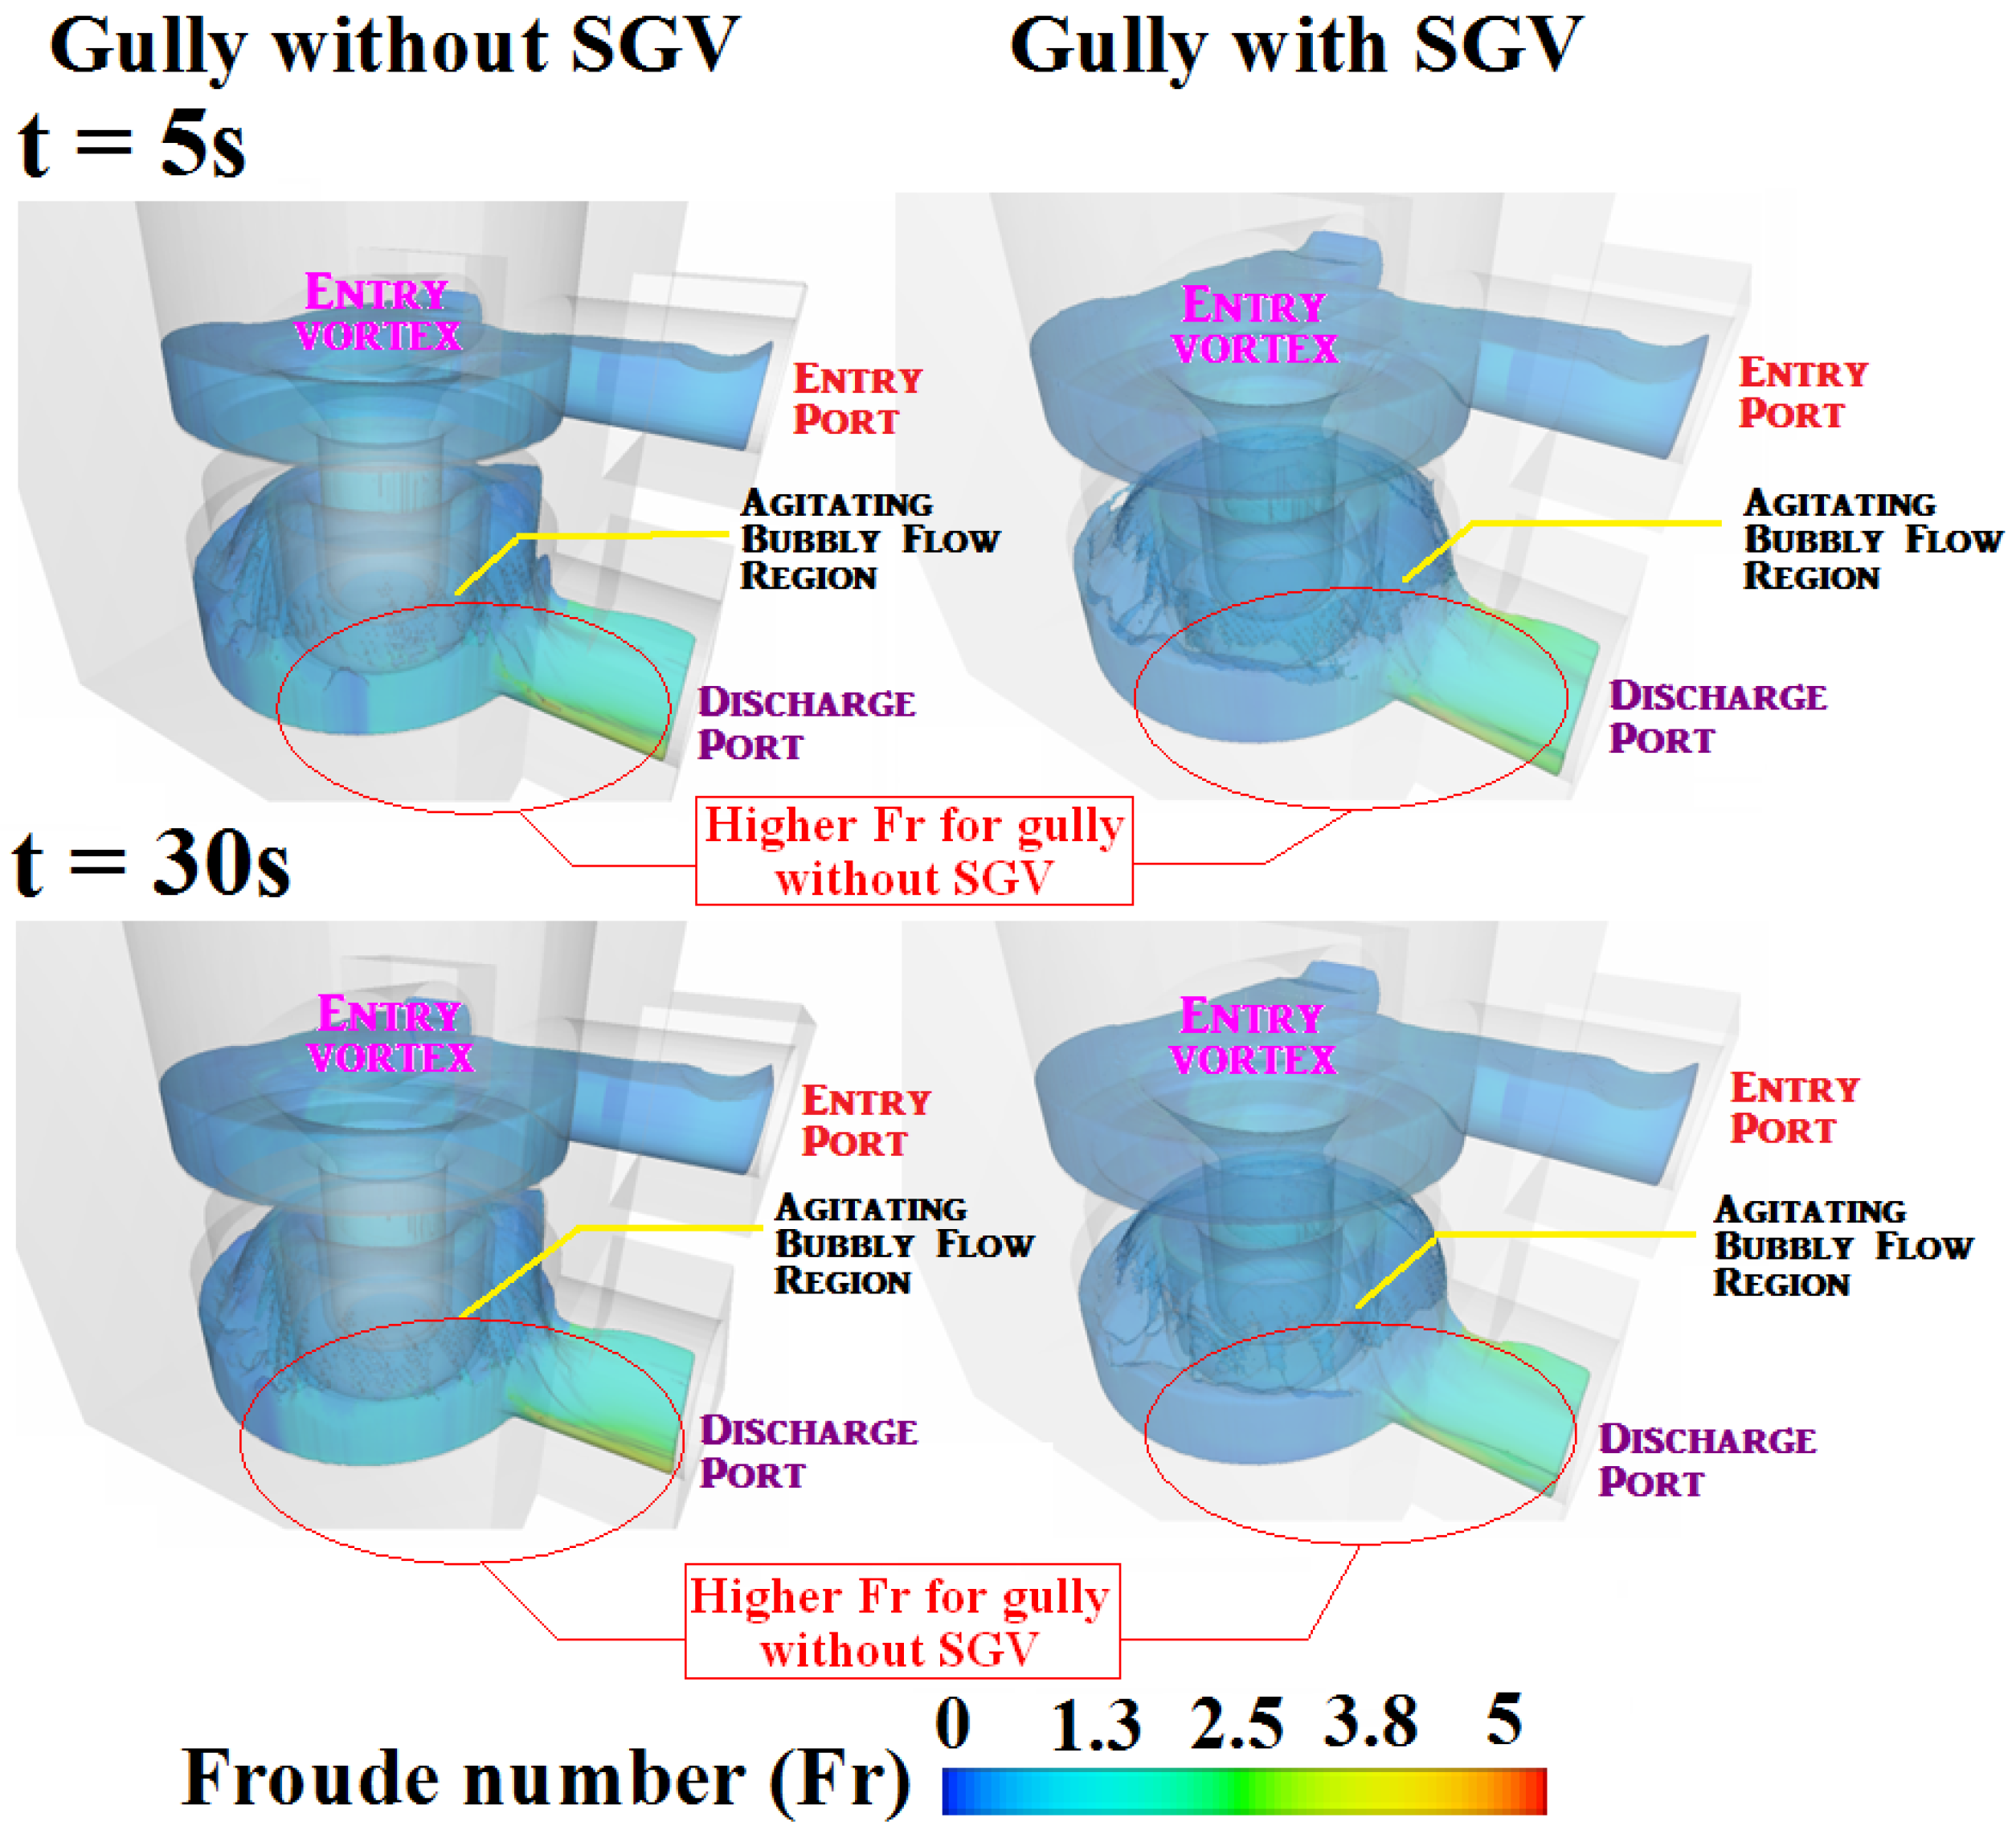
To depict the complex unsteady air-water flow structures in present gullies without and with SGV, the three dimensional distributions of instant Froude number (
Fr) at
t = 5 and 30 s are calculated and collected in
Figure 4. Present
Fr is defined as the ratio of fluid velocity to the gravitational wave velocity to physically respond the ratio of inertial to gravitational forces for indicating the relative resistances of submerged air bubbles moving through the water stream. As compared with
Figure 4, the
Fr levels among the agitating bubble flow region in the gully without SGV are higher than the counterparts in the gully with SGV. Even with the protruding SGV to add the associated frictional and form drags along the flow pathway in the gully with SGV, the flow resistances attributed to the chaotic air bubble agitations in the gully without SGV still supersede the additional flow resistances added by the SGV; which leads to the increased maximum flow rates under the same pressure heads from the discharges for the gully with SGV. In
Figure 4, the complete 3-D flow structures formulated by the entry vortex, agitating bubbly flow region along the serpentine flow pathway and the discharge flow with unsteady wavy free-surface are similar for both gullies without and with SGV to signify the characteristic flow pattern for this type of gully.
Figure 3.
Distributions of instant fluid velocity and pressure over middle vertical planes of Y = 0 and X = 0 at t = 10, 20 and 30 s with Q1 = Q2 = 15 L/min.
Figure 3.
Distributions of instant fluid velocity and pressure over middle vertical planes of Y = 0 and X = 0 at t = 10, 20 and 30 s with Q1 = Q2 = 15 L/min.
Figure 4.
Three dimensional distributions of instant Froude number reflecting the overall flow structures in gullies with and without SGV.
Figure 4.
Three dimensional distributions of instant Froude number reflecting the overall flow structures in gullies with and without SGV.
3.2. Air Entrainments by Entry Vortex
For this type of gully, the downstream air-water flow structures are affected by the flow phenomena caused by the entry vortex, which include the considerable air entrainments. Following the conventional vortex theory, considerable radial pressure variations over the free surface and among the vortex are generated and affected by local fluid velocities. This is demonstrated by
Figure 5, which compares the distributions of instant velocity and pressure contours between the gullies with and without SGV over three horizontal
XY planes at
Z = 22, 34 mm that are sectioned through the annular pathway between the primary and secondary drums and at
Z = 46 mm under the primary drum. As
Z increases, the gravitational effect increases the hydrostatic pressures in general, which is evidently shown by sequentially examining the three pressure contours obtained at
Z = 22, 34, 46 mm at each
t selected shown by
Figure 5. At
Z = 22 mm, the
XY section through the exit port is fully occupied by the airflow; whereas the evident anti-clockwise vortex circulation are already emerged to fully occupy the primary drum. At
Z = 34 mm, the pressures along the vortex outer edge are further elevated but moderated at
Z = 46 mm. When the downward vortex stream is radially spread on the
XY plane at
Z = 46 mm, the characteristic signatures for vortex are according weakened for both gullies as demonstrated by
Figure 5. With all the flow fields sectioned through the
XY planes at
Z = 22, 34 and 46 mm, the vortex core consistently show the lowest pressure levels due to the high fluid velocities. As the fluids approach the center of vortex, the increased fluid velocities are accompanied with the reduced static pressures. Once the static pressures over the free surface of the entry vortex fall less than the atmospheric level, the surrounding air above the entry vortex is entrained into the swirling liquid pool and converted to the air-bubbles by the surface tension effect. With the air entrainments by the entry vortex, a considerable amount of drifting air bubbles in the flow pathways is consistently observed even if the void fraction (α) over the flow entry ports is zero at the a full-water conditions. Although the resolving air bubbles in the present test gully are partially attributed to the local pressure reductions along the flow pathway, the air entrainment by the entry vortex is considered as the manifesting mechanism responsible for introducing air bubbles into the water stream. This is demonstrated by
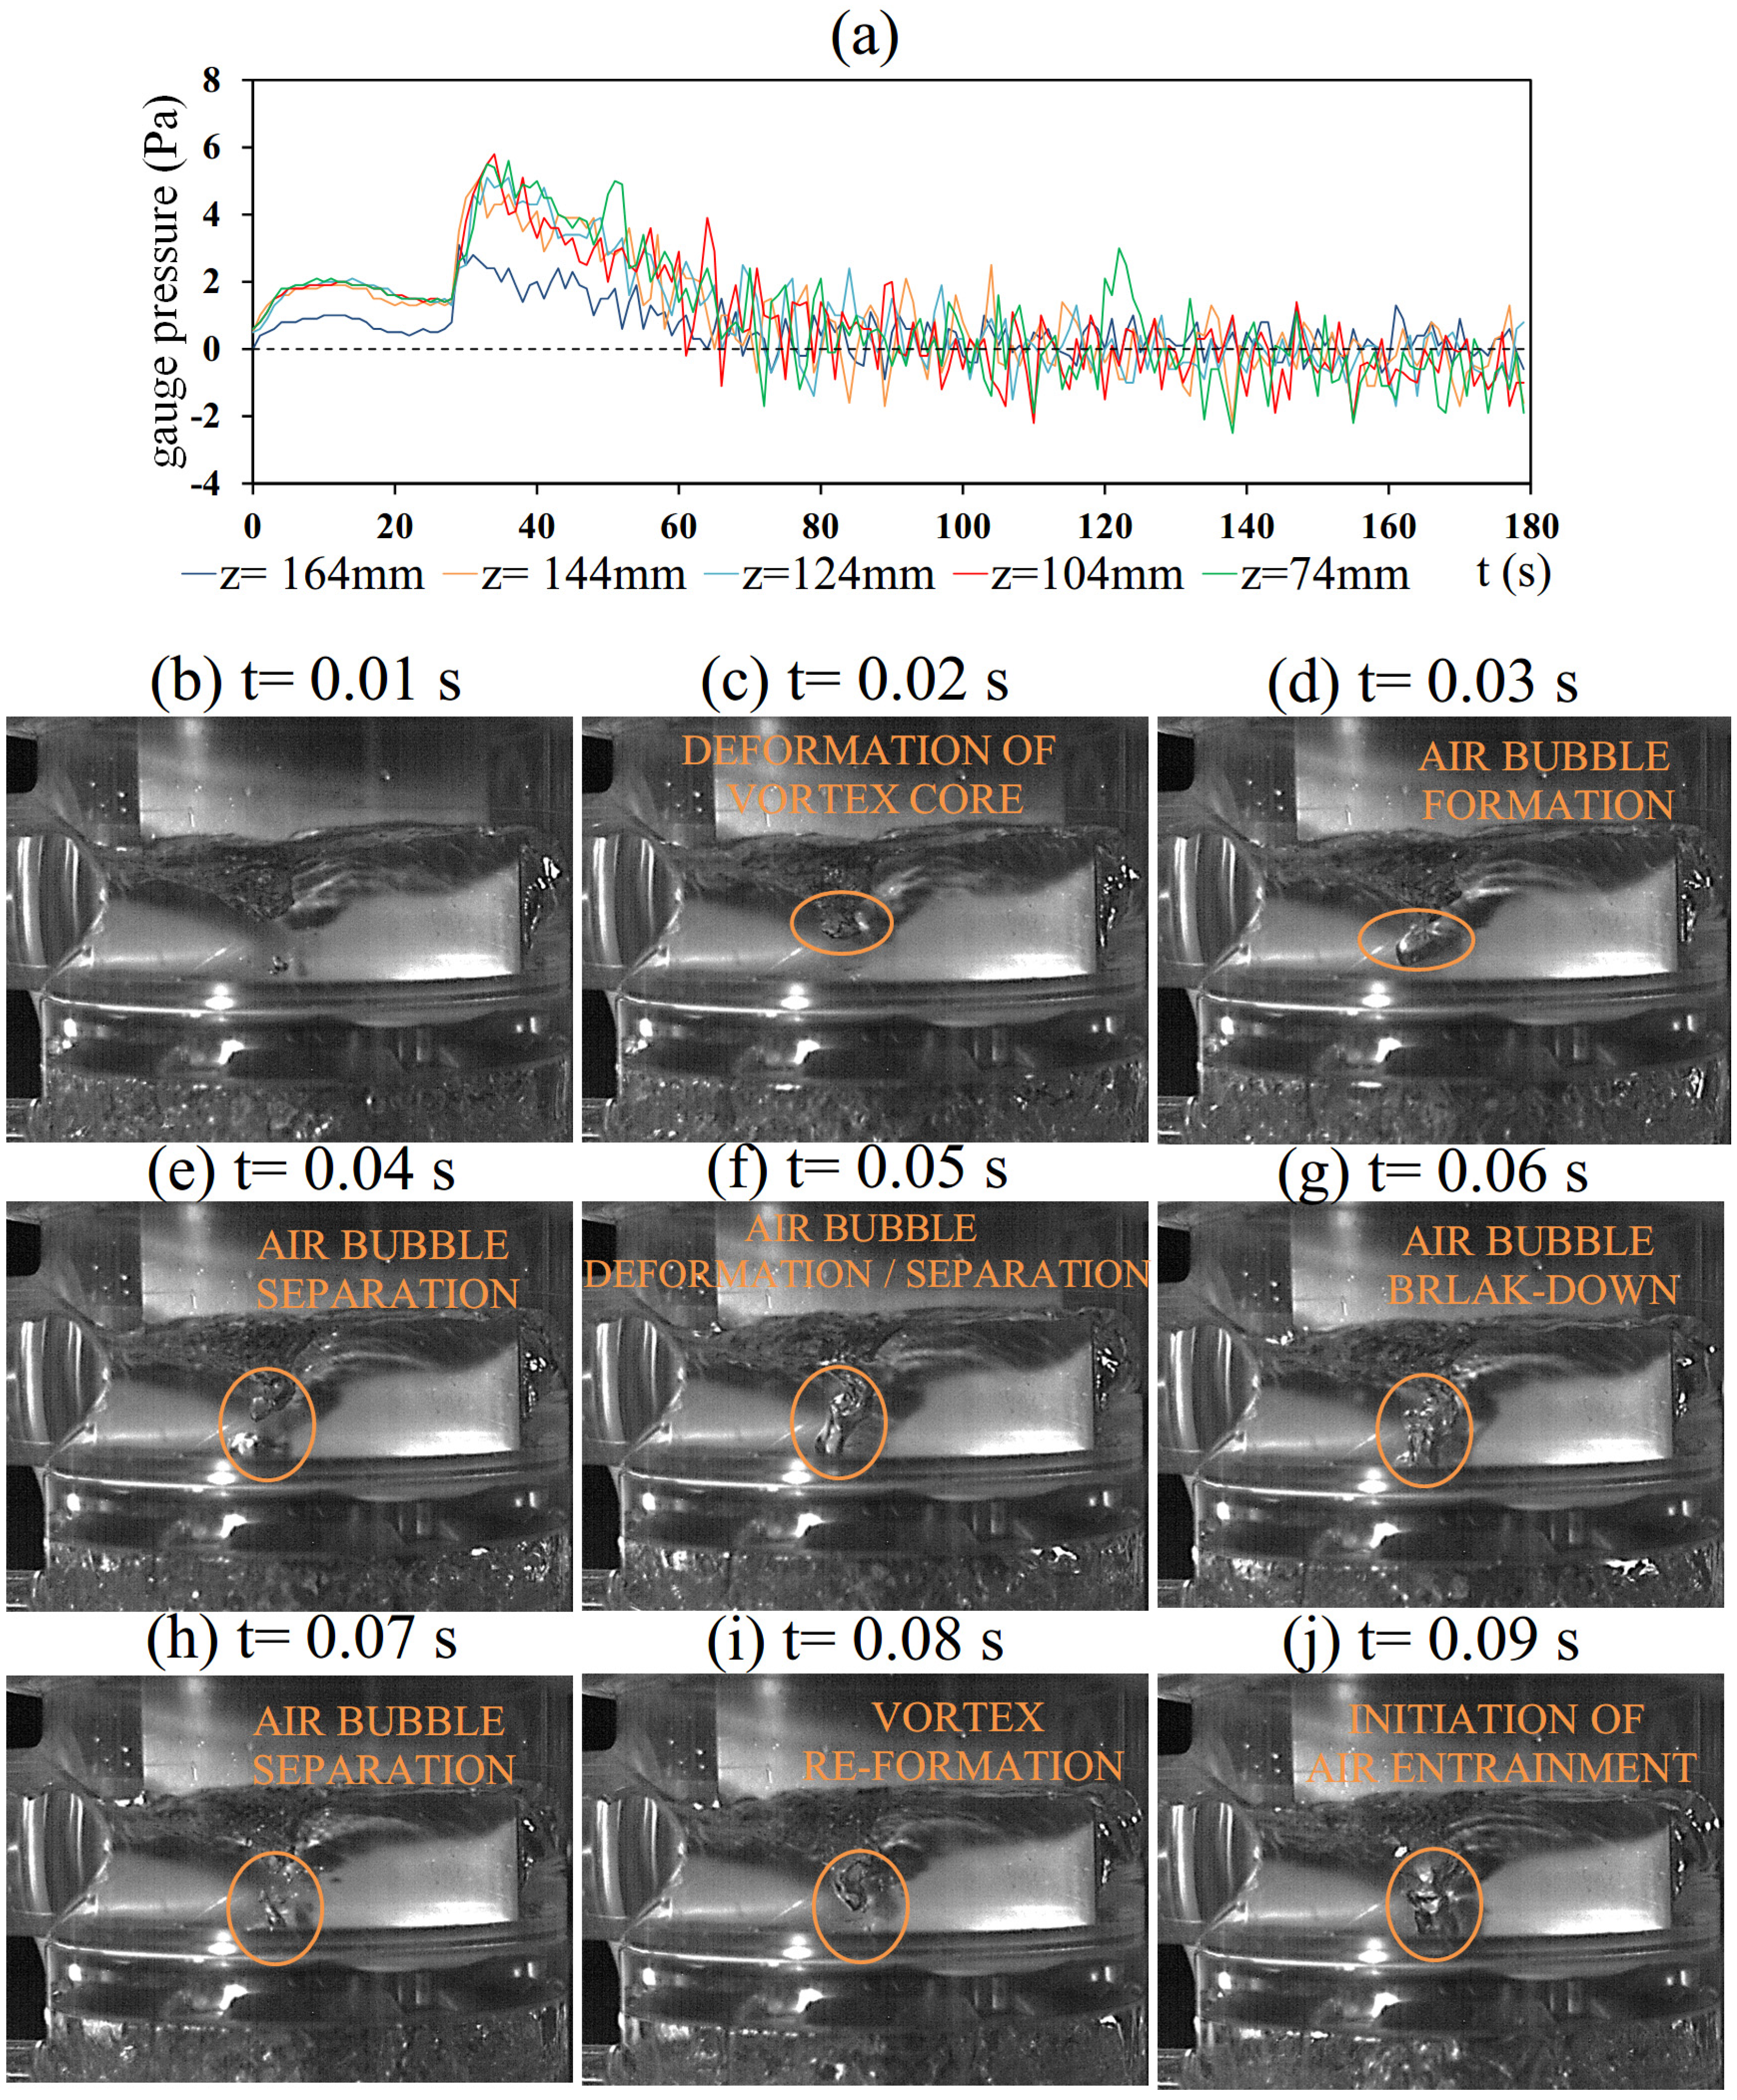
Figure 6 in which a series of continuous flow snapshots are selected to illustrate the process of air entrainment by the entry vortex.
To experimentally verify and visualize the mechanisms for the air entrainment by the entry vortex, the temporal variations of the airflow pressures, starting from charging the mixed water into the test gully, are individually detected at the various
Z locations along the vertical central core (
X =
Y = 0) as depicted in
Figure 6a. At
Z = 74 mm, the probe of pressure sensor is about 1 mm above the liquid surface of the entry vortex-core. All the temporal variations of the airflow static pressures collected in
Figure 6a from the different
Z locations follow a similar varying trend. Within an initial period about 30 s after feeding mixed water into the test gully at the single entry condition of
Q = 30 L/min, the entry vortex remains as developing; whereas the liquid level in the gully is up-rising to compress the trapped air within the gully drum, leading to the positive pressure heads along the central core as shown by
Figure 6a. At the instant that the discharge of mixed water flow is partially choked, the upstream pressure waves generate an abrupt pressure increase at all the measured
Z locations as shown by
Figure 6a. Followed by the sudden airflow pressure rises shown by
Figure 6a, the growing strength of the entry vortex keeps accelerating and dragging the airflow adjacent to the free surface of the entry vortex, leading to the subsequent reducing trend of pressure reductions at all the
Z locations seen in
Figure 6j. The negative airflow pressures at the locations close to the free surface of entry vortex are then emerged and stayed to trigger the process of air entrainment as demonstrated by the following
Figure 6b–j. Due to the complex and interactive air-water interfacial mechanisms among the vortex core region, the static airflow pressures start oscillating about the atmospheric level to promote the unsteady air entrainments by the entry vortex as
t > 70 s for this particular test condition.
Figure 5.
Distributions of instant velocity and pressure contour for gullies with/without SGV over horizontal XY planes at Z = 22, 34, 46 mm.
Figure 5.
Distributions of instant velocity and pressure contour for gullies with/without SGV over horizontal XY planes at Z = 22, 34, 46 mm.
The process of vortex deformation is initially observed at instants seen in
Figure 6b–c by sharpening the vortex core in downward direction seen in
Figure 6c. As a result of the driven pressure gradients on the free surface of the entry vortex, a lumped air bubble is formulated at the vortex core; but still coherently attached on the free surface of the entry vortex as shown by
Figure 6d. After a short time lapse, the separation of air bubble into the liquid pool is observed as seen in
Figure 6e; which can be occasionally followed by another sequence of vortex-core deformation and air-bubble separation seen in
Figure 6f. The large-scale separated air bubble that submerges into the swirling liquid pool is generally broken into small air bubbles which scatter underneath the vortex core as indicated by
Figure 6g–h. The interfacial air-bubble evolutions disclosed by sequentially viewing the flow snapshots detected at the instants shown by
Figure 6b–h are followed by the subsequent vortex-core deformation as typified in
Figure 6i to complete an air-entrainment process induced by the entry vortex. The successive process for another air entrainment is initiated with the flow image shown by
Figure 6j. It is noticed, with present test gullies, the entire air entrainment process by entry vortex, as typified by
Figure 6b–j, is completed within 1 s.
In addition to the considerable flow resistances by the air bubbles in the flow passages formulated in the gullies without and with SGV as demonstrated by
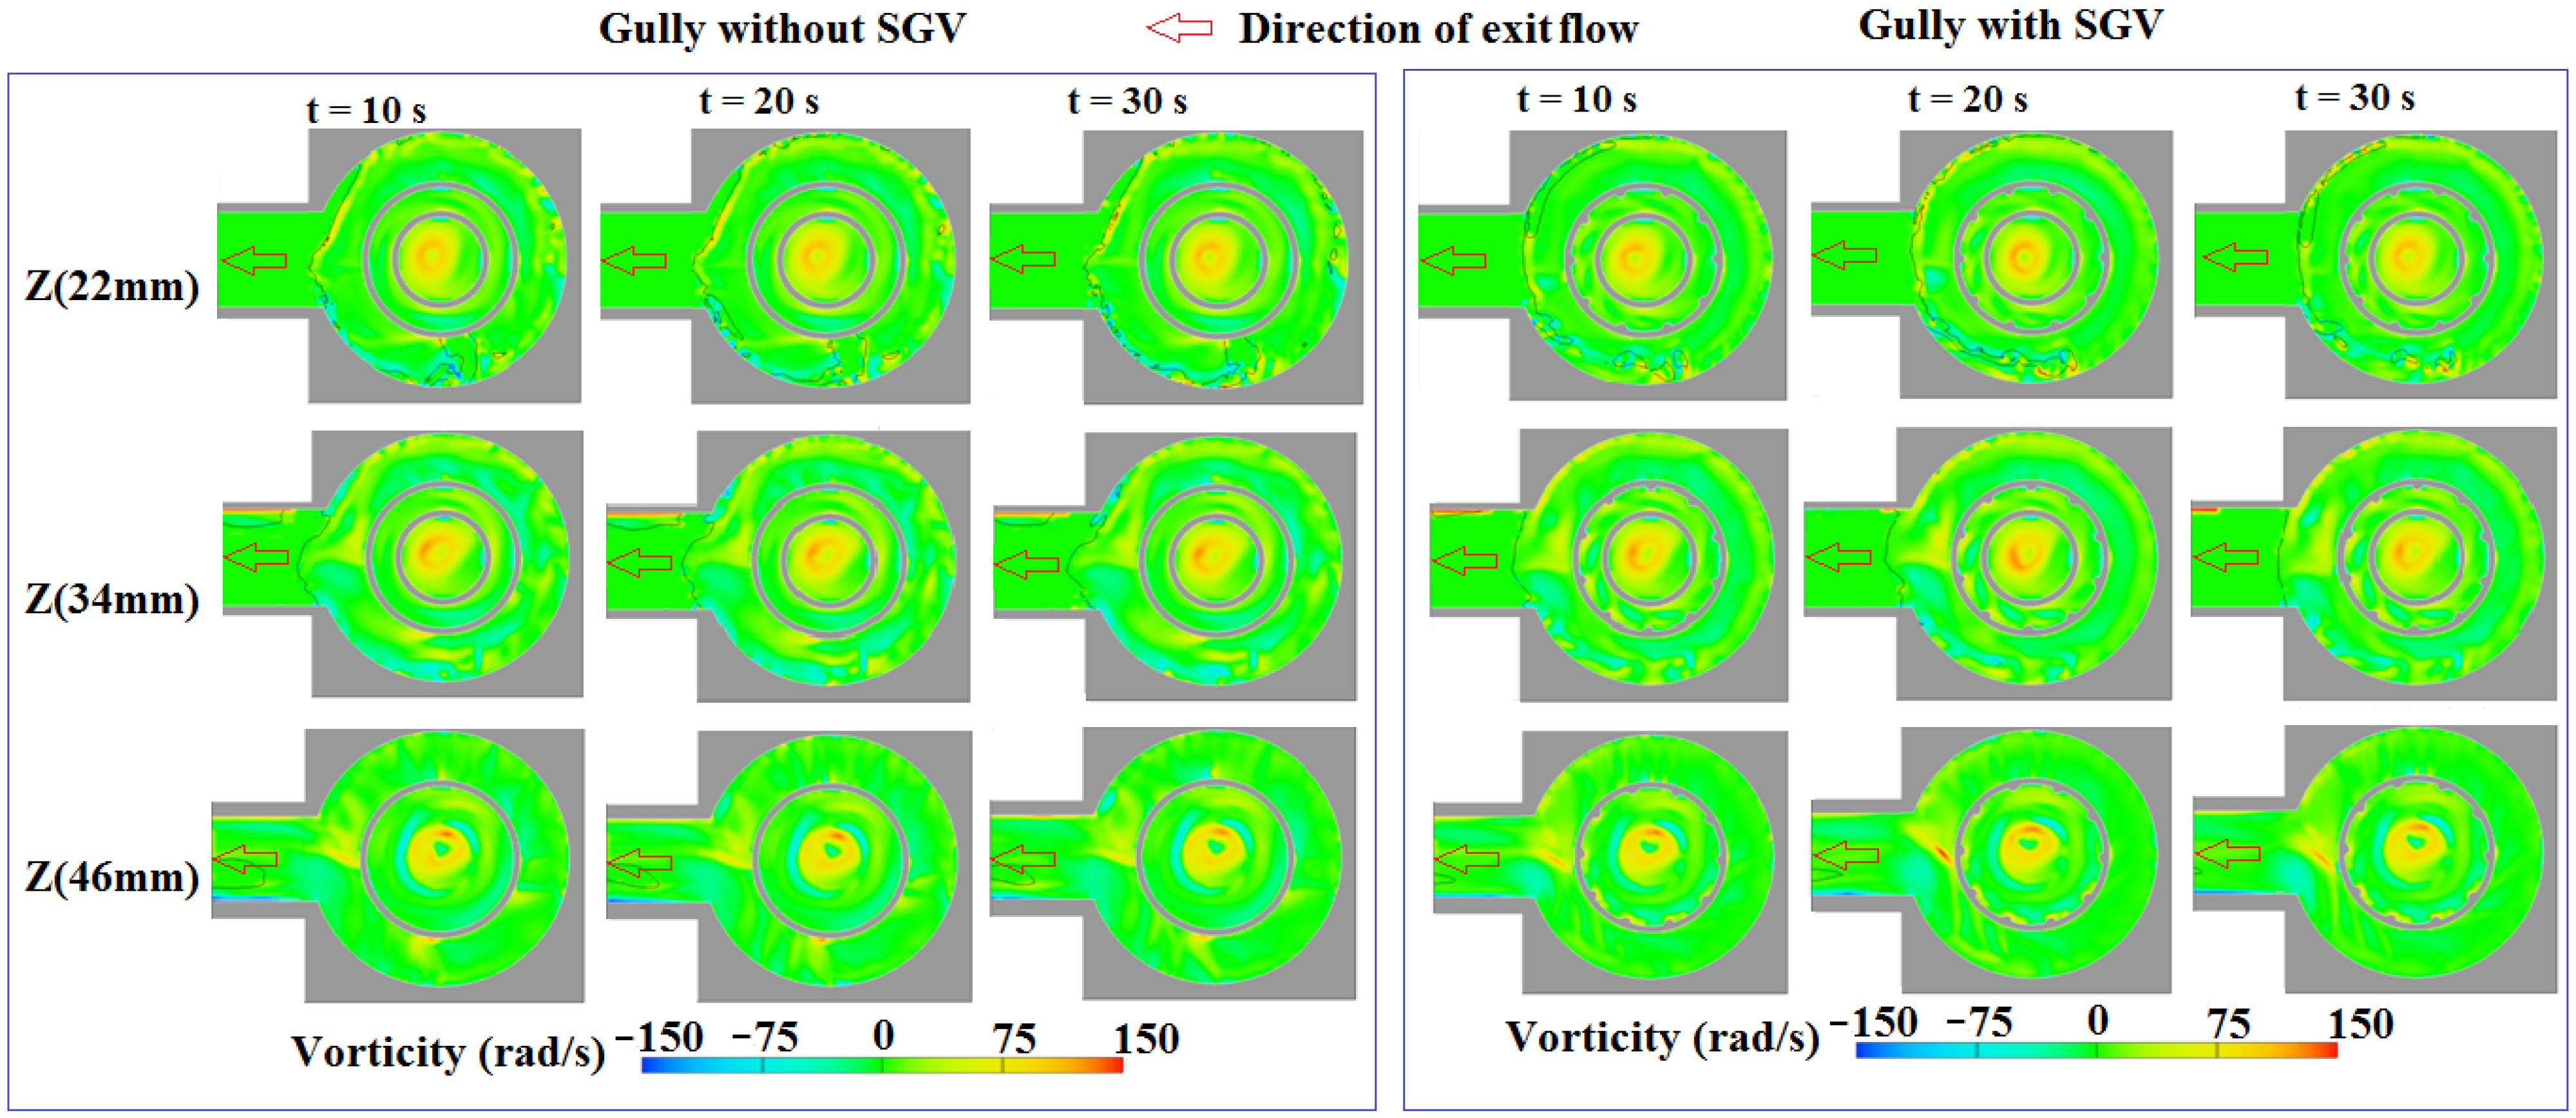
Figure 4, the entrained air into the water stream also affect the vorticity distributions in the gullies. To explore the impact of entrained air on vorticity distributions, the instant vorticity contours for the gullies with/without SGV over horizontal
XY planes at
Z = 22, 34, 46 mm at
t = 10, 20 and 30 s with
QA =
QB = 15 L/min, which corresponding to the Computational Fluid Dynamics (CFD) scenarios collected in
Figure 3, are compared by
Figure 7.
Figure 6.
Temporal airflow pressure variations and corresponding flow snapshots demonstrating the process of air entrainment by entry vortex.
Figure 6.
Temporal airflow pressure variations and corresponding flow snapshots demonstrating the process of air entrainment by entry vortex.
It is interesting to note the ring of high vorticity circling around the center of entry vortex. Due to the air-entrainment taking place at the center of the entry vortex, the development of local angular momentum by the shearing action resulting from the particular fluid velocity field is interfered. As a result, the local vorticity at the center region of the entry vortex is weakened to be less than those emerging along the surrounding rim shown by
Figure 7. Over the annular sections between the gully casing and the secondary drum, several spots show the negative vorticites, in particular along the air-water interfacial boundaries marking as the black solid lines in
Figure 7. The counteracting circulations for the air bubbles in the water stream are suggested by present numerical results. Above all, with applications to drainage systems, present type of gullies can be classified as the appliance capable of entraining air into the drainage system. Flow instabilities are mainly attributed to the air bubble interactions in the agitating bubbly flow region specified by
Figure 4.
Figure 7.
Distributions of instant vorticity for gullies with/without SGV over horizontal XY planes at Z = 22, 34, 46 mm.
Figure 7.
Distributions of instant vorticity for gullies with/without SGV over horizontal XY planes at Z = 22, 34, 46 mm.
