1. Introduction
Nowadays, managed aquifer recharge (MAR) is considered as an integral part of integrated water resources management (IWRM). Like the IWRM concept, the interaction of MAR with other sectors of the water resources system, society, and natural processes is inherently strong [
1]. Several researchers e.g., [
2,
3] mentioned that like other IWRM projects, the most promising MAR strategy should study the environmental impact, socio-economic efficiency, and their contribution to the existing or future water resources problem in the region [
3]. Proper investigation and planning of MAR projects is important for successful application and can lead to significant risk reduction (e.g., environmental, health) and overall project cost reduction by potentially reducing uncertainties during project implementation. Again, proper planning requires impartiality and transparency in the evaluation of MAR options, considering explicit assessment of feasibility and cost-effectiveness [
4]. Up until now, very few research studies have performed an extensive integrated study that consider the potential impacts on the environment, health, economy and society due to MAR project implementation and which select the best project option after intensive impact assessment [
5].
The Gaza Strip, located on the eastern coast of the Mediterranean Sea, is a region facing severe water resources problems [
6]. Due to the hot and dry climate, little surface water is available. Water supply relies mostly on groundwater resources located in the Northern Coastal Aquifer of Gaza [
7]. The Beit Lahia Wastewater Treatment Plant (BLWWTP), located at Northern Gaza Strip, has been dysfunctional for some time now and is creating severe environmental, socio-economic and agricultural impacts for the public health and the environment [
8,
9]. A detailed description of the water resources problem at the North Gaza strip is given in
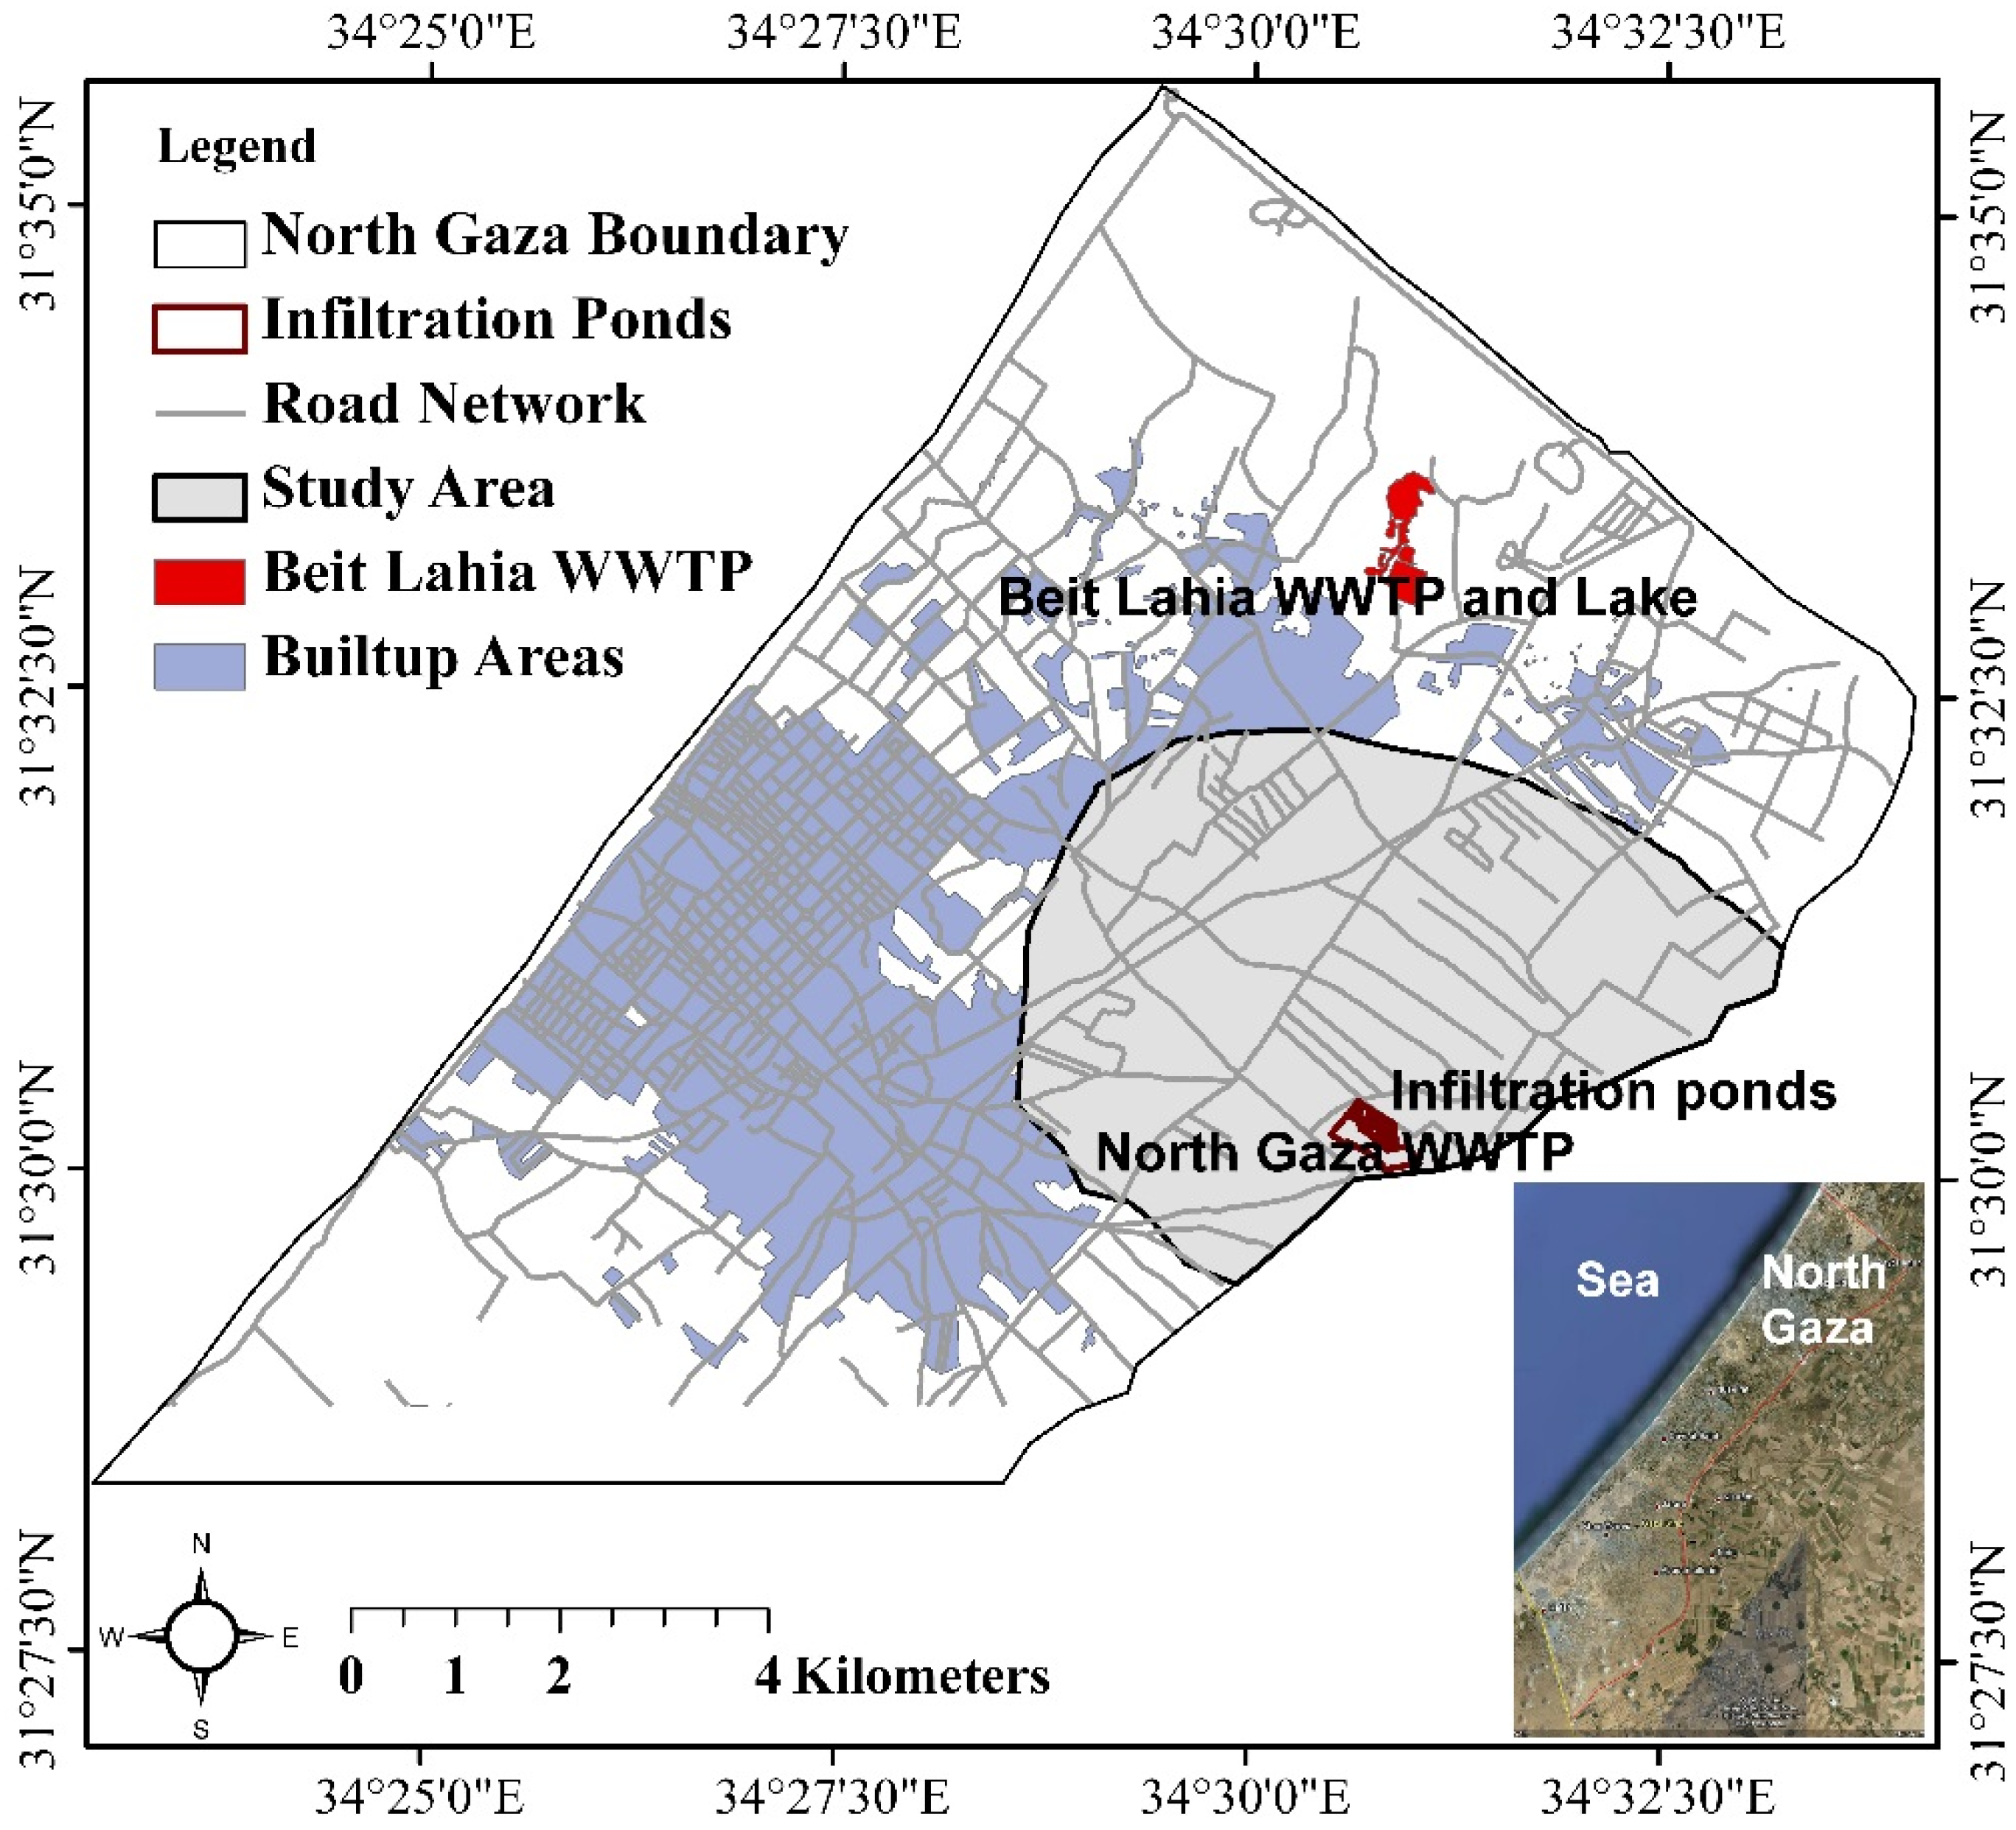
Section 4.1. A three-phase 20-year project involving the construction of a new WWTP, called the North Gaza Wastewater Treatment Plant (NGWWTP), is planned to be located further to the south near the Israeli border (see
Figure 1) [
10]. The new wastewater treatment plant will involve MAR of effluents [
11]. The Palestinian Water Authority (PWA), along with international support, decided to use practical, already established MAR technologies such as infiltration ponds with Soil-Aquifer Treatment (SAT) to replenish the coastal aquifer in order to meet the continually rising demand of water for domestic, industrial, and agricultural use in this water-parched region [
12,
13,
14]. Decision support is required to identify the best MAR project option to implement in the study area.
Figure 1.
Study area map showing the wastewater treatment plants. Data source [
9]. Inset picture from Google Earth.
Figure 1.
Study area map showing the wastewater treatment plants. Data source [
9]. Inset picture from Google Earth.
In order to support the decision makers to plan the MAR project, this paper focuses on the impact assessment for several strategies for the implementation and operation of MAR in the Northern Gaza Strip. The strategies were quantitatively analyzed based on their potential impacts on agriculture, environment, health, society, and the economy. Finally, all strategies were compared to each other and ranked according to their ability to promote water resources development at the Northern Gaza Strip. In addition, this paper also describes the optimal MAR strategy of the candidates considered to sustain water resources and groundwater-dependent environment of Northern Gaza.
2. Study Area
With an area of 365 km
2 and a population of roughly 1.6 million [
9], the Gaza Strip is located on the southwestern part of historical Palestine at the Mediterranean Coast on the edge of the Sinai Peninsula. Precipitation varies between 200 and 400 mm/year, with an average of ca. 300 mm/year [
6,
15], and temperatures are generally high, ranging between 29 and 9 °C throughout most of the year [
16], while 97% of water used in Northern Gaza comes from the Northern Coastal Aquifer [
7]. In this study, a part of North Gaza was selected for analysis and comparison of MAR strategies (
Figure 1), which is referred to in this paper as the “study area”. The study area was delineated based on the boundary selection process using a groundwater flow and transport model. This model simulates the spreading of infiltration water at the new infiltration ponds, which commenced at the beginning of 2008 and will continue until 2040.
Geology and Hydrogeology of the Study Area
According to [
17], the Gaza strip is underlain by a series of geological formations from the Mesozoic to the Quaternary. The two main formations are called Tertiary formation and Quaternary formation. The Tertiary formation, a 1200 m thick layer, is composed mainly of Saqiya formation and it consists of clay, marl and shale [
14,
18,
19]. The 160 m thick Quaternary deposits covers the Pliocene Saqiya formation. The overlying Pleistocene deposits “Lower Quaternary” consists of (1) Marine Kurkur Formation (10–100 m thick on the coast); (2) Continental Kurkur Formation (maximum thickness is about 100 m with often-calcareous cement, and Quaternary Deposits. The sand loess and gravel beds formation is considered the main formation of the Gaza strip [
17]. A general geological cross section of the coastal plain can be found in a number of sources [
17,
20,
21,
22] and therefore is not included in this paper.
The North Gaza aquifer is a part of the Coastal aquifer that extends north to south from Haifa to the Sinai Coast. The highly permeable shallow vadose zone is mostly sand and gravel [
23]. Larger and more consistent clay layers at the coast and extending 2–5 km inland, divide the Coastal Aquifer into several confined permeable layers [
23]. The hydraulic connection between groundwater in the different subaquifers and the sea is not well investigated [
17]. Beyond this distance, to the east, the Kurkar Group comprises the unconfined aquifer [
18,
23]. The average thickness of the aquifer at the coast is 150–200 m [
23], whereas at the eastern border with Israel, the average thickness varies between 40 and 50 m [
18]. The low-permeability Saqiya Formation of tertiary age constitutes the base of the aquifer. The 1 km thick Saqiya Formation is composed of clay, shale and marl [
18]. The transmissivity of the Gaza aquifer ranges between 700 and 5000 m
2/d, corresponding hydraulic conductivity ranges between 20 and 80 m/d. Specific yield and Specific storativity values are 0.1–0.3 and 1 × 10
−4 per meter [
19,
24].
Rainfall is the main recharge component for the shallow aquifer unit in the study area. Aish
et al., (2009) [
20] estimated that the average annual recharge of the Gaza strip is 108 mm/year (39–40 Mm
3/year). Around 1016 agricultural wells pump ca. 50 Mm
3/year and 45 urban supply wells abstract approximately 42 Mm
3/year. Irrigation return flow is considered as 30 Mm
3/year [
18]. In the Gaza strip, the groundwater abstraction from the drinking water wells constitute more than 50% of the net withdrawal [
25]. In the northern part of Gaza, groundwater levels range from about 2 m above MSL at the eastern border with Israel to mean sea level along the shore [
18]. A steep groundwater level gradient is seen at the southern part of the Gaza strip. The coastal aquifer possesses 5000 Mm
3 storage of groundwater of variable quality of which 30% is fresh [
26,
27]. In North Gaza, the GWL in the centre of the area is lower than the other parts of the area. So, in this part of the coastal aquifer, the main groundwater flow direction is towards the centre of North Gaza [
28]. Besides the water quantity shortage, groundwater quality related problems, especially chloride and nitrate contamination, have been mentioned by several researchers e.g., [
18,
19,
29]. The existing monitoring network in the Gaza strip observes groundwater level, and measures nitrate and chloride concentrations. The network is not suitable for monitoring sea water intrusion [
18].
3. Methodology
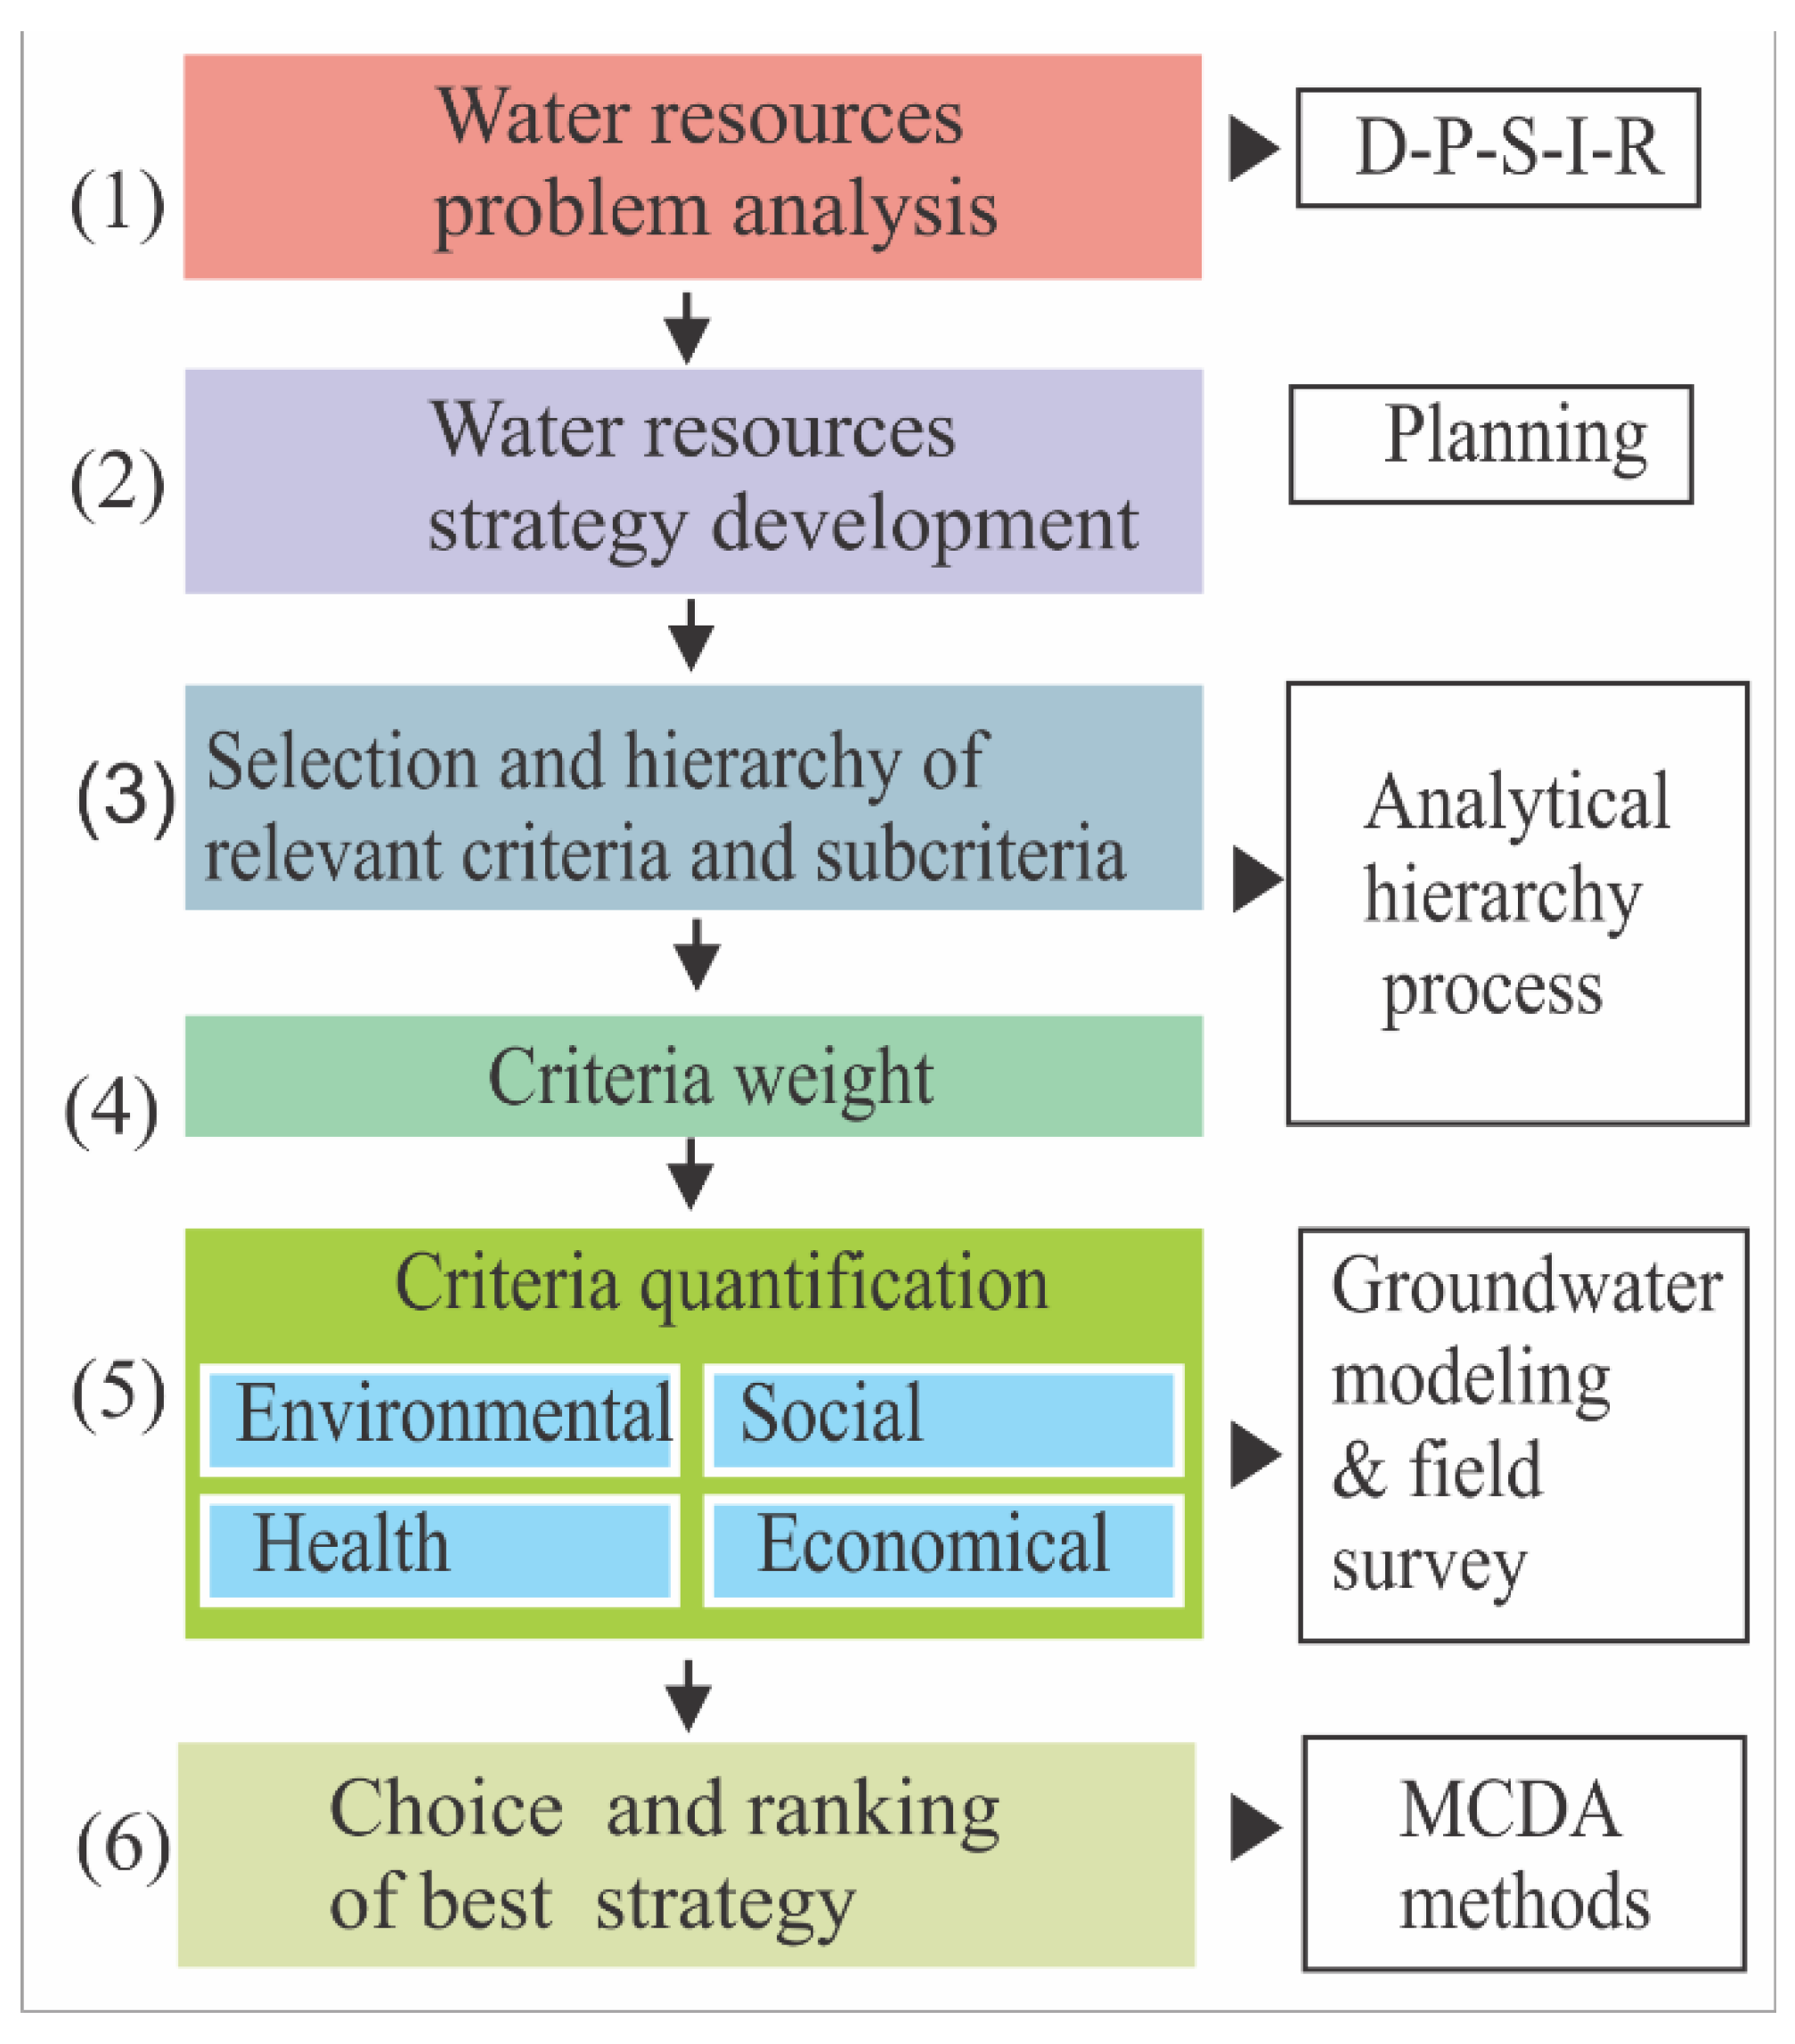
An integrated approach was formulated in order to select the best strategy for MAR implementation. The approach is integrated in the sense that the study considered the impacts of possible MAR strategies on several sectors such as environment, health, economy and society. The sequential steps to select the best rank MAR strategy, a structured and sequential work flow was prepared, as shown in
Figure 2. In general, the entire process involves three main steps to identify the best ranked MAR strategy: (a) water resources system analysis and strategy development (b) strategy ranking: criteria selection, impact assessment and criteria quantification, and (c) Multicriteria decision analysis (MCDA).
Figure 2.
Overall methodology of the study.
Figure 2.
Overall methodology of the study.
The main objective of water resources system analysis (step-1) is to identify the main water resources drivers and pressures, and the potential responses to solve the impacts. Causal chain analysis using the Driver (D), Pressure (P), State (S), Impact (I) and Response (R), in short DPSIR, methodology [
30,
31] can be used at this step. Based on the pertaining water resources problem and the potential responses, water resources strategies are developed (step-2). The strategies should comply with the national water policy. In the third step of strategy ranking, relevant environmental, health, social and economic characteristics are selected. Each characteristic is defined as a criterion. The next step involves the decomposition of the ultimate goal into a hierarchy of several levels, following the principle of Analytical Hierarchy Process (AHP). The bottom level is the most specific criteria and the middle levels are more general criteria and can be called the “main criteria”. The criteria in the lowest level are related to the main criteria in the middle levels. All levels combined is the goal of the study—the best strategy for MAR implementation, and is positioned at the top of the hierarchy. The next step in the strategy ranking procedure is assigning values of relative importance for each criterion at all levels, which is done by assigning a weight to each criterion. The criteria under each main criterion are compared amongst themselves and a weight is assigned to each one (step-4). The main criteria are also weighted in this way. The next step (step-5) is to quantify the relevant criteria, which is the main focus of the present study. A number of techniques, such as groundwater modelling, GIS and field surveys are available to quantify scores for the criteria. The quantification procedure depends on the type of criterion. After quantifying all criteria, an evaluation matrix is prepared at this step which is one of the principle components for ranking of alternatives. The final step (step-6), strategy comparison and ranking analysis, encompasses two multi-criteria analysis techniques: Weighted Linear Combination (WLC) and PROMETHEE II (Preference Ranking Organisation MeTHod for Enrichment Evaluations) method.
The role of AHP, mentioned earlier, was to construct the hierarchy and to estimate the relative weight by pairwise comparison, after getting the preference information from the researchers, decision makers and stakeholders. Additionally, the role of WLC and PROMETHEE is to rank the alternatives.
4. Water Resources Problem Analysis and Strategy Development
4.1. Water Resources Problem Analysis (Step-1)
With the aim to analyse the existing water resources problems of the study area, causal chain analysis using the DPSIR method was used. The DPSIR concept has been developed for describing interactions between society and the environment [
31,
32], starting from the assumption that there is an interaction between the two. The water resources problems of North Gaza were analyzed, decomposed, and structured in this method in order to find the potential response of the problem. In brief, the water resources system of North Gaza is affected by two main drivers: population and urbanization. These drivers cause certain pressures on groundwater exploitation, wastewater status, land-use change, salinization,
etc. The causal chain analysis of surface water is negligible as there are no surface water resources in the area. The DPSIR analysis has identified four potential responses to the current water resources problem. Each response can be considered and studied independently as well as in combination. In this paper, we considered MAR as a potential response due to the following reasons: (1) the poverty level in Gaza is high and many cannot afford the costs of advanced water treatment or desalination (considered as innovative technology) [
33]; (2) Treated wastewater reuse will complement the existing water resources and will improve the water supply for agriculture; (3) Use of reclaimed water for agriculture would make fresh groundwater available for domestic and industrial use. In this study, MAR is seen not only as a contribution for a solution to the water supply and groundwater quality issue, but also as a solution to the problematic effluent lake, located at Beit Lahia, as the use of the new infiltration pond would help to rehabilitate the old infiltration lake.
4.2. Water Resources Strategy Development (Step-2)
Based on the water resources problem analysis and considering the water resources management plans for the years 2005–2025 [
2,
5,
9,
10], the following four MAR strategies were established in this study (
Table 1).
The water management strategies based on MAR presented in
Table 1 consider three phases in terms of wastewater resources development at the case study area. Strategy No.1 (Sc-1) represents the strategies if nothing has been changed with respect to the existing water resources structure and no further planning is being considered. Strategy No.2 (Sc-2) is linked to the first phase. This phase considers the diversion of the water from the BLWWTP to the newly constructed infiltration basin, which is located close to the foreseen position of the new North Gaza Wastewater Treatment Plant (NGWWTP) at the Israeli border. The diversion of water will be accomplished via a pressurized pipeline and the effluents will then infiltrate into the aquifer. Strategy No.3 (Sc-3) considers the strategies if the diverted water will be treated in the NGWWTP and then infiltrated into the aquifer. The effluent quality is higher than that of the water used for infiltration in Sc-2. In Phase 3, the NGWWTP is designed to increase the treatment capacity of around 24 Mm
3 per year in 2025. It indicates in Sc-3, the effluent water quality is better than that in Sc-2. Strategy No.4 (Sc-4) considers infiltration of this extra volume of treated water to the aquifer. Sc-2, Sc-3, and Sc-4 are considered as MAR management strategies.
Table 1.
MAR management strategies towards the development of water resources at the Northern Gaza Strip.
Table 1.
MAR management strategies towards the development of water resources at the Northern Gaza Strip.
| Strategy No. | Plan for Water Resources Development | Scenario | MAR Volume (Mm3) in Year 2040 | Chloride/Nitrate Concentration in Recharge Water (mg/L) |
|---|
| Sc-1 | Do Nothing | No MAR | 0 | 557–887/20–107 * |
| Sc-2 | Phase 1: Infiltration ponds and pipeline construction | Use the water from the BLWTTP | 13 | 250/19–43 |
| Sc-3 | Phase 2: Construction of the NGWWTP | Infiltration of better quality water from the new treatment plant | 13 | 250/7.5–17 |
| Sc-4 | Phase 3: Extension of the NGWWTP | Infiltration of better quality water and increase in infiltration volume from the new treatment plant. | 23.7 | 250/7.5–17 |
5. Criteria Selection and Quantification Procedure
5.1. Criteria Selection (Step-3)
A wide range of indicators are considered for the selection of criteria. The criteria were derived from the identified sectors of impact and emphasis was given to the availability of information to quantify the criteria. A total of 19 most representative decision criteria were selected in close cooperation with Palestinian researchers and authorities as well as further relevant stakeholders and were discussed with other international experts in related fields. Among the 19 criteria, six criteria represent environment considerations. They consider groundwater level, chloride and nitrate concentration averaged year 2005–2040 and also in year 2040 alone. Four health criteria consider chloride and nitrate concentration at the domestic wells average 2005–2040 and also in year 2040 alone. Seven social criteria consider people’s acceptance, convenience, satisfaction with the water quality and quantity, employment and willingness to pay. Affordability to pay and net cost-benefit analysis were considered as economic criteria.
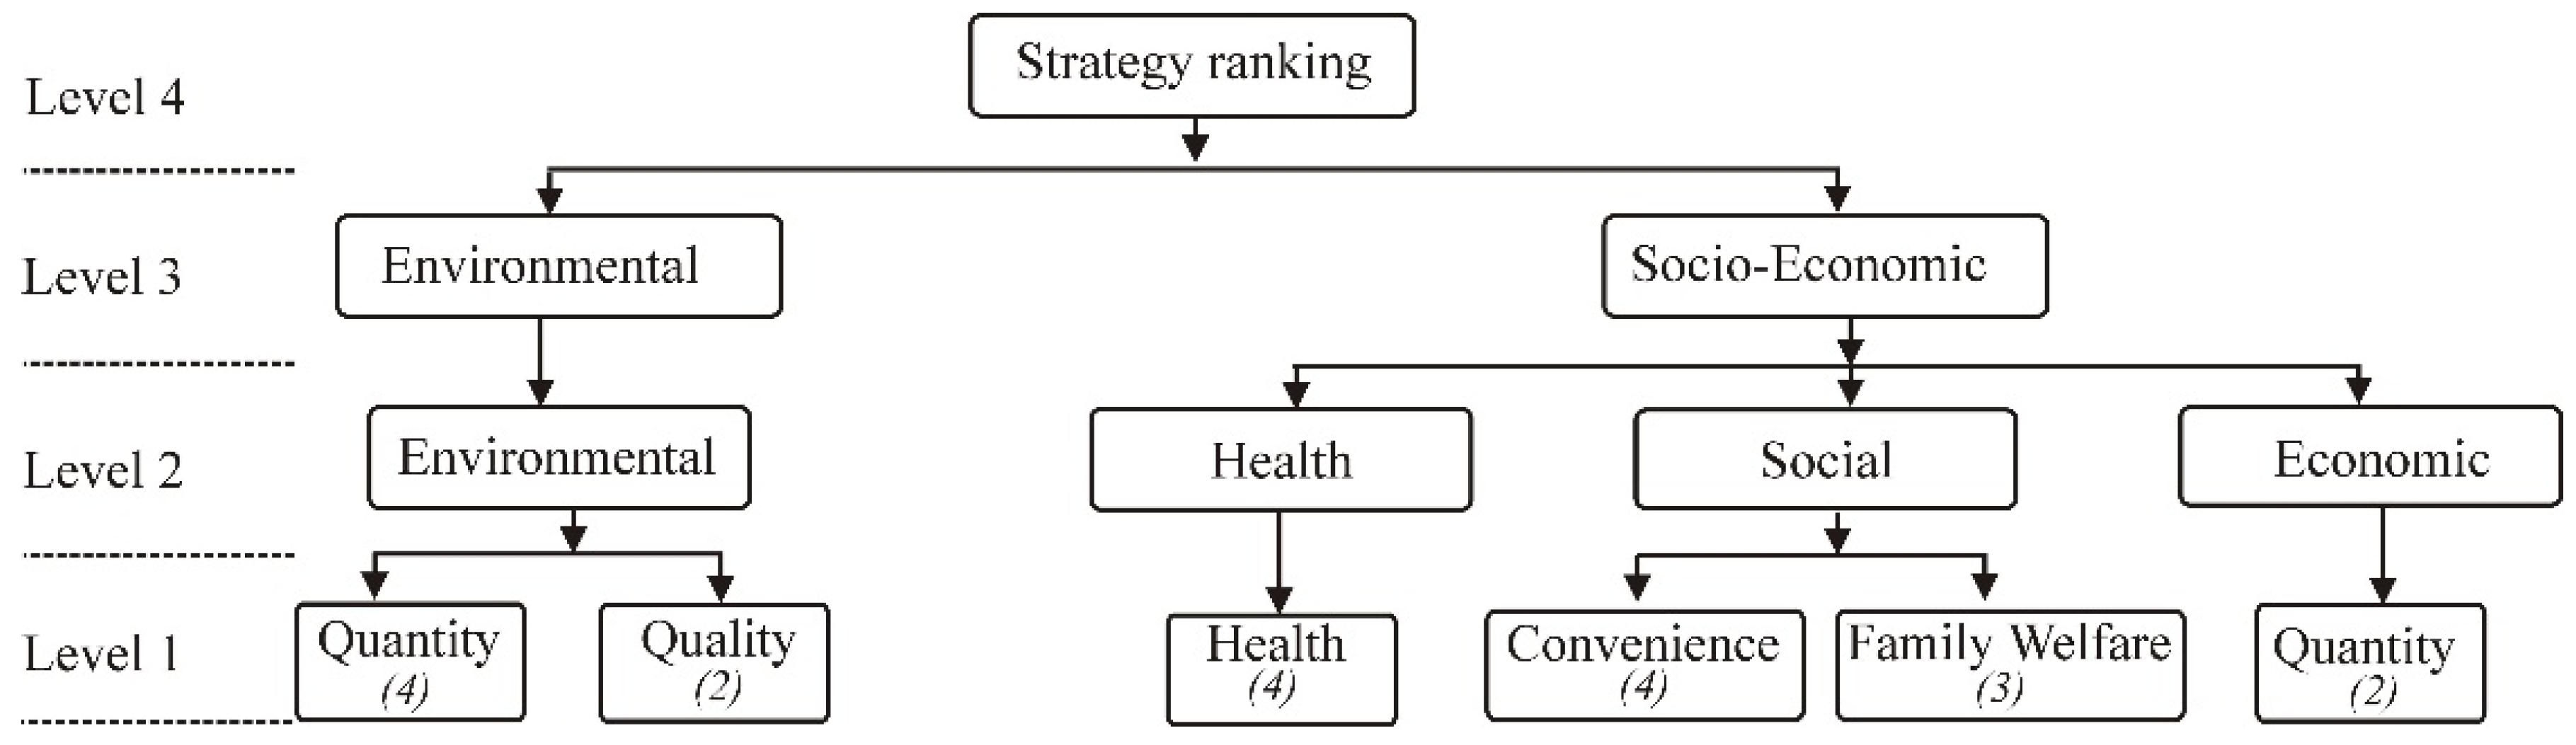
Figure 3 shows the four-level hierarchical structure of the categories and criteria. AHP was used at this step. The AHP, proposed by [
34], is a multicriteria analysis technique that enables the explicit ranking of tangible and intangible factors against each other for the purpose of decision-making or conflict resolution. It combines qualitative and quantitative approaches [
35].
Figure 3.
Criteria selection and hierarchy. Italic numbers indicate the number of criteria associated to each item at the fourth level.
Figure 3.
Criteria selection and hierarchy. Italic numbers indicate the number of criteria associated to each item at the fourth level.
Nineteen criteria were grouped into four main criteria groups such as environmental, health, social and economic. At the third level of the hierarchy, social, health, and economic criteria were grouped as “socio-economic” criteria. Socio-economic criteria and environmental criteria group combines the ranking of the strategies.
5.2. Criteria Weighting (Step-4)
The relevant importance of each criterion was defined in close cooperation with local scientists, decision makers and stakeholders. A participatory process was undertaken among the local stakeholders and experts. The participatory process includes scientific meetings, questionnaire surveys and workshops. Judgments of international experts were considered along with the weights from local experts and stakeholders. The pairwise comparison method, originally proposed by [
34], was used to transfer the linguistic importance to numeric value and relative weights were estimated. The net cost and groundwater quantity were considered to be the most important criteria. All categories at level 2 and level 3 were considered as being equally important for MAR planning and management.
5.3. Criteria Quantification (Step-5)
The selected criteria were quantified using several state-of-art analysis techniques such as groundwater flow and transport models, field surveys, economic models, etc.
5.3.1. Quantification of Environmental Criteria (Criteria 1 to 6)
The selected environmental criteria refer to the groundwater quality and quantity status. These criteria were quantified by using groundwater-modelling techniques. A groundwater flow and transport model, developed in this case study using VISUAL MODFLOW (version 4.3, SWS, Vancouver, BC, Canada, 2009) and its integrated modules, was used to quantify the six environmental criteria in this study. The detailed description of the flow model set up and model parameters together with calibration plot can be found in [
28]. The transport parameters such as longitudinal and vertical transverse dispersivity were initially assigned values of 4 m and 1 m, respectively (according to [
36]). Bulk density of water was considered as 1000 kg/m
3. For Sc-2 and Sc-3, the infiltration starts in 2008 with 9.7 Mm
3 of treated water and with an increase of infiltration by 0.08 Mm
3 per year until 2012 and afterwards the infiltration volume remains 13 Mm
3 until 2040. For Sc-4, the infiltration starts in 2008 with 9.7 Mm
3 of treated water and with an increase of infiltration by 0.08 Mm
3 per year until 2040. During the analysis and quantification of all the strategies, the current water withdrawal for agriculture was assumed to be constant. Domestic water demand was assumed to increase (based on population growth), according to the estimated demand increase. The model was run until year 2040. Simulation results flow and transport modelling from years 2005–2040 were used to estimate Criteria 01, Criteria 03 and Criteria 05. Simulation results from flow and transport modelling at the end of year 2040 were used to quantify Criteria 02, Criteria 04 and Criteria 06.
5.3.2. Quantification of Health Criteria (Criteria 7–10)
The four health-related criteria refer to the water quality status at the domestic water supply wells. Average chloride and nitrate concentration were considered at the places where the domestic wells are situated (Criteria 07 and Criteria 08). Criteria 09 and Criteria 10 were quantified by considering the average concentration of chloride and nitrate in the waters of the study area aquifer. The developed groundwater flow and transport model was also used to quantify the health criteria for the analysis. The water quality in the domestic wells depends on the quality of infiltrated water, quality of native groundwater and the seasons (winter and summer). These three aspects were considered in the model.
5.4. Model Simulation for the Health Criteria Quantification for the Strategies
5.4.1. Chloride
Chloride was modelled as a conservative parameter and hence, no sorption or kinetic reaction was considered. The initial concentration, ranges between 40 and 2200 mg/L, of chloride was taken from the trend analysis in [
37], considering the data from the years 1984–1998 [
37,
38]. The chloride concentration of the infiltrated water was considered to be the same as that in the wastewater lake at BLWWTP. The chloride concentration used in the model and during the entire modelling period was 559–857 mg/L for years 2004–2007 and 250 mg/L for years 2008–2040 in all strategies except Sc-1 [
9]. For Sc-1, the base condition was maintained. The base condition considers the chloride concentration used in the simulation model from year 2000 to year 2003. The effect of chloride concentration changes as the volume of infiltrated water changes in different scenarios.
5.4.2. Nitrate
For nitrate simulation, equilibrium controlled linear isotherm was considered and no kinetic reaction was considered. Similar to chloride, the initial concentration, ranges between 5 and 370 mg/L, of nitrate was taken from the trend analysis from [
37] and considered is the data from 1984 to 1998. The nitrate quality of the infiltrated water was calculated based on the quality of the infiltrated water, the infiltration process, and seasonal climatic conditions (after [
37,
38]) and where dilution and denitrification have been assumed to be the main processes for nitrate reduction in the model simulation. For Sc-1, a base condition was maintained throughout the entire simulation period. A base condition maintains the nitrate source, considering the same land use utilized in the simulation model 2000–2003. The nitrate concentration for Sc-2 used in the model and during the entire modelling period was 20–107 mg/L for years 2004–2007 and 19–43 mg/L for years 2008–2040. The nitrate concentration for Sc-3 and Sc-4 used in the model and during the entire modelling period was 20–107 mg/L, 19–43 mg/L and 7.5–17 mg/L for the period of 2004–2007, 2008–2011, and 2012–2040, respectively.
5.4.3. Quantification of Social Criteria (Criteria 11 and 17)
A questionnaire survey was performed by the Palestinian Hydrology Group to get the social aspect of the MAR strategies [
33]. The questionnaire was prepared in such a way that it includes criteria that would measure the anticipated level of convenience, perceptions on willingness to use the recharged water for different purposes and the fees that the user would be willing to pay for the supply and the expected level of satisfaction from the quantity and quality of water supplied from each option. A total of 76 questionnaires were filled out by the locals in the area [
33]. The number of questionnaire was decided based on statistical analysis and population residing at the study area.
5.4.4. Quantification of Economic Criteria (Criteria 18 and 19)
In the present study, two economic criteria were considered. Affordability to pay (criteria 18) was quantified using the surveyed data. Criterion 19 considers the net present cost and benefit of the four strategies implementation. For net present cost and benefit estimation, the following factors were considered (after [
37]):
- ▪
The infiltration starts in 2008 with 9.7 Mm3 of treated water and with an increase of infiltration by 0.08 Mm3 per year according to the strategies.
- ▪
The estimated operation & maintenance (O & M) cost (water transfer, pumping of water, cleaning of infiltration basin etc.) for MAR is $0.14/m3.
- ▪
The cost of abstracting recharged water by wells is $0.11/m3.
- ▪
The cost of the land (80,000 m2) for the infiltration basin is $100,000 and was considered at the beginning of 2005, as the ponds were planned to be constructed in this year.
- ▪
The cost of construction of the nine infiltration ponds and water-pumping infrastructure is $4,000,000 and was considered in the estimation at the beginning of 2005.
- ▪
The opportunity cost will be represented mainly by the land that will be used to construct the infiltration basins. Since the area is an agricultural area and the net return per 1000 m2 (1 dunam) from various agricultural products (mainly vegetables and citrus) per year is $562, then the opportunity cost of the land (80,000 m2) is $44,960. The lake or the lagoon is planned to close down by year 2018. The area occupied by it is 100,000 m2. Considering the area will be used for agricultural production, it would produce an annual benefit $56,200 per year starting from the year 2018.
- ▪
The gains from improving water quality is calculated as the cost of desalinating brackish water of 30% of the private well if the MAR is not implemented (Sc-1). The cost of desalinating brackish water is considered as $0.36/m3.
- ▪
The cost of abstracting ground water by wells is $0.11/m3 due to groundwater lowering in Sc-1 after 2007.
- ▪
As a safety measure, $0.01/100 m3 of recharged water was considered as unforeseen cost due to implementation of MAR.
- ▪
The net benefit from the stored water was estimated considering the people’s willingness to pay ($0.37/m3).
- ▪
The discount rate to calculate net present value was assumed to be 3% and assumed to be constant over all years of the project.
- ▪
No cost for wastewater treatment facilities was considered, as the local authority already considered this cost during the economic feasibility of the NGWWTP [
14].
The cost estimation was done using an economic model based on a spreadsheet.
5.5. MCDA Analysis and Ranking of Options
After quantification of all the criteria, the normalized matrix was prepared for multicriteria analysis. The normalization was done using the following formulae:
Here, NV denotes normalized value, Max and Min indicate the maximum and minimum value among the values to be normalized, respectively. We use Equation 1 to normalize all criteria values.
5.5.1. Criteria Aggregation Methods: Weighted Linear Combination (WLC)
WLC combines the criteria and provides the ranking. WLC is the most simple and commonly used aggregation method in decision analysis [
35].
where, w
j is a normalised weight; and Σ w
j = 1; and s
j(x
i) is the normalised criteria function.
After receiving the criteria weights and preparing the evaluation matrix, the role of WLC is to perform weighted summation for each group of criteria at all levels of the hierarchy until the strategy ranking achieves.
5.5.2. PROMETHEE
PROMETHEE, developed by [
39], is a nonparametric outranking method for a finite set of alternatives. The method was later extended by [
40,
41]. PROMTHEE I gives partial ranking and PROMETHEE II provides a complete ranking of the strategies by using the net flow [
42]. The details of the procedure can be found in many sources such as [
39,
43,
44,
45].
6. Results Analysis
6.1. Environmental Criteria
The simulations show (see
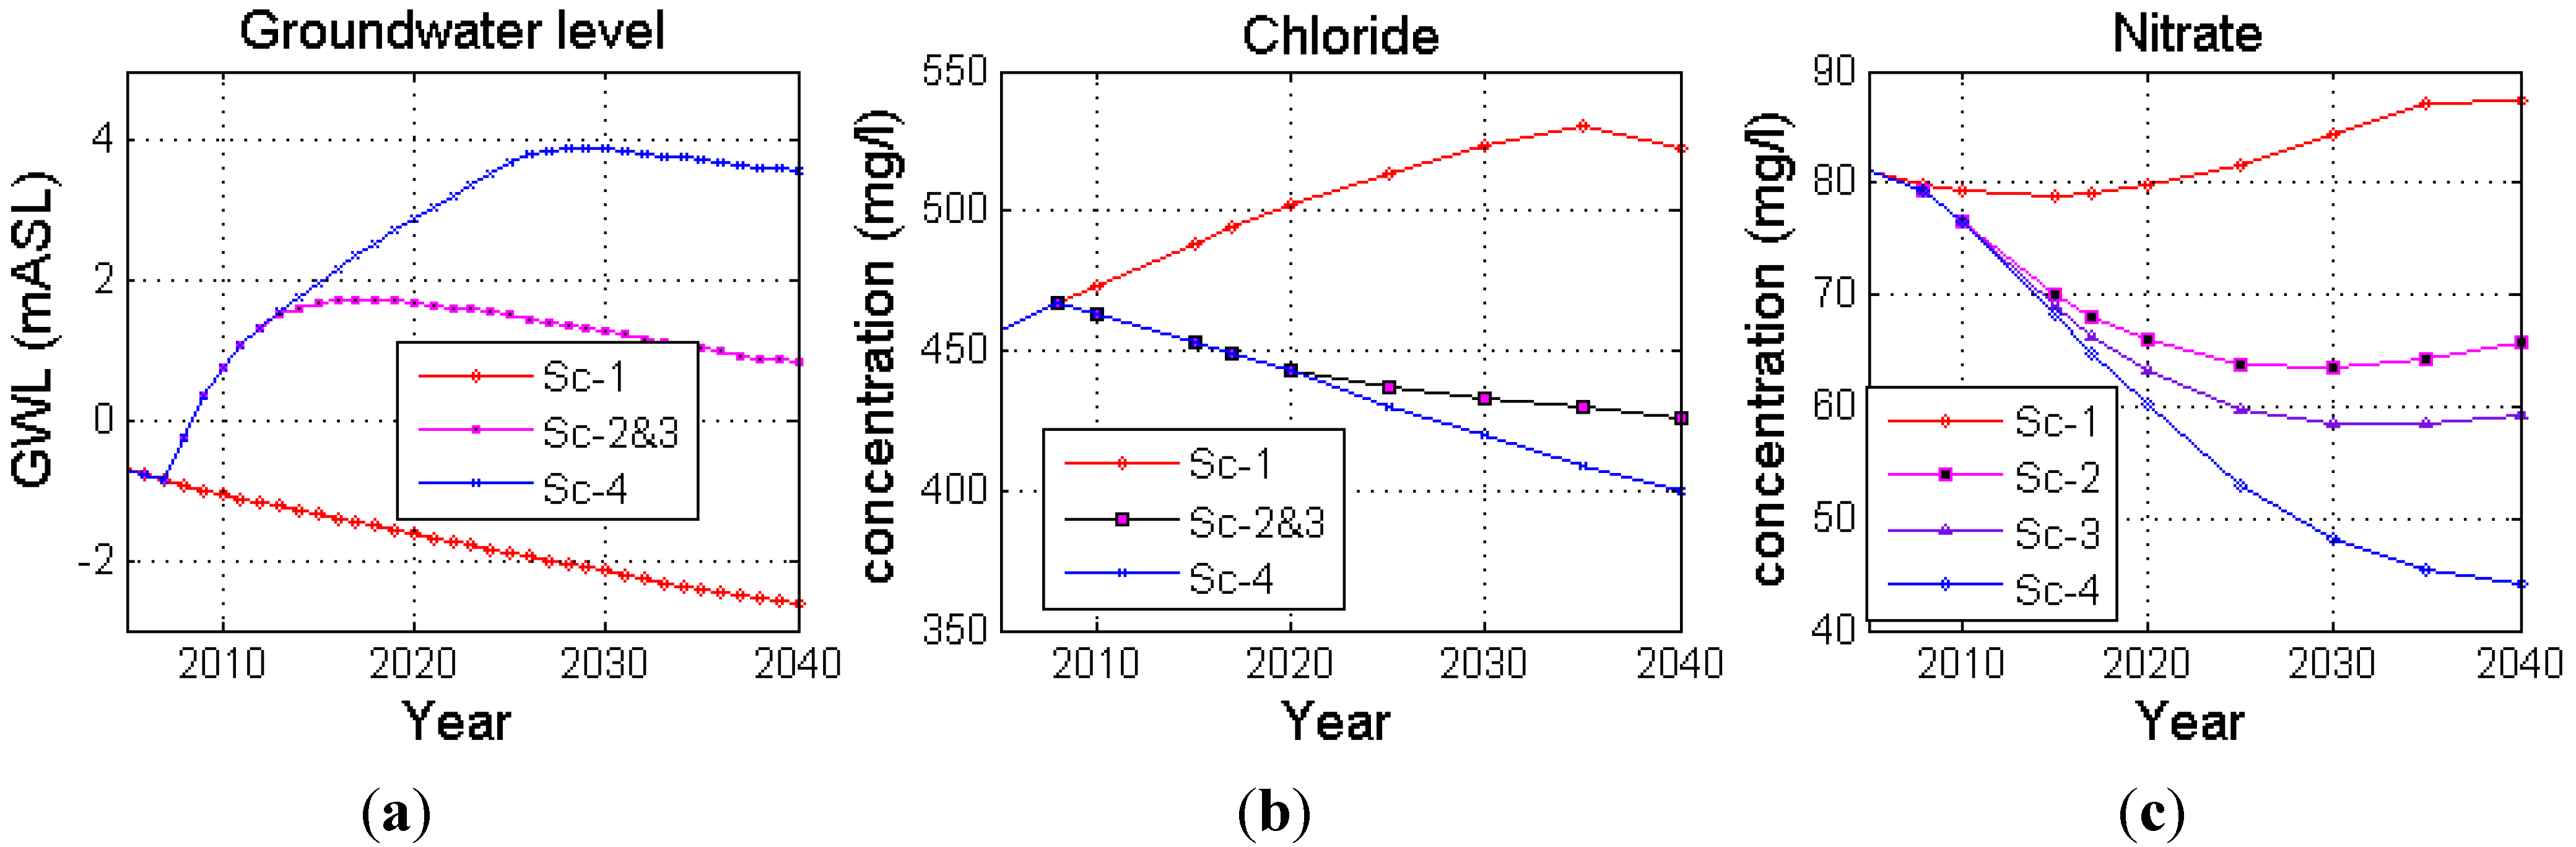
Figure 4a) that the maximum average GWL rise in the study area is 6 m by the year 2028 with respect to “Do nothing” (Sc-1). At the end of 2040, the GWLs are estimated to be −2.61 m, 0.81 m, and 3.57 m above sea level (ASL) for Sc-1, Sc-2 & Sc-3, and Sc-4, respectively. 3%–5% of the infiltrated water may flow to Israel each year under the simulation condition of Sc-2 and Sc-3, whereas this outflow was estimated to be 7%–15% per year for Sc-4. The inflow to the study area from the Israeli side will be reduced by 20%, for both Sc-2, Sc-3 and by 30% for Sc-4. Due to the infiltration of treated wastewater, the groundwater level below the infiltration basin would increase and would cause the fresh water flow to be reduced from the Israeli side.
Figure 4b shows the average chloride concentration in the study area for the four strategies. The model results show the average chloride concentrations at the end of 2040 are 522 mg/L, 426 mg/L, and 400 mg/L for Sc-1, Sc-2 & Sc-3, and Sc-4, respectively.
Figure 4c shows the average nitrate (expressed as NO
3-N) concentration in the study area for the four strategies. The average nitrate concentrations at the end of 2040 are 82.27 mg/L, 67 mg/L, 59 mg/L, and 44 mg/L for Sc-1, Sc-2, Sc-3, and Sc-4, respectively. Implementation of Sc-4 will therefore provide storage in the aquifer with a maximum value of 23 Mm
3 per year after the full implementation of north Gaza wastewater treatment plant (NGWWTP), Phase 3 (year 2025).
Figure 4.
(a) Average groundwater level; (b) average chloride concentration and (c) average nitrate concentration in the study area during year 2005 to year 2040 for the four MAR strategies.
Figure 4.
(a) Average groundwater level; (b) average chloride concentration and (c) average nitrate concentration in the study area during year 2005 to year 2040 for the four MAR strategies.
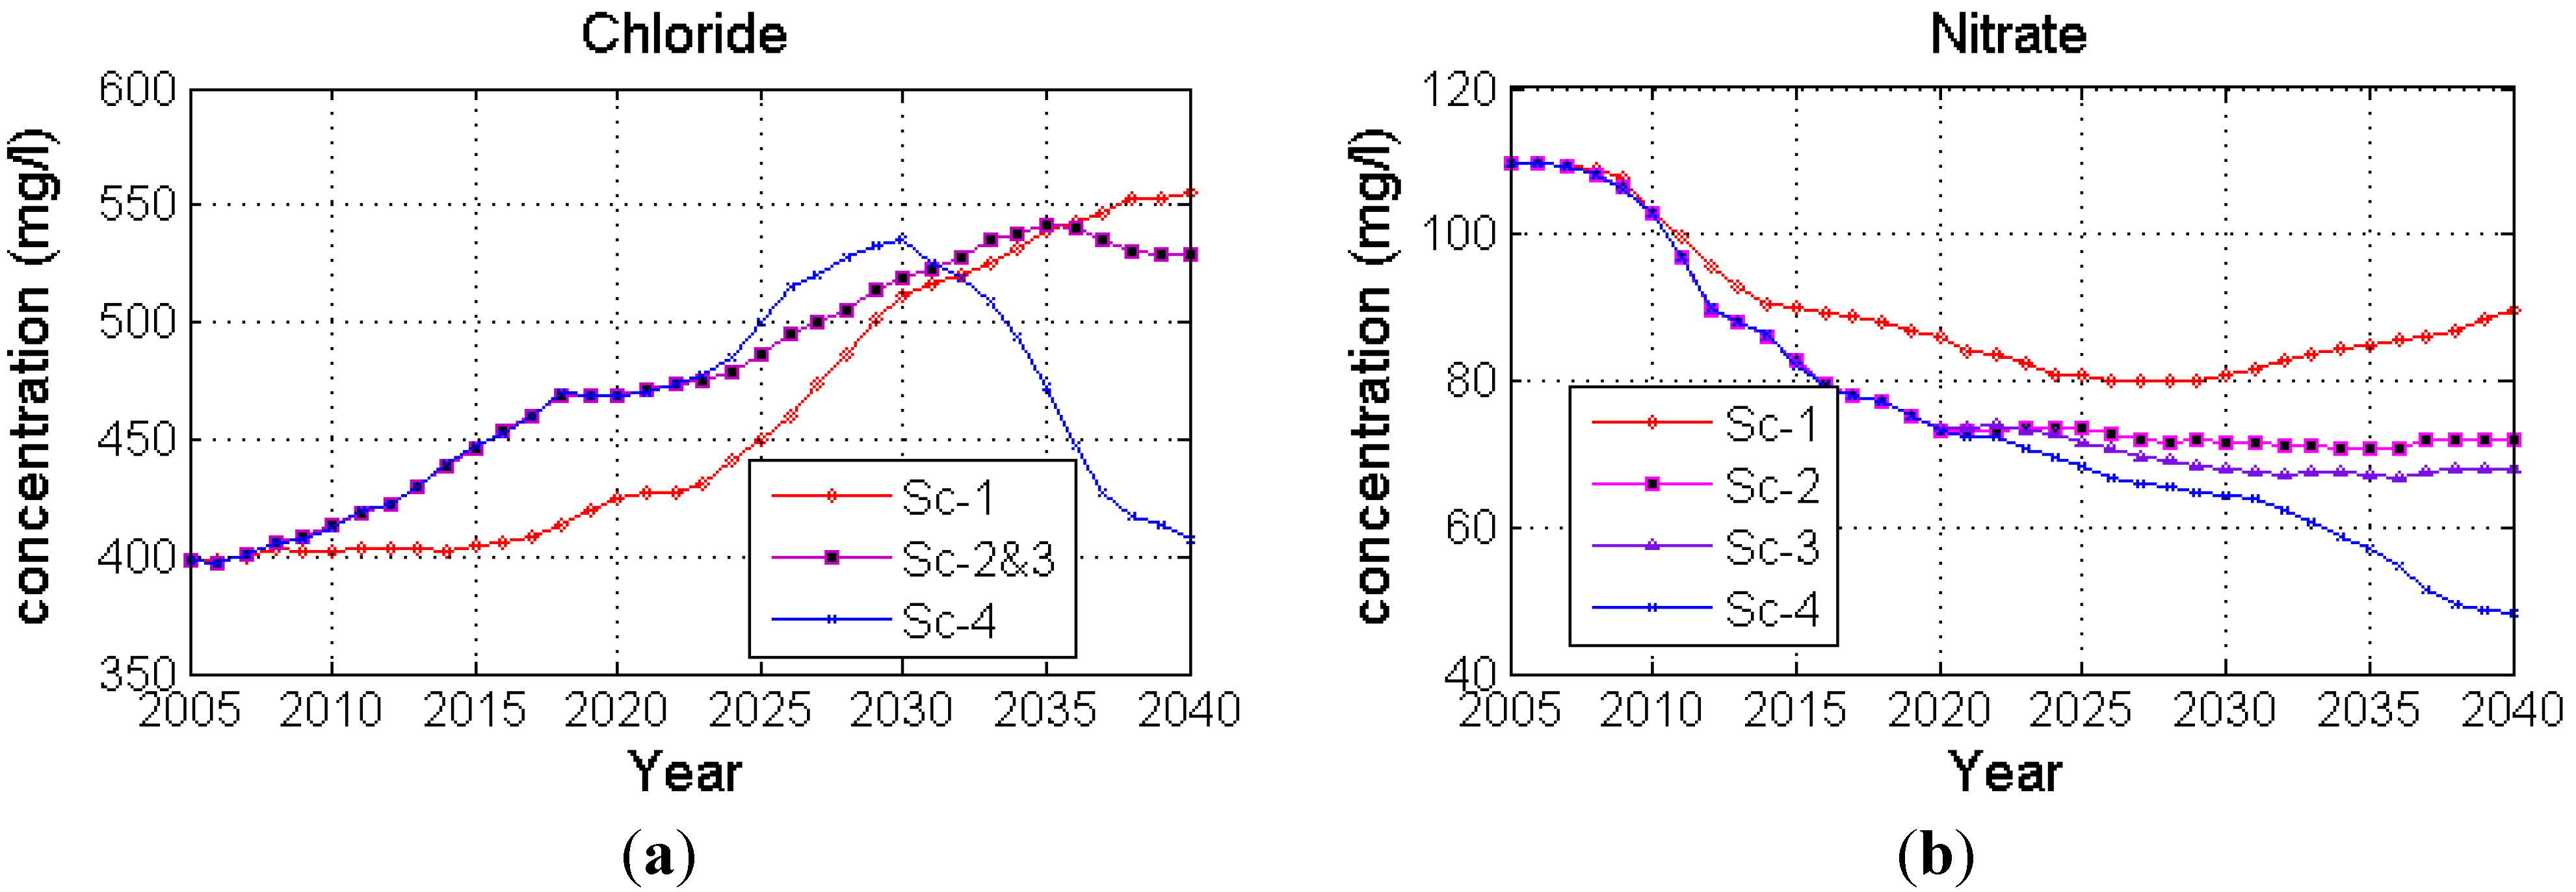
6.2. Health Criteria
A total of 10 domestic wells are located within the study area.
Figure 5a shows the average chloride content of the 10 domestic wells for the four strategies until the year 2040. The average chloride concentrations at the end of 2040 are 555 mg/L, 528 mg/L and 407 mg/L for Sc-1, Sc-2 & 3, and Sc-4, respectively. In the case of Sc-1, the average chloride concentration in all domestic wells increases until the year 2040. In the case of Sc-2 & 3 and Sc-4, the average chloride concentration increases until the year 2035 and 2030, respectively, and then the chloride concentration decreases.
Figure 5b shows the average nitrate content of the 10 domestic wells for the four strategies until the year 2040. Minimum nitrate concentration was observed in case of Sc-4. The average nitrate concentrations at the end of 2040 are 90 mg/L, 72 mg/L, 68 mg/L, and 49 mg/L for Sc-1, Sc-2, Sc-3, and Sc-4, respectively.
Figure 5.
(a) Average chloride concentration; (b) Average nitrate concentration in the ten domestic wells for the entire simulation period (year 2005 to year 2040).
Figure 5.
(a) Average chloride concentration; (b) Average nitrate concentration in the ten domestic wells for the entire simulation period (year 2005 to year 2040).
6.3. Social Criteria
The survey results indicate that 86% of the respondents agreed to reuse wastewater for agricultural purposes whereas 67% and 42% agreed to reuse wastewater for industrial and domestic purposes, respectively. Results also show that respondents are willing to pay very little for the infiltrated water regardless of use and claim to be able to afford very small fees. The inhabitants are willing to pay a maximum $0.37/m
3 to use wastewater for irrigation (
Figure 6). The survey results indicate that the distribution of acceptance and satisfaction of the public is similar throughout the various MAR strategies. In terms of satisfaction with the water quality, perceptions range from being satisfied to fairly satisfied with Sc-3 and Sc-4 having the greatest level of satisfaction.
Figure 6.
Willingness to pay of the respondents for the MAR strategies for different usage.
Figure 6.
Willingness to pay of the respondents for the MAR strategies for different usage.
6.4. Economic Criteria
In the study area most of the people depend on agriculture, and many youths and women participate in agricultural activities. The agricultural activities in the study area depend on the groundwater irrigation. Hence, it is important to carefully review the water price (tariffs) for project feasibility. The survey results indicate that the respondents cannot afford to expend more money in order to use the benefit gained due to implementation of Sc-2, Sc-3 and Sc-4.
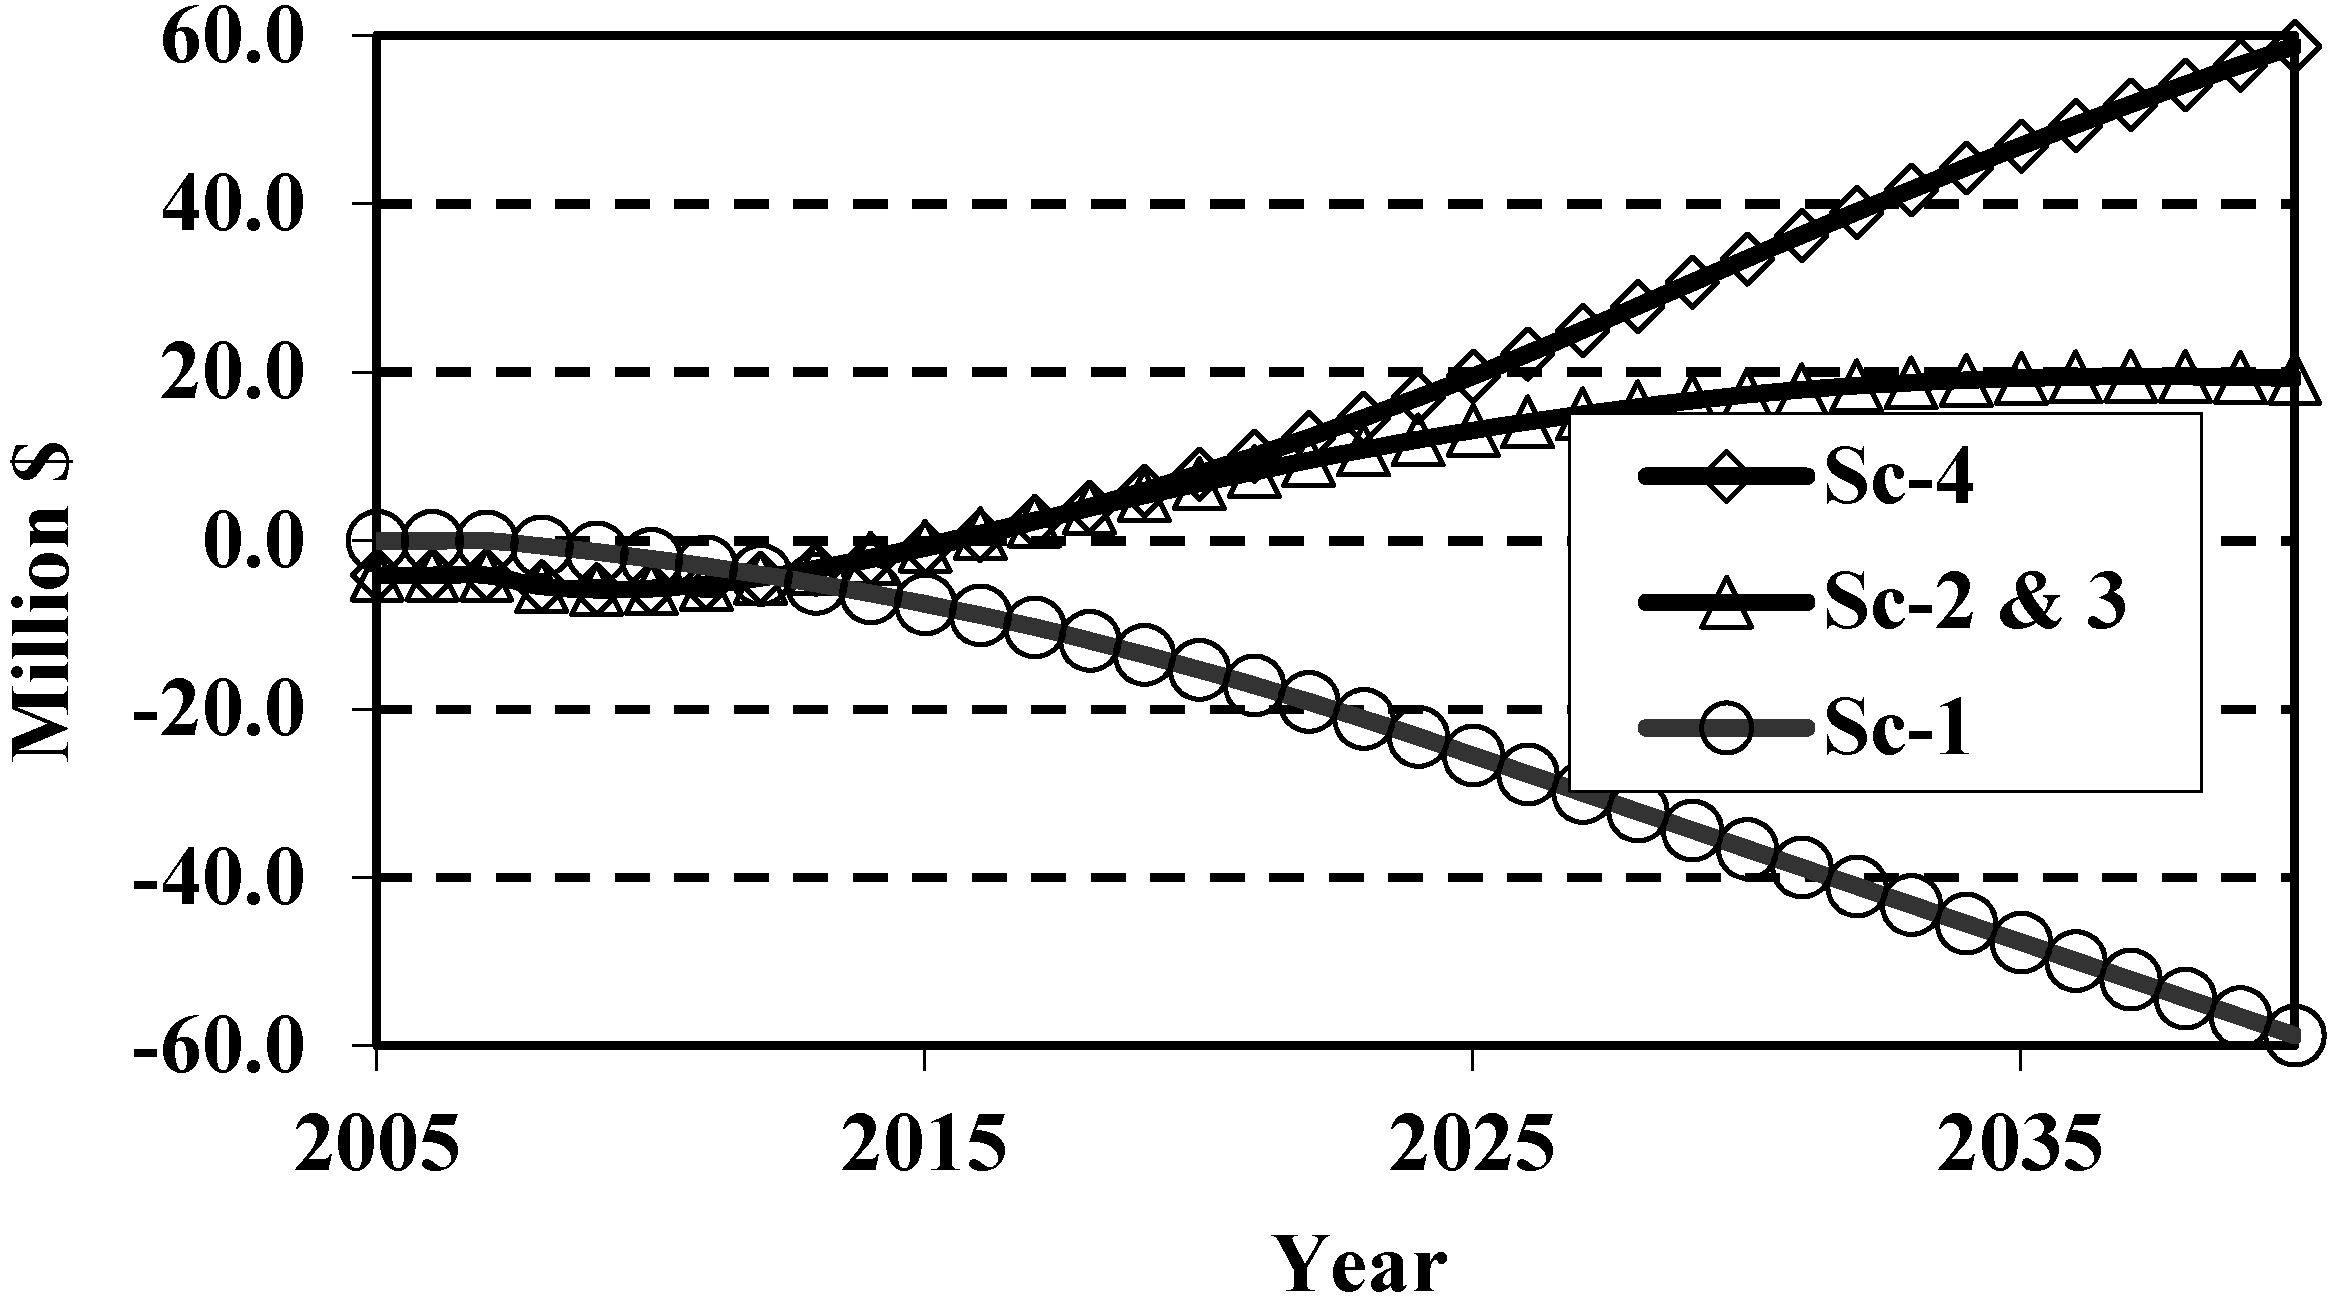
High investment cost is an important factor that makes a big difference between MAR strategies (Sc-2, Sc-3 and Sc-4) and the “Do nothing approach” (Sc-1). From the net benefit (cost-benefit) estimation (
Figure 7), the implementation of a MAR strategy would be beneficial after year 2022 in case of Sc-4 and after year 2024 in case of Sc-2 and 3 (
Figure 7). Sc-4 returns the most benefit due to its extended amount of infiltration volume even after year 2012. The net present values of the strategies (years 2005–2040) are $10.2 M for Sc-2 and Sc-3 and $28.4 M for Sc-4 whereas for Sc-1 the value is −$32. 0 M (negative sign indicates net cost). That is, there is a $60.4 M PV net benefit of switching from strategy Sc-1 to Sc-4 or a $42.2 M PV net benefit of switching from Strategy Sc-1 to either Sc-2 or Sc-3.
Figure 7.
Net benefit analysis for the four MAR strategies.
Figure 7.
Net benefit analysis for the four MAR strategies.
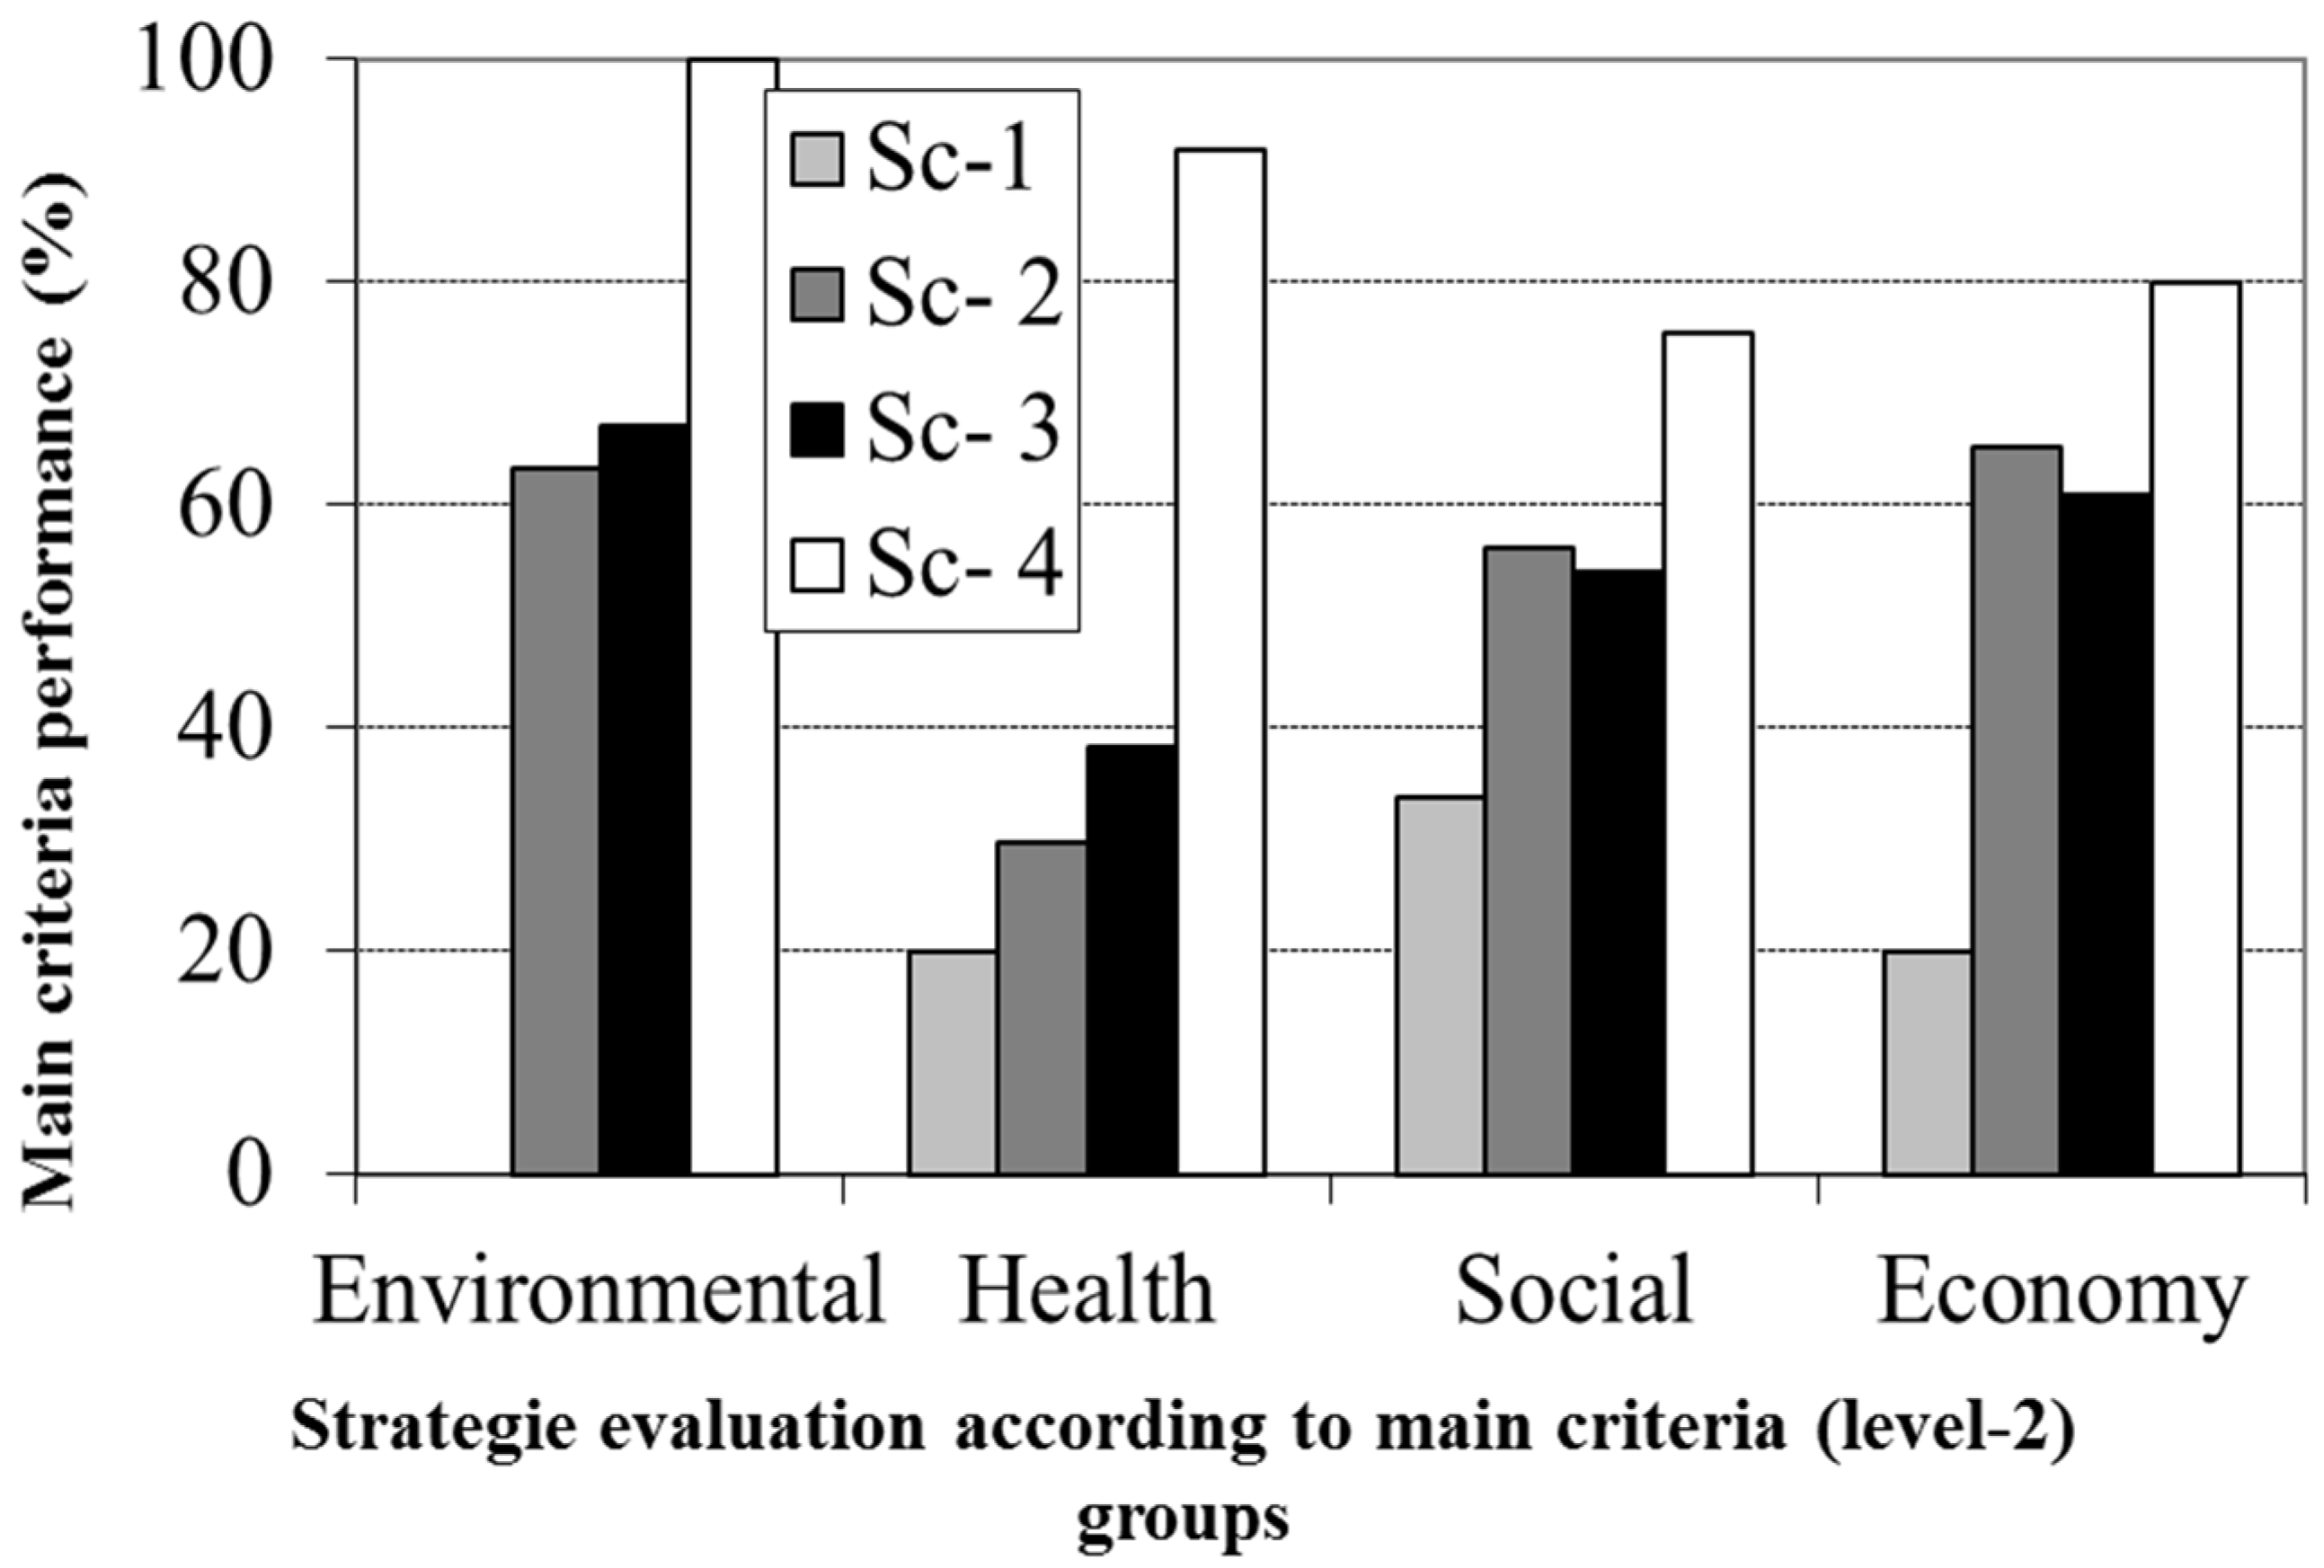
7. Strategy Comparison and Ranking
Figure 8 shows the performance of the four strategies according to the main criteria group (level-2). It is clear from the figure that Sc-4 performs the best in environmental, health and social criteria and Sc-1 performs the worst in these cases. Sc-2 performs better that Sc-3 according to the social and economic criteria but performs worse than Sc-3 for environmental and health criteria. People’s affordability, convenience, and acceptance of wastewater seem important for the ranking. The final ranking was achieved after combining the main criteria groups (level-4) and the ranking is Sc-4 > Sc-3 > Sc-2 > Sc-1.
It was found that Sc-4 performs best for all the quantified detailed criteria with the following exceptions; average chloride concentrations in domestic wells over the study period, satisfaction with domestic water quality, willingness to pay and affordability to pay. These deviations are due to temporarily increased salinity of domestic wells in specific locations due to changed flow directions and variable salinity in the aquifer. This also influences criteria for satisfaction with domestic water quality for users of those domestic wells, and willingness to pay. Sc-4 also has the highest capital costs of all options (affecting affordability to pay), although the net benefits are greatest. For these specific criteria, only the “Do Nothing Case” (Sc-1) performs the best, although for other criteria it performs very poorly compared with other options, especially Sc-4.
PROMETHEE I partial ranking also confirms that Sc-4 performs better than the other strategies. No out-ranking relation does exist between Sc-2 and Sc-1; and Sc-1 and Sc-3. PROMETHEE II ranking is similar to that observed using WLC method.
Figure 8.
Ranking of the strategies according to main criteria group (level 2) using AHP-WLC combination.
Figure 8.
Ranking of the strategies according to main criteria group (level 2) using AHP-WLC combination.
8. Discussion
8.1. Criteria Quantification
8.1.1. Environmental Criteria
The Sc-1 (“Do Nothing Approach”) indicates continuous groundwater level mining over time, whereas Sc-4 indicates higher groundwater development than the other three strategies. Similarly, among the four strategies, Sc-4 shows better conditions in terms of inflow from the sea to North Gaza. Infiltration of excess treated wastewater even after 2012 might help Sc-4 to get more environmental benefit. In general, the problem of water flow from the sea will remain under control by the infiltration of all MAR strategies. It is clear from the results that Sc-1 (“Do Nothing Approach”) will lead to deterioration of groundwater quality (i.e., chloride and nitrate increase) with time. However, for other strategies, the groundwater quality will improve with time. The long-term effect of groundwater flow might also control the groundwater quality in the study area as the distribution of chloride and nitrate in North Gaza and the nearby Israel border is complex.
From the groundwater model simulation, we delineated a zone of ca. 200 m from the edge of the infiltration basins receiving the infiltrated water with a residence time of ca. six months. Regarding pathogenic bacteria, residence time of more than 6 months is recommended [
46]. In the study area, no domestic wells exist within these 200 m.
8.1.2. Health Criteria
The impact of managed aquifer recharge projects on domestic wells is very sensitive to the population living in the area. The simulation result for Sc-4 shows a significant chloride concentration decrease in the study area at the end of the year 2040 in comparison to Sc-1, Sc-2 and Sc-3. By analysing the chloride concentrations in all domestic wells and comparing them with the “Do Nothing” strategy, observations show that the impact on chloride concentrations in all wells will be almost the same. Due to the groundwater flow direction of the infiltrated treated effluent, this would also impact the domestic wells. The increasing trend in the domestic well chloride concentration is due to the higher chloride concentration in the infiltrated water than the native groundwater and groundwater flow direction. In general, the nearby aquifer of the wells and the aquifer beneath the infiltration basin display higher chloride concentration. The infiltrated water would displace this water towards the domestic wells and the chloride concentration rises at the wells. The infiltrated water replaces the worse quality water and chloride concentrations at the wells are expected to decrease with time.
The nitrate concentration at the locations where the domestic wells are located is comparatively higher than the nitrate concentration below the infiltration pond and the nitrate concentration in the infiltrated water. The nitrate concentration in all domestic wells will be slightly improved.
8.1.3. Social Criteria
In general, the inhabitants are willing to pay more if fully treated wastewater is reused. Respondents do not agree to use the infiltrated water for domestic purposes but they have higher acceptance to use this water for agricultural or industrial purposes. The reuse of treated wastewater for irrigated agriculture would save higher quality groundwater water for drinking water supply and subsequently may solve some environmental problems. The health and religious aspects could be a major concern of people of Gaza to reuse wastewater [
13]. The study found that the education level, standard of living and the environment might be key issues in order to convince the people of Gaza to reuse wastewater in agriculture.
8.1.4. Economic Criteria
Implementation of Sc-4 would lead to the maximum benefit. Reuse of wastewater would offer the release of corresponding fresh water resources and will help to expand the overall irrigated area by providing more water to irrigate lands. Hence, the livelihood of the residents may improve. Besides the above-mentioned benefits, more indirect benefits may be gained from improving groundwater quality. These are increased safety and the benefits generated from freeing the land that the current effluent lagoon occupies as well as the other subjective benefits related to seawater intrusion. Finally, the MAR project would create many other supported jobs e.g., related to MAR operation and agricultural activities etc.
8.2. Strategy Comparison and Ranking
According to the analysis using WLC and PROMETHEE, the same rankings of options were achieved. The comparison of water management options showed that increasing investments in wastewater collection, treatment, and later MAR would result in an improved water management strategy performance with regards to the considered environmental, social, and health criteria. Obvious drawbacks are the investments for infrastructure and their impact on economic feasibility. This should be discussed in greater depth and should be based on comprehensive cost-benefit analysis (CBA) and cost effectiveness that should refer to cost minimization and the related environmental and health benefits, which are fundamental to guarantee the sustainable development of the Gaza Strip.
9. Conclusions and Recommendations
The present study clearly shows the importance of environmental, health, social and economic impact assessment of MAR strategies performing a case study in North Gaza. The integrated approach of combining field campaign, methodological analysis and mathematical modelling has been proven to be effective for a multicriteria decision analysis. In order to increase water supply and to combat water scarcity, water pollution, and health problems at the Northern Gaza Strip, appropriate water resources planning and management measures are urgently required. Reuse of the treated effluent by MAR would strengthen agricultural development and result in increased groundwater availability for domestic and industrial use. The reuse of treated effluent has already been adapted in the national Water Policy for the Gaza Strip [
47]. The present study shows that the so-called “Do Nothing Approach” is no real option for Northern Gaza, contributing to further groundwater level decline and groundwater quality deterioration, and increasing health risks for the population of Gaza. The performance analysis of the developed water resources planning and management strategies clearly shows that managed aquifer recharge by infiltration ponds with proper treatment of the effluents is a viable response to the increasing water resources problems of the region. In order to maximize project benefit, optimal pond operation based on practical experiences and regular cleaning of the pond is required to avoid clogging of the pond bed. Application of several MCDA analysis methods probes the robustness of the ranking analysis.
Ten domestic wells will be affected over time due to displacement of relatively low quality groundwater towards the abstraction wells. However, with time, the low quality water will be replaced by the nearby infiltrated water. Special care for water recovery should therefore be planned to protect the existing domestic wells. Another option could be to use the affected domestic wells for agricultural use and use the nearby unaffected wells for domestic water supply. Nevertheless, regular water quality monitoring of abstracted water and efficient recovery wells should be considered. Tremendous effort is required to increase public awareness for wastewater reuse. Adequate water pricing should be made considering the level of income and economic feasibility of the MAR project.
Additional investments should be undertaken for better maintenance and to further extend the wastewater collection network as well as the capacity of the NGWWTP at the Israeli border, accompanying the rapidly increasing wastewater production. Furthermore, managed aquifer recharge contributes to the control of seawater intrusion and groundwater salinity.
Due to the unavailability of scientific data, a variable-density groundwater flow model was not considered in this case study. As the objective of the study is not to quantify salinity intrusion, rather compare different management scenarios, the fresh water flow model is sufficient. In order to investigate the effect of MAR strategies on saline groundwater intrusion into the coastal aquifer, a variable-density groundwater flow model is recommended.
The approach and techniques used in this study can be applicable not only to MAR project implementation but also to other water resource development projects.
Acknowledgments
The authors gratefully acknowledge the contribution of European Commission (EC) to fund the study under the FP6 program, with the project entitled “Groundwater Artificial recharge Based on Alternative sources of wateR: aDvanced INtegrated technologies and management” (GABARDINE), contract No. 518118. Sincere thanks to the Palestinian Hydrology Group for their helpful support and providing the field data. The authors would also like to express their gratitude to the reviewers and the external editor whose collective input substantially improved this paper. We acknowledge support by Deutsche Forschungsgemeinschaft and Open Access Publishing Fund of Leibniz Universität Hannover.
Author Contributions
The text of this article was written by Mohammad Azizur Rahman, Bernd Rusteberg with contributions from Muath Abu Saada, Ayman Rabi and Martin Sauter. Mohammad Azizur Rahman conducted background research on integrated approach for MAR, developed the model and analysed the results. Bernd Rusteberg was involved in method development and coordinated the study. Mohammad Salah Uddin contributed to the model development and result analysis. Muath Abu Saadah provided support to the model development and field data collection. Ayman Rabi involved in coordination of social surveys and contributed to the economic analysis. Martin Sauter provided content review and helped to shape the presentation of our results.
Conflicts of Interest
The authors declare no conflict of interest.
References
- Maliva, R.G.; Missimer, T.M. Aquifer storage and recovery and managed aquifer recharge using wells: Planning, hydrogeology, design, and operation. In Methods in Water Resources Evaluation; Series No. 2; Schlumberger Water Services: Huston, TX, USA, 2010; p. 578. [Google Scholar]
- Rahman, M.A. Decision Support for Managed Aquifer Recharge (MAR) Project Planning to Mitigate Water Scarcity Based on Non-Conventional Water Resources. Ph.D. Thesis; Department of Applied Geology, University of Goettingen: Goettingen, Germany, 2011. Available online: http://webdoc.sub.gwdg.de/diss/2011/rahman/ (accessed on 22 June 2013).
- Milgrom, T.; Bensabat, J.; Guttman, J. Towards IWRM implementation—Scenario definition for Kaliya Region. In Proceedings of the 7th International Conference on Water Resources Conservancy and Risk Reduction under Climatic Instability, Limmasol, Cyprus, 25–27 June 2009.
- Rusteberg, B.; Rahman, M.A.; Bear, J.; Bensabat, J.; Brouyere, S.; Wojda, P.; Sadah, M.A.; Lobo- Ferriera, J.P.; Sauter, M. Decision support for MAR planning in the context of integrated water resources management. In Advances in Water Reclamation Technologies for Safe Managed Aquifer Recharge; Kazner, C., Wintgens, T., Dillon, P., Eds.; IWA Publishing: London, UK, 2012; Chapter 21. [Google Scholar]
- Rusteberg, R.; Rahman, M.A.; Sadah, M.A.; Rabi, A.; Sauter, M. Water Management Strategies Analysis Using Multiple Criteria Decision Techniques towards Sustainable Development of Northern Gaza Strip. In Proceedings of BALWOIS 2010: Conference on Water Observation and Information for Decision Support, Ohrid, Republic of Macedonia, 25–29 May 2010.
- Metcalf & Eddy Inc. Coastal Aquifer Management Program. Integrated Aquifer Management Program, Task 3; Report Prepared under USAID Contract No. 294-C-99-00038-00; Metcalf & Eddy Inc.: Gaza, Palestine, 2000; Volume 1. [Google Scholar]
- Shomar, B. Groundwater of the Gaza Strip: Is it drinkable? Environ. Geol. 2006, 50, 743–751. [Google Scholar] [CrossRef]
- Afifi, S. Evaluation of technical performance of Beit-Lahia wastewater treatment plant in the Northern Gaza Strip- Palestine. In Proceedings of the 2nd International Conference on the Palestinian Environment, Nablus, Palestine, 13–15 October 2009; pp. 152–164.
- Sadah, M.A.; Rabi, A.; Ghannam, S.; Tamimi, A.R. Impact of the “Do-nothing” approach at the Gaza Strip, Palestine. GABARDINE Deliv. D 2009, 71, 21. [Google Scholar]
- Engineering and Management Consulting Center (EMCC). Environmental Assessment: North Gaza Emergency Sewage Treatment Plant Project; West Bank and Gaza, World Bank: Gaza, Palestine, 2006. Available online: http://www-wds.worldbank.org/external/default/WDSContentServer/WDSP/IB/2006/04/25/000160016_20060425173250/Rendered/PDF/E13870MENA1EA1P074595.pdf (accessed on 2 December 2013).
- World Bank. North Gaza Emergency sEwage Treatment Additional Financing. Available online: http://www-wds.worldbank.org/external/default/WDSContentServer/WDSP/IB/2008/04/08/000076092_20080411104258/Original/Final0PID.doc (accessed on 23 January 2010).
- Tubail, K.; Al-Dadah, J.; Yassin, M. Present situation of wastewater and its possible prospect for reuse in the Gaza strip. KA-Abwasser. Abfall 2004, 51, 866–872. [Google Scholar]
- Nassar, A.; Tubail, K.; Hall, J. Effluent management of the Gaza central wastewater treatment plant: Assumptions and implications. J. Environ. Sci. 2010, 39, 199–210. [Google Scholar]
- Hamdan, S.M.; Nassar, A.; Troeger, U. Impact of Gaza aquifer from recharge with partially treated aquifer. J. Water Reuse Desalin. 2011, 1, 36–43. [Google Scholar] [CrossRef]
- Al-Agha, M.R. Environmental management in the Gaza strip. Environ. Impact Assess Rev. 1997, 17, 65–76. [Google Scholar] [CrossRef]
- Shaheen, S.L.R. Nitrate Pollution and Groundwater Modelling of Wastewater Plant in Rafah Area, Gaza Strip, Palestine. Master’s Thesis, Gent University, Gent, Belgium, 2007; p. 64. [Google Scholar]
- Sheyam, M. Groundwater Salinity Modelling Using Artificial Neural Networks-Gaza Strip Case Study. Master’s Thesis, The Islamic University, Gaza, Palestine, 2009; p. 156. [Google Scholar]
- Qahman, K.A.; Zhou, Y. Monitoring of seawater intrusion in the Gaza strip, Palestine. In Proceedings of First International Conference on Saltwater Intrusion and Coastal Aquifers Monitoring, Modelling, and Management, Essaouira, Morocco, 23–25 April 2001.
- Shomar, B. Groundwater contamination and health perspectives in developing world case study: Gaza Strip. Environ. Geochem. Health 2011, 33, 189–202. [Google Scholar] [PubMed]
- Aish, A. Hydrogeological Study and Artifitial Recharge Modeling of the Gaza Coastal Aquifer Using GIS and MODFLOW. Ph.D. Thesis, Vrije Universiteit Brussel (VUB), Brussels, Belgium, 2004. [Google Scholar]
- El-Naeem, M.F.; Heen, Z.A.; Tubail, K. Factors behind groundwater salinization in North governorates of Gaza strip (1994–2004). In Proceedings of 14th International Water Technology Conference (IWTC), Cairo, Egypt, 12–24 March 2010; pp. 893–907.
- Metcalf and Eddy. Coastal Aquifer Management Program (CAMP); Final Model Report; The United States Agency for International Development and Palestinian Water Authority: Gaza, Palestine, 2000. [Google Scholar]
- Shomar, B.; Yahya, A.; Müller, G. Chemical characterization of soil and water from a wastewater treatment plant in Gaza. Soil Sedim. Contamin. Int. J. 2005, 14, 309–332. [Google Scholar] [CrossRef]
- Palestinian Water Authority (PWA). Water Resources and Management Issues; Water Resources and Planning Department: Gaza, Palestinian, 2002. [Google Scholar]
- Coastal Municipalities Water Utility (CMWO). Summary about Water and Wastewater Situation in Gaza Strip. Available online: http://www.cmwu.ps/files/reports/8-6-2011-%5Breport%5D-Summary_-Water_and_WW_Situation_in_Gaz_Strip_2010.pdf (accessed on 15 January 2013).
- Mogheir, Y.; Ajjur, S. Effects of Climate Change on Groundwater Resources (Gaza Strip Case Study). Int. J. Sustain. Energy Environ. 2013, 1, 136–149. [Google Scholar]
- Al-Yaqoubi, A.S. Water Resources Statistical Records in Palestine. Available online: http://www.escwa.un.org/divisions/events/Countrypapers/5june07Palestine.pdf (accessed on 11 December 2013).
- Rahman, M.A.; Rusteberg, R.; Uddin, M.S.; Lutz, A.; Saada, M.A. Site Suitability Mapping and Managed Aquifer Recharge Site Ranking Supported by Mathematical Modelling at Northern Gaza Coastal Aquifer. J. Environ. Manag. 2013, 24, 24–39. [Google Scholar]
- Kahan, D. Agriculture and Water Resources in the West Bank and Gaza, 1967–1987; Westview Press: Boulder, CO, USA, 1987; p. 181. [Google Scholar]
- Towards Environmental Performance Indicators for the European Union (EU); European Commission (EC): Brussels, Belgium, 2002.
- Organisation for Economic Cooperation and Development (OECD). OECD Environmental Indicators, Development, Measurement and Use. Available online: http://www.oecd.org/dataoecd/7/47/24993546.pdf (accessed on 13 January 2010).
- Kristensen, P. The DPSIR framework. In Proceedings of Workshop on a Comprehensive/Detailed Assessment of the Vulnerability of Water Resources to Environmental Changes in Africa Using River Basin Approach, Nairobi, Kenya, 27–29 September 2004.
- Sadah, M.A.; Rabi, A.; Ghannam, S.; Tamimi, A.R. Social considerations regarding the use of brackish water and recovered effluent for agricultural purposes. GABARDINE Deliv. D 2009, 74, 40. [Google Scholar]
- Saaty, T.L. The Analytical Hierarchy Process; Mcgraw-Hill: New York, NY, USA, 1980. [Google Scholar]
- Eastman, J.R.; Kyem, P.A.K.; Toledano, J.; Jin, W. GIS and Decision Making; United Nations Institute for Training and Research (UNITAR) European Office: Geneva, Switzerland, 1993. [Google Scholar]
- Sadah, M.A.; Rabi, A.; Ghannam, S.; Tamimi, A.R. Environmental impacts of suggested AR response strategies at Gaza Strip, Palestine. GABARDINE Deliv. D 2009, 73, 40. [Google Scholar]
- Sadah, M.A.; Rabi, A.; Ghannam, S.; Tamimi, A.R. Economic analysis and feasibility of AR at Gaza Strip, Palestine. GABARDINE Deliv. D 2009, 72, 16. [Google Scholar]
- Executive Action Team (EXACT). Temporal trends for water resources data in areas of Israeli, Jordanian, and Palestinian Interest. Available online: http://www.exact-me.org/trends/index.htm (accessed on 11 December 2010).
- Brans, J.P. Lingenierie de la decision. In Elaboration Dinstruments Daide a la Decision. Methode PROMETHEE; Nadeau, R., Landry, M., Eds.; Instruments et Perspectives Davenir, Presses de Universite Laval: Laval, Quebec, Canada, 1982; pp. 183–214. [Google Scholar]
- Brans, J.P.; Vincke, P. A preference ranking organization method: The PROMETHEE method for MCDM. Manag. Sci. 1985, 31, 647–656. [Google Scholar] [CrossRef]
- Brans, J.P.; Mareschal, B. The PROMCALC & GAIA decision support system for multicriteria decision aid. Decis. Support Syst. 1994, 12, 297–310. [Google Scholar] [CrossRef]
- Macharis, C.; Springael, J.; Brucker, K.D.; Verbeke, A. PROMETHEE and AHP: The design of operational synergies in multicriteria analysis. Strengthening PROMETHEE with ideas of AHP. Eur. J. Oper. Res. 2004, 153, 307–317. [Google Scholar] [CrossRef]
- Figueira, J.; Greco, S.; Ehrgott, M. Multiple Criteria Decision Analysis State of the Art Surveys; Springer Verlag: Berlin, Germany, 2005. [Google Scholar]
- Behzadian, M.; Kazemzadeh, R.B.; Albadvi, A.; Aghdasi, M. PROMETHEE: A comprehensive literature review on methodologies and applications. Eur. J. Oper. Res. 2010, 200, 198–215. [Google Scholar] [CrossRef]
- Abedi, M.; Torabi, S.A.; Norouzi, G.; Hamzeh, M.; Elyasi, G. PROMETHEE II—A knowledge-driven method for copper exploration. Comput. Geosci. 2012, 46, 255–263. [Google Scholar] [CrossRef]
- California Department of Public Health (CDPH). Groundwater recharge reuse, Draft Regulation. 2008. Available online: http://www.cdph.ca.gov/certlic/drinkingwater/Documents/Recharge/DraftRegulations.pdf (accessed on 3 February 2010).
- Nassar, R.A.; Al-Najar, H.; Al-Dadah, J.Y. Socio-economic aspects of wastewater reuse in the Gaza strip. J. Environ. Sci. Technol. 2009, 2, 170–178. [Google Scholar] [CrossRef]
© 2014 by the authors; licensee MDPI, Basel, Switzerland. This article is an open access article distributed under the terms and conditions of the Creative Commons Attribution license (http://creativecommons.org/licenses/by/4.0/).


