Article

Water Resources Response to Changes in Temperature, Rainfall and CO2 Concentration: A First Approach in NW Spain

by
Ricardo Arias
1,
M. Luz Rodríguez-Blanco
1,*,
M. Mercedes Taboada-Castro
1,
Joao Pedro Nunes
2,
Jan Jacob Keizer
2 and
M. Teresa Taboada-Castro
1
1
Facultad de Ciencias and Centro de Investigaciones Científicas Avanzadas (CICA), University of A Coruña, Campus de A Coruña, A Coruña 15071, Spain
2
Centre for Environmental and Marine Studies (CESAM) and Department Environment & Planning, University of Aveiro, Aveiro 3810-193, Portugal
*
Author to whom correspondence should be addressed.
Water 2014, 6(10), 3049-3067; https://doi.org/10.3390/w6103049
Submission received: 10 June 2014 / Revised: 26 September 2014 / Accepted: 29 September 2014 / Published: 13 October 2014
(This article belongs to the Special Issue Water Resources in a Variable and Changing Climate)

Abstract

:
Assessment of the diverse responses of water resources to climate change and high concentrations of CO2 is crucial for the appropriate management of natural ecosystems. Despite numerous studies on the impact of climate change on different regions, it is still necessary to evaluate the impact of these changes at the local scale. In this study, the Soil and Water Assessment Tool (SWAT) model was used to evaluate the potential impact of changes in temperature, rainfall and CO2 concentration on water resources in a rural catchment in NW Spain for the periods 2031–2060 and 2069–2098, using 1981–2010 as a reference period. For the simulations we used compiled regional climate models of the ENSEMBLES project for future climate input data and two CO2 concentration scenarios (550 and 660 ppm). The results showed that changes in the concentration of CO2 and climate had a significant effect on water resources. Overall, the results suggest a decrease in streamflow of 16% for the period 2031–2060 (intermediate future) and 35% by the end of the 21st century as a consequence of decreasing rainfall (2031–2060: −6%; 2069–2098: −15%) and increasing temperature (2031–2060: 1.1 °C; 2069–2098: 2.2 °C).

1. Introduction

The study of the effects of climate change on the quantity and quality of water resources has attracted a great deal of attention in recent years, particularly at a regional and global scale [1]. There is a general consensus that the Earth will be subject to warming, leading to changes in global climate patterns [1]. Different responses to global warming are expected from different regions of the world. For Europe, predictions on the evolution of temperature and rainfall, based on models of varying resolution and uncertainty, warn of the possibility of increased aridity in the coming decades. This effect is particularly evident for the southern regions where future climate change is projected to worsen conditions in a region already vulnerable to climate variability as well as lower water availability [1]. In general, the models (e.g., ENSEMBLES) predict a rise in mean temperature and a reduction in rainfall for Spain, with an increase in the number of extreme years in terms of maximum temperature, flood and droughts [2,3], although there are divergences depending on the model and the greenhouse gas emission scenario used. Moreover, projections of the future evolution of rainfall are more speculative than those for temperature, especially for smaller regions, but rainfall patterns are expected to alter in intensity and amount [1,2]. Changes in the temporal and spatial distribution of rainfall can also increase inter-annual rainfall variability as well as the risk of heavy rainfall events and droughts. These changes in temperature and rainfall are expected to impact on the hydrological cycle and alter the different processes occurring at catchment scale, including changes in surface runoff, evapotranspiration rates, nutrient enrichment, erosion and sediment transport [4,5], with concomitant effects on human activities and welfare. Human welfare would be impacted by changes in water supplies and demand; changes in opportunities for non-consumptive uses of the environment for recreation and tourism; changes in loss of property and lives from extreme climate phenomena; and changes in human health [1]. An assessment of the vulnerability of water resources to climate change allows anticipating potential negative impacts, and thus planning and establishing preventive actions with time.
Various approaches to assess the effects of climate change on water resources have been used [5,6,7,8]. In general, studies have reported that an increase in CO2, as long as temperature and rainfall remain constant, will cause increases in water yield due to the marked decrease of the stomatal conductance of plants, thus decreasing evapotranspiration [8,9]. On the contrary, others have shown that higher temperatures lead to increased evaporation rates, reductions in streamflow and more frequent droughts [4,5,10]. All these studies indicate that catchment processes may be very sensitive to changes in temperature, rainfall and higher concentrations of CO2 in the atmosphere. In Europe, most of the investigations on climate change impact on water resources have predicted a general reduction in the annual streamflow (more intense in the dry season) in southern Europe due to lower rainfall amount and higher temperatures [4].
The Iberian Peninsula is located in an area particularly vulnerable to climate change, where climate projections indicate an increase in arid conditions [1]. Several researches have evaluated the effects of climate change on river regimes in the Iberian Peninsula [10,11,12], but few studies have been conducted in North-Western Spain [13]. In this area, especially in Galicia, most rivers have little or no flow data available for such analyses. Records of river discharges are relatively recent in the region where water resources have been little considered, since Galicia has been considered to have these in abundance and water availability is not a limiting factor for economic and social development. This is undoubtedly the main reason why the research carried out in the Iberian Peninsula in this field has been focused primarily on Mediterranean, semi-arid environments where the scarcity of water gives rise to serious problems [14]. However, the recent floods in autumn 2006 and winter 2013–14 or the extended drought of summer 2007 occurred in Galicia caused significant ecological, economic and social impacts, highlighting the vulnerability of aquatic ecosystems and the resources that depend on them, e.g., aquaculture. This underlines the need to improve the knowledge of river dynamics as a basis for developing watershed management models in the region in order to prevent the risks associated with these natural phenomena, which seem to have increased in intensity recently [15].
In view of the above, this study has attempted to provide an initial estimate of the effects of potential changes in temperature, rainfall and CO2 concentration on water resources in the Corbeira catchment, a minimally disturbed area located in Galicia (NW Spain). The analysis was performed using the Soil and Water Assessment Tool (SWAT) hydrological model. The SWAT model is widely used for different purposes (modelling runoff, sediment transport, nutrient, pesticides cycle, etc.) around the world and has been applied to many different size catchments and under considerably different conditions, usually with satisfactory results [16]. Among its multiple applications, SWAT has been extensively used to evaluate climate change effects on hydrological processes at catchment scale [9,11,16,17] because of its capability to incorporate future climate predictions from climatic models as inputs to the model, and to account for the effects of increased CO2 on plant development and evapotranspiration. The interest of the study area is due to its location upstream from the Cecebre reservoir, which is an ecosystem of great ecological interest, being a EU Natura 2000 site, as well as the only source of water supply for the city of A Coruña and the surrounding municipalities (450,000 inhabitants). This fact gives special relevance to the findings of this study, from which a trend can be extracted for policy design purposes for the Cecebre reservoir.

2. Materials and Methods

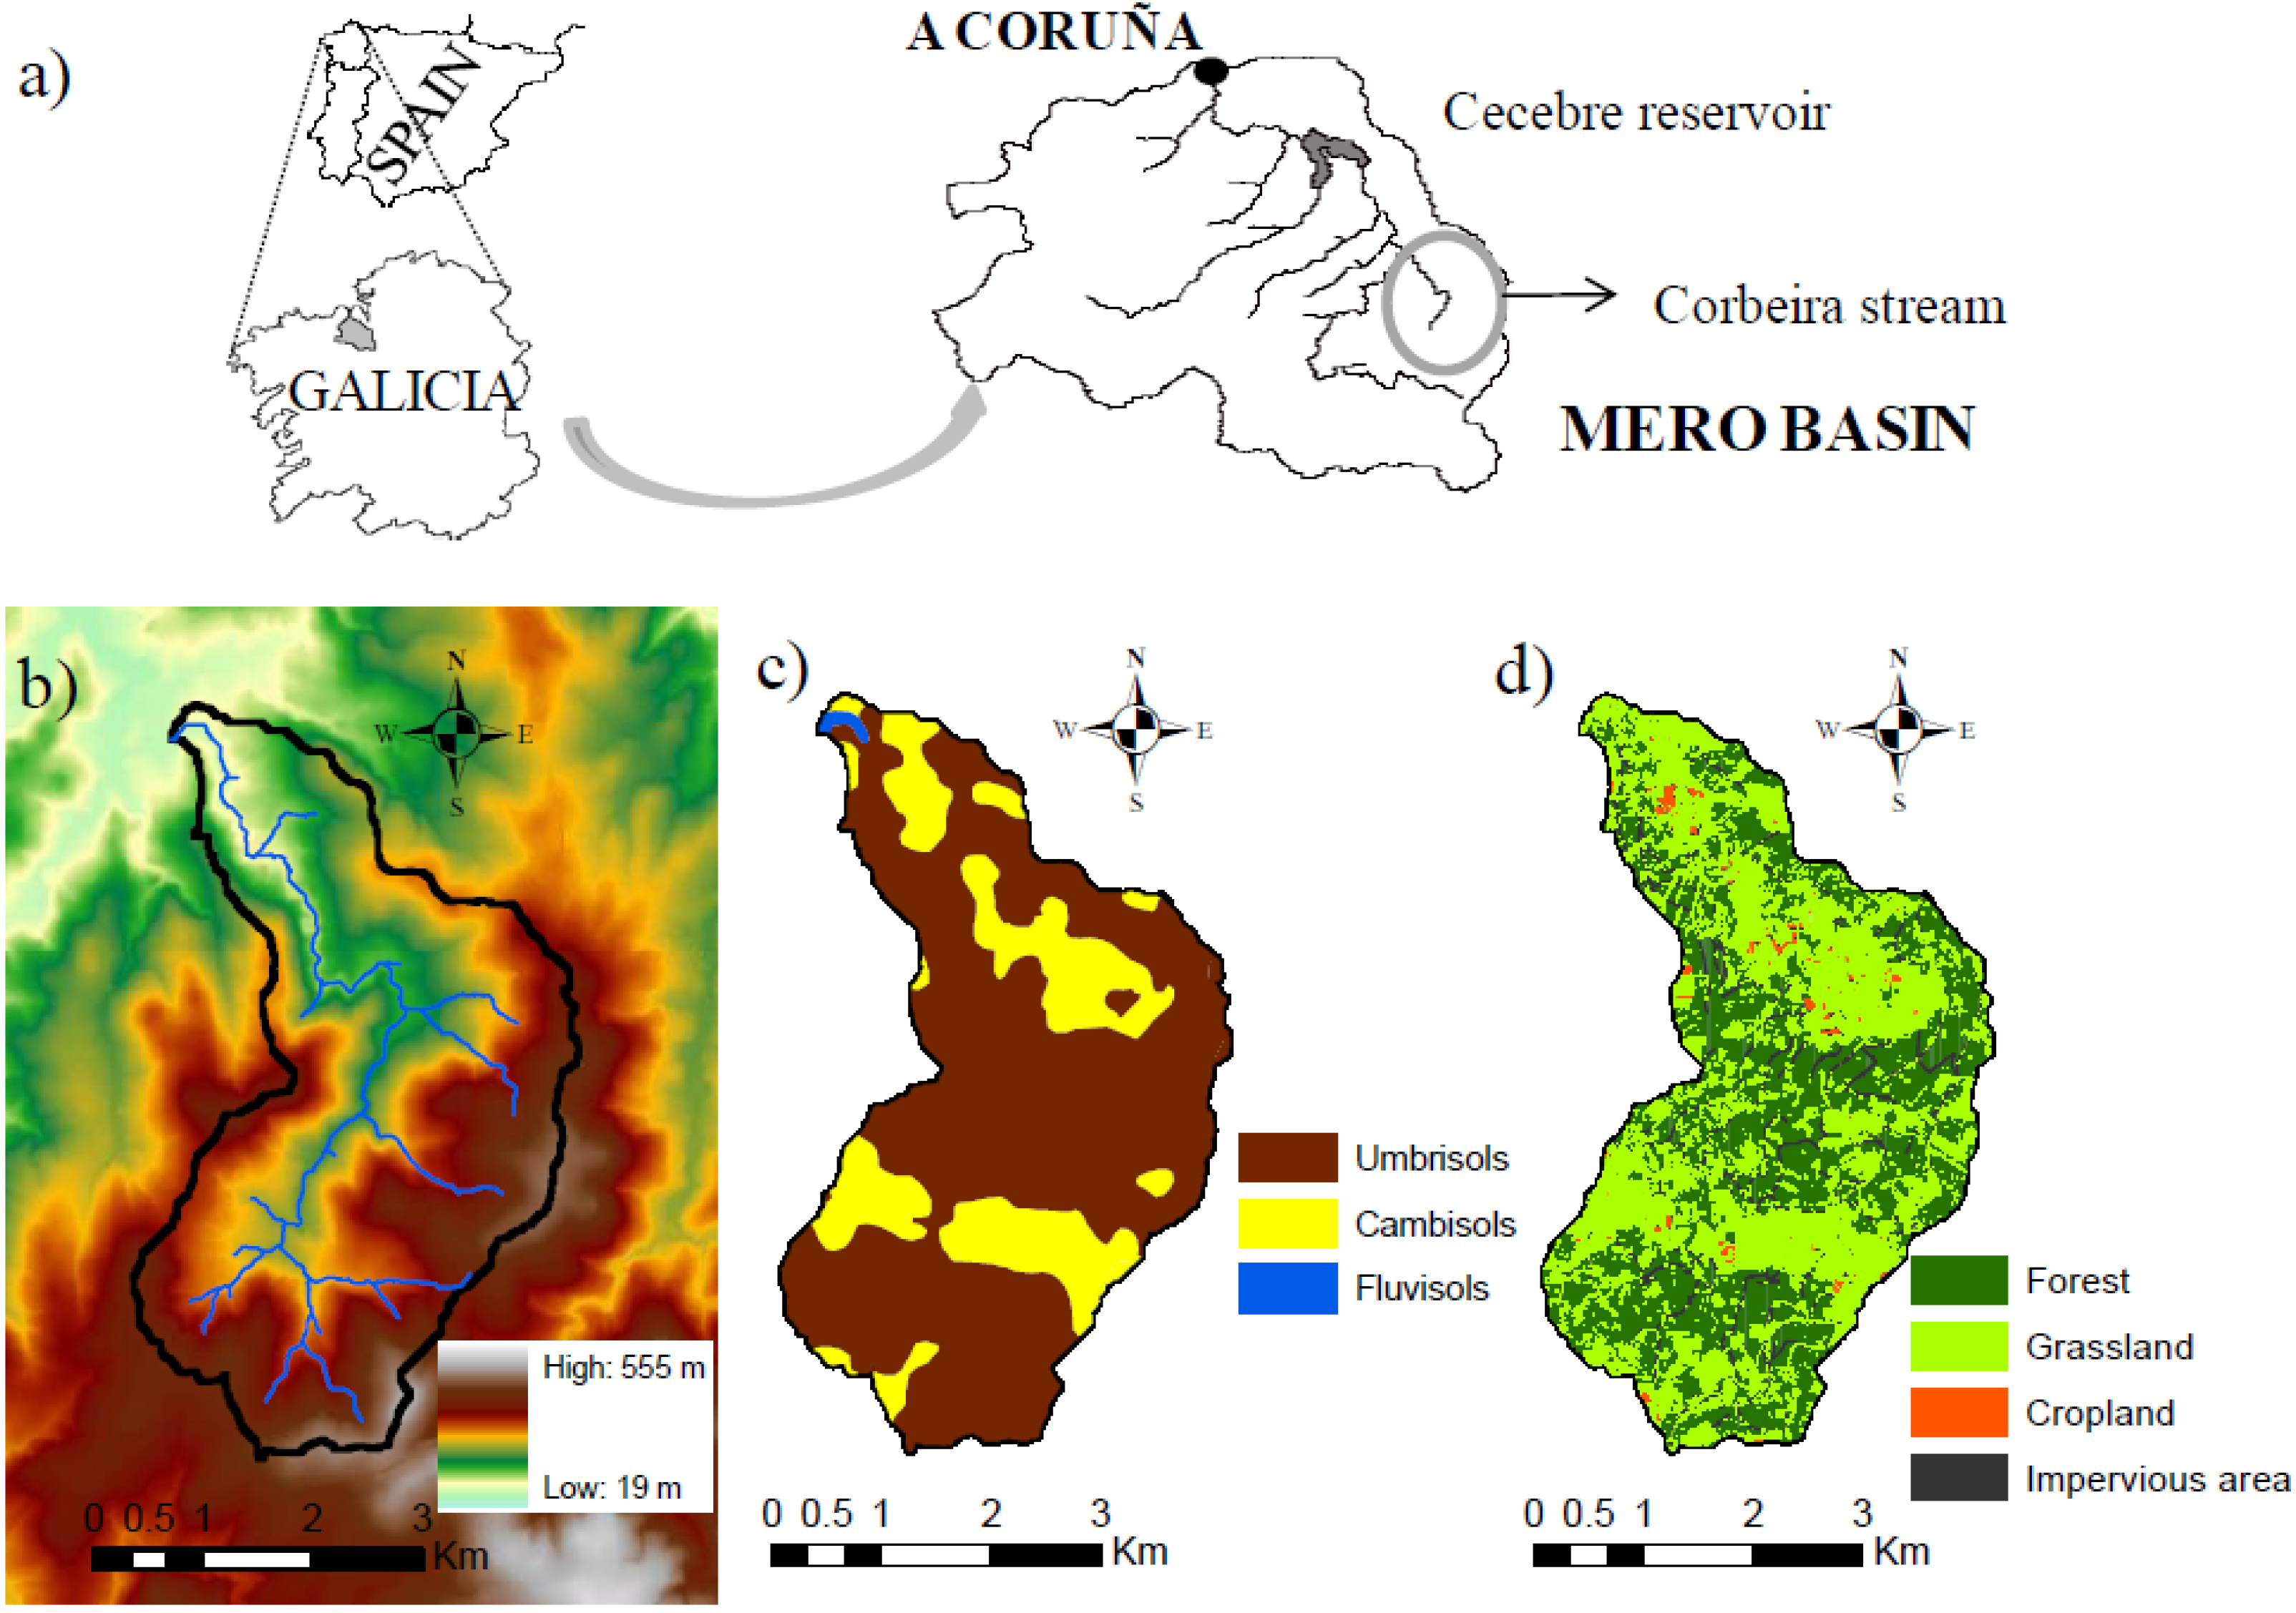
2.1. Description of the Study Area

The study site for this research is the Corbeira catchment, a headwater catchment of the Mero River Basin, the most important water source for the city of A Coruña, NW Spain (Figure 1a). This catchment has an area of 16 km2. The altitude ranges from 60 to 474 m (Figure 1b). The slopes are generally steep, with a mean value of 19%. The most common soils (Figure 1c) are Umbrisol and Cambisols [18] with silt and silt-loam texture settled on basic schists of the “Órdenes Complex” [19].
The dominant land uses in this catchment are forestry (65%) and agriculture (30%) (Figure 1d). The forest area mainly consists of commercial eucalyptus plantations, whereas the agriculture area is a patchwork of croplands (4% of total area), growing maize and winter cereal mostly interspersed with grassland (26% of total area). Impervious built-up areas and roads cover about 5% of the whole catchment area and are mainly distributed in the agriculture zone.
The climate is temperate humid, with a mean annual temperature of 13 °C and approximately 1050 mm mean annual rainfall (1983–2009), of which more than 67% falls from October to March.
Figure 1. (a) Location of the study area; (b) Digital elevation map; (c) Soil types map; (d) Land use map.
Water 06 03049 g001

2.2. Data and Model Setup

2.2.1. The SWAT Hydrological Model

The SWAT model (Soil and Water Assessment Tool) is a process-based and spatially semi-distributed model developed by Agricultural Research Service of the United States Department of Agriculture (USDA) to assess the impact of agricultural management practices on water, sediment and chemical yields in large complex catchments [20], but it is also able to predict water, sediment and nutrient fluxes under different climate change scenarios [8,13,16]. SWAT is a basin-scale, continuous time model operating on a daily step, but it is not designed to simulate detailed, single-event flood routing [21]. The model was selected because it is a dynamic simulation model able to simulate streamflow response to climate change, it is in the public domain, and the generation of input files is eased by GIS-based tools. Although it is frequently applied to medium and large catchments with reasonably good results, it has also been calibrated for small forest catchments with good results [7,22], i.e., with semi-natural land use. So, the SWAT model can be applied for hydrologic simulation in small catchments under different climatic conditions.
In SWAT, the watershed is divided into sub-basins, which are further separated into hydrological response units (HRUs), i.e., areas with a specific combination of soil type, land use and management. Most of the calculations are done at HRU scale and the results integrated at sub-basin scale. SWAT model simulations are divided into two parts: (i) the land phase and (ii) the routing through the river network. The land phase controls the amount of water, sediment and nutrients reaching the main channel, while the second phase defines the movement of water and other elements through the channel to the catchment outlet. The underlying theory detailing transport processes included in the model is available in the SWAT documentation [21].
The simulation of the hydrological cycle is based on the water balance, which is carried out taking into account precipitation, evapotranspiration, surface, lateral and base flow and deep aquifer recharge. The evapotranspiration can be calculated using one of these three methods: Penman-Monteith, Hargreaves and Priestley-Taylor. The Pemman-Monteith method was selected in this case because it uses more physical parameters (daily maximum and minimum temperature, wind speed, humidity and solar radiation). In addition, the Penman-Monteith option in SWAT incorporates the effects of increased CO2 concentration on plant growth and evapotranspiration. The effect of CO2 concentration change on plant stomatal conductance is computed by SWAT model using the equation developed by Easterling et al. [23], in which increased CO2 concentrations lead to decreased leaf conductance (doubled CO2 concentration leads to general decrease of stomatal conductance by 40%) which in turn results in a decrease in the potential evapotranspiration calculation. The change in radiation use efficiency of plants is simulated as a function of CO2 concentration using the method developed by Stockle et al. [24]. Surface flow is estimated using a modification of the Soil Conservation Service Curve Number (SCC CN) method; the lateral flow is calculated based on the kinematic storage model, and the peak runoff rate is estimated by a modified rational method (the peak runoff rate is a function of the fraction of daily rainfall falling in the time of concentration for the sub-basin, the daily surface runoff volume, the sub-basin area and the time of concentration for the sub-basin). The water reaching the river network is then routed to the downstream sub-basin of the catchment. Water is routed through the channel using either the variable storage routing method or the Muskingum river routing method, both of which are variations of the kinematic wave model. In this research, the Muskingum method was used.

2.2.2. Model Inputs

The model required an extensive dataset of meteorological data, topography, soil types and land use and management practices. The meteorological data were acquired from the Galicia Meteorological Service (MeteoGalicia), selecting the closest station to the study area (coordinates: 560019 UTMX-29T ED-50, 4788103 UTMY-29T ED-50). The data included daily rainfall, maximum and minimum temperatures, relative humidity, solar radiation and wind speed. The SWAT model includes the weather generator (WXGEN) model to generate climatic data or to fill in gaps in the measured records. To implement this weather generator, SWAT requires long-term monthly statistical information (e.g., mean and standard deviation) for rainfall, maximum and minimum temperature, dew point temperature, solar radiation, and wind speed. Due to the reduced length of the data series of wind speed, relative humidity and solar radiation, for which consistent 30-year time series are not available, SWAT weather generator used in this study was generated on the basis of the climatic data from a meteorological station (1387E) belonging to the Spanish Meteorological Agency (AEMET) located at about 20 km from the study area whose data keep good correspondence with climatic data acquired from the station of MeteoGalicia (R2 of 0.82, 0.94, 0.91, 0.72, 0.76 and 0.83 for rainfall, maximum temperature, minimum temperature, wind velocity, solar radiation and relative humidity, respectively). The digital elevation map (DEM) was created from the digital level curves (5 m) provided by the Territorial Information System of Galicia and used to provide elevation details for the SWAT and to delineate catchment boundaries. HRUs were delineated from (i) soil maps (1: 50,000) published by the Environment Department of the Xunta de Galicia, based on the FAO classification [18]; (ii) land use map was obtained from the digital processing (using ER Mapper software) of satellite images Landsat (resolution of 25 m) and aerial photographs (flight from summer 2004, with a resolution of 1 m), provided by the Territorial Information System of Galicia (Xunta of Galicia), and their subsequent field validation, which allowed distinguishing 4 classes of land uses (cropland, grassland, forest and impervious areas); and (iii) three classes of slopes (0%–13%; 13%–25%; >25%). Thresholds of 3% for land use and 20% for soil type were used to limit the number of HRUs in the catchment. This resulted in 12 HRUs. Only one sub-basin was defined in the Corbeira catchment.
The input data of physical soil properties were obtained from experimental works conducted in the catchment, whereas hydrological characterization of soils was built from literature data [25,26] or by estimating the parameters from data of texture and organic matter using pedo-transference functions [27,28].
The characteristics of the grasslands and croplands (maize) were taken from the SWAT database (SWAT plant codes used to represent grasslands and maize land covers were meadow bromegrass and corn, respectively), while eucalyptus characteristics, not included in the SWAT database, were derived from literature [11,29]. Information on agricultural management, such as dates for planting (maize: 1–10 May) and harvesting (grassland: May, August, November; maize: 20–30 September), was compiled from notes recorded during field research after interviewing farmers. Irrigation is rarely carried out in the catchment; hence, it was not modelled.

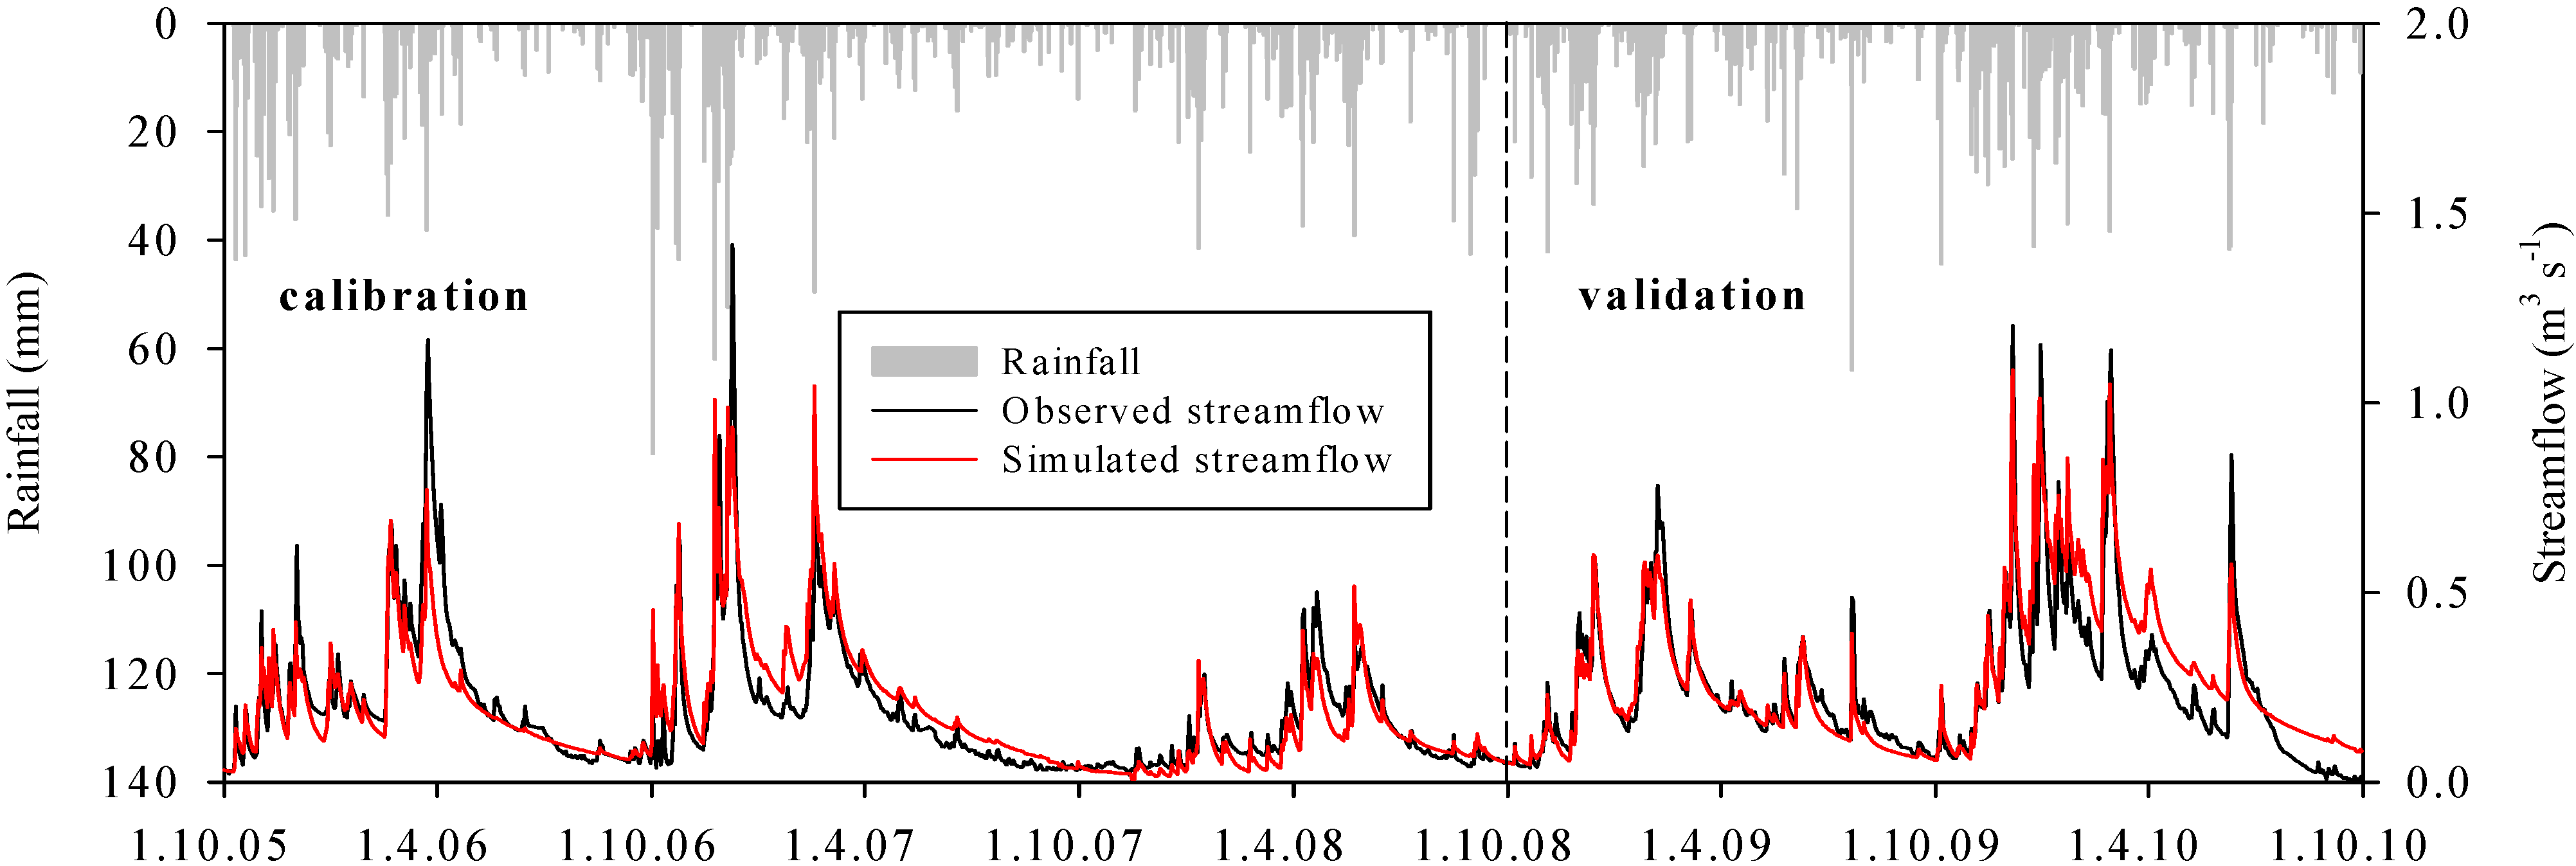
2.2.3. Calibration, Validation and Evaluation of the Model

The SWAT model was calibrated using daily stream discharge data measured at the Corbeira catchment outlet. Streamflow was separated into two components (baseflow and direct runoff) using a digital filter [30]. The model was set up from March 2001 to October 2010; the first 3 years were treated as the warm-up period for the model. The period from October 2005 to September 2008 was used for calibration and the period from October 2008 to September 2010 for validation.
The most sensitive model parameters were chosen in the calibration procedure based on preliminary sensitivity analysis using the Latin Hypercube One-factor-At-a-Time approach provided in the SWAT sensitivity analysis interface and SWAT model documentation [21]. The performance of the model presented in Table 1 shows that the simulations generated good results in comparison with observed streamflow data according to the evaluation criteria set by Motovilov et al. [31] and Moriasi et al. [32], who consider that model performance is satisfactory when the regression coefficient (R2) is higher than 0.75 and Nash-Sutcliffe efficiency (NSE) is higher than 0.5, and if percentage of bias (PBIAS) is between −25% and +25%. Furthermore, the statistical values for the validation period slightly exceeded those of the calibration period, indicating a low over-parameterization. These differences can be due to the different hydrological conditions of the years used in the study, since hydrological models generally reproduce better normal than extreme hydrological conditions and, in our case, the calibration period comprises more extreme conditions than the validation period.
Table 1. Calibration and validation statistics for daily streamflow. R2: regression coefficient; PBIAS: percentage of bias; NSE: Nash-Sutcliffe efficiency.
ParameterCalibrationValidation
R20.800.84
PBIAS−1.8−3.3
NSE0.800.83
Observed mean and range (m3 s−1)0.18 (0.02–1.42)0.24 (0.02–1.20)
The model successfully reproduces the measured streamflow and its trend over time (Figure 2). However, there are some cases in which the model does not agree well with measured streamflow, since it underestimates some peak flows during high-flow periods, e.g., in late March 2006 and in middle December 2006, both coinciding with a flood period. This could be attributed to the inability to simulate the soil moisture conditions during heavy rainfall periods. Curve Number only defines three antecedent moisture conditions: I-dry (wilting point), II-mean moisture, and III-wet (field capacity), and for each of them it assumes a unique relationship between rainfall and runoff, despite one same condition comprises different soil moisture contents. However, in this catchment, the relationship between rainfall and runoff increases as the antecedent soil moisture content rises, and consequently, the hydrological behaviour differs depending on the amount of water stored in the soil [33,34]. It could also be because the method used for simulation of runoff in SWAT (Curve Number) does not account for saturation near-stream zones and is not sensitive to rainfall intensity, so given a same amount of rainfall, SWAT computes the same amount of runoff regardless of intensity and duration of rainfall. The model also overestimates some peak discharge during some rainfall events (e.g., October 2006). This effect has been attributed to different causes, such as the short warm-up period of the model, the underestimation of evapotranspiration and overestimation of soil water content [35].
Figure 2. Rainfall, observed and predicted daily streamflow during the calibration (October 2005–Septmber 2008) and validation period (October 2008–September 2010).
Water 06 03049 g002
The above results indicate that SWAT is a suitable model to estimate streamflow in the study area; therefore, the calibrated model was used to assess the response of streamflow to future climate change. Several studies have highlighted the degree of uncertainty associated with the evaluation of climate change impacts on hydrology, pointing out that model calibration with present data may result in a bias when applying the model in the future [36,37]. The fact that the model adequately estimates the streamflow either during wet (July 2006) or dry years (August 2007) is a good indicator of its suitability for evaluating the impact of climate change; therefore, it can be used to assess the effects of climate change on streamflow with a reasonable degree of confidence. Anyway, it is appropriate to interpret the effects of climate change in terms of trends, not specific situations.

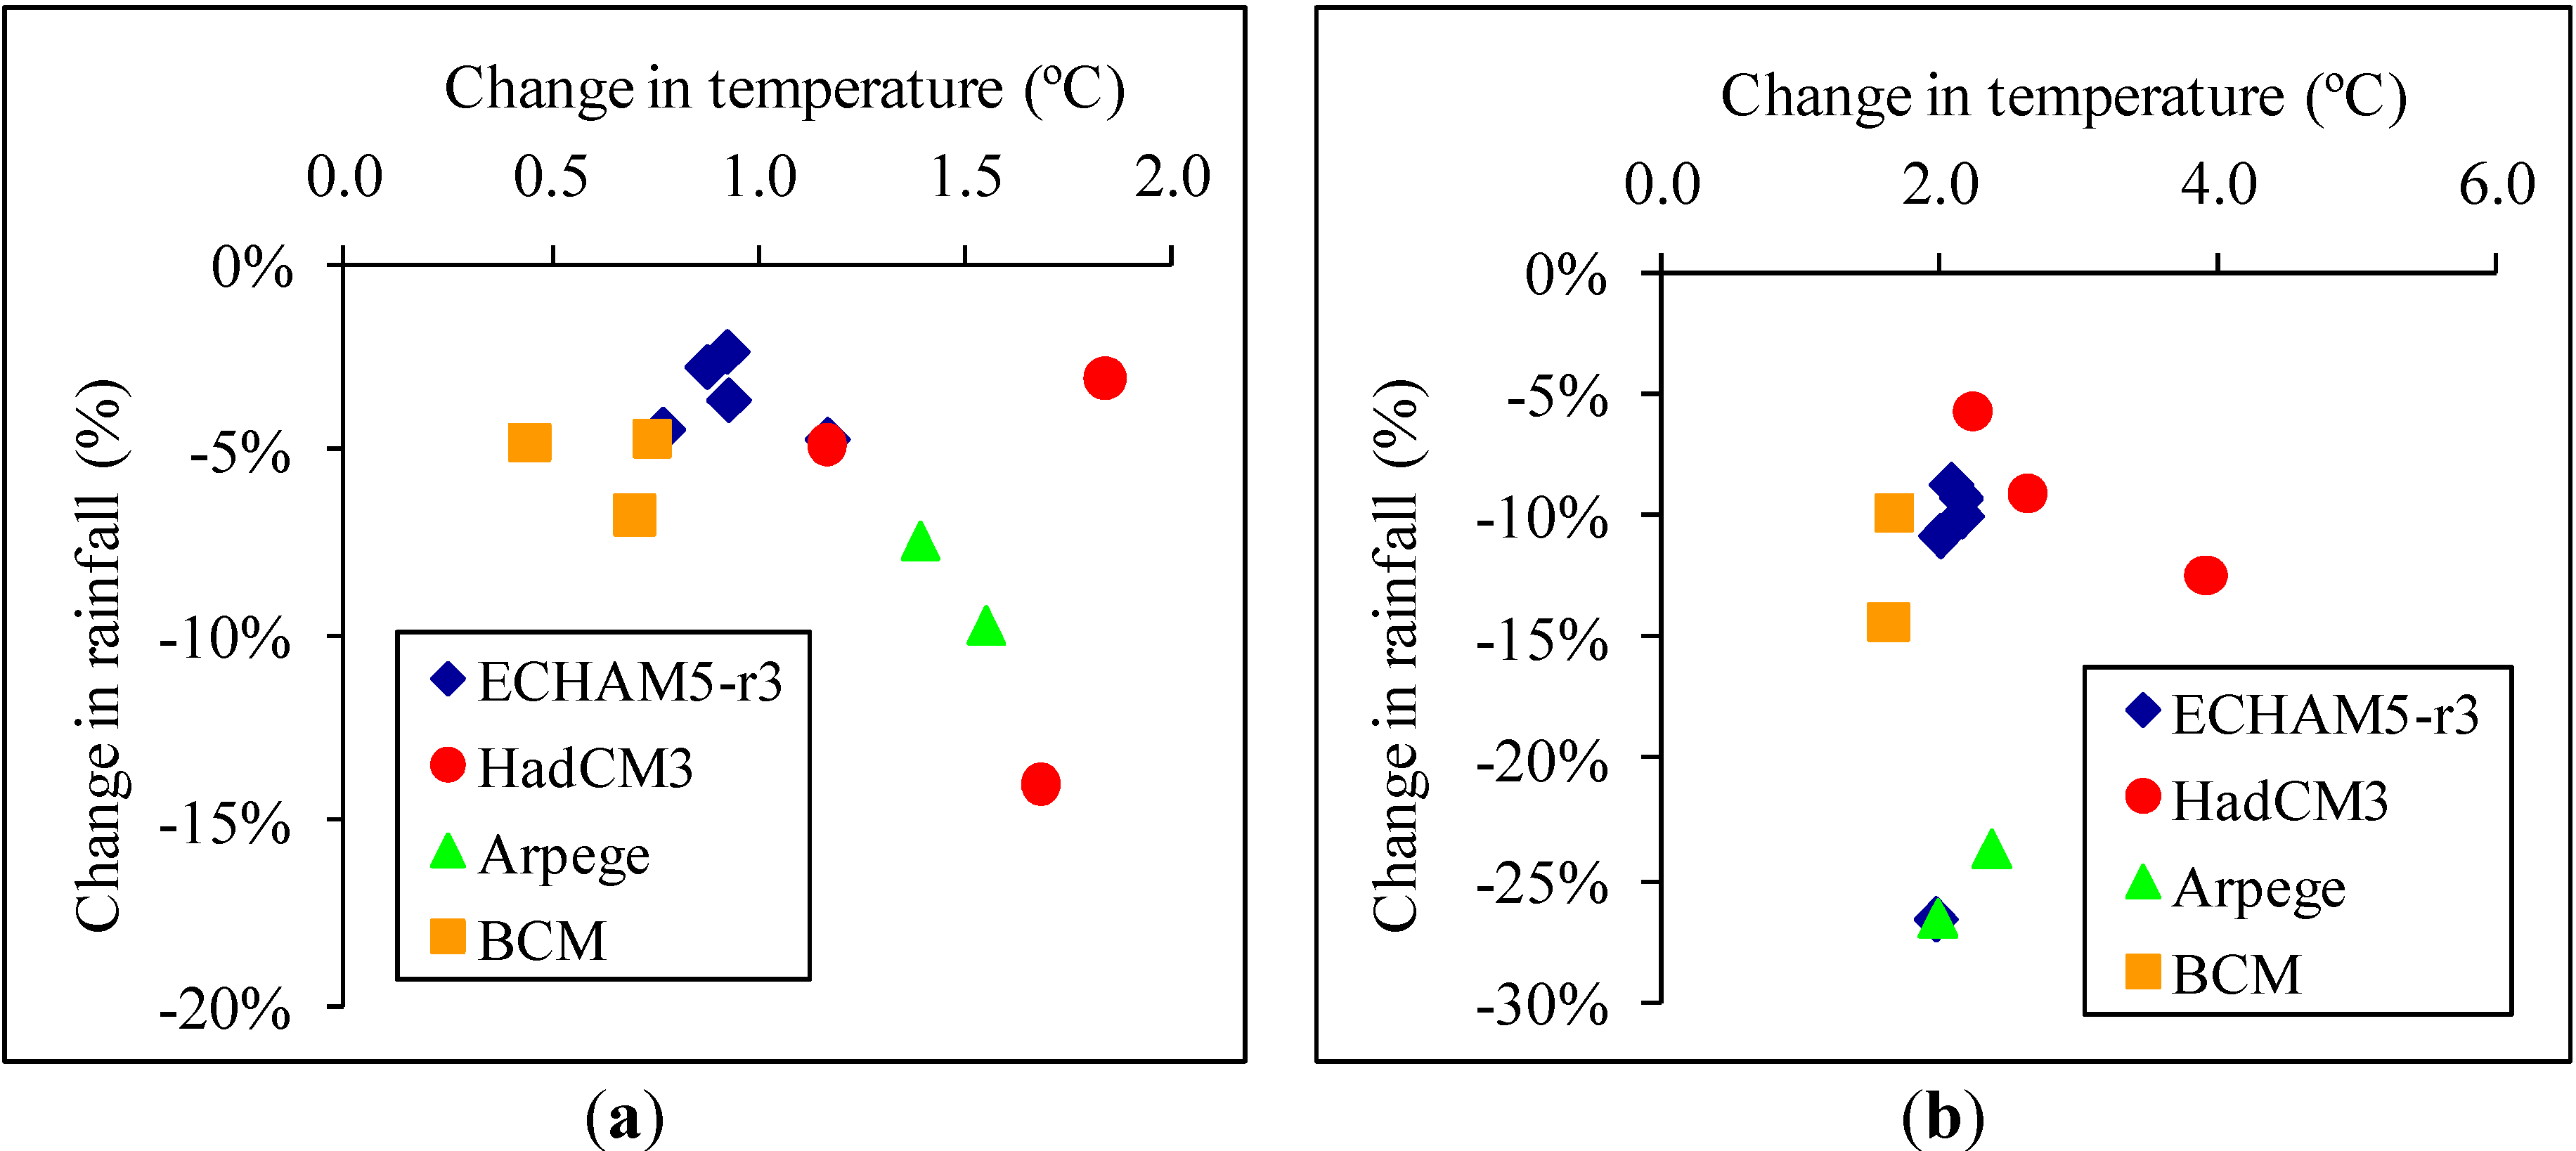
2.3. Scenarios of Temperature, Rainfall and CO2 Concentration Changes

In this study, the analysis of climate change impact on water resources has been focused on predicting the potential effects that changes in temperature, rainfall and CO2 concentration will cause on streamflow. For this purpose, two simulation sets were performed. The first evaluates the effect caused in streamflow by changes in each of the variables, i.e., temperature, rainfall or CO2 concentration. The second analyses the response of streamflow to simultaneous changes in the three variables.
At present, various methods are used for generating future climate scenarios. These methods include downscaling, change factor method, etc. A common procedure to downscale monthly temperature and precipitation of global climate model (GCM) projections to daily time series is stochastic downscaling using a weather generator [38]. Stochastic weather generators can be modified to generate future daily values of climate variables by adjusting historical weather patterns based on predicted future alterations from GCMs or RCMs [39]. In this study, the weather generator included in SWAT [21] was used to create 30-year climate series with changes in input variables. WXGEN uses a first-order Markov chain model to define the day as dry or wet. The daily rainfall amount is estimated based on a skewed or exponential distribution. Daily maximum and minimum temperatures, solar radiation and relative humidity are then generated based on the presence or absence of rain for the day [40]. WXGEN stochastic weather generator is widely used for climate change studies [11,41,42].
To accomplish the analysis of climate change impact on water resources the following steps were performed:
- Once calibrated the SWAT to represent the control conditions (control scenario), the model was run using climate series produced by the weather generator for reference period 1981-2010. Then, the degree of correspondence between simulated streamflow using the stochastic weather generator and simulated streamflow using observed meteorological data were verified, all with the purpose of checking the performance of the SWAT model using a stochastic weather generator to estimate streamflow in the study area. The results of statistical indicators (r2 = 0.86 and NSE = 0.76), interpreted according to the criteria proposed by Motovilov et al. [31] and Moriasi et al. [32], suggest that model performance is satisfactory, indicating that the SWAT weather generator model can be used with a reasonable degree of confidence to analyze climate change scenarios.
- Subsequently, the different climate scenarios were created from the information provided by regional models of the ENSEMBLES project, using the change factors to modify the values of the parameters of the weather generator in a monthly-specific manner.
- Finally, the results for the control scenario were compared with the results of the climate change scenarios in order to quantify the changes on water resources.
The data for the reference period (1981–2001) were obtained from the 1387E meteorological station (AEMET). The different scenarios selected for this study are based on the information provided by the regional models of the ENSEMBLES project [2] for this station (Table 2), for the periods 2031–2060 (intermediate future) and 2069–2098 (distant future). Specifically, the selected scenarios for temperature and rainfall represent the mean and maximum forecasts of the ENSEMBLES project models (socio-economic A1B scenario) for these variables in the study area. These change factors were used to modify the rainfall and temperature parameters of the weather generator. Other climate variables, such as wind speed, solar radiation, relative humidity and dew point were assumed to be constant throughout future simulation periods. Climate modifications are given as a percentage change in rainfall (rainfall is multiplied by a given factor). Change factors for rainfall were used to alter the frequency and intensity of rainfall. This modification was performed by adjusting the probability of a rainy day followed by another rainy day in the month, and the probability of a rainy day followed by a dry day. These probabilities were obtained by multiplying the baseline probabilities by fifty percent of change factor for rainfall [adjusted probability = baseline probability + (baseline probability × 1/2 of change factor for rainfall)]. Temperature modifications were applied by adding the prescribed change to the weather generator temperature parameters derived from baseline data.
Table 2. Summary of characteristics of the selected RCMs of the ENSEMBLES project.
NameInstituteGCMRCMTime Period
C4IRCA3C4I (1)HadCM3Q16RCA31951–2099
CNRM/RM5.1CNRM (2)ARPEGE RM5.1Aladin1950–2100
DMI/ARPEGEDMI (3)ARPEGEHIRHAM1951–2100
DMI/BCM DMIDMI (3)BCMDMI-HIRHAM51961–2098
DMI/ECHAM5-r3DMI (3)ECHAM5-r3DMI-HIRHAM51951–2099
ETHZ/CLMETHZ (4)HadCM3Q0CLM1951–2099
ICTP/RegCM3ICTP (5)ECHAM5-r3RegCM31951–2100
KNMI/RACMO2KNMI (6)ECHAM5-r3RACMO1950–2100
MPIM/REMOMPI (7)ECHAM5-r3REMO1951–2100
SMHI/BCMSMHI (8)BCMRCA1961–2100
SMHI/ECHAM5-r3SMHI (8)ECHAM5-r3RCA1951–2100
SMHI/HadCM3Q3SMHI (8)HadCM3Q3RCA1951–2100
Notes: GCM: global climate models; RCM: regional climate models; (1) Rossby Centre, Swedish Meteorological and Hydrological Institute; (2) National Center of Meteorological. Research, France; (3) Danish Meteorological Institute; (4) Swiss Federal Institute of Technology Zürich; (5) Abdus Salam International Centre for Theoretical Physics, Italy; (6) Royal Netherlands Meteorological Institute; (7) Max Planck Institute for Meteorology, Germany; (8) Swedish Meteorological and Hydrological Institute.
Projected changes in temperature and rainfall in the study area are presented in Figure 3 for the two-time periods (2031–2060 and 2069–2098). All projections show an increase in annual mean temperature and a decrease in rainfall for the two periods, although there is a wide variability among projections, indicating highly uncertain results. The projected temperature changes vary from 0.4–1.8 °C in 2031–2060 to 1.6–3.9 °C in 2069–2098, depending on the climate models. With regard to rainfall, the projections indicate a decrease between 2%–14% in 2031–2060 and 6%–27% in 2069–2098. The mean values of all the projections used predict that temperature will rise by 1.1 °C during 2031–2060 and by 2.2 °C in 2069–2098, while rainfall will decrease by 6% and 27% at the mid and end of the 21st century. CO2 scenarios change by an increase of 1.5 and 2 times the current CO2 concentration (330 ppm). It is thought that the selected CO2 concentrations (550 and 660 ppm) give a reasonable representation of future CO2 conditions for the middle and end of the 21st century under the A1B scenario [3]. Table 3 shows all climate change scenarios used in the SWAT simulations. All climate change scenarios were run for a 30-year period. Land use/land cover was assumed to remain unchanged throughout the simulation.
Figure 3. Climate change scenarios for annual mean temperature and rainfall for: (a) 2031–2060 and (b) 2069–2098 (ENSEMBLES project).
Water 06 03049 g003
Table 3. Climate change scenarios used for SWAT simulations.
ScenarioTemperature (°C)Rainfall (%)CO2 Concentration (ppm)
11.1 (mean 2031–2060)0330
21.7 (maximum 2031–2060)0330
32.2 (mean 2069–2098)0330
43.9 (maximum 2069–2098)0330
50−6 (mean 2031–2060)330
60−14 (maximum 2031–2060)330
70−15 (mean 2069–2098)330
80−27 (maximum 2069–2098)330
900550
1000660
111.1−6550
121.7−14550
132.2−15660
143.9−27660
151.1−6330
162.2−15330
Note: 0: means no change in the variable.
T-tests were performed to assess if the streamflow estimated from the climate change scenarios and the reference scenario are statistically different from each other. The significance of statistical test was set at p < 0.01.

3. Results and Discussion

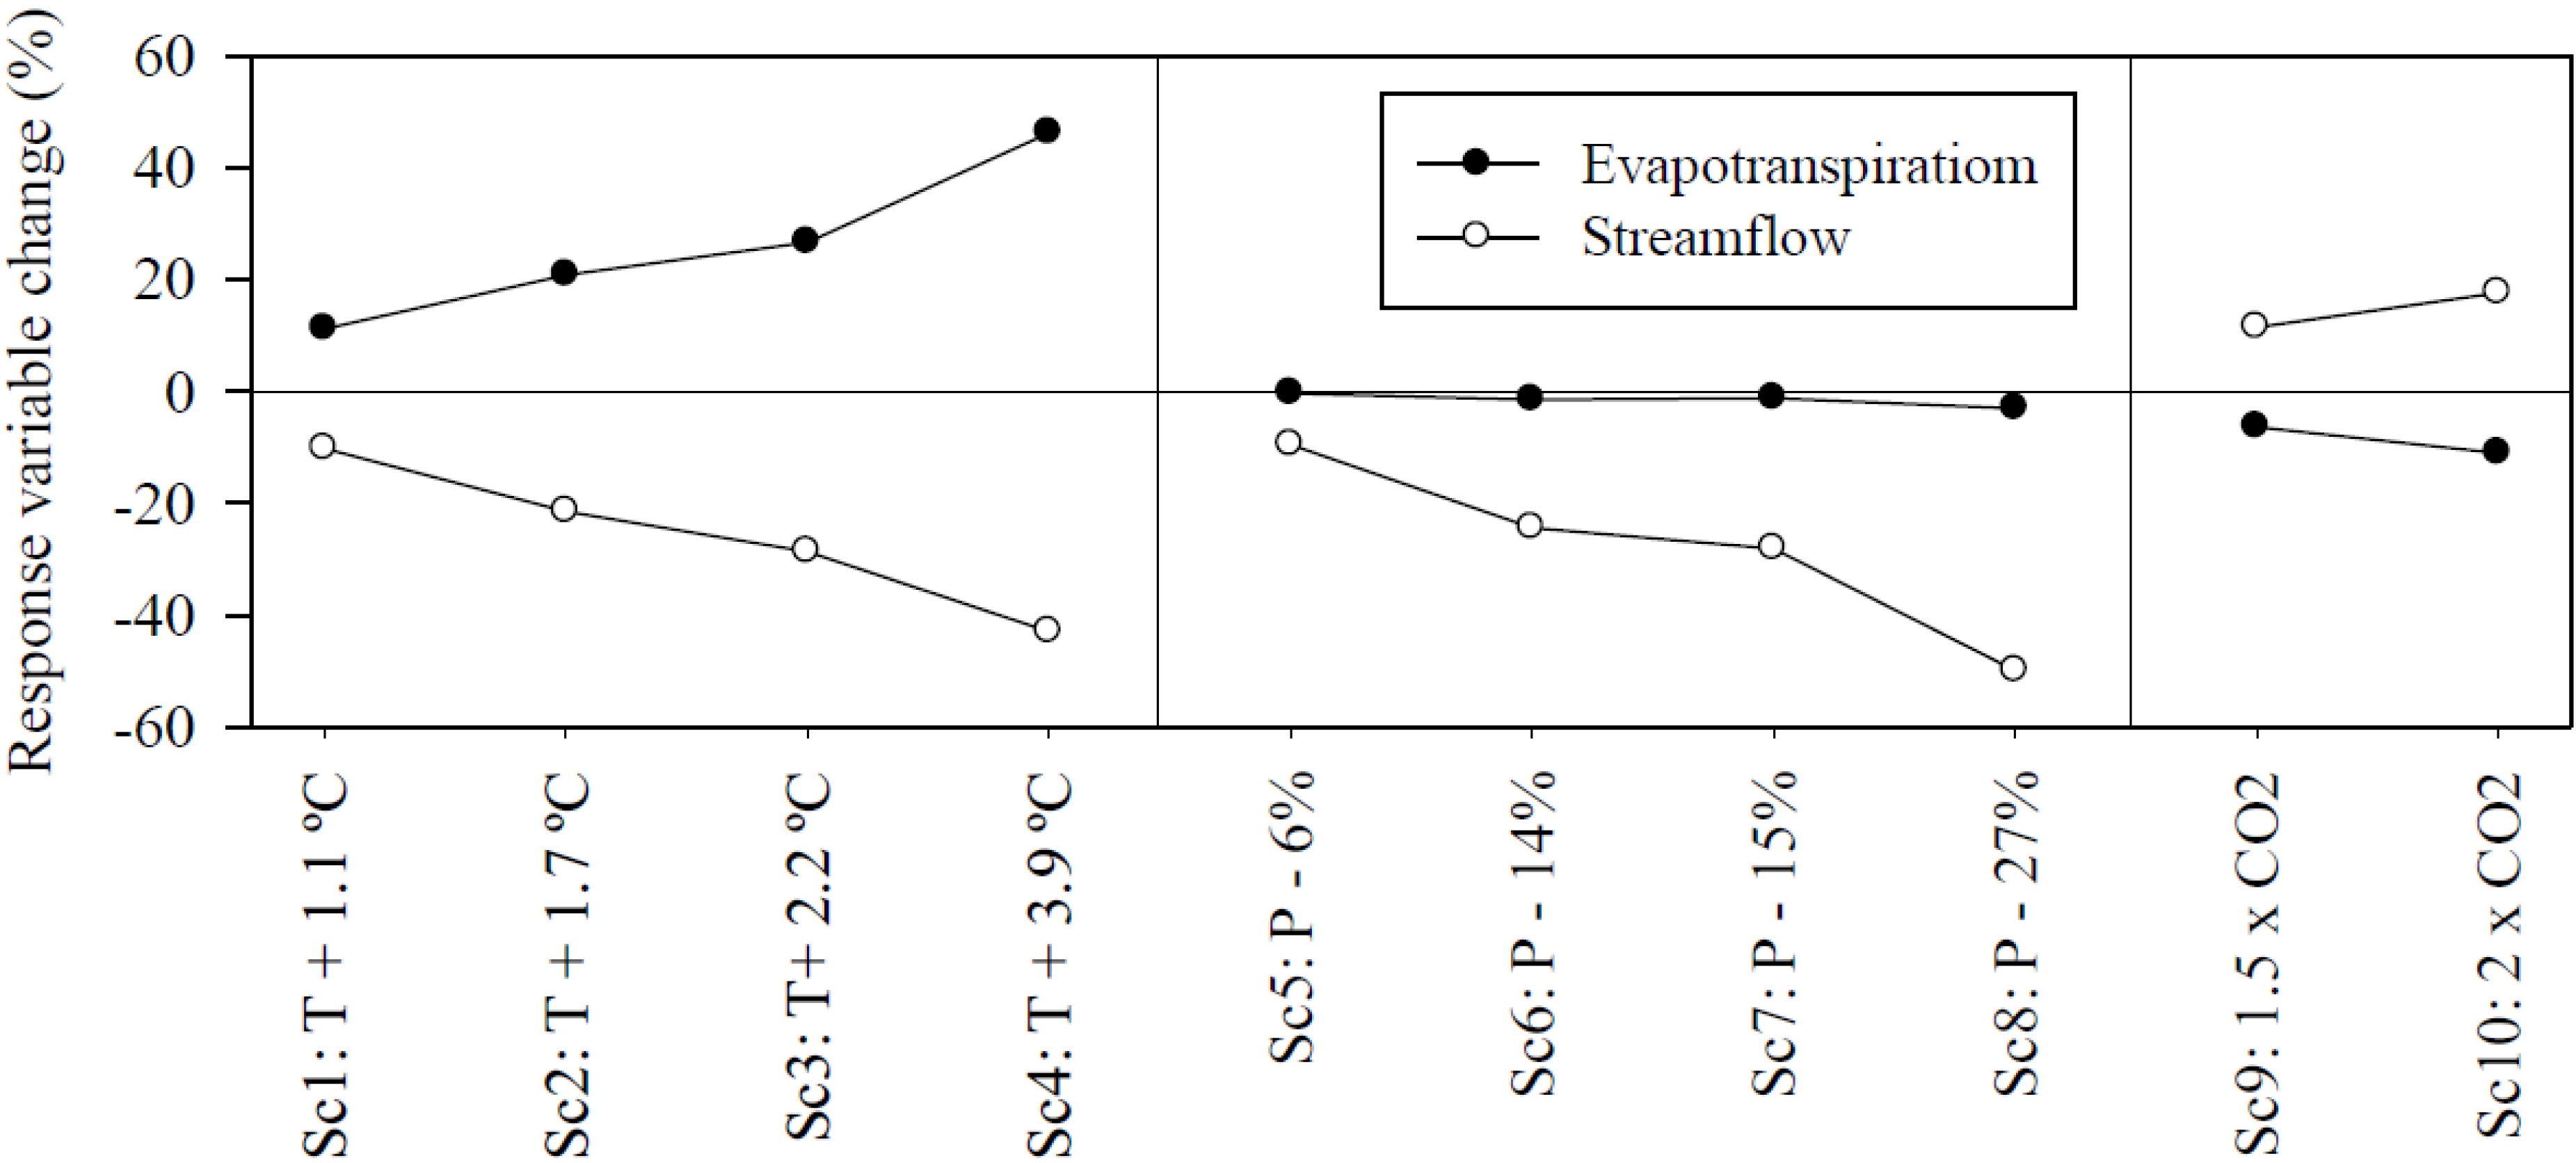
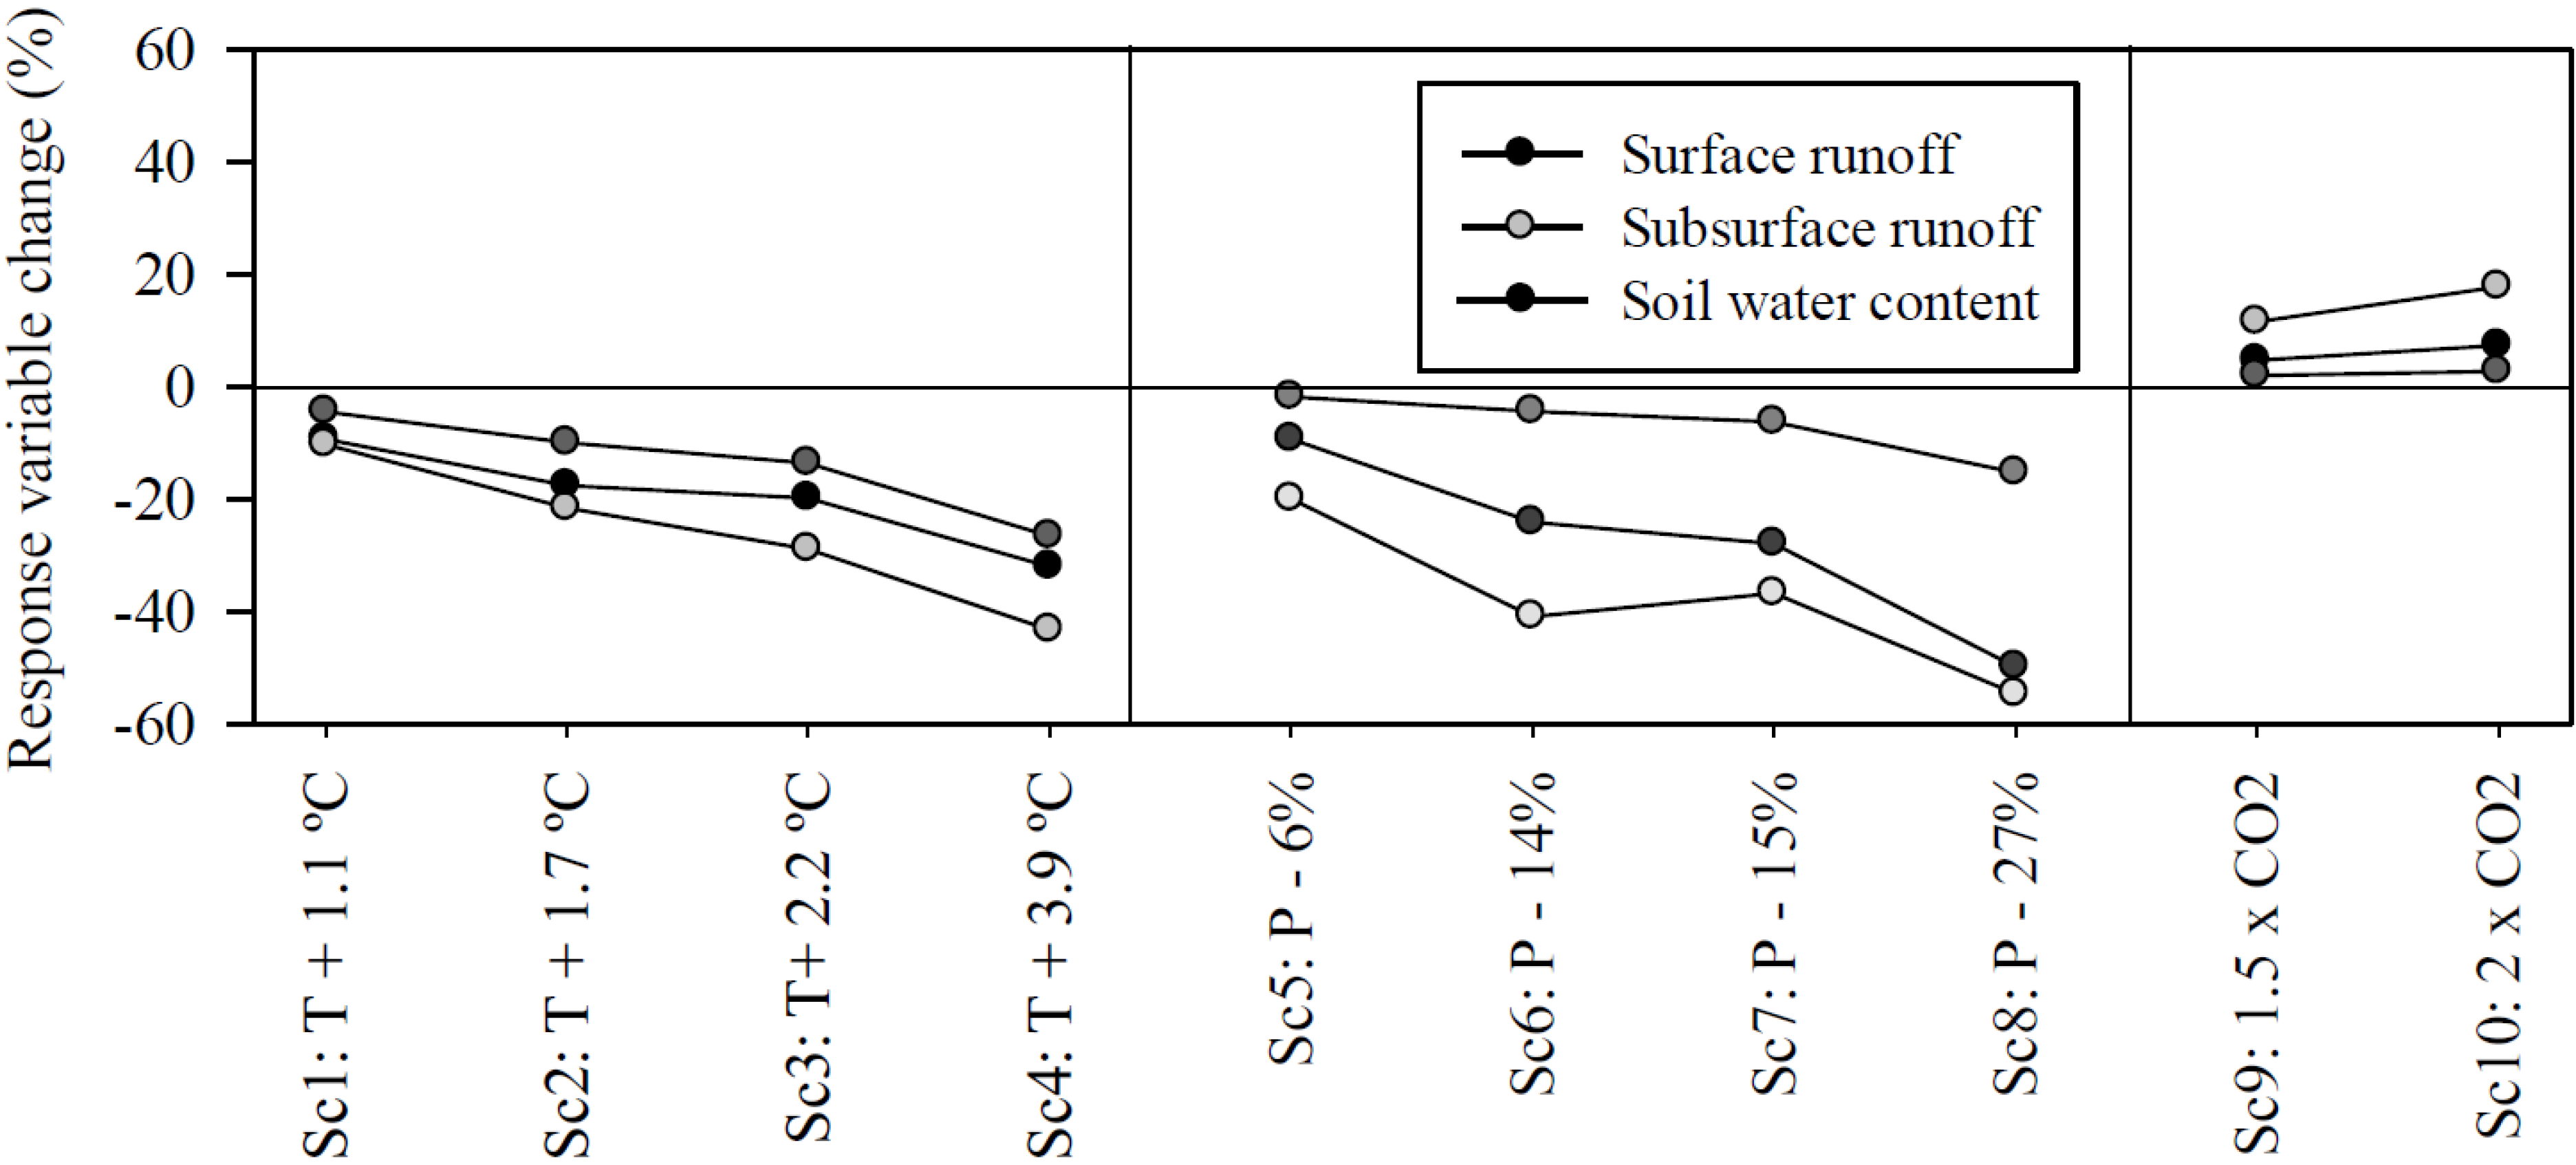
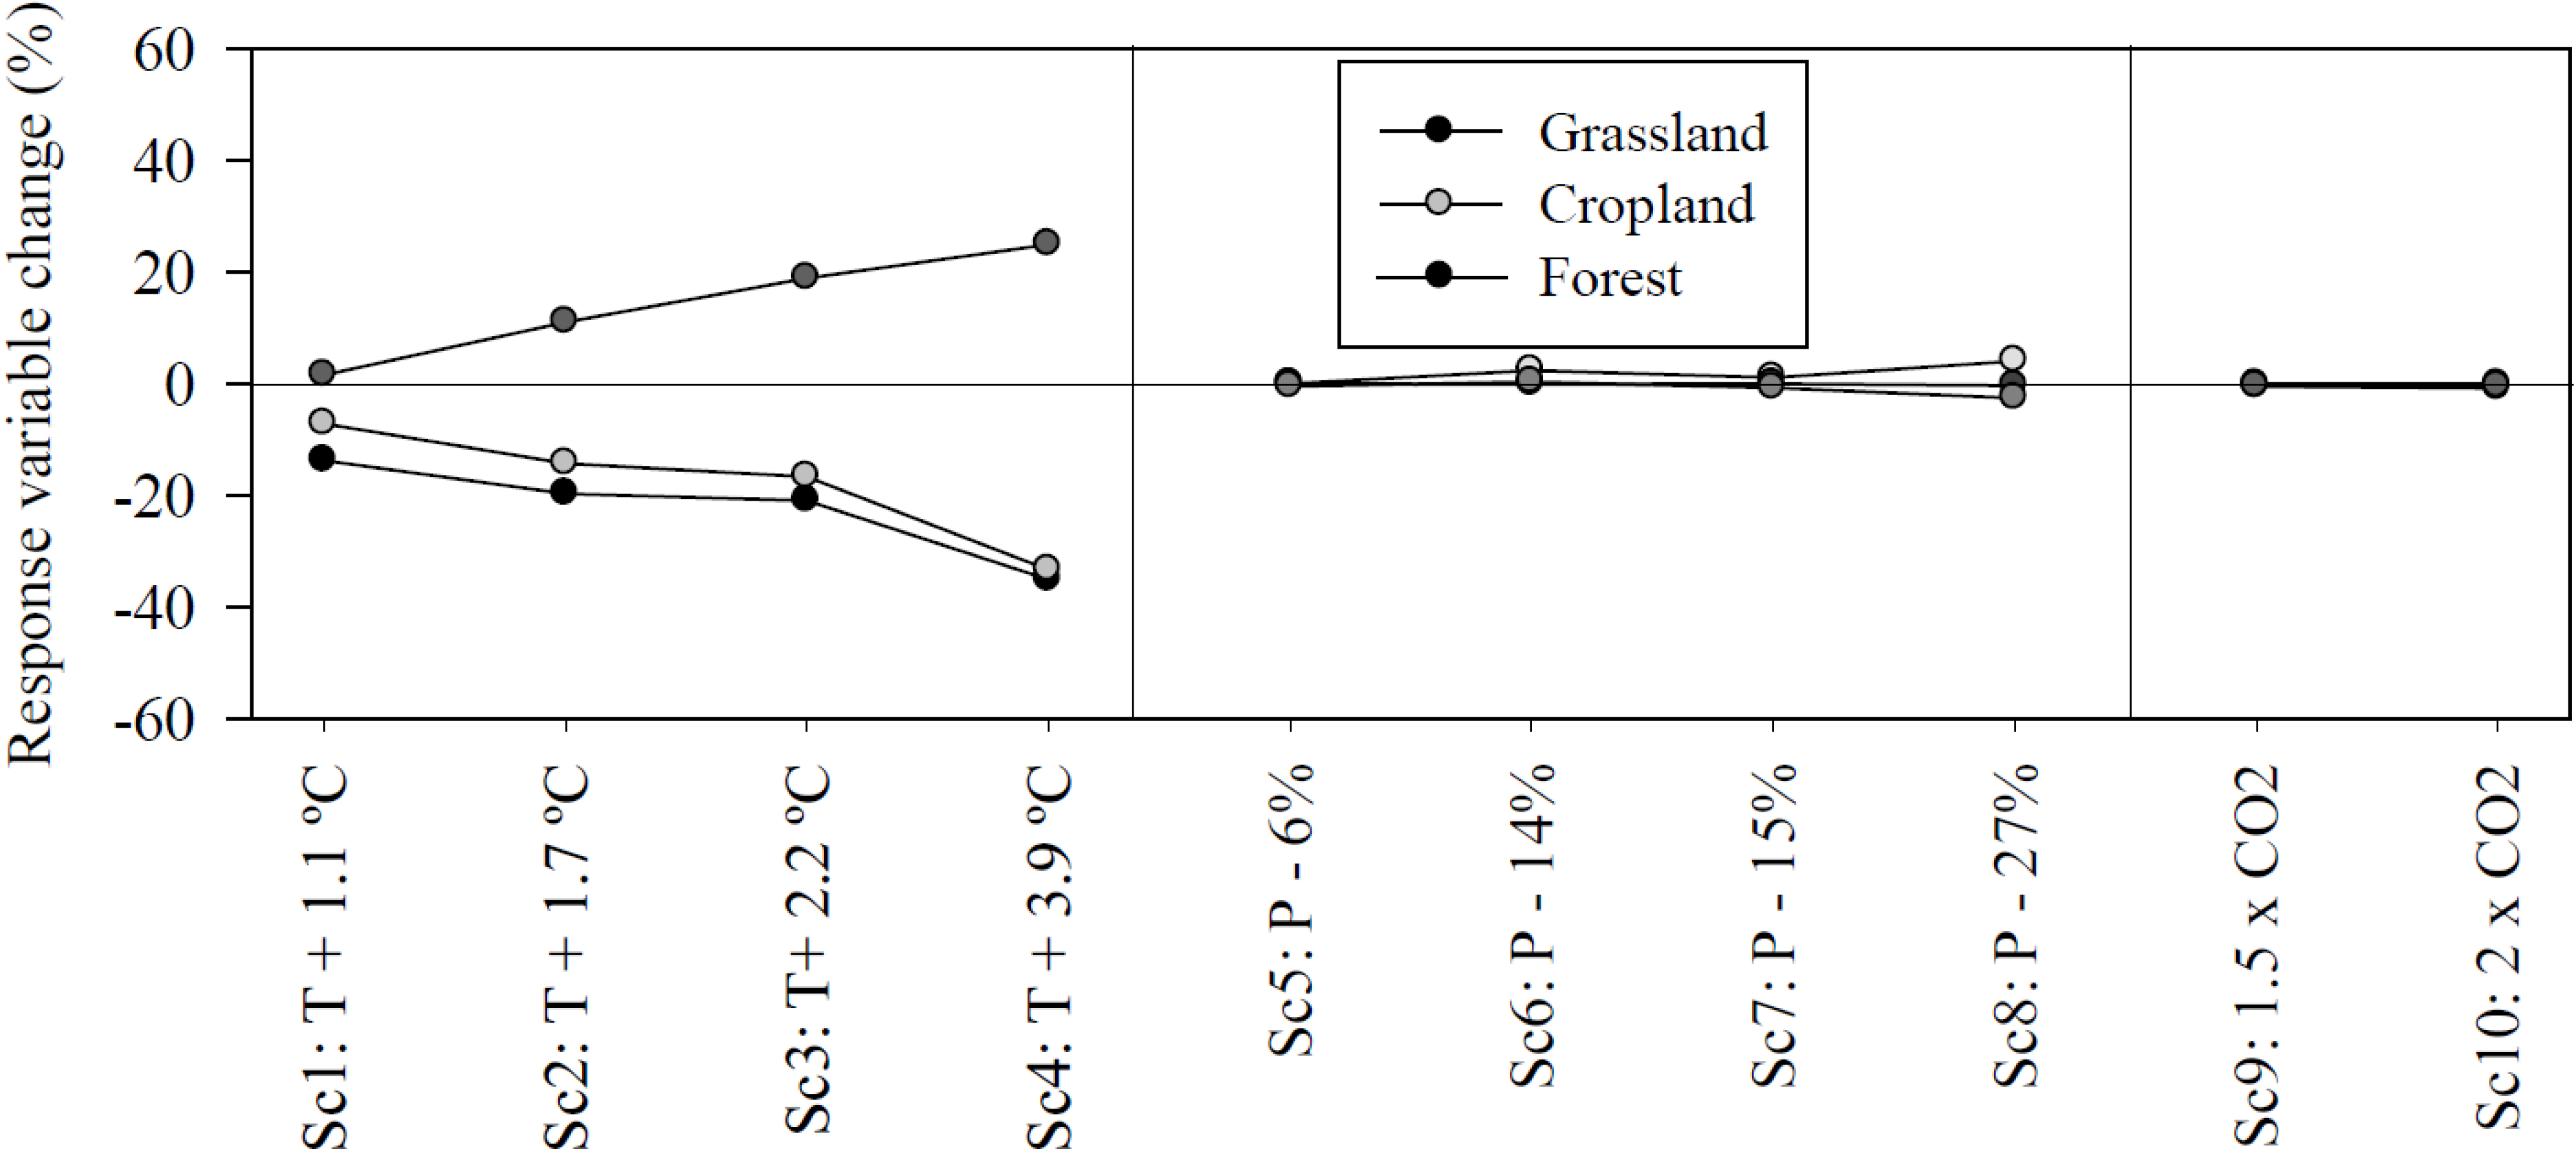
3.1. Vulnerability of Streamflow to Change in Temperature, Rainfall or CO2 Concentration

Figure 4 shows the responses of evapotranspiration and streamflow to climate parameter changes. Streamflow will be significantly altered as a result of changes in temperature, rainfall or CO2 concentration. Streamflow significantly (p < 0.01) decreased with the increase in temperature (a larger amount of water is lost through evapotranspiration) and lower rainfall. In both cases, the impact was more pronounced in the period 2069–2098, which showed strong deviation of the climate variables compared to the current conditions (Table 2).
Increasing temperature by 1.1 and 2.2 °C (scenarios 1 and 3) decreased streamflow rates by 13% and 29%, respectively; while 6% and 15% drops in rainfall (scenarios 5 and 7) resulted in a streamflow decrease of 9% and 25%. These results suggest that streamflow in the Corbeira catchment will be more sensitive to the average increase in temperature than to the average decrease in rainfall, highlighting the role of evapotranspiration in the water cycle. However, when compared with the worst case scenarios (scenario 4: Tª + 3.9 °C, scenario 8: P − 27%), streamflow is more sensitive to a reduction in rainfall (Figure 4), which is in accordance with earlier findings in the literature that underline the major role played by rainfall on streamflow changes [5].
Figure 4. Response of evapotranspiration and streamflow to changes in temperature, rainfall and CO2 concentration based on the scenarios defined in Table 3.
Water 06 03049 g004
Increase in temperature led to increase in biomass production in some cases and decrease in others, depending on the crop type [6]. This behaviour depends on the temperature reached regarding the optimum, minimum and maximum temperatures associated with plant growth, because temperature is one of the most important factors governing plant growth. For the Corbeira catchment, forest biomass production (forest: 65% of the study area) increased with increasing temperature; however, in grassland and crops, biomass production decreased with temperature increases (Figure 5). This could explain the increase in evapotranspiration (2031–2060: 14%, 21%; 2069–2098: 27%, 46%) and consequently the decrease of streamflow with temperature rise (Figure 4). At present, the main limitations for eucalyptus cultivation in Galicia, the main forest specie in the Corbeira catchment, are low temperatures and frost. The temperature rise and consequent decreased risk of frost increase forest productivity, especially in spring. In summer, the biomass growth rate is lower than in other seasons, which may be associated with water or nutrient limitations. However, the model, under these scenarios, estimated only a slight increase in the number of days with water stress.
Figure 5. Response of vegetation biomass to changes in temperature, rainfall and CO2 concentration based on the scenarios defined in Table 3.
Water 06 03049 g005
Flow components are affected differently by changes in temperature and rainfall (Figure 6). Thus, a temperature increase had greater impact on subsurface flow (groundwater + lateral flow) because of soil water loss by evapotranspiration, while rainfall decrease had a greater impact on surface runoff. This explains a higher sensitivity of soil water content to temperature changes (Figure 6). These results differ from those of Nunes et al. [11] for the Guadiana Basin (southwest Iberian Peninsula) where subsurface flow was mostly affected by reduced rainfall due to the extremely shallow soils in the basin. The soils of the Corbeira catchment, however, are deep and favour the diversion of soil water to evapotranspiration, hence temperature increases mainly affect the subsurface flow.
The streamflow decrease is more significant than that of rainfall (Figure 4 and Figure 6), showing it is not a linear process. It is estimated that for every 1% decrease in rainfall, streamflow falls by approximately 1.5%. These results are close to those obtained by Pruski and Nearing [43], who analysed the effect of rainfall changes on agricultural slopes in different regions of the United States, using the WEPP model. These authors predicted a fall in runoff of 1.97% for every 1% decrease in rainfall. Similarly, Nunes et al. [11] reported a fall in runoff of 1.9% and 2.1% for the Guadiana and Tejo basins, respectively.
Figure 6. Response of different flow components and soil water content to changes in temperature, rainfall and CO2 concentration based on the scenarios defined in Table 3.
Water 06 03049 g006
Increasing CO2 concentration in the atmosphere led to increases in streamflow (10%–15%, Figure 4). The rise in CO2 concentration could increase vegetation biomass production and evapotranspiration [44]. However, in this study no effect on the vegetation biomass was observed (Figure 5), although a decrease was found in the evapotranspiration (2 × CO2: −11% evapotranspiration, Figure 4), resulting in higher soil water content and, in turn, higher streamflow (Figure 4). This reduction in the evapotranspiration could be related to stomatal closure of plant leaves in response to increasing CO2 concentration, as in SWAT a doubled CO2 concentration leads to a 40% reduction in leaf conductance for all plant species. According to the stomatal conductance optimization hypothesis, the plant stomas are simultaneously maximizing the carbon gain rate while minimizing the rate of water loss [45], i.e., as adaptation mechanism, plants tend to reduce stomatal conductance and suppress transpiration under a high concentration of CO2. This would lead to greater water-use efficiency by plants (ratios of CO2 molecules fixed by the plant in relation to the number of water molecules lost by transpiration) allowing a larger amount of water to be available for runoff and recharge.
Moreover, higher CO2 concentrations can enhance the photosynthesis rate and consequently the vegetation biomass, although it was not observed in this study (Figure 5). This effect, known as the CO2 fertilization effect, leads to a higher leaf area index (LAI) in the vegetation, which can reduce the radiation reaching the soil surface, thereby reducing soil evaporation, and increasing the streamflow. However, Bunce [46] in a review work concludes that an increase in CO2 concentrations rarely leads to higher LAI, unless ventilation is artificial, such as it occurs in chambers and greenhouses. In addition, the author indicates that LAI increases above 3–4 m2 m−2 have a minimal effect on evapotranspiration as a result of shade and higher canopy humidity. This conclusion is based on studies of crops in which nutrients are not a limiting factor and, therefore, an even lower response can be expected in natural ecosystems, because nutrients frequently limit plant productivity, thus their responsiveness to CO2 concentrations.

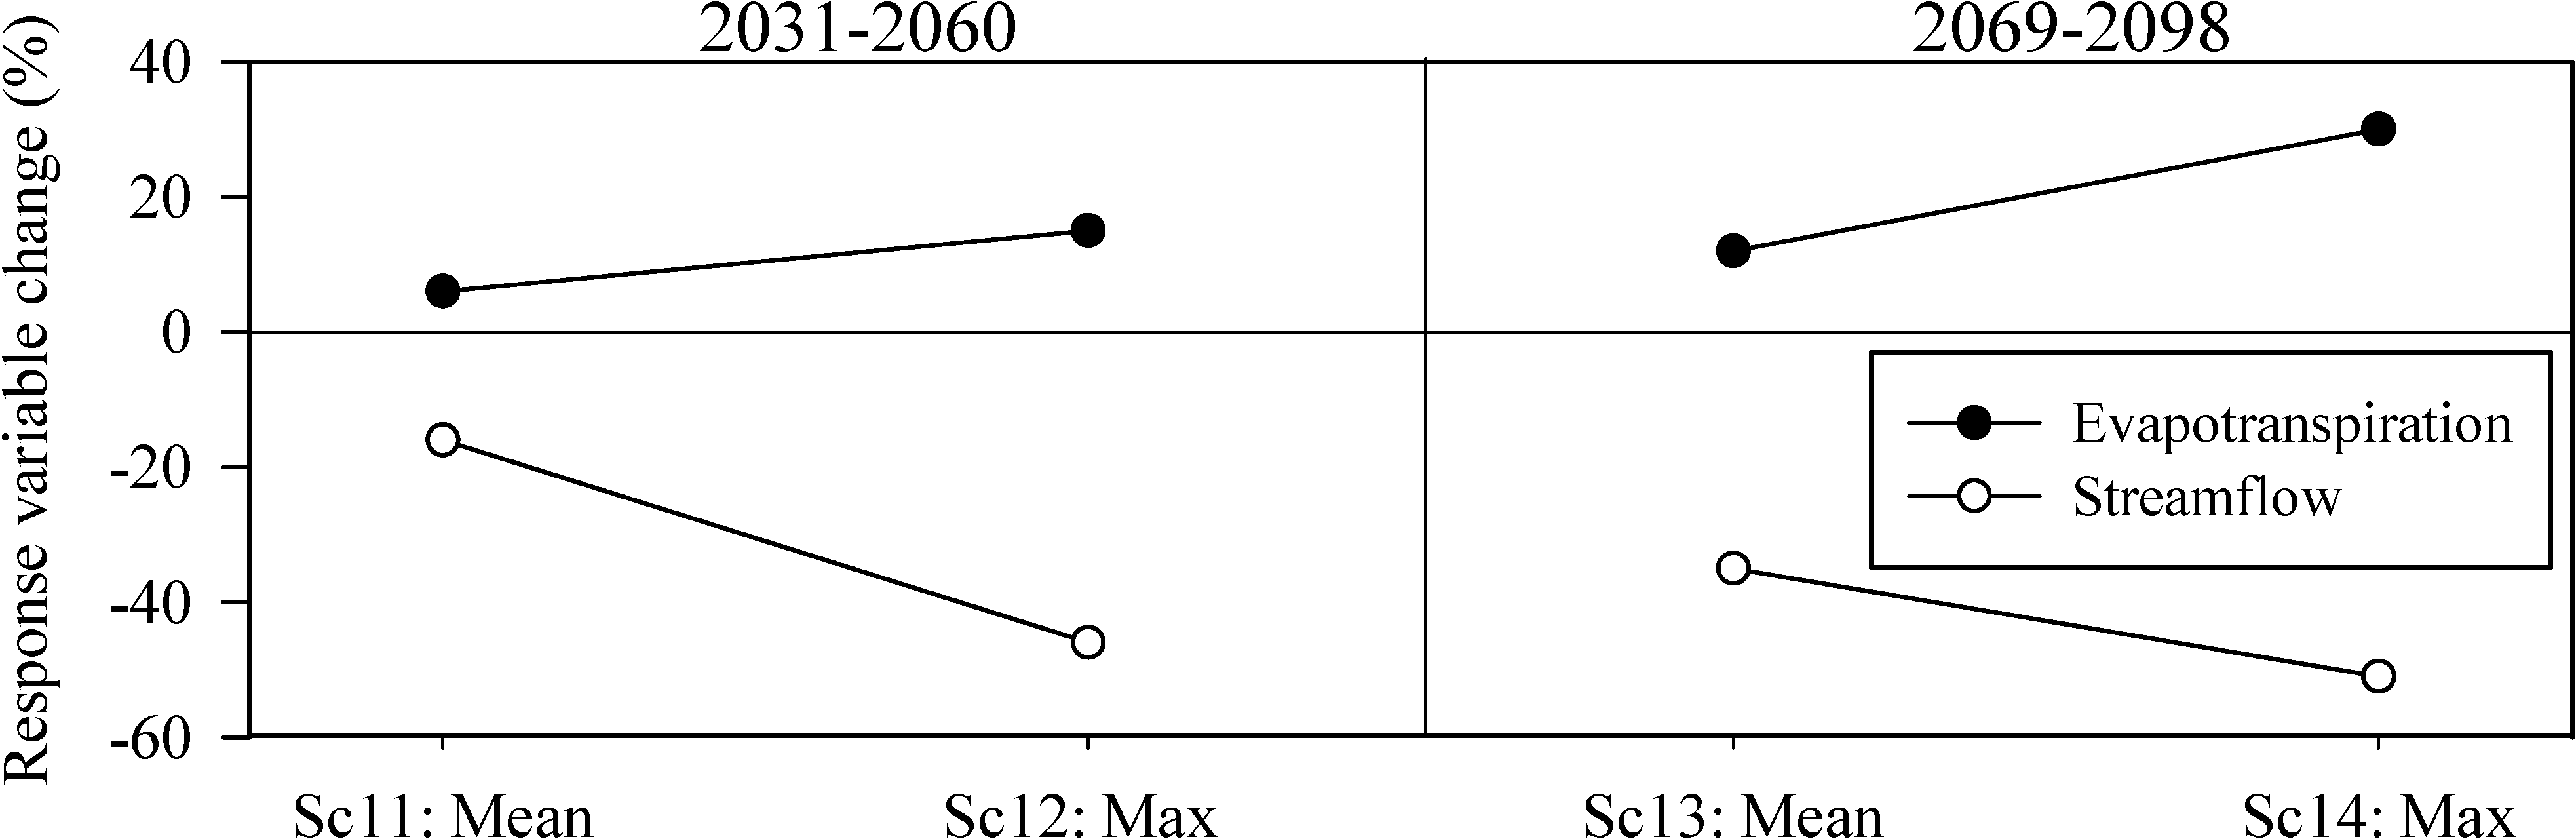
3.2. Vulnerability of Streamflow to Simultaneous Changes in Climate Parameters

Figure 7 shows the response of evapotranspiration and streamflow to combined simultaneous changes in temperature, rainfall and CO2 concentration. In comparison with the results obtained when changing climate parameters singly (temperature or rainfall or CO2 concentration), coupled climate parameter changes had a synergistic effect on streamflow, causing an increase in the vulnerability to change. For scenarios 11 and 13 (mean values), a streamflow decrease of 16% and 35% for the periods 2031–2060 and 2069–2098, respectively is forecasted. For scenarios 12 and 14 (maximum values, unlikely) decreases of 46% and 51% for the same horizons are predicted. Although these results are indicative and should be taken as trend indicators, they show the high vulnerability of the Corbeira stream to climate change, even though climatic variations are relatively low (Table 3). This is consistent with most of the studies on the impact of climate change carried out in the Iberian Peninsula, which have predicted a decline in water resources [7,11,12]. The expected decrease in streamflow in the Corbeira catchment is higher than that estimated for other catchments in NW Spain [12,13], reflecting a greater vulnerability of small catchments to changes in climatic variables, as noted by Beguería et al. [47] in other regions of Spain. However, these results should be interpreted with caution. Although the trend seems to be clear, the change percent will vary according to the climate change scenarios considered and the catchment characteristics.
Figure 7. Response of evapotranspiration and streamflow to simultaneous changes in temperature, rainfall and CO2 concentration based on the scenarios defined in Table 3.
Water 06 03049 g007
It is generally recognized that the positive effects exerted by an increase in CO2 concentration on water-plant relationships would be offset by a greater evaporative demand at higher temperatures. Numerous studies indicate that changes in temperature and rainfall alter and, in many cases, limit the effects of CO2 on plants [11,13]. For example, high temperatures during the flowering period could mitigate the effects of high CO2 concentration, since they could limit the number, size and grain quality [48]. In order to confirm the effect of a CO2 increase on streamflow, the model was run using two new scenarios, Sc15, Sc16, (Table 3) with the same rainfall and temperature changes as scenarios 11 and 13, respectively; but with no changes in CO2 concentration, and both results (with and without increased CO2) were compared. Not taking into account the effects of CO2 on plants, there was a decrease in streamflow of 24% (2031–2060, Sc15) and 46% (2069–2098, Sc16) compared to 16% (2031–2060, Sc11) and 35% (2069–2098, Sc13) respectively when enhanced plant photosynthetic water use efficiency (greater stomatal efficiency of plants in response to increased CO2 concentration) was considered, as for evapotranspiration calculation SWAT takes into account variation of radiation-use efficiency, plant growth, and plant transpiration due to changes in atmospheric CO2 concentrations. Given the importance exerted by an increase of CO2 concentration on water resources, this parameter should be considered in any assessment of climate change impact. However, it should be noted that the effects of CO2 on streamflow might be overestimated, because the SWAT does not assume that leaf area increases with CO2 concentrations.

4. Conclusions

This work demonstrated the high vulnerability of streamflow to changes in temperature and rainfall in the Corbeira catchment. Furthermore, it was found that an increase in the concentration of CO2 in the atmosphere could slightly attenuate the effects of climatic variables on water resources. Similarly, both medium and long-term effects of climate change on streamflow can be significant if the forecast temperature and rainfall changes included in this study are met. Overall, the decrease in rainfall was accompanied by a large increase in the evapotranspiration. The combination of these two trends is likely to result in decreased availability of water for crops and natural vegetation. A moderate decrease in streamflow of 16% and 35% is expected for the periods 2031–2060 and 2069–2098, respectively.
In general, it may indicate that this study provides an example of the possible effects of climate change on water resources in the NW Spain, so it can be used as a starting point to improve the understanding of how climate change will impact water resources in this area and provide some data to decision makers. Hydrology and distribution of land uses in the Corbeira catchment are similar to those of the upper and middle Mero River Basin. Therefore, if climate change scenarios adopted in this work occur in the future, significant changes may also occur in the Mero River, affecting the Cecebre reservoir. With increasingly limited water resources and water consumption increasing annually, all the facts point to a situation of greater water unsustainability and therefore to greater environmental unsustainability. This implies that measures, able to solve this situation, should be taken in order to avoid the consequences of a decrease of water resources against an increased demand.

Acknowledgments

This investigation was carried out within the projects REN2003-08143, funded by the Spanish Ministry of Education and Science, and PGIDIT05RAG10303PR and 10MDS103031, financed by Xunta of Galicia. The second author was awarded a Postdoctoral research contract (Xunta of Galicia). We appreciate the detailed review and suggestions of two anonymous reviewers, which improved the manuscript.

Author Contributions

All authors contributed to the design and development of this manuscript under the supervision of M. Teresa Taboada Castro.

Conflicts of Interest

The authors declare no conflict of interest.

References

  1. Intergovernmental Panel on Climate Change (IPCC). Impacts, Adaptation, and Vulnerability; Part A: Global and Sectoral Aspects. Contribution of Working Group II to the Fifth Assessment Report of the Intergovernmental Panel on Climate Change; Field, C.B., Barros, V.R., Dokken, D.J., Mach, K.J., Mastrandrea, M.D., Bilir, T.E., Chatterjee, M., Ebi, K.L., Estrada, Y.O., et al., Eds.; Cambridge University Press: Cambridge, UK; New York, NY, USA, 2014. [Google Scholar]
  2. Van der Linden, P.; Mitchell, J.F.B. ENSEMBLES: Climate Change and its Impacts: Summary of Research and Results from the ENSEMBLES Project; Met Office Hadley Centre: Exeter, UK, 2009; p. 160. [Google Scholar]
  3. Houghton, J.T.; Ding, Y.; Griggs, D.J.; Noguer, M.; van der Linden, P.J.; Dai, X.; Maskell, K.; Johnson, C.A. Climate Change: The Scientific Basis. In Contribution of Working Group I to the Third Assessment Report of the Intergovernmental Panel on Climate Change; Cambridge University Press: Cambridge, United Kingdom and New York, NY, USA, 2001; p. 881. [Google Scholar]
  4. Lehner, B.; Doll, P.; Alcamo, J.; Henrichs, T.; Kaspar, F. Estimating the impact of global change on flood and drought risks in Europe: A continental integrated analysis. Clim. Chang. 2006, 75, 273–299. [Google Scholar]
  5. Kundzewics, Z.; Mata, L.; Arnell, N.; Döll, P.; Jimenez, B.; Miller, K.; Oki, T.; Sen, Z.; Shiklomanov, I. The implications of projected climate change for freshwater resources and their management. Hydrolog. Sci. J. 2008, 53, 3–10. [Google Scholar]
  6. Pruski, F.F.; Nearing, M.A. Climate-induced changes in erosion during the 21st century for eight U.S. locations. Water Resour. Res. 2002, 38, 34-1–34-12. [Google Scholar]
  7. Zabaleta, A.; Meaurio, M.; Ruiz, E.; Antigüedad, I. Simulation climate change impact on runoff and sediment yield in a small watershed in the Basque Country, northern Spain. J. Environ. Qual. 2013, 43, 235–245. [Google Scholar]
  8. Chaplot, V. Water and soil resources response to rising levels of atmospheric CO2 concentration and to changes in precipitation and air temperature. J. Hydrol. 2007, 337, 159–171. [Google Scholar]
  9. Butcher, J.P.; Johnson, T.E.; Nover, D.; Sarkar, S. Incorporating the effects of increased atmospheric CO2 in watershed model projections of climate change impacts. J. Hydrol. 2014, 513, 322–334. [Google Scholar]
  10. López-Moreno, J.I.; Goyette, S.; Beniston, M. Climate change prediction over complex areas: Spatial variability of uncertainties and expected changes over the Pyrenees from a set of regional climate models. Int. J. Climatol. 2008, 28, 1535–1550. [Google Scholar]
  11. Nunes, J.P.; Seixas, J.; Pacheco, N.R. Vulnerability of water resources, vegetation productivity and soil erosion to climate change in Mediterranean watersheds. Hydrol. Process. 2008, 22, 3115–3134. [Google Scholar]
  12. Estrela, T.; Pérez-Martin, M.A.; Vargas, E. Impacts of climate change on water resources in Spain. Hydrolog. Sci. J. 2012, 57, 1154–1167. [Google Scholar]
  13. Raposo, J.R.; Dafonte, J.; Molinero, J. Assessing the impact of future climate change on groundwater recharge in Galicia-Costa, Spain. Hydrogeol. J. 2013, 21, 459–479. [Google Scholar]
  14. García Ruiz, J.M.; López-Moreno, J.I.; Vicente-Serrano, S.M.; Lasanta-Martínez, T.; Beguería, S. Mediterranean water resources in a global change scenario. Earth Sci. Rev. 2011, 105, 121–139. [Google Scholar] [Green Version]
  15. Taboada, J.J. Riesgos asociados a fenómenos meteorológicos extremos. In Riesgos Naturales en Galicia. El Encuentro Entre Naturaleza y Sociedad; Fra-Paleo, U., Ed.; Universidad de Santiago de Compostela, Servicio de Publicaciones e Intercambio Científico: Santiago de Compostela, Spain, 2010; pp. 25–45. [Google Scholar]
  16. Gassman, P.W.; Reyes, M.R.; Green, C.H.; Arnold, J.G. The Soil and Water Assessment Tool: Historical development, applications, and future research directions. Trans. ASABE 2007, 50, 1211–1250. [Google Scholar]
  17. Wu, Y.; Liu, S.; Gallant, A.L. Predicting impacts of increased CO2 and climate change on the water cycle and water quality in the semiarid James River Basin of the Midwestern USA. Sci. Total Environ. 2012, 430, 150–160. [Google Scholar]
  18. Food and Agriculture Organization (FAO). World Reference Base for Soil Resources; World Soil Resources Reports 106; FAO: Rome, Italy, 2014. [Google Scholar]
  19. Instituto Tecnológico Geominero de España (IGME). Mapa Geológico de España, 1:50000. Hoja 45. Betanzos; Servicio de Publicaciones del Ministerio de Industria y Energía: Madrid, Spain, 1981. [Google Scholar]
  20. Arnold, J.G.; Srinivasan, R.; Muttiah, R.S.; Williams, J.R. Large area hydrologic modeling and assessment part I: Model development. J. Am. Water Res. Assoc. 1998, 34, 73–89. [Google Scholar]
  21. Neitsch, S.L.; Arnold, J.G.; Srinivasan, R.; Williams, J.R. Soil and Water Assessment Tool User´s Manual; Texas Water Resources Institute: Collegue Station, TX, USA, 2002; p. 506. [Google Scholar]
  22. Green, C.; van Griensven, A. Autocalibration in hydrologic modeling: Using SWAT 2005 in small-scale watersheds. Environ. Model. Softw. 2008, 23, 422–434. [Google Scholar]
  23. Easterling, W.E.; Rosenberg, N.J.; McKenney, M.S.; Jones, C.A.; Dyke, P.T.; Williams, J.R. Preparing the erosion productivity impact calculator (EPIC) model to simulate crop response to climate change and the direct effects of CO2. Agric. For. Meteorol. 1992, 59, 17–34. [Google Scholar]
  24. Stockle, C.O.; Williams, J.R.; Rosenberg, N.J.; Jones, C.A. A method for estimating the direct and climatic effects of rising atmospheric carbon dioxide on growth and yield of crops: Part 1—Modification of the EPIC model for climate change analysis. Agric. Syst. 1992, 38, 225–238. [Google Scholar]
  25. Martínez-Cortizas, A.; Castillo-Rodríguez, F.; Pérez-Alberti, A. Factores que intervienen en la precipitación y el balance de agua en Galicia. Bol. Asoc. Geógr. Esp. 1994, 18, 79–96. [Google Scholar]
  26. Taboada-Castro, M.M.; Lado-Liñares, M.; Diéguez, A.; Paz, A. Evolución temporal de la infiltración superficial a escala de parcela. In Avances Sobre el Estudio de la Erosión Hídrica; Paz, A., Taboada, M.T., Eds.; Universidade da Coruña: A Coruña, Spain, 1999; pp. 101–127. [Google Scholar]
  27. Saxton, K.E.; Rawls, W.J.; Romberger, J.S.; Papendick, R.L. Estimating generalized soil-water characteristics from texture. Soil Sci. Soc. Am. J. 1986, 50, 1031–1036. [Google Scholar]
  28. Ferrer Julià, M.; Estrela, M.T.; Sánchez, J.A.; García, M. Constructing a saturated hydraulic conductivity map of Spain using pedotransfer functions and spatial prediction. Geoderma 2004, 123, 257–277. [Google Scholar]
  29. Rodríguez-Suárez, J.A.; Soto, B.; Iglesias, M.L.; Díaz-Fierros, F. Application of the 3PG forest growth model to a Eucalyptus globulus plantation in Northwest Spain. Eur. J. For. Res. 2010, 129, 573–583. [Google Scholar]
  30. Arnold, J.G.; Allen, P.M.; Muttiah, R.; Bernhardt, G. Automated base flow separation and recession analysis techniques. Ground Water 1995, 33, 1010–1018. [Google Scholar]
  31. Motovilov, Y.; Gottschalk, G.L.; Engeland, K.; Rodhe, A. Validation of distributed hydrological model against spatial observations. Agri. For. Meteorol. 1999, 98, 257–277. [Google Scholar]
  32. Moriasi, D.N.; Arnold, J.G.; van Liew, M.W.; Bingner, R.L.; Harmel, R.D.; Veith, T.L. Model evaluation guidelines for systematic quantification of accuracy in watershed simulations. Transl. ASABE 2007, 50, 885–900. [Google Scholar]
  33. Rodríguez-Blanco, M.L.; Taboada-Castro, M.M.; Taboada-Castro, M.T. Rainfall runoff response and event-based runoff coefficients in a humid area (northwest Spain). Hydrolog. Sci. J. 2012, 57, 445–459. [Google Scholar]
  34. Palleiro, L.; Rodríguez-Blanco, M.L.; Taboada-Castro, M.M.; Taboada-Castro, M.T. Hydroclimatic response of a humid agroforestry catchment at different times scales. Hydrol. Process 2014, 28, 1677–1688. [Google Scholar]
  35. Benaman, J.; Shoemaker, C.A.; Haith, D.A. Calibration and validation of soil and water assessment tool on an agricultural watershed in upstate New York. J. Hydrol. 2005, 10, 363–374. [Google Scholar]
  36. Kirchner, J.W. Getting the right answers for the right reasons: Linking measurements, analyses, and models to advance the science of hydrology. Water Resour. Res. 2006, 42. [Google Scholar] [CrossRef]
  37. Zhang, X.; Xu, Y.P.; Fu, G. Uncertainties in SWAT extreme flow simulation under climate change. J. Hydrol. 2014, 515, 205–222. [Google Scholar]
  38. Winkler, J.A.; Guentchev, G.S.; Perdinan; Tan, P.N.; Zhong, S.; Liszewska, M.; Abraham, Z.; Niedzwiedz, T.; Ustrnul, Z. Climate scenario development and applications for local/regional climate change impact assessments: An overview for the non-climate scientist. Part I: Scenario development using downscaling methods. Geogr. Compass 2011, 5, 275–300. [Google Scholar]
  39. Fowler, H.J.S.; Blenkinsop, S.; Tebaldi, C. Linking climate change modelling to impacts studies: Recent advances in downscaling techniques for hydrological modelling. Int. J. Climatol. 2007, 27, 1547–1578. [Google Scholar]
  40. Sharpley, A.N.; Williams, J.R. EPIC-Erosion Productivity Impact Calculator, I. Model Documentation; U.S. Department of Agriculture, Agricultural Research Service: Washington, DC, USA, 1990; p. 235. [Google Scholar]
  41. Ficklin, D.L.; Luo, Y.; Luedeling, E.; Zhang, M. Climate change sensitivity assessment of a highly agricultural watershed using SWAT model. J. Hydrol. 2009, 374, 16–29. [Google Scholar]
  42. Zhang, H.; Huang, G.H.; Wang, D.; Zhang, X. Uncertainty assessment of climate change impacts on the hydrology of small prairie wetlands. J. Hydrol. 2011, 396, 94–103. [Google Scholar]
  43. Pruski, F.F.; Nearing, M.A. Runoff and soil-loss responses to changes in precipitation: A computer simulation study. J. Soil Water Conserv. 2002, 57, 7–16. [Google Scholar]
  44. Rosenzweig, C.; Hillel, D. Climate Change and the Global Harvest. Potential Impacts of the Greenhouse Effect on Agriculture; Oxford University Press: New York, NY, USA, 1998; p. 324. [Google Scholar]
  45. Katul, G.; Manzoni, S.; Palmroth, S.; Oren, R. A stomatal optimization theory to describe the effects of atmospheric CO2 on leaf photosynthesis and transpiration. Ann. Bot. 2009, 105, 431–442. [Google Scholar]
  46. Bunce, J.A. Carbon dioxide effects on stomatal responses to the environment and water use by crops under field conditions. Oecologia 2004, 140, 1–10. [Google Scholar]
  47. Beguería, S.; López-Moreno, J.I.; Lorente, A.; Seeger, M.; García-Ruiz, J.M. Assessing the effect of climate change and land-use changes on streamflow in the central Spanish Pyrenees. Ambio 2003, 32, 283–286. [Google Scholar]
  48. Hamilton, E.W.; Heckathorn, S.A.; Joshi, P.; Wang, D.; Barua, D. Interactive effects of elevated CO2 and growth temperature on the tolerance of photosynthesis to acute heat stress in C3 and C4 species. J. Integr. Plant Biol. 2008, 50, 1375–1387. [Google Scholar]

